Zip Codes with the Highest Percentage of Population Employed in Accommodation & Food Services in Galveston, TX
RELATED REPORTS & OPTIONS
Accommodation & Food Services
Galveston
Compare Zip Codes
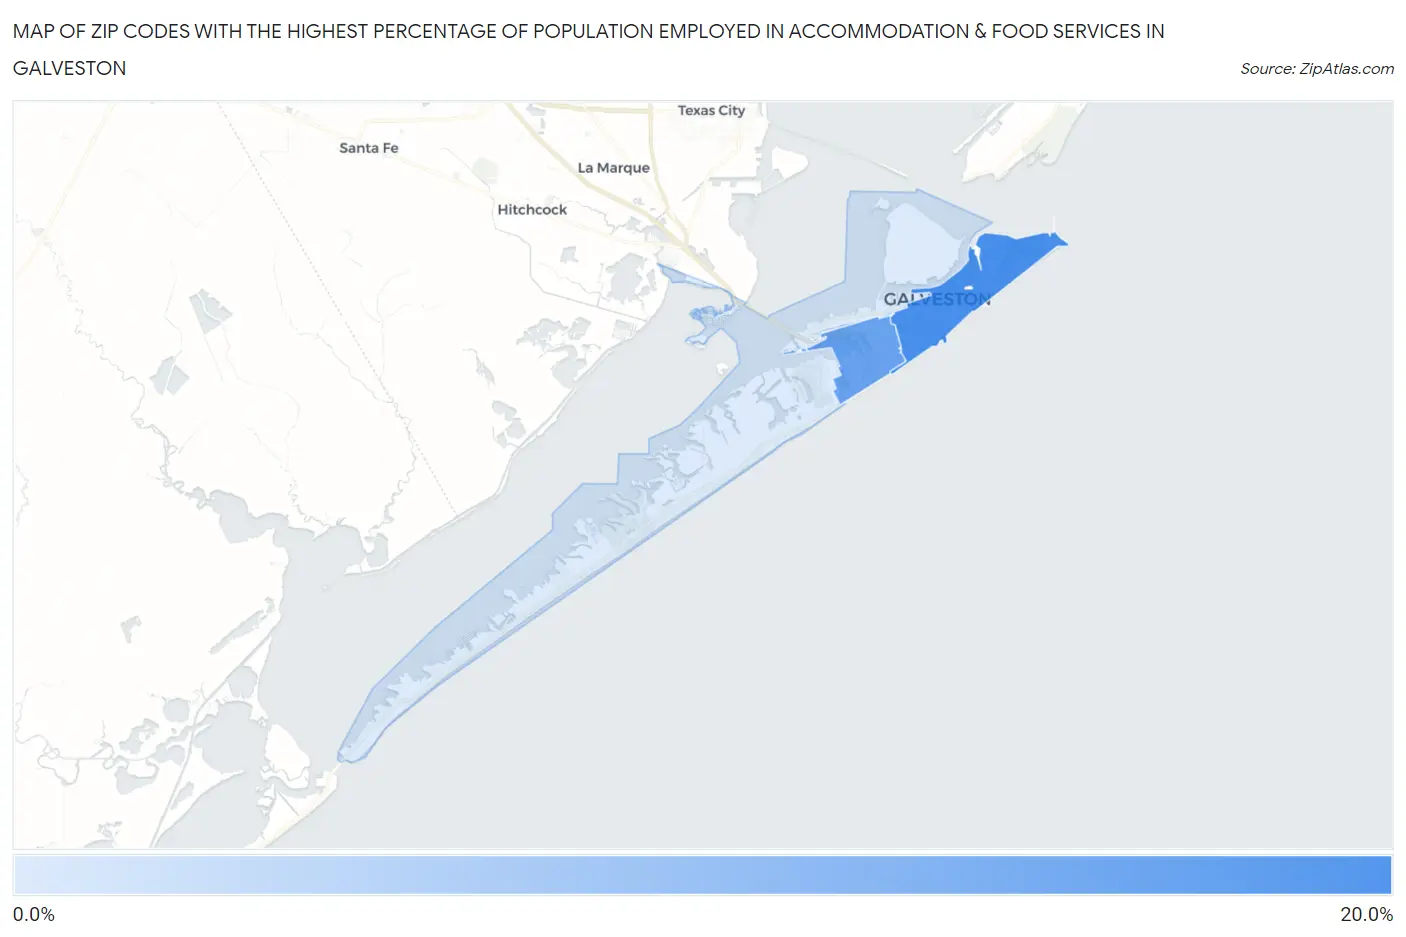
Map of Zip Codes with the Highest Percentage of Population Employed in Accommodation & Food Services in Galveston
7.0%
16.8%
Zip Codes with the Highest Percentage of Population Employed in Accommodation & Food Services in Galveston, TX
| Zip Code | % Employed | vs State | vs National | |
| 1. | 77550 | 16.8% | 7.2%(+9.56)#68 | 6.9%(+9.89)#1,298 |
| 2. | 77551 | 14.5% | 7.2%(+7.33)#93 | 6.9%(+7.66)#1,810 |
| 3. | 77554 | 7.0% | 7.2%(-0.213)#721 | 6.9%(+0.112)#10,334 |
1
Common Questions
What are the Top Zip Codes with the Highest Percentage of Population Employed in Accommodation & Food Services in Galveston, TX?
Top Zip Codes with the Highest Percentage of Population Employed in Accommodation & Food Services in Galveston, TX are:
What zip code has the Highest Percentage of Population Employed in Accommodation & Food Services in Galveston, TX?
77550 has the Highest Percentage of Population Employed in Accommodation & Food Services in Galveston, TX with 16.8%.
What is the Percentage of Population Employed in Accommodation & Food Services in Galveston, TX?
Percentage of Population Employed in Accommodation & Food Services in Galveston is 14.4%.
What is the Percentage of Population Employed in Accommodation & Food Services in Texas?
Percentage of Population Employed in Accommodation & Food Services in Texas is 7.2%.
What is the Percentage of Population Employed in Accommodation & Food Services in the United States?
Percentage of Population Employed in Accommodation & Food Services in the United States is 6.9%.