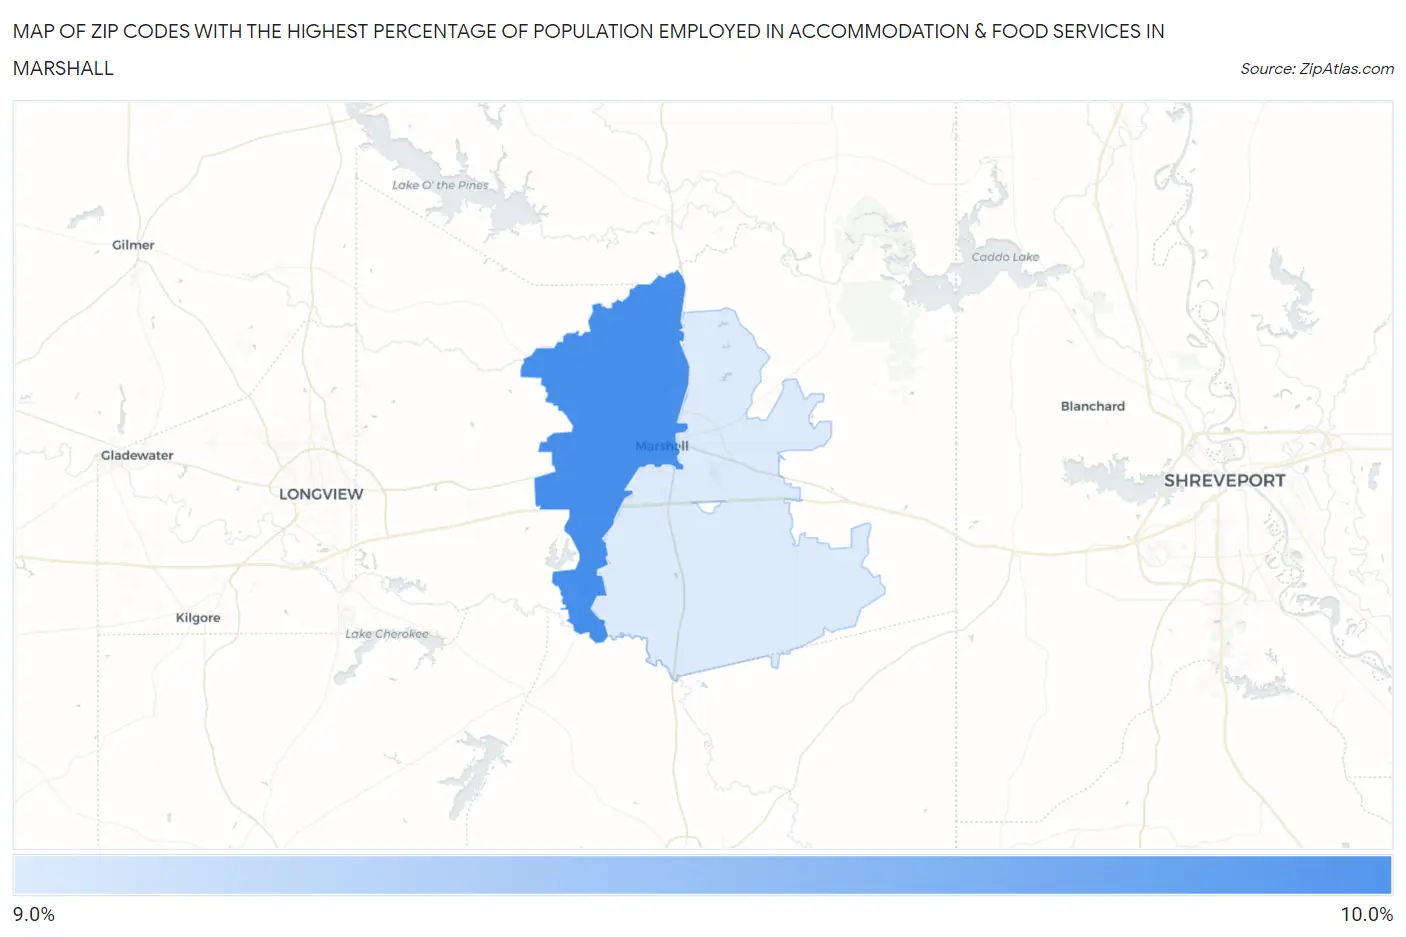
Zip Codes with the Highest Percentage of Population Employed in Accommodation & Food Services in Marshall, TX
RELATED REPORTS & OPTIONS
Accommodation & Food Services
Marshall
Compare Zip Codes
Map of Zip Codes with the Highest Percentage of Population Employed in Accommodation & Food Services in Marshall
9.1%
9.9%
Zip Codes with the Highest Percentage of Population Employed in Accommodation & Food Services in Marshall, TX
| Zip Code | % Employed | vs State | vs National | |
| 1. | 75670 | 9.9% | 7.2%(+2.68)#295 | 6.9%(+3.01)#4,679 |
| 2. | 75672 | 9.1% | 7.2%(+1.90)#386 | 6.9%(+2.23)#5,795 |
1
Common Questions
What are the Top Zip Codes with the Highest Percentage of Population Employed in Accommodation & Food Services in Marshall, TX?
Top Zip Codes with the Highest Percentage of Population Employed in Accommodation & Food Services in Marshall, TX are:
What zip code has the Highest Percentage of Population Employed in Accommodation & Food Services in Marshall, TX?
75670 has the Highest Percentage of Population Employed in Accommodation & Food Services in Marshall, TX with 9.9%.
What is the Percentage of Population Employed in Accommodation & Food Services in Marshall, TX?
Percentage of Population Employed in Accommodation & Food Services in Marshall is 8.9%.
What is the Percentage of Population Employed in Accommodation & Food Services in Texas?
Percentage of Population Employed in Accommodation & Food Services in Texas is 7.2%.
What is the Percentage of Population Employed in Accommodation & Food Services in the United States?
Percentage of Population Employed in Accommodation & Food Services in the United States is 6.9%.