Zip Codes with the Highest Percentage of Population Employed in Accommodation & Food Services in New Hampshire
RELATED REPORTS & OPTIONS
Accommodation & Food Services
New Hampshire
Compare Zip Codes
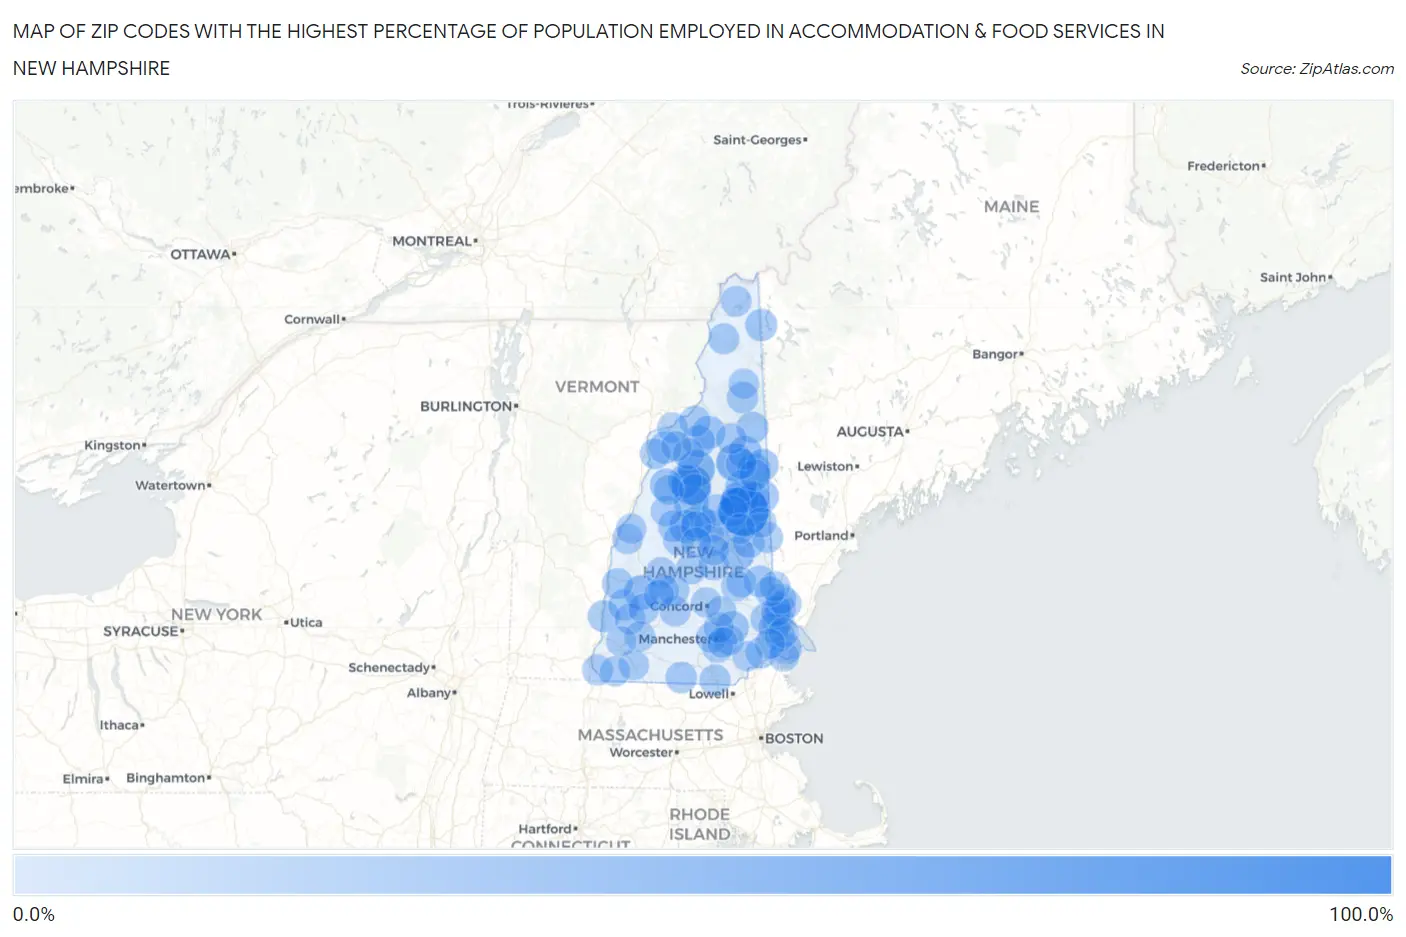
Map of Zip Codes with the Highest Percentage of Population Employed in Accommodation & Food Services in New Hampshire
0.0%
100.0%
Zip Codes with the Highest Percentage of Population Employed in Accommodation & Food Services in New Hampshire
| Zip Code | % Employed | vs State | vs National | |
| 1. | 03890 | 85.7% | 6.3%(+79.4)#1 | 6.9%(+78.8)#25 |
| 2. | 03293 | 43.8% | 6.3%(+37.4)#2 | 6.9%(+36.9)#139 |
| 3. | 03812 | 36.1% | 6.3%(+29.8)#3 | 6.9%(+29.2)#207 |
| 4. | 03817 | 34.8% | 6.3%(+28.5)#4 | 6.9%(+27.9)#226 |
| 5. | 03251 | 34.5% | 6.3%(+28.2)#5 | 6.9%(+27.6)#234 |
| 6. | 03752 | 24.2% | 6.3%(+17.9)#6 | 6.9%(+17.4)#546 |
| 7. | 03223 | 22.4% | 6.3%(+16.1)#7 | 6.9%(+15.5)#652 |
| 8. | 03810 | 20.9% | 6.3%(+14.6)#8 | 6.9%(+14.0)#751 |
| 9. | 03245 | 19.8% | 6.3%(+13.5)#9 | 6.9%(+12.9)#849 |
| 10. | 03262 | 19.6% | 6.3%(+13.3)#10 | 6.9%(+12.7)#875 |
| 11. | 03847 | 19.2% | 6.3%(+12.9)#11 | 6.9%(+12.3)#925 |
| 12. | 03264 | 19.1% | 6.3%(+12.8)#12 | 6.9%(+12.2)#940 |
| 13. | 03846 | 18.6% | 6.3%(+12.3)#13 | 6.9%(+11.7)#1,001 |
| 14. | 03595 | 18.0% | 6.3%(+11.7)#14 | 6.9%(+11.1)#1,101 |
| 15. | 03832 | 16.6% | 6.3%(+10.3)#15 | 6.9%(+9.68)#1,339 |
| 16. | 03034 | 16.4% | 6.3%(+10.1)#16 | 6.9%(+9.49)#1,370 |
| 17. | 03238 | 15.6% | 6.3%(+9.32)#17 | 6.9%(+8.74)#1,532 |
| 18. | 03585 | 15.4% | 6.3%(+9.06)#18 | 6.9%(+8.48)#1,592 |
| 19. | 03574 | 15.1% | 6.3%(+8.82)#19 | 6.9%(+8.25)#1,639 |
| 20. | 03813 | 15.0% | 6.3%(+8.66)#20 | 6.9%(+8.08)#1,677 |
| 21. | 03849 | 13.7% | 6.3%(+7.37)#21 | 6.9%(+6.79)#2,065 |
| 22. | 03285 | 13.5% | 6.3%(+7.15)#22 | 6.9%(+6.57)#2,156 |
| 23. | 03579 | 13.4% | 6.3%(+7.12)#23 | 6.9%(+6.54)#2,170 |
| 24. | 03226 | 13.3% | 6.3%(+7.05)#24 | 6.9%(+6.47)#2,200 |
| 25. | 03609 | 13.2% | 6.3%(+6.85)#25 | 6.9%(+6.28)#2,284 |
| 26. | 03824 | 13.1% | 6.3%(+6.81)#26 | 6.9%(+6.23)#2,303 |
| 27. | 03581 | 12.8% | 6.3%(+6.51)#27 | 6.9%(+5.94)#2,428 |
| 28. | 03818 | 12.2% | 6.3%(+5.85)#28 | 6.9%(+5.27)#2,748 |
| 29. | 03253 | 11.8% | 6.3%(+5.45)#29 | 6.9%(+4.87)#2,992 |
| 30. | 03241 | 11.6% | 6.3%(+5.33)#30 | 6.9%(+4.75)#3,071 |
| 31. | 03835 | 11.5% | 6.3%(+5.21)#31 | 6.9%(+4.63)#3,150 |
| 32. | 03860 | 11.2% | 6.3%(+4.94)#32 | 6.9%(+4.37)#3,364 |
| 33. | 03227 | 11.0% | 6.3%(+4.74)#33 | 6.9%(+4.16)#3,521 |
| 34. | 03861 | 11.0% | 6.3%(+4.70)#34 | 6.9%(+4.12)#3,552 |
| 35. | 03894 | 10.9% | 6.3%(+4.62)#35 | 6.9%(+4.04)#3,616 |
| 36. | 03048 | 10.7% | 6.3%(+4.44)#36 | 6.9%(+3.86)#3,762 |
| 37. | 03570 | 10.3% | 6.3%(+4.04)#37 | 6.9%(+3.46)#4,158 |
| 38. | 03607 | 10.2% | 6.3%(+3.92)#38 | 6.9%(+3.35)#4,273 |
| 39. | 03883 | 10.2% | 6.3%(+3.86)#39 | 6.9%(+3.28)#4,345 |
| 40. | 03842 | 10.1% | 6.3%(+3.84)#40 | 6.9%(+3.26)#4,365 |
| 41. | 03060 | 10.1% | 6.3%(+3.82)#41 | 6.9%(+3.24)#4,383 |
| 42. | 03222 | 10.0% | 6.3%(+3.72)#42 | 6.9%(+3.14)#4,505 |
| 43. | 03598 | 9.9% | 6.3%(+3.64)#43 | 6.9%(+3.06)#4,620 |
| 44. | 03580 | 9.8% | 6.3%(+3.51)#44 | 6.9%(+2.94)#4,769 |
| 45. | 03278 | 9.7% | 6.3%(+3.40)#45 | 6.9%(+2.82)#4,922 |
| 46. | 03830 | 9.7% | 6.3%(+3.39)#46 | 6.9%(+2.81)#4,939 |
| 47. | 03820 | 9.5% | 6.3%(+3.24)#47 | 6.9%(+2.66)#5,156 |
| 48. | 03743 | 9.5% | 6.3%(+3.23)#48 | 6.9%(+2.65)#5,171 |
| 49. | 03848 | 9.5% | 6.3%(+3.17)#49 | 6.9%(+2.60)#5,245 |
| 50. | 03235 | 9.3% | 6.3%(+3.00)#50 | 6.9%(+2.42)#5,492 |
| 51. | 03576 | 9.3% | 6.3%(+2.98)#51 | 6.9%(+2.41)#5,523 |
| 52. | 03220 | 9.2% | 6.3%(+2.93)#52 | 6.9%(+2.35)#5,607 |
| 53. | 03857 | 9.1% | 6.3%(+2.76)#53 | 6.9%(+2.19)#5,860 |
| 54. | 03217 | 9.0% | 6.3%(+2.74)#54 | 6.9%(+2.16)#5,888 |
| 55. | 03456 | 8.8% | 6.3%(+2.46)#55 | 6.9%(+1.89)#6,351 |
| 56. | 03838 | 8.7% | 6.3%(+2.44)#56 | 6.9%(+1.86)#6,402 |
| 57. | 03266 | 8.5% | 6.3%(+2.20)#57 | 6.9%(+1.63)#6,815 |
| 58. | 03561 | 8.5% | 6.3%(+2.18)#58 | 6.9%(+1.60)#6,846 |
| 59. | 03242 | 8.4% | 6.3%(+2.05)#59 | 6.9%(+1.48)#7,084 |
| 60. | 03233 | 8.3% | 6.3%(+1.98)#60 | 6.9%(+1.40)#7,260 |
| 61. | 03280 | 8.2% | 6.3%(+1.91)#61 | 6.9%(+1.33)#7,394 |
| 62. | 03592 | 8.2% | 6.3%(+1.85)#62 | 6.9%(+1.27)#7,524 |
| 63. | 03103 | 8.1% | 6.3%(+1.79)#63 | 6.9%(+1.21)#7,639 |
| 64. | 03246 | 8.1% | 6.3%(+1.76)#64 | 6.9%(+1.18)#7,709 |
| 65. | 03032 | 8.0% | 6.3%(+1.74)#65 | 6.9%(+1.16)#7,745 |
| 66. | 03102 | 8.0% | 6.3%(+1.73)#66 | 6.9%(+1.15)#7,755 |
| 67. | 03740 | 7.9% | 6.3%(+1.58)#67 | 6.9%(+0.998)#8,078 |
| 68. | 03766 | 7.7% | 6.3%(+1.42)#68 | 6.9%(+0.843)#8,435 |
| 69. | 03451 | 7.6% | 6.3%(+1.33)#69 | 6.9%(+0.757)#8,661 |
| 70. | 03106 | 7.5% | 6.3%(+1.23)#70 | 6.9%(+0.654)#8,905 |
| 71. | 03593 | 7.4% | 6.3%(+1.09)#71 | 6.9%(+0.510)#9,279 |
| 72. | 03885 | 7.4% | 6.3%(+1.08)#72 | 6.9%(+0.505)#9,287 |
| 73. | 03273 | 7.3% | 6.3%(+1.01)#73 | 6.9%(+0.436)#9,466 |
| 74. | 03869 | 7.3% | 6.3%(+0.998)#74 | 6.9%(+0.420)#9,514 |
| 75. | 03465 | 7.3% | 6.3%(+0.957)#75 | 6.9%(+0.379)#9,650 |
| 76. | 03823 | 7.2% | 6.3%(+0.927)#76 | 6.9%(+0.349)#9,723 |
| 77. | 03886 | 7.2% | 6.3%(+0.888)#77 | 6.9%(+0.310)#9,829 |
| 78. | 03588 | 7.2% | 6.3%(+0.883)#78 | 6.9%(+0.305)#9,846 |
| 79. | 03109 | 7.2% | 6.3%(+0.870)#79 | 6.9%(+0.292)#9,873 |
| 80. | 03218 | 7.0% | 6.3%(+0.723)#80 | 6.9%(+0.145)#10,237 |
| 81. | 03275 | 7.0% | 6.3%(+0.689)#81 | 6.9%(+0.111)#10,340 |
| 82. | 03221 | 7.0% | 6.3%(+0.668)#82 | 6.9%(+0.090)#10,405 |
| 83. | 03470 | 6.9% | 6.3%(+0.565)#83 | 6.9%(-0.013)#10,668 |
| 84. | 03874 | 6.8% | 6.3%(+0.540)#84 | 6.9%(-0.038)#10,744 |
| 85. | 03256 | 6.7% | 6.3%(+0.391)#85 | 6.9%(-0.187)#11,217 |
| 86. | 03457 | 6.7% | 6.3%(+0.381)#86 | 6.9%(-0.197)#11,245 |
| 87. | 03225 | 6.7% | 6.3%(+0.364)#87 | 6.9%(-0.214)#11,294 |
| 88. | 03878 | 6.6% | 6.3%(+0.339)#88 | 6.9%(-0.239)#11,386 |
| 89. | 03868 | 6.6% | 6.3%(+0.286)#89 | 6.9%(-0.292)#11,558 |
| 90. | 03431 | 6.6% | 6.3%(+0.272)#90 | 6.9%(-0.306)#11,594 |
| 91. | 03882 | 6.6% | 6.3%(+0.269)#91 | 6.9%(-0.309)#11,608 |
| 92. | 03750 | 6.5% | 6.3%(+0.237)#92 | 6.9%(-0.341)#11,711 |
| 93. | 03840 | 6.5% | 6.3%(+0.227)#93 | 6.9%(-0.351)#11,742 |
| 94. | 03833 | 6.5% | 6.3%(+0.209)#94 | 6.9%(-0.369)#11,813 |
| 95. | 03867 | 6.5% | 6.3%(+0.207)#95 | 6.9%(-0.371)#11,820 |
| 96. | 03841 | 6.5% | 6.3%(+0.199)#96 | 6.9%(-0.379)#11,849 |
| 97. | 03586 | 6.5% | 6.3%(+0.199)#97 | 6.9%(-0.379)#11,852 |
| 98. | 03816 | 6.4% | 6.3%(+0.083)#98 | 6.9%(-0.495)#12,203 |
| 99. | 03279 | 6.4% | 6.3%(+0.075)#99 | 6.9%(-0.503)#12,234 |
| 100. | 03301 | 6.3% | 6.3%(+0.027)#100 | 6.9%(-0.551)#12,380 |
Common Questions
What are the Top 10 Zip Codes with the Highest Percentage of Population Employed in Accommodation & Food Services in New Hampshire?
Top 10 Zip Codes with the Highest Percentage of Population Employed in Accommodation & Food Services in New Hampshire are:
What zip code has the Highest Percentage of Population Employed in Accommodation & Food Services in New Hampshire?
03890 has the Highest Percentage of Population Employed in Accommodation & Food Services in New Hampshire with 85.7%.
What is the Percentage of Population Employed in Accommodation & Food Services in the State of New Hampshire?
Percentage of Population Employed in Accommodation & Food Services in New Hampshire is 6.3%.
What is the Percentage of Population Employed in Accommodation & Food Services in the United States?
Percentage of Population Employed in Accommodation & Food Services in the United States is 6.9%.