Zip Codes with the Highest Percentage of Population Employed in Accommodation & Food Services in Keller, TX
RELATED REPORTS & OPTIONS
Accommodation & Food Services
Keller
Compare Zip Codes
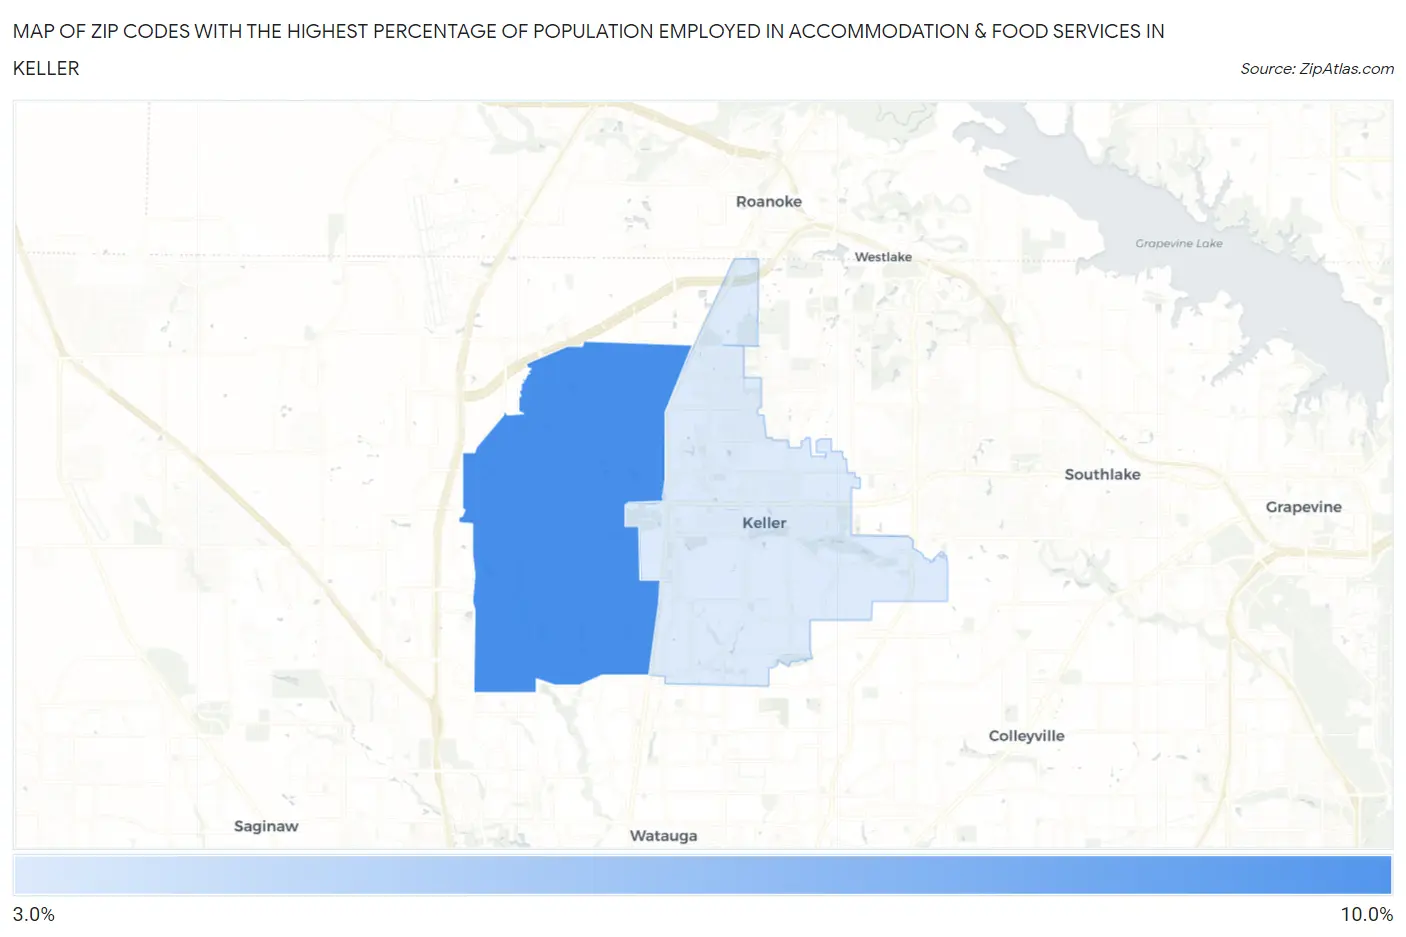
Map of Zip Codes with the Highest Percentage of Population Employed in Accommodation & Food Services in Keller
3.5%
8.3%
Zip Codes with the Highest Percentage of Population Employed in Accommodation & Food Services in Keller, TX
| Zip Code | % Employed | vs State | vs National | |
| 1. | 76244 | 8.3% | 7.2%(+1.14)#497 | 6.9%(+1.46)#7,109 |
| 2. | 76248 | 3.5% | 7.2%(-3.70)#1,354 | 6.9%(-3.37)#21,735 |
1
Common Questions
What are the Top Zip Codes with the Highest Percentage of Population Employed in Accommodation & Food Services in Keller, TX?
Top Zip Codes with the Highest Percentage of Population Employed in Accommodation & Food Services in Keller, TX are:
What zip code has the Highest Percentage of Population Employed in Accommodation & Food Services in Keller, TX?
76244 has the Highest Percentage of Population Employed in Accommodation & Food Services in Keller, TX with 8.3%.
What is the Percentage of Population Employed in Accommodation & Food Services in Keller, TX?
Percentage of Population Employed in Accommodation & Food Services in Keller is 3.8%.
What is the Percentage of Population Employed in Accommodation & Food Services in Texas?
Percentage of Population Employed in Accommodation & Food Services in Texas is 7.2%.
What is the Percentage of Population Employed in Accommodation & Food Services in the United States?
Percentage of Population Employed in Accommodation & Food Services in the United States is 6.9%.