Zip Codes with the Highest Percentage of Population Employed in Accommodation & Food Services in Leander, TX
RELATED REPORTS & OPTIONS
Accommodation & Food Services
Leander
Compare Zip Codes
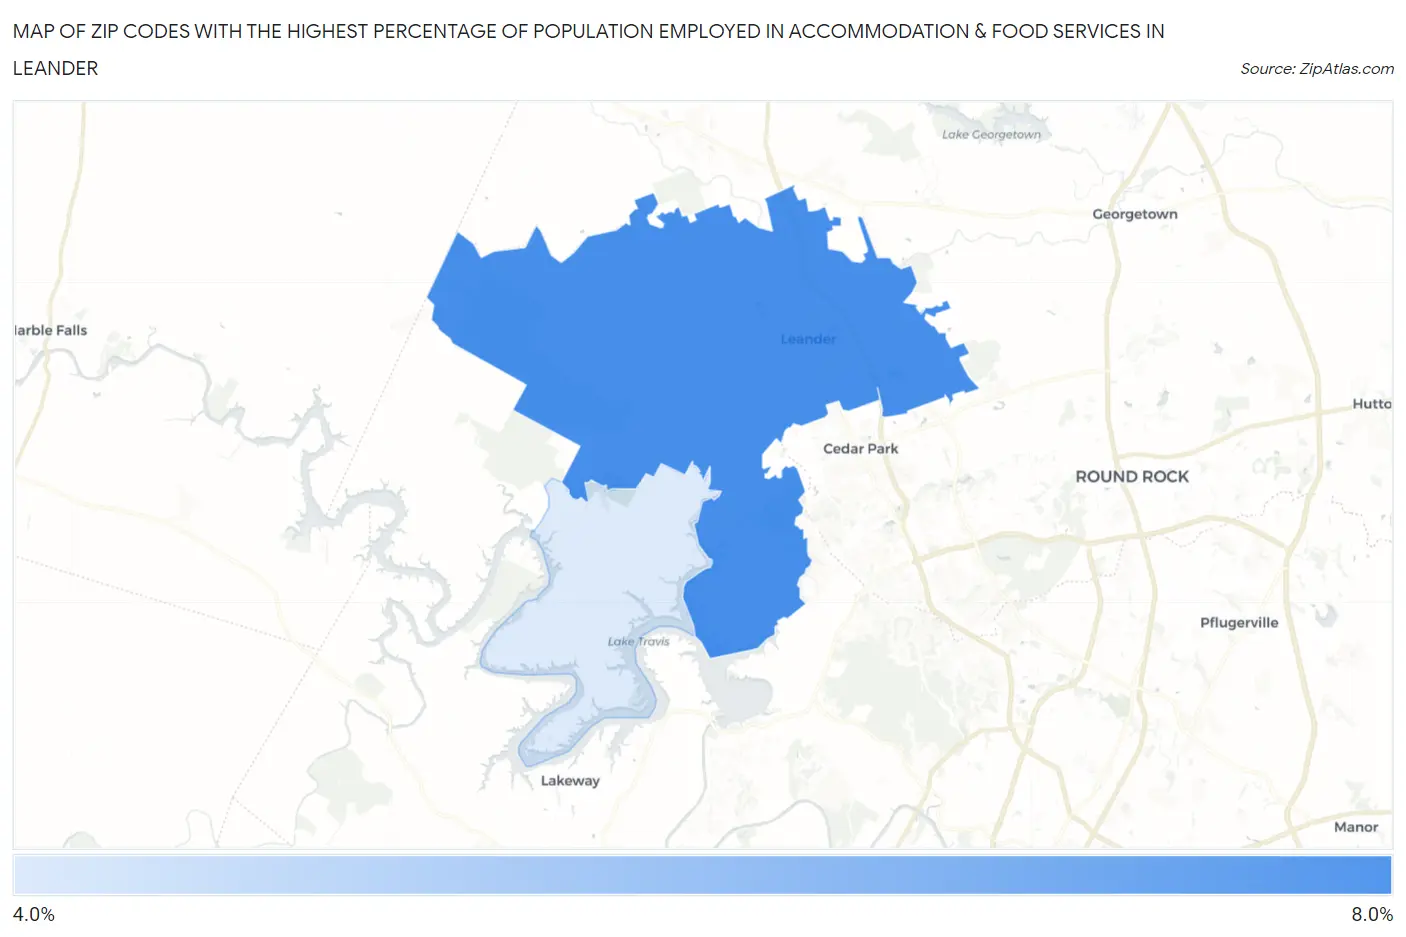
Map of Zip Codes with the Highest Percentage of Population Employed in Accommodation & Food Services in Leander
4.9%
6.8%
Zip Codes with the Highest Percentage of Population Employed in Accommodation & Food Services in Leander, TX
| Zip Code | % Employed | vs State | vs National | |
| 1. | 78641 | 6.8% | 7.2%(-0.439)#769 | 6.9%(-0.114)#10,991 |
| 2. | 78645 | 4.9% | 7.2%(-2.27)#1,105 | 6.9%(-1.95)#17,044 |
1
Common Questions
What are the Top Zip Codes with the Highest Percentage of Population Employed in Accommodation & Food Services in Leander, TX?
Top Zip Codes with the Highest Percentage of Population Employed in Accommodation & Food Services in Leander, TX are:
What zip code has the Highest Percentage of Population Employed in Accommodation & Food Services in Leander, TX?
78641 has the Highest Percentage of Population Employed in Accommodation & Food Services in Leander, TX with 6.8%.
What is the Percentage of Population Employed in Accommodation & Food Services in Leander, TX?
Percentage of Population Employed in Accommodation & Food Services in Leander is 6.2%.
What is the Percentage of Population Employed in Accommodation & Food Services in Texas?
Percentage of Population Employed in Accommodation & Food Services in Texas is 7.2%.
What is the Percentage of Population Employed in Accommodation & Food Services in the United States?
Percentage of Population Employed in Accommodation & Food Services in the United States is 6.9%.