Zip Codes with the Highest Percentage of Population Employed in Accommodation & Food Services in Waco, TX
RELATED REPORTS & OPTIONS
Accommodation & Food Services
Waco
Compare Zip Codes
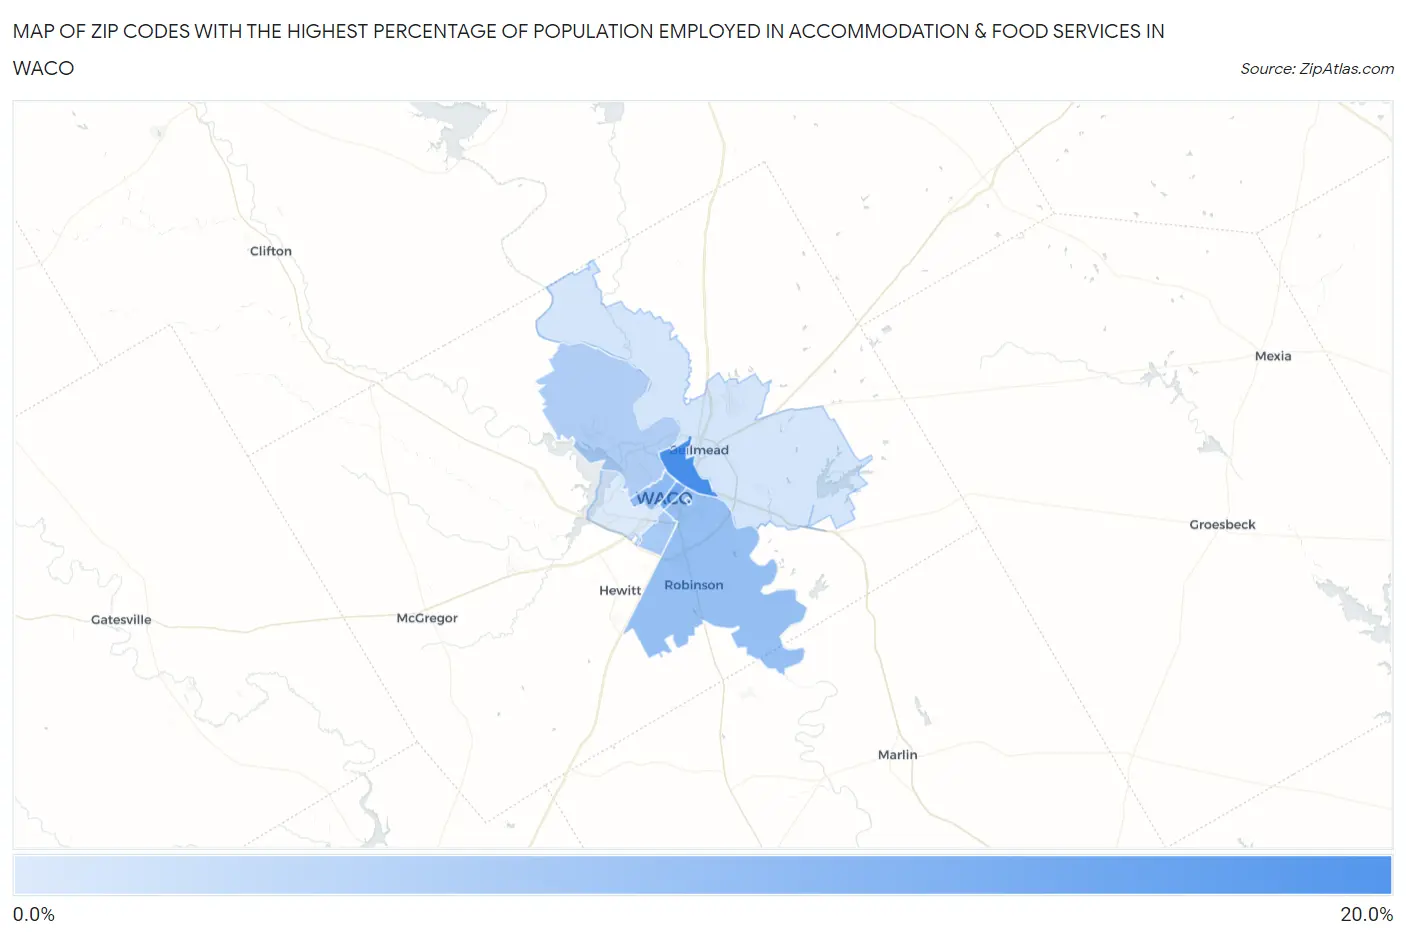
Map of Zip Codes with the Highest Percentage of Population Employed in Accommodation & Food Services in Waco
6.8%
19.2%
Zip Codes with the Highest Percentage of Population Employed in Accommodation & Food Services in Waco, TX
| Zip Code | % Employed | vs State | vs National | |
| 1. | 76704 | 19.2% | 7.2%(+12.0)#46 | 6.9%(+12.3)#923 |
| 2. | 76701 | 15.7% | 7.2%(+8.48)#77 | 6.9%(+8.80)#1,520 |
| 3. | 76798 | 13.4% | 7.2%(+6.16)#117 | 6.9%(+6.48)#2,194 |
| 4. | 76707 | 13.0% | 7.2%(+5.83)#130 | 6.9%(+6.16)#2,332 |
| 5. | 76706 | 12.5% | 7.2%(+5.34)#146 | 6.9%(+5.66)#2,564 |
| 6. | 76711 | 11.1% | 7.2%(+3.93)#205 | 6.9%(+4.26)#3,442 |
| 7. | 76708 | 10.4% | 7.2%(+3.23)#247 | 6.9%(+3.55)#4,068 |
| 8. | 76705 | 7.6% | 7.2%(+0.394)#620 | 6.9%(+0.719)#8,747 |
| 9. | 76710 | 6.8% | 7.2%(-0.380)#757 | 6.9%(-0.055)#10,813 |
1
Common Questions
What are the Top 5 Zip Codes with the Highest Percentage of Population Employed in Accommodation & Food Services in Waco, TX?
Top 5 Zip Codes with the Highest Percentage of Population Employed in Accommodation & Food Services in Waco, TX are:
What zip code has the Highest Percentage of Population Employed in Accommodation & Food Services in Waco, TX?
76704 has the Highest Percentage of Population Employed in Accommodation & Food Services in Waco, TX with 19.2%.
What is the Percentage of Population Employed in Accommodation & Food Services in Waco, TX?
Percentage of Population Employed in Accommodation & Food Services in Waco is 10.7%.
What is the Percentage of Population Employed in Accommodation & Food Services in Texas?
Percentage of Population Employed in Accommodation & Food Services in Texas is 7.2%.
What is the Percentage of Population Employed in Accommodation & Food Services in the United States?
Percentage of Population Employed in Accommodation & Food Services in the United States is 6.9%.