Zip Codes with the Highest Percentage of Population Employed in Accommodation & Food Services in Mabank, TX
RELATED REPORTS & OPTIONS
Accommodation & Food Services
Mabank
Compare Zip Codes
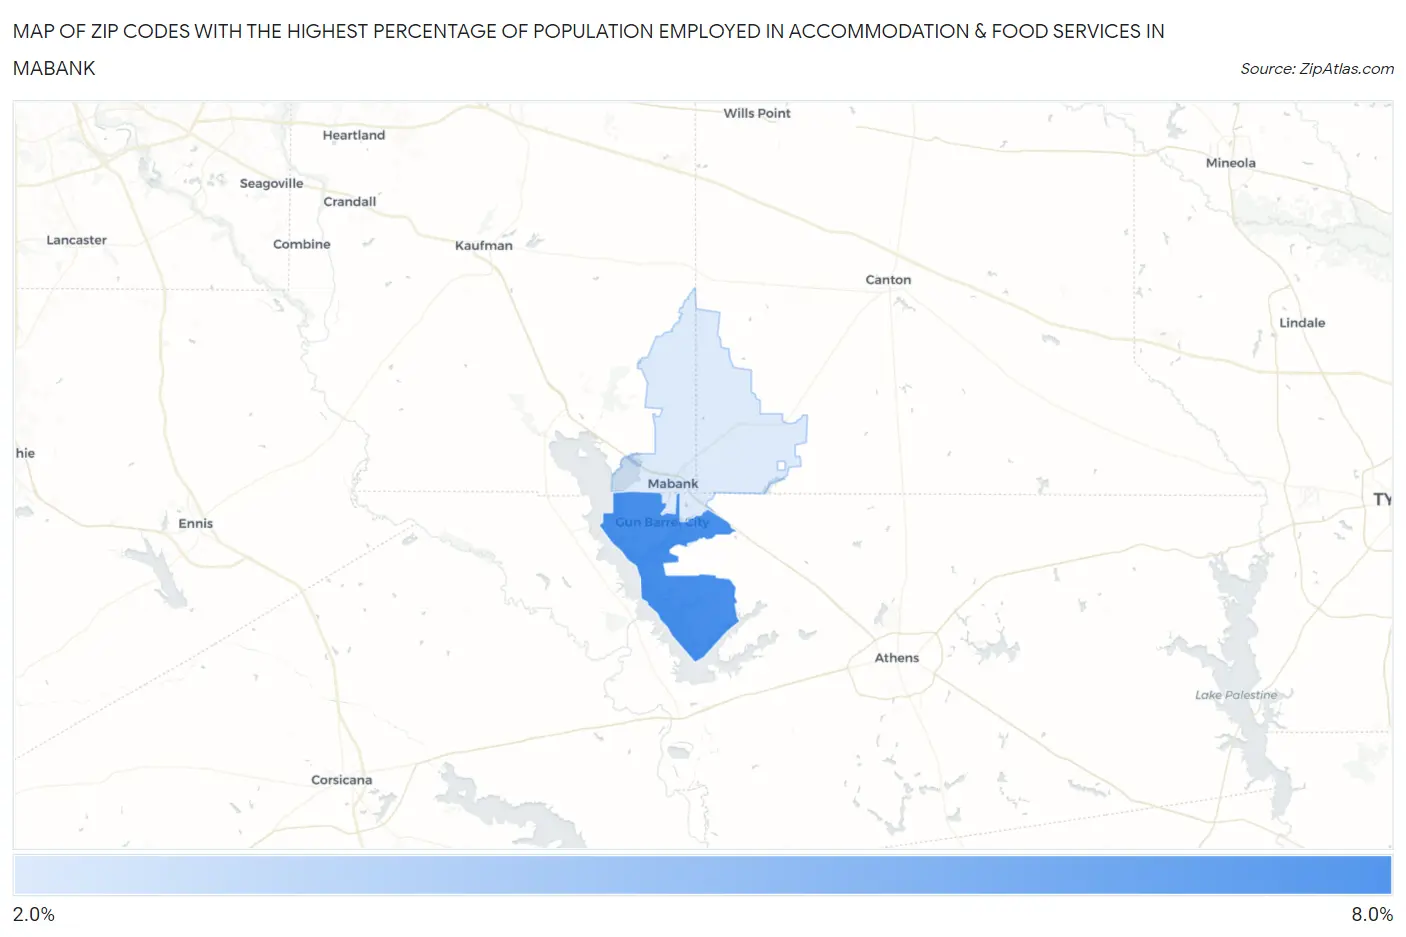
Map of Zip Codes with the Highest Percentage of Population Employed in Accommodation & Food Services in Mabank
2.2%
6.3%
Zip Codes with the Highest Percentage of Population Employed in Accommodation & Food Services in Mabank, TX
| Zip Code | % Employed | vs State | vs National | |
| 1. | 75156 | 6.3% | 7.2%(-0.936)#870 | 6.9%(-0.611)#12,577 |
| 2. | 75147 | 2.2% | 7.2%(-4.96)#1,503 | 6.9%(-4.64)#25,055 |
1
Common Questions
What are the Top Zip Codes with the Highest Percentage of Population Employed in Accommodation & Food Services in Mabank, TX?
Top Zip Codes with the Highest Percentage of Population Employed in Accommodation & Food Services in Mabank, TX are:
What zip code has the Highest Percentage of Population Employed in Accommodation & Food Services in Mabank, TX?
75156 has the Highest Percentage of Population Employed in Accommodation & Food Services in Mabank, TX with 6.3%.
What is the Percentage of Population Employed in Accommodation & Food Services in Mabank, TX?
Percentage of Population Employed in Accommodation & Food Services in Mabank is 4.2%.
What is the Percentage of Population Employed in Accommodation & Food Services in Texas?
Percentage of Population Employed in Accommodation & Food Services in Texas is 7.2%.
What is the Percentage of Population Employed in Accommodation & Food Services in the United States?
Percentage of Population Employed in Accommodation & Food Services in the United States is 6.9%.