Zip Codes with the Highest Percentage of Population Employed in Accommodation & Food Services in Stephenville, TX
RELATED REPORTS & OPTIONS
Accommodation & Food Services
Stephenville
Compare Zip Codes
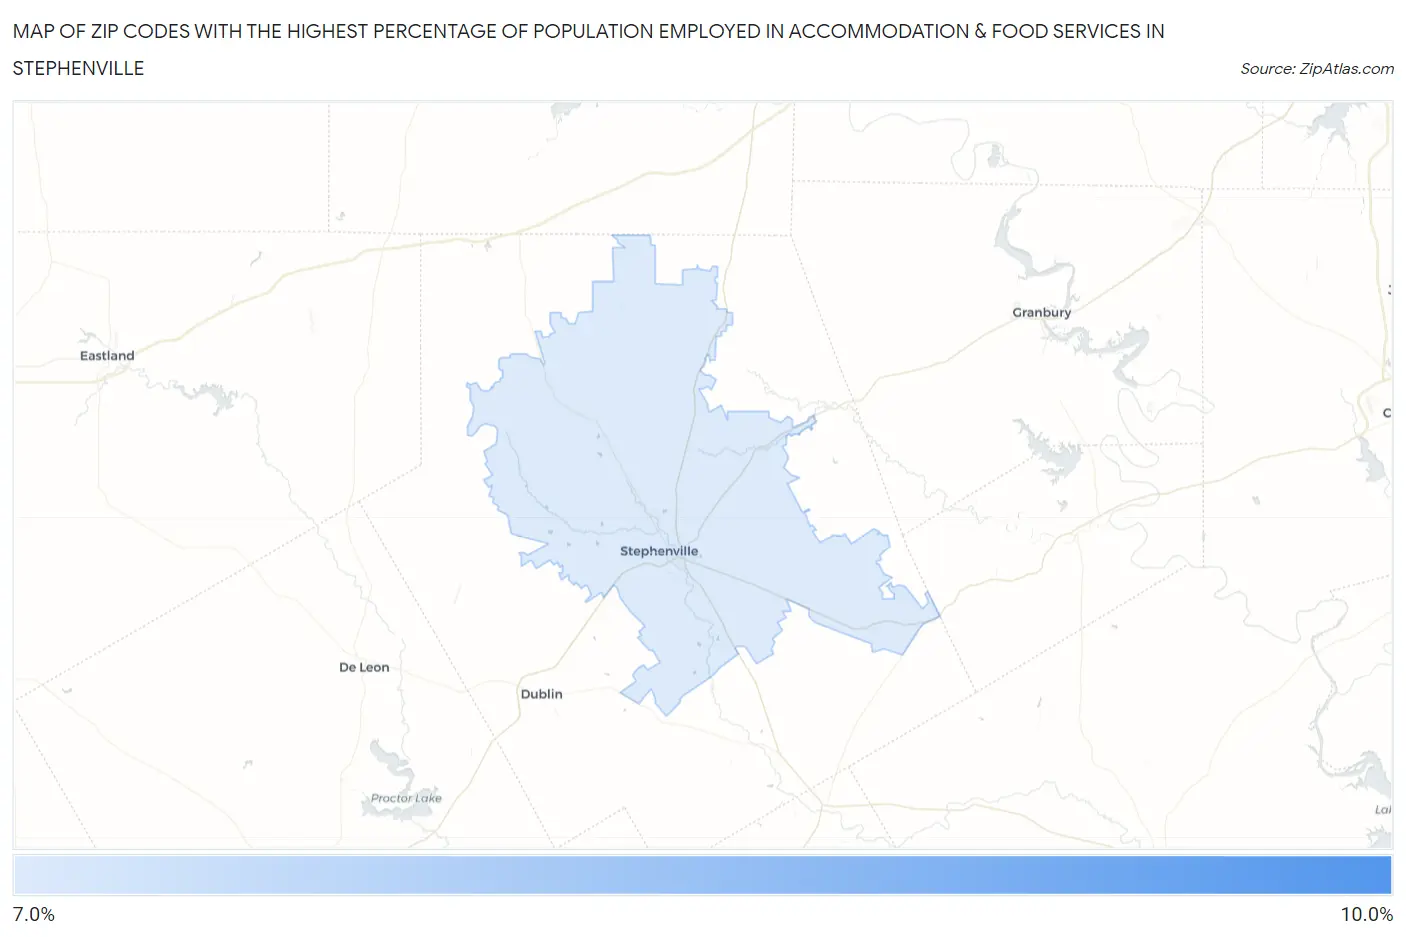
Map of Zip Codes with the Highest Percentage of Population Employed in Accommodation & Food Services in Stephenville
7.6%
9.8%
Zip Codes with the Highest Percentage of Population Employed in Accommodation & Food Services in Stephenville, TX
| Zip Code | % Employed | vs State | vs National | |
| 1. | 76402 | 9.8% | 7.2%(+2.55)#307 | 6.9%(+2.88)#4,847 |
| 2. | 76401 | 7.6% | 7.2%(+0.351)#627 | 6.9%(+0.675)#8,843 |
1
Common Questions
What are the Top Zip Codes with the Highest Percentage of Population Employed in Accommodation & Food Services in Stephenville, TX?
Top Zip Codes with the Highest Percentage of Population Employed in Accommodation & Food Services in Stephenville, TX are:
What zip code has the Highest Percentage of Population Employed in Accommodation & Food Services in Stephenville, TX?
76402 has the Highest Percentage of Population Employed in Accommodation & Food Services in Stephenville, TX with 9.8%.
What is the Percentage of Population Employed in Accommodation & Food Services in Stephenville, TX?
Percentage of Population Employed in Accommodation & Food Services in Stephenville is 9.7%.
What is the Percentage of Population Employed in Accommodation & Food Services in Texas?
Percentage of Population Employed in Accommodation & Food Services in Texas is 7.2%.
What is the Percentage of Population Employed in Accommodation & Food Services in the United States?
Percentage of Population Employed in Accommodation & Food Services in the United States is 6.9%.