Zip Codes with the Highest Percentage of Population Employed in Accommodation & Food Services in Athens, TX
RELATED REPORTS & OPTIONS
Accommodation & Food Services
Athens
Compare Zip Codes
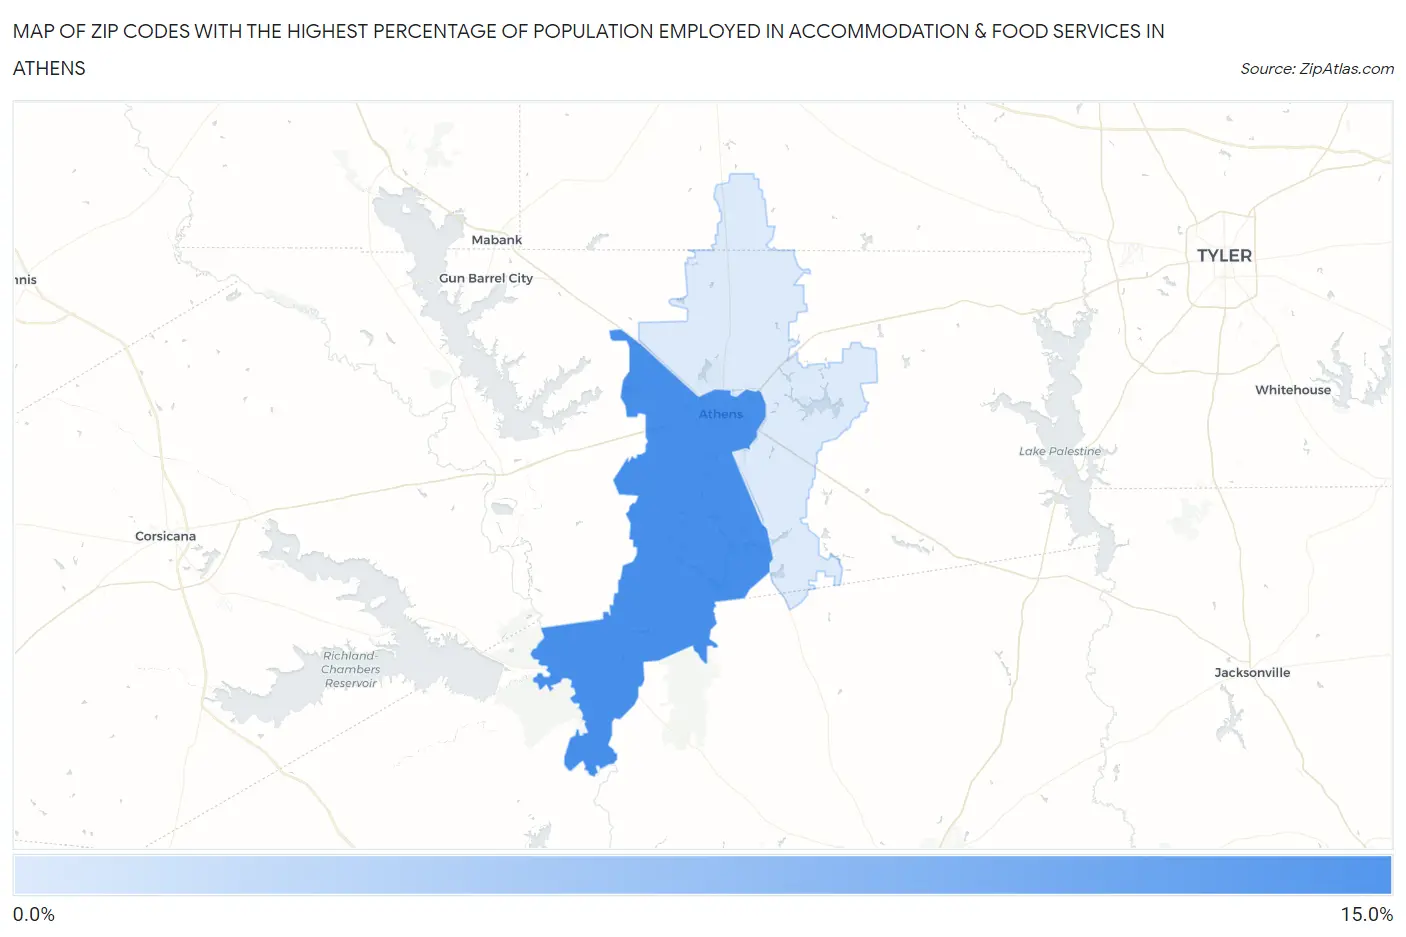
Map of Zip Codes with the Highest Percentage of Population Employed in Accommodation & Food Services in Athens
2.4%
13.3%
Zip Codes with the Highest Percentage of Population Employed in Accommodation & Food Services in Athens, TX
| Zip Code | % Employed | vs State | vs National | |
| 1. | 75751 | 13.3% | 7.2%(+6.10)#122 | 6.9%(+6.42)#2,223 |
| 2. | 75752 | 2.4% | 7.2%(-4.82)#1,493 | 6.9%(-4.49)#24,740 |
1
Common Questions
What are the Top Zip Codes with the Highest Percentage of Population Employed in Accommodation & Food Services in Athens, TX?
Top Zip Codes with the Highest Percentage of Population Employed in Accommodation & Food Services in Athens, TX are:
What zip code has the Highest Percentage of Population Employed in Accommodation & Food Services in Athens, TX?
75751 has the Highest Percentage of Population Employed in Accommodation & Food Services in Athens, TX with 13.3%.
What is the Percentage of Population Employed in Accommodation & Food Services in Athens, TX?
Percentage of Population Employed in Accommodation & Food Services in Athens is 15.1%.
What is the Percentage of Population Employed in Accommodation & Food Services in Texas?
Percentage of Population Employed in Accommodation & Food Services in Texas is 7.2%.
What is the Percentage of Population Employed in Accommodation & Food Services in the United States?
Percentage of Population Employed in Accommodation & Food Services in the United States is 6.9%.