Zip Codes with the Highest Percentage of Population Employed in Accommodation & Food Services in Wyoming
RELATED REPORTS & OPTIONS
Accommodation & Food Services
Wyoming
Compare Zip Codes
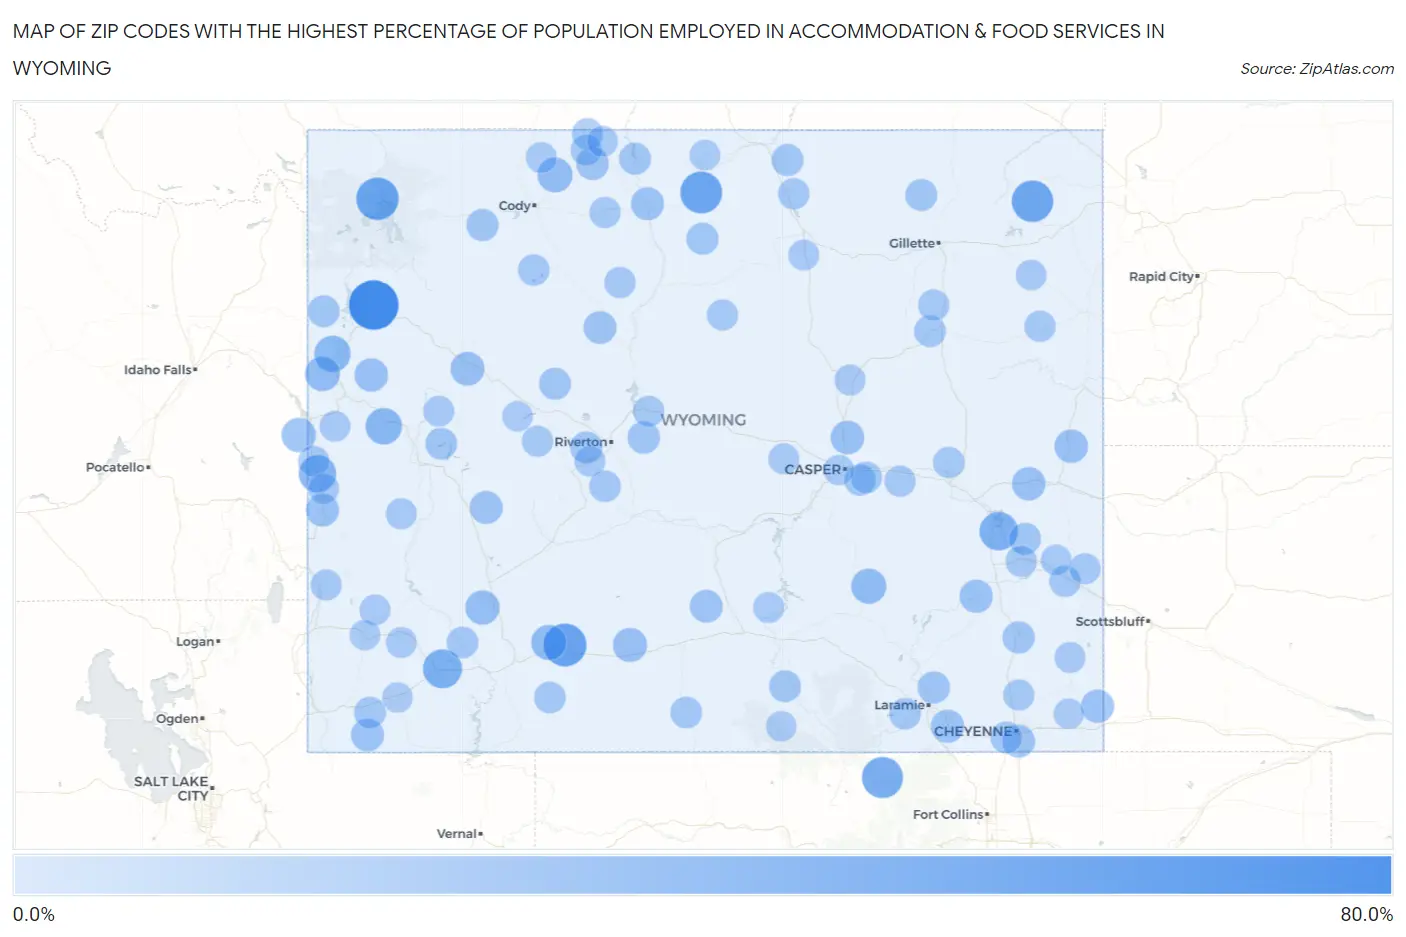
Map of Zip Codes with the Highest Percentage of Population Employed in Accommodation & Food Services in Wyoming
0.0%
80.0%
Zip Codes with the Highest Percentage of Population Employed in Accommodation & Food Services in Wyoming
| Zip Code | % Employed | vs State | vs National | |
| 1. | 83013 | 71.3% | 7.8%(+63.5)#1 | 6.9%(+64.4)#37 |
| 2. | 82942 | 47.1% | 7.8%(+39.2)#2 | 6.9%(+40.2)#114 |
| 3. | 82190 | 45.3% | 7.8%(+37.4)#3 | 6.9%(+38.4)#123 |
| 4. | 82441 | 43.3% | 7.8%(+35.5)#4 | 6.9%(+36.4)#140 |
| 5. | 82714 | 42.1% | 7.8%(+34.3)#5 | 6.9%(+35.2)#151 |
| 6. | 82063 | 40.0% | 7.8%(+32.2)#6 | 6.9%(+33.1)#164 |
| 7. | 82929 | 33.3% | 7.8%(+25.5)#7 | 6.9%(+26.5)#260 |
| 8. | 82213 | 31.1% | 7.8%(+23.3)#8 | 6.9%(+24.2)#297 |
| 9. | 83122 | 27.1% | 7.8%(+19.3)#9 | 6.9%(+20.2)#418 |
| 10. | 82922 | 23.9% | 7.8%(+16.1)#10 | 6.9%(+17.0)#563 |
| 11. | 83025 | 23.0% | 7.8%(+15.2)#11 | 6.9%(+16.1)#617 |
| 12. | 82329 | 19.4% | 7.8%(+11.5)#12 | 6.9%(+12.5)#900 |
| 13. | 82945 | 19.2% | 7.8%(+11.4)#13 | 6.9%(+12.3)#919 |
| 14. | 82440 | 18.4% | 7.8%(+10.5)#14 | 6.9%(+11.5)#1,036 |
| 15. | 83014 | 18.3% | 7.8%(+10.5)#15 | 6.9%(+11.4)#1,045 |
| 16. | 82932 | 16.4% | 7.8%(+8.53)#16 | 6.9%(+9.47)#1,377 |
| 17. | 83120 | 16.1% | 7.8%(+8.24)#17 | 6.9%(+9.19)#1,441 |
| 18. | 82336 | 15.4% | 7.8%(+7.61)#18 | 6.9%(+8.55)#1,568 |
| 19. | 82513 | 14.4% | 7.8%(+6.62)#19 | 6.9%(+7.57)#1,830 |
| 20. | 82601 | 13.7% | 7.8%(+5.90)#20 | 6.9%(+6.85)#2,041 |
| 21. | 82225 | 13.3% | 7.8%(+5.48)#21 | 6.9%(+6.42)#2,222 |
| 22. | 83001 | 13.3% | 7.8%(+5.44)#22 | 6.9%(+6.39)#2,239 |
| 23. | 82227 | 13.1% | 7.8%(+5.29)#23 | 6.9%(+6.23)#2,300 |
| 24. | 82073 | 12.8% | 7.8%(+4.99)#24 | 6.9%(+5.94)#2,425 |
| 25. | 82201 | 12.7% | 7.8%(+4.84)#25 | 6.9%(+5.79)#2,492 |
| 26. | 82082 | 12.6% | 7.8%(+4.78)#26 | 6.9%(+5.72)#2,530 |
| 27. | 82426 | 11.8% | 7.8%(+3.99)#27 | 6.9%(+4.94)#2,940 |
| 28. | 82930 | 11.7% | 7.8%(+3.91)#28 | 6.9%(+4.85)#3,000 |
| 29. | 83126 | 11.6% | 7.8%(+3.76)#29 | 6.9%(+4.71)#3,099 |
| 30. | 82923 | 11.5% | 7.8%(+3.67)#30 | 6.9%(+4.61)#3,161 |
| 31. | 82443 | 11.1% | 7.8%(+3.32)#31 | 6.9%(+4.27)#3,432 |
| 32. | 82301 | 11.0% | 7.8%(+3.21)#32 | 6.9%(+4.16)#3,516 |
| 33. | 82007 | 10.8% | 7.8%(+3.00)#33 | 6.9%(+3.95)#3,700 |
| 34. | 82412 | 10.7% | 7.8%(+2.92)#34 | 6.9%(+3.86)#3,763 |
| 35. | 82501 | 9.9% | 7.8%(+2.11)#35 | 6.9%(+3.05)#4,631 |
| 36. | 82072 | 9.3% | 7.8%(+1.45)#36 | 6.9%(+2.40)#5,530 |
| 37. | 82510 | 9.0% | 7.8%(+1.17)#37 | 6.9%(+2.11)#5,967 |
| 38. | 82210 | 9.0% | 7.8%(+1.16)#38 | 6.9%(+2.11)#5,975 |
| 39. | 82428 | 8.7% | 7.8%(+0.869)#39 | 6.9%(+1.81)#6,480 |
| 40. | 82414 | 8.6% | 7.8%(+0.733)#40 | 6.9%(+1.68)#6,713 |
| 41. | 82431 | 8.5% | 7.8%(+0.670)#41 | 6.9%(+1.62)#6,827 |
| 42. | 82801 | 8.2% | 7.8%(+0.368)#42 | 6.9%(+1.31)#7,421 |
| 43. | 82716 | 8.2% | 7.8%(+0.360)#43 | 6.9%(+1.31)#7,443 |
| 44. | 82523 | 8.1% | 7.8%(+0.300)#44 | 6.9%(+1.25)#7,583 |
| 45. | 82215 | 7.8% | 7.8%(-0.001)#45 | 6.9%(+0.945)#8,198 |
| 46. | 83414 | 7.7% | 7.8%(-0.113)#46 | 6.9%(+0.833)#8,459 |
| 47. | 82331 | 7.5% | 7.8%(-0.278)#47 | 6.9%(+0.668)#8,866 |
| 48. | 82941 | 7.5% | 7.8%(-0.293)#48 | 6.9%(+0.652)#8,909 |
| 49. | 82933 | 7.3% | 7.8%(-0.528)#49 | 6.9%(+0.418)#9,526 |
| 50. | 82321 | 7.3% | 7.8%(-0.549)#50 | 6.9%(+0.397)#9,597 |
| 51. | 82732 | 7.1% | 7.8%(-0.728)#51 | 6.9%(+0.217)#10,054 |
| 52. | 82935 | 7.0% | 7.8%(-0.823)#52 | 6.9%(+0.123)#10,286 |
| 53. | 82609 | 6.9% | 7.8%(-0.952)#53 | 6.9%(-0.006)#10,648 |
| 54. | 82001 | 6.7% | 7.8%(-1.08)#54 | 6.9%(-0.138)#11,065 |
| 55. | 82901 | 6.7% | 7.8%(-1.12)#55 | 6.9%(-0.173)#11,187 |
| 56. | 82070 | 6.7% | 7.8%(-1.17)#56 | 6.9%(-0.227)#11,342 |
| 57. | 82636 | 6.6% | 7.8%(-1.20)#57 | 6.9%(-0.257)#11,436 |
| 58. | 82520 | 6.6% | 7.8%(-1.27)#58 | 6.9%(-0.324)#11,657 |
| 59. | 82433 | 6.3% | 7.8%(-1.49)#59 | 6.9%(-0.540)#12,348 |
| 60. | 82832 | 6.1% | 7.8%(-1.74)#60 | 6.9%(-0.799)#13,196 |
| 61. | 82223 | 6.1% | 7.8%(-1.77)#61 | 6.9%(-0.820)#13,267 |
| 62. | 82633 | 5.9% | 7.8%(-1.95)#62 | 6.9%(-1.00)#13,854 |
| 63. | 82411 | 5.6% | 7.8%(-2.25)#63 | 6.9%(-1.31)#14,792 |
| 64. | 82214 | 5.6% | 7.8%(-2.26)#64 | 6.9%(-1.31)#14,812 |
| 65. | 82718 | 5.5% | 7.8%(-2.29)#65 | 6.9%(-1.34)#14,921 |
| 66. | 82401 | 5.5% | 7.8%(-2.31)#66 | 6.9%(-1.36)#14,973 |
| 67. | 82701 | 5.5% | 7.8%(-2.36)#67 | 6.9%(-1.41)#15,142 |
| 68. | 82637 | 5.4% | 7.8%(-2.43)#68 | 6.9%(-1.48)#15,415 |
| 69. | 82240 | 5.4% | 7.8%(-2.45)#69 | 6.9%(-1.51)#15,490 |
| 70. | 82009 | 5.3% | 7.8%(-2.48)#70 | 6.9%(-1.54)#15,613 |
| 71. | 82514 | 5.3% | 7.8%(-2.56)#71 | 6.9%(-1.62)#15,901 |
| 72. | 82423 | 5.1% | 7.8%(-2.70)#72 | 6.9%(-1.75)#16,367 |
| 73. | 83127 | 5.1% | 7.8%(-2.71)#73 | 6.9%(-1.77)#16,409 |
| 74. | 82421 | 5.1% | 7.8%(-2.74)#74 | 6.9%(-1.80)#16,518 |
| 75. | 82649 | 5.0% | 7.8%(-2.80)#75 | 6.9%(-1.85)#16,726 |
| 76. | 82442 | 4.9% | 7.8%(-2.88)#76 | 6.9%(-1.94)#17,007 |
| 77. | 83114 | 4.8% | 7.8%(-3.06)#77 | 6.9%(-2.12)#17,603 |
| 78. | 83113 | 4.7% | 7.8%(-3.17)#78 | 6.9%(-2.23)#17,967 |
| 79. | 82334 | 4.6% | 7.8%(-3.20)#79 | 6.9%(-2.25)#18,063 |
| 80. | 83124 | 4.6% | 7.8%(-3.23)#80 | 6.9%(-2.28)#18,168 |
| 81. | 82604 | 4.6% | 7.8%(-3.23)#81 | 6.9%(-2.28)#18,172 |
| 82. | 82435 | 4.5% | 7.8%(-3.28)#82 | 6.9%(-2.34)#18,354 |
| 83. | 83101 | 4.4% | 7.8%(-3.44)#83 | 6.9%(-2.49)#18,851 |
| 84. | 82643 | 4.3% | 7.8%(-3.52)#84 | 6.9%(-2.57)#19,154 |
| 85. | 82221 | 4.3% | 7.8%(-3.53)#85 | 6.9%(-2.58)#19,201 |
| 86. | 83128 | 4.2% | 7.8%(-3.60)#86 | 6.9%(-2.65)#19,410 |
| 87. | 82834 | 4.2% | 7.8%(-3.67)#87 | 6.9%(-2.73)#19,644 |
| 88. | 82925 | 3.9% | 7.8%(-3.89)#88 | 6.9%(-2.94)#20,349 |
| 89. | 82515 | 3.8% | 7.8%(-4.03)#89 | 6.9%(-3.08)#20,803 |
| 90. | 82212 | 3.7% | 7.8%(-4.14)#90 | 6.9%(-3.19)#21,167 |
| 91. | 83110 | 3.7% | 7.8%(-4.16)#91 | 6.9%(-3.21)#21,222 |
| 92. | 82420 | 3.6% | 7.8%(-4.22)#92 | 6.9%(-3.27)#21,442 |
| 93. | 82730 | 3.4% | 7.8%(-4.42)#93 | 6.9%(-3.47)#22,075 |
| 94. | 82512 | 3.2% | 7.8%(-4.58)#94 | 6.9%(-3.63)#22,569 |
| 95. | 82836 | 3.2% | 7.8%(-4.63)#95 | 6.9%(-3.68)#22,705 |
| 96. | 83116 | 3.1% | 7.8%(-4.70)#96 | 6.9%(-3.76)#22,889 |
| 97. | 82053 | 2.9% | 7.8%(-4.92)#97 | 6.9%(-3.97)#23,477 |
| 98. | 82937 | 2.7% | 7.8%(-5.15)#98 | 6.9%(-4.20)#24,055 |
| 99. | 82325 | 2.6% | 7.8%(-5.18)#99 | 6.9%(-4.23)#24,128 |
| 100. | 82644 | 2.6% | 7.8%(-5.25)#100 | 6.9%(-4.31)#24,306 |
1
2Common Questions
What are the Top 10 Zip Codes with the Highest Percentage of Population Employed in Accommodation & Food Services in Wyoming?
Top 10 Zip Codes with the Highest Percentage of Population Employed in Accommodation & Food Services in Wyoming are:
What zip code has the Highest Percentage of Population Employed in Accommodation & Food Services in Wyoming?
83013 has the Highest Percentage of Population Employed in Accommodation & Food Services in Wyoming with 71.3%.
What is the Percentage of Population Employed in Accommodation & Food Services in the State of Wyoming?
Percentage of Population Employed in Accommodation & Food Services in Wyoming is 7.8%.
What is the Percentage of Population Employed in Accommodation & Food Services in the United States?
Percentage of Population Employed in Accommodation & Food Services in the United States is 6.9%.