Zip Codes with the Highest Percentage of Population Employed in Accommodation & Food Services in Idaho
RELATED REPORTS & OPTIONS
Accommodation & Food Services
Idaho
Compare Zip Codes
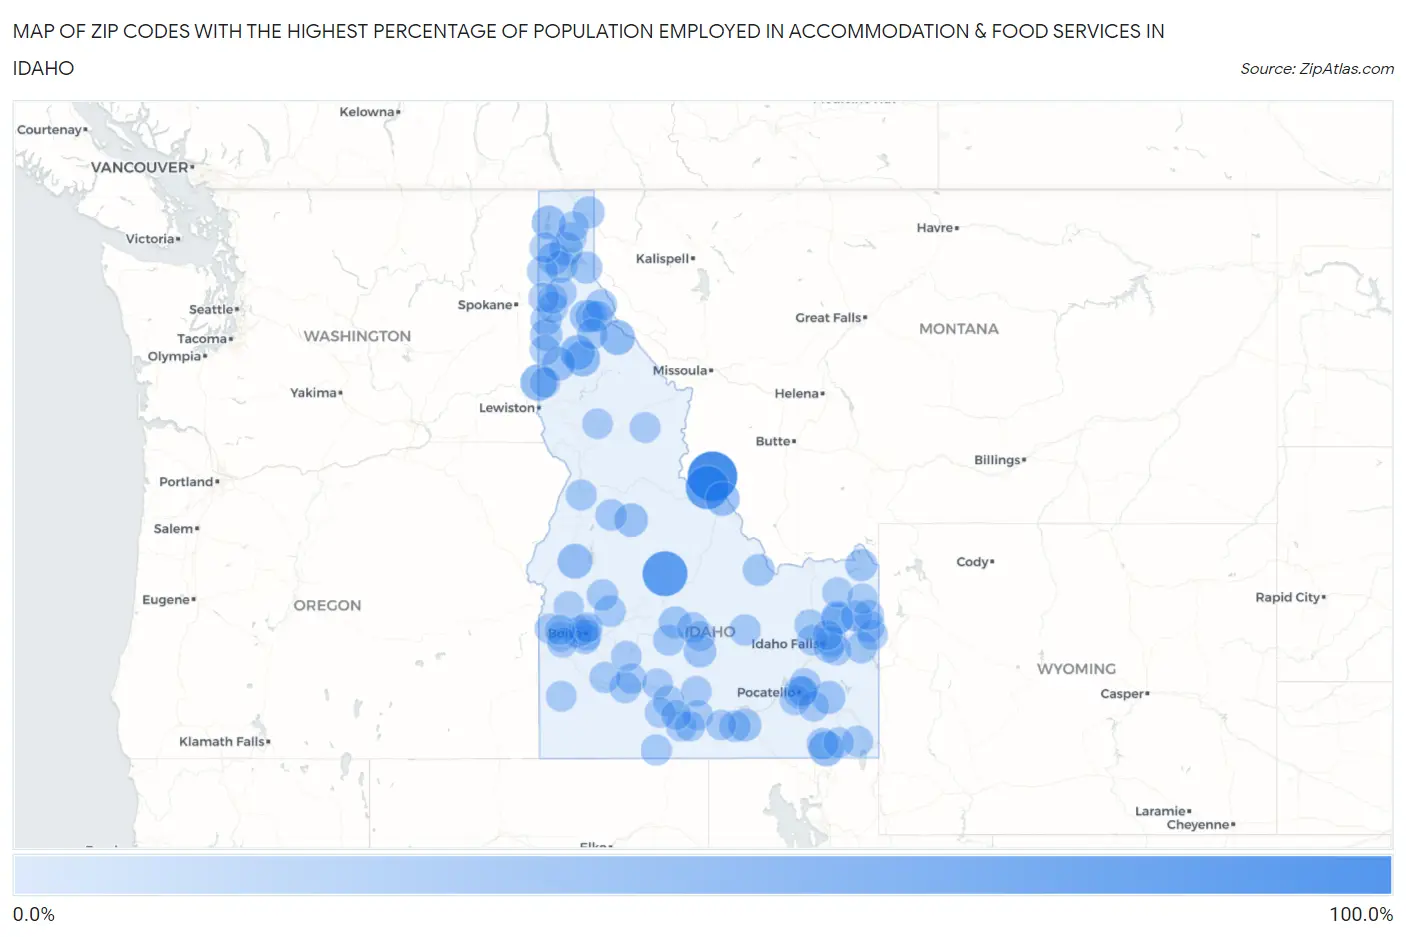
Map of Zip Codes with the Highest Percentage of Population Employed in Accommodation & Food Services in Idaho
0.0%
100.0%
Zip Codes with the Highest Percentage of Population Employed in Accommodation & Food Services in Idaho
| Zip Code | % Employed | vs State | vs National | |
| 1. | 83463 | 100.0% | 7.1%(+92.9)#1 | 6.9%(+93.1)#18 |
| 2. | 83278 | 76.7% | 7.1%(+69.6)#2 | 6.9%(+69.9)#31 |
| 3. | 83466 | 69.7% | 7.1%(+62.6)#3 | 6.9%(+62.8)#40 |
| 4. | 83844 | 36.8% | 7.1%(+29.7)#4 | 6.9%(+29.9)#196 |
| 5. | 83812 | 30.0% | 7.1%(+22.9)#5 | 6.9%(+23.1)#334 |
| 6. | 83232 | 28.6% | 7.1%(+21.5)#6 | 6.9%(+21.7)#364 |
| 7. | 83802 | 28.4% | 7.1%(+21.3)#7 | 6.9%(+21.5)#372 |
| 8. | 83830 | 28.3% | 7.1%(+21.2)#8 | 6.9%(+21.5)#376 |
| 9. | 83632 | 28.0% | 7.1%(+20.8)#9 | 6.9%(+21.1)#387 |
| 10. | 83462 | 24.8% | 7.1%(+17.7)#10 | 6.9%(+17.9)#517 |
| 11. | 83821 | 23.9% | 7.1%(+16.7)#11 | 6.9%(+17.0)#569 |
| 12. | 83834 | 22.2% | 7.1%(+15.1)#12 | 6.9%(+15.3)#663 |
| 13. | 83611 | 21.6% | 7.1%(+14.5)#13 | 6.9%(+14.7)#704 |
| 14. | 83217 | 20.5% | 7.1%(+13.4)#14 | 6.9%(+13.6)#786 |
| 15. | 83460 | 20.0% | 7.1%(+12.9)#15 | 6.9%(+13.1)#835 |
| 16. | 83852 | 18.7% | 7.1%(+11.6)#16 | 6.9%(+11.9)#979 |
| 17. | 83323 | 18.3% | 7.1%(+11.2)#17 | 6.9%(+11.5)#1,039 |
| 18. | 83868 | 18.3% | 7.1%(+11.1)#18 | 6.9%(+11.4)#1,054 |
| 19. | 83841 | 17.7% | 7.1%(+10.6)#19 | 6.9%(+10.8)#1,148 |
| 20. | 83313 | 17.6% | 7.1%(+10.4)#20 | 6.9%(+10.7)#1,168 |
| 21. | 83209 | 17.3% | 7.1%(+10.2)#21 | 6.9%(+10.4)#1,213 |
| 22. | 83813 | 16.0% | 7.1%(+8.86)#22 | 6.9%(+9.10)#1,459 |
| 23. | 83429 | 15.8% | 7.1%(+8.70)#23 | 6.9%(+8.94)#1,492 |
| 24. | 83851 | 15.6% | 7.1%(+8.48)#24 | 6.9%(+8.72)#1,535 |
| 25. | 83340 | 15.2% | 7.1%(+8.12)#25 | 6.9%(+8.36)#1,614 |
| 26. | 83464 | 14.9% | 7.1%(+7.75)#26 | 6.9%(+7.98)#1,715 |
| 27. | 83811 | 14.6% | 7.1%(+7.49)#27 | 6.9%(+7.73)#1,787 |
| 28. | 83845 | 14.3% | 7.1%(+7.17)#28 | 6.9%(+7.40)#1,874 |
| 29. | 83837 | 14.2% | 7.1%(+7.06)#29 | 6.9%(+7.29)#1,910 |
| 30. | 83422 | 14.1% | 7.1%(+7.02)#30 | 6.9%(+7.25)#1,924 |
| 31. | 83449 | 13.2% | 7.1%(+6.09)#31 | 6.9%(+6.33)#2,265 |
| 32. | 83638 | 13.1% | 7.1%(+6.01)#32 | 6.9%(+6.24)#2,299 |
| 33. | 83440 | 12.8% | 7.1%(+5.73)#33 | 6.9%(+5.97)#2,413 |
| 34. | 83228 | 12.6% | 7.1%(+5.51)#34 | 6.9%(+5.75)#2,512 |
| 35. | 83631 | 12.5% | 7.1%(+5.36)#35 | 6.9%(+5.60)#2,603 |
| 36. | 83327 | 12.4% | 7.1%(+5.25)#36 | 6.9%(+5.48)#2,649 |
| 37. | 83311 | 12.3% | 7.1%(+5.16)#37 | 6.9%(+5.39)#2,677 |
| 38. | 83622 | 12.2% | 7.1%(+5.05)#38 | 6.9%(+5.28)#2,739 |
| 39. | 83213 | 11.9% | 7.1%(+4.77)#39 | 6.9%(+5.01)#2,913 |
| 40. | 83873 | 11.8% | 7.1%(+4.68)#40 | 6.9%(+4.92)#2,957 |
| 41. | 83876 | 11.8% | 7.1%(+4.64)#41 | 6.9%(+4.87)#2,990 |
| 42. | 83355 | 11.5% | 7.1%(+4.42)#42 | 6.9%(+4.66)#3,127 |
| 43. | 83627 | 11.4% | 7.1%(+4.30)#43 | 6.9%(+4.53)#3,220 |
| 44. | 83648 | 11.0% | 7.1%(+3.91)#44 | 6.9%(+4.15)#3,528 |
| 45. | 83436 | 11.0% | 7.1%(+3.89)#45 | 6.9%(+4.13)#3,544 |
| 46. | 83353 | 10.6% | 7.1%(+3.49)#46 | 6.9%(+3.73)#3,880 |
| 47. | 83302 | 10.5% | 7.1%(+3.35)#47 | 6.9%(+3.58)#4,033 |
| 48. | 83849 | 10.3% | 7.1%(+3.20)#48 | 6.9%(+3.44)#4,180 |
| 49. | 83261 | 10.3% | 7.1%(+3.20)#49 | 6.9%(+3.44)#4,181 |
| 50. | 83401 | 10.2% | 7.1%(+3.06)#50 | 6.9%(+3.29)#4,332 |
| 51. | 83444 | 10.1% | 7.1%(+2.99)#51 | 6.9%(+3.22)#4,411 |
| 52. | 83549 | 10.0% | 7.1%(+2.88)#52 | 6.9%(+3.12)#4,544 |
| 53. | 83804 | 9.7% | 7.1%(+2.61)#53 | 6.9%(+2.85)#4,898 |
| 54. | 83808 | 9.7% | 7.1%(+2.56)#54 | 6.9%(+2.80)#4,958 |
| 55. | 83706 | 9.6% | 7.1%(+2.52)#55 | 6.9%(+2.75)#5,011 |
| 56. | 83814 | 9.4% | 7.1%(+2.30)#56 | 6.9%(+2.54)#5,324 |
| 57. | 83623 | 9.4% | 7.1%(+2.25)#57 | 6.9%(+2.49)#5,394 |
| 58. | 83539 | 9.4% | 7.1%(+2.24)#58 | 6.9%(+2.47)#5,416 |
| 59. | 83202 | 9.3% | 7.1%(+2.23)#59 | 6.9%(+2.47)#5,430 |
| 60. | 83455 | 9.3% | 7.1%(+2.17)#60 | 6.9%(+2.40)#5,528 |
| 61. | 83864 | 9.2% | 7.1%(+2.04)#61 | 6.9%(+2.27)#5,723 |
| 62. | 83333 | 9.1% | 7.1%(+1.97)#62 | 6.9%(+2.21)#5,824 |
| 63. | 83835 | 9.1% | 7.1%(+1.94)#63 | 6.9%(+2.18)#5,873 |
| 64. | 83204 | 9.0% | 7.1%(+1.93)#64 | 6.9%(+2.16)#5,891 |
| 65. | 83705 | 9.0% | 7.1%(+1.89)#65 | 6.9%(+2.13)#5,937 |
| 66. | 83713 | 9.0% | 7.1%(+1.84)#66 | 6.9%(+2.08)#6,034 |
| 67. | 83650 | 8.7% | 7.1%(+1.62)#67 | 6.9%(+1.85)#6,418 |
| 68. | 83856 | 8.7% | 7.1%(+1.56)#68 | 6.9%(+1.79)#6,513 |
| 69. | 83250 | 8.6% | 7.1%(+1.51)#69 | 6.9%(+1.75)#6,583 |
| 70. | 83314 | 8.5% | 7.1%(+1.37)#70 | 6.9%(+1.61)#6,837 |
| 71. | 83324 | 8.5% | 7.1%(+1.35)#71 | 6.9%(+1.59)#6,871 |
| 72. | 83427 | 8.5% | 7.1%(+1.33)#72 | 6.9%(+1.57)#6,900 |
| 73. | 83402 | 8.4% | 7.1%(+1.24)#73 | 6.9%(+1.47)#7,087 |
| 74. | 83703 | 8.3% | 7.1%(+1.18)#74 | 6.9%(+1.42)#7,221 |
| 75. | 83445 | 8.2% | 7.1%(+1.06)#75 | 6.9%(+1.30)#7,472 |
| 76. | 83854 | 8.2% | 7.1%(+1.06)#76 | 6.9%(+1.29)#7,480 |
| 77. | 83301 | 8.2% | 7.1%(+1.05)#77 | 6.9%(+1.29)#7,499 |
| 78. | 83536 | 8.1% | 7.1%(+1.01)#78 | 6.9%(+1.25)#7,575 |
| 79. | 83647 | 8.0% | 7.1%(+0.932)#79 | 6.9%(+1.17)#7,728 |
| 80. | 83316 | 8.0% | 7.1%(+0.847)#80 | 6.9%(+1.08)#7,896 |
| 81. | 83406 | 8.0% | 7.1%(+0.842)#81 | 6.9%(+1.08)#7,901 |
| 82. | 83201 | 8.0% | 7.1%(+0.838)#82 | 6.9%(+1.07)#7,912 |
| 83. | 83824 | 7.9% | 7.1%(+0.792)#83 | 6.9%(+1.03)#8,007 |
| 84. | 83626 | 7.9% | 7.1%(+0.790)#84 | 6.9%(+1.03)#8,011 |
| 85. | 83843 | 7.9% | 7.1%(+0.760)#85 | 6.9%(+0.996)#8,082 |
| 86. | 83452 | 7.8% | 7.1%(+0.673)#86 | 6.9%(+0.909)#8,281 |
| 87. | 83263 | 7.8% | 7.1%(+0.671)#87 | 6.9%(+0.907)#8,288 |
| 88. | 83420 | 7.8% | 7.1%(+0.666)#88 | 6.9%(+0.903)#8,304 |
| 89. | 83325 | 7.7% | 7.1%(+0.623)#89 | 6.9%(+0.859)#8,398 |
| 90. | 83318 | 7.6% | 7.1%(+0.508)#90 | 6.9%(+0.744)#8,690 |
| 91. | 83651 | 7.5% | 7.1%(+0.427)#91 | 6.9%(+0.663)#8,877 |
| 92. | 83847 | 7.5% | 7.1%(+0.393)#92 | 6.9%(+0.629)#8,975 |
| 93. | 83341 | 7.0% | 7.1%(-0.152)#93 | 6.9%(+0.084)#10,429 |
| 94. | 83617 | 6.9% | 7.1%(-0.243)#94 | 6.9%(-0.007)#10,651 |
| 95. | 83686 | 6.9% | 7.1%(-0.266)#95 | 6.9%(-0.030)#10,713 |
| 96. | 83702 | 6.8% | 7.1%(-0.282)#96 | 6.9%(-0.046)#10,772 |
| 97. | 83605 | 6.8% | 7.1%(-0.317)#97 | 6.9%(-0.080)#10,885 |
| 98. | 83815 | 6.8% | 7.1%(-0.335)#98 | 6.9%(-0.098)#10,942 |
| 99. | 83454 | 6.8% | 7.1%(-0.350)#99 | 6.9%(-0.114)#10,994 |
| 100. | 83328 | 6.7% | 7.1%(-0.439)#100 | 6.9%(-0.202)#11,260 |
Common Questions
What are the Top 10 Zip Codes with the Highest Percentage of Population Employed in Accommodation & Food Services in Idaho?
Top 10 Zip Codes with the Highest Percentage of Population Employed in Accommodation & Food Services in Idaho are:
What zip code has the Highest Percentage of Population Employed in Accommodation & Food Services in Idaho?
83463 has the Highest Percentage of Population Employed in Accommodation & Food Services in Idaho with 100.0%.
What is the Percentage of Population Employed in Accommodation & Food Services in the State of Idaho?
Percentage of Population Employed in Accommodation & Food Services in Idaho is 7.1%.
What is the Percentage of Population Employed in Accommodation & Food Services in the United States?
Percentage of Population Employed in Accommodation & Food Services in the United States is 6.9%.