Zip Codes with the Highest Percentage of Population Employed in Accommodation & Food Services in Abilene, TX
RELATED REPORTS & OPTIONS
Accommodation & Food Services
Abilene
Compare Zip Codes
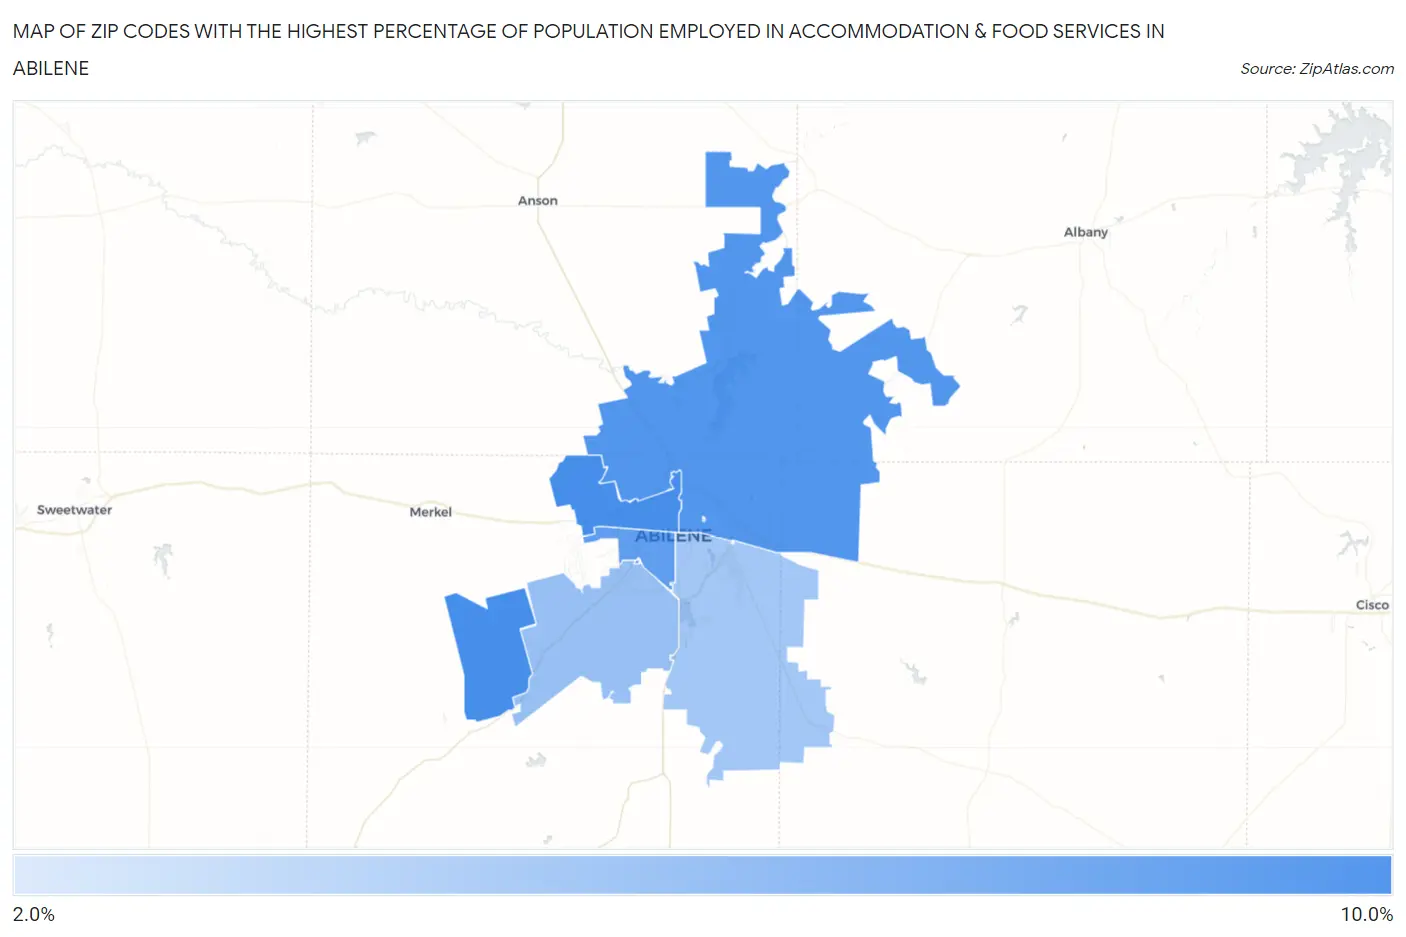
Map of Zip Codes with the Highest Percentage of Population Employed in Accommodation & Food Services in Abilene
2.6%
9.0%
Zip Codes with the Highest Percentage of Population Employed in Accommodation & Food Services in Abilene, TX
| Zip Code | % Employed | vs State | vs National | |
| 1. | 79603 | 9.0% | 7.2%(+1.79)#406 | 6.9%(+2.11)#5,965 |
| 2. | 79601 | 8.5% | 7.2%(+1.32)#468 | 6.9%(+1.65)#6,771 |
| 3. | 79605 | 7.8% | 7.2%(+0.626)#582 | 6.9%(+0.950)#8,191 |
| 4. | 79606 | 5.5% | 7.2%(-1.74)#1,009 | 6.9%(-1.41)#15,166 |
| 5. | 79602 | 5.0% | 7.2%(-2.18)#1,082 | 6.9%(-1.85)#16,732 |
| 6. | 79699 | 2.6% | 7.2%(-4.64)#1,475 | 6.9%(-4.32)#24,331 |
1
Common Questions
What are the Top 5 Zip Codes with the Highest Percentage of Population Employed in Accommodation & Food Services in Abilene, TX?
Top 5 Zip Codes with the Highest Percentage of Population Employed in Accommodation & Food Services in Abilene, TX are:
What zip code has the Highest Percentage of Population Employed in Accommodation & Food Services in Abilene, TX?
79603 has the Highest Percentage of Population Employed in Accommodation & Food Services in Abilene, TX with 9.0%.
What is the Percentage of Population Employed in Accommodation & Food Services in Abilene, TX?
Percentage of Population Employed in Accommodation & Food Services in Abilene is 7.4%.
What is the Percentage of Population Employed in Accommodation & Food Services in Texas?
Percentage of Population Employed in Accommodation & Food Services in Texas is 7.2%.
What is the Percentage of Population Employed in Accommodation & Food Services in the United States?
Percentage of Population Employed in Accommodation & Food Services in the United States is 6.9%.