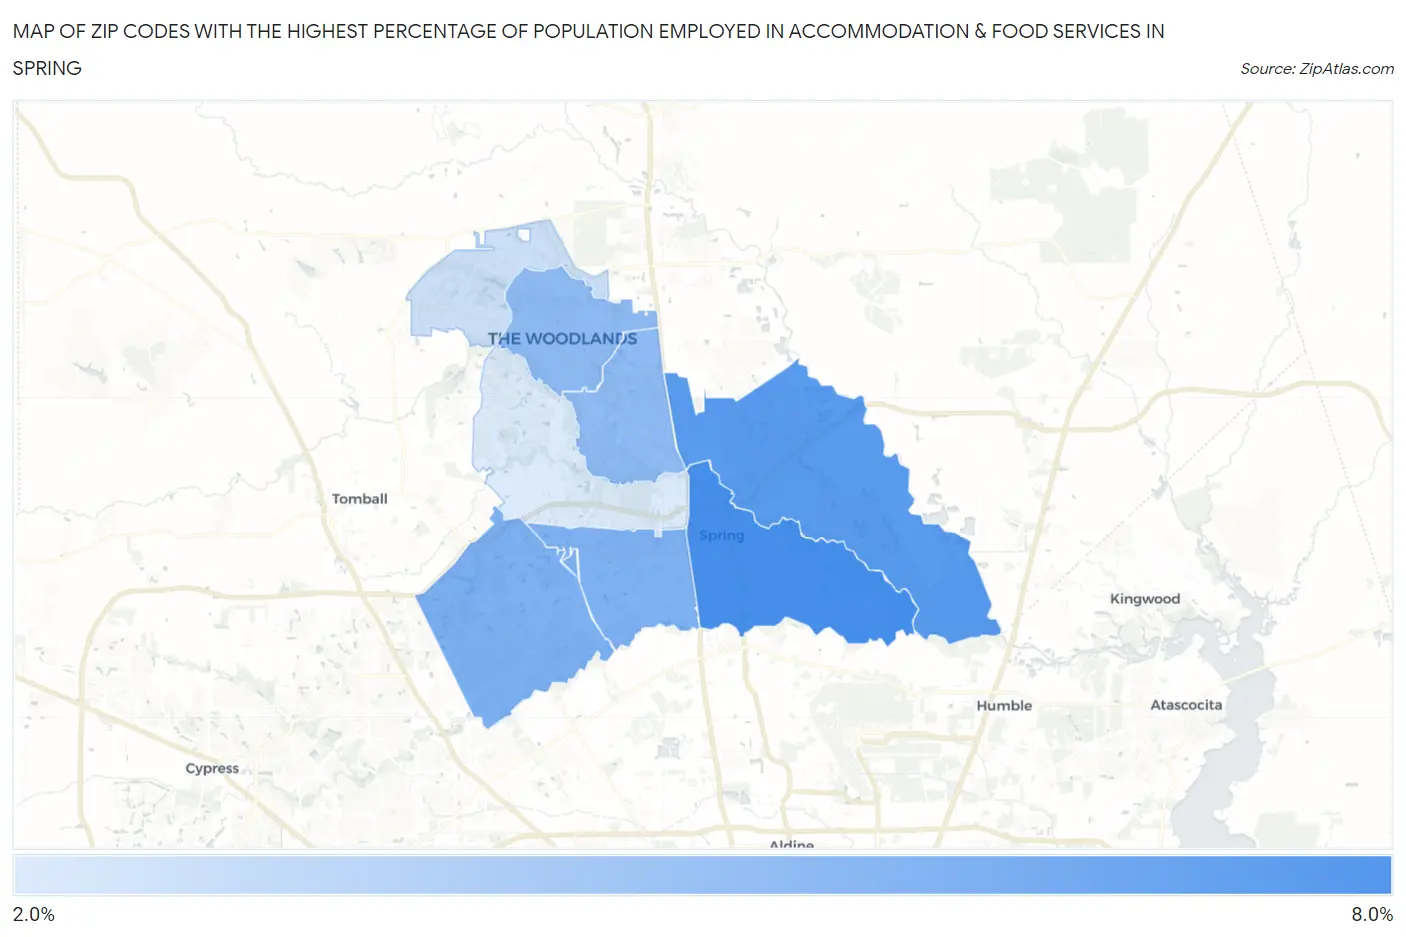
Zip Codes with the Highest Percentage of Population Employed in Accommodation & Food Services in Spring, TX
RELATED REPORTS & OPTIONS
Accommodation & Food Services
Spring
Compare Zip Codes
Map of Zip Codes with the Highest Percentage of Population Employed in Accommodation & Food Services in Spring
2.6%
7.5%
Zip Codes with the Highest Percentage of Population Employed in Accommodation & Food Services in Spring, TX
| Zip Code | % Employed | vs State | vs National | |
| 1. | 77373 | 7.5% | 7.2%(+0.333)#631 | 6.9%(+0.658)#8,894 |
| 2. | 77386 | 7.0% | 7.2%(-0.229)#724 | 6.9%(+0.096)#10,393 |
| 3. | 77379 | 5.8% | 7.2%(-1.45)#952 | 6.9%(-1.12)#14,195 |
| 4. | 77388 | 5.7% | 7.2%(-1.49)#957 | 6.9%(-1.16)#14,323 |
| 5. | 77381 | 5.2% | 7.2%(-2.05)#1,054 | 6.9%(-1.73)#16,277 |
| 6. | 77380 | 5.2% | 7.2%(-2.05)#1,055 | 6.9%(-1.73)#16,279 |
| 7. | 77382 | 3.1% | 7.2%(-4.12)#1,421 | 6.9%(-3.80)#22,995 |
| 8. | 77389 | 2.6% | 7.2%(-4.61)#1,473 | 6.9%(-4.29)#24,263 |
1
Common Questions
What are the Top 5 Zip Codes with the Highest Percentage of Population Employed in Accommodation & Food Services in Spring, TX?
Top 5 Zip Codes with the Highest Percentage of Population Employed in Accommodation & Food Services in Spring, TX are:
What zip code has the Highest Percentage of Population Employed in Accommodation & Food Services in Spring, TX?
77373 has the Highest Percentage of Population Employed in Accommodation & Food Services in Spring, TX with 7.5%.
What is the Percentage of Population Employed in Accommodation & Food Services in Spring, TX?
Percentage of Population Employed in Accommodation & Food Services in Spring is 7.7%.
What is the Percentage of Population Employed in Accommodation & Food Services in Texas?
Percentage of Population Employed in Accommodation & Food Services in Texas is 7.2%.
What is the Percentage of Population Employed in Accommodation & Food Services in the United States?
Percentage of Population Employed in Accommodation & Food Services in the United States is 6.9%.