Zip Codes with the Highest Percentage of Population Employed in Accommodation & Food Services in Lewisville, TX
RELATED REPORTS & OPTIONS
Accommodation & Food Services
Lewisville
Compare Zip Codes
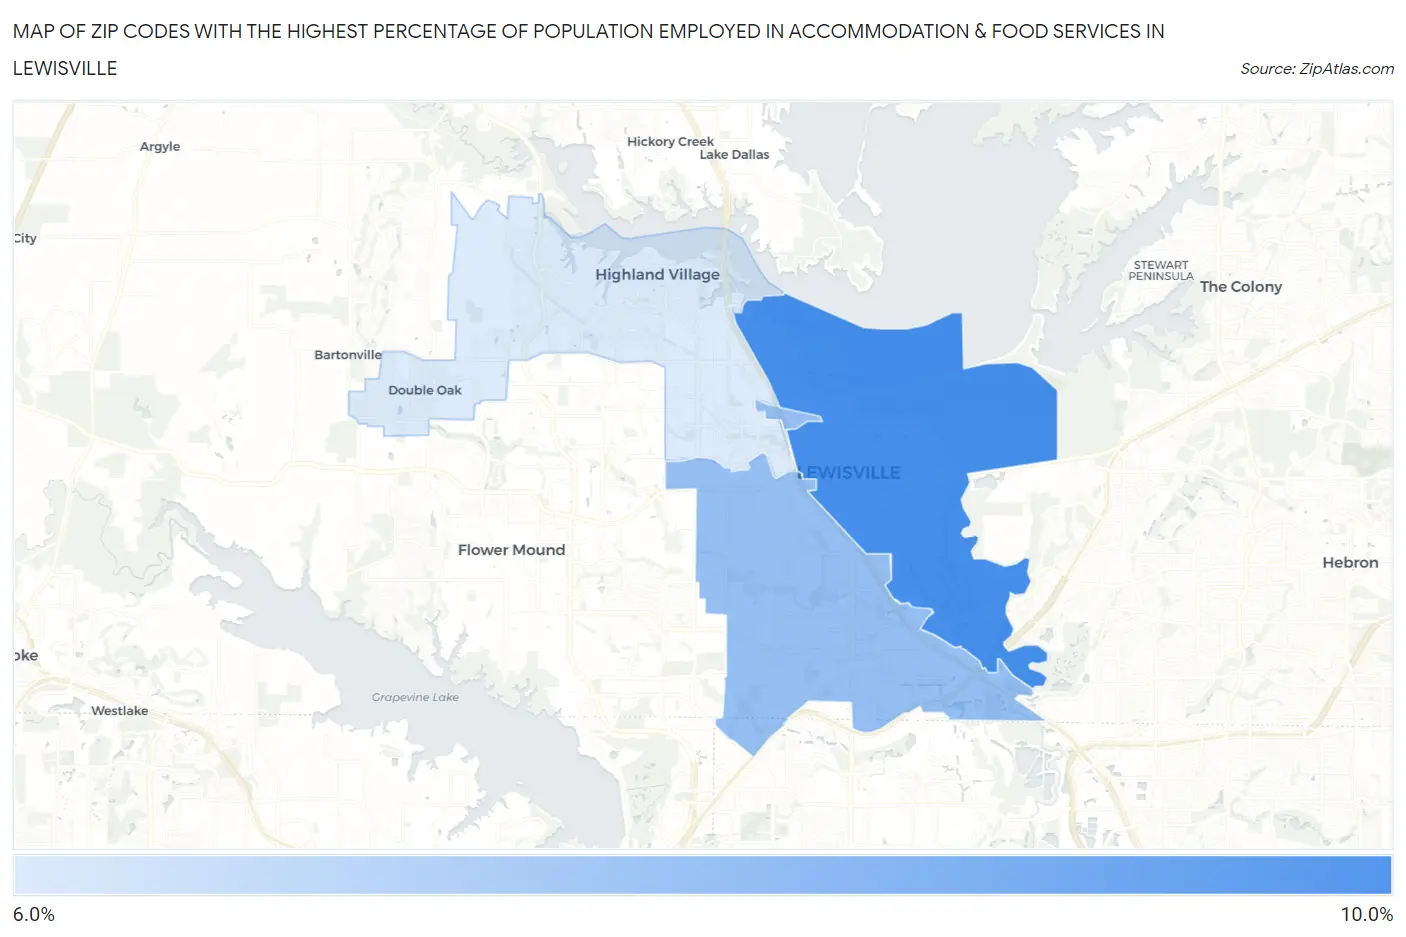
Map of Zip Codes with the Highest Percentage of Population Employed in Accommodation & Food Services in Lewisville
6.4%
9.9%
Zip Codes with the Highest Percentage of Population Employed in Accommodation & Food Services in Lewisville, TX
| Zip Code | % Employed | vs State | vs National | |
| 1. | 75057 | 9.9% | 7.2%(+2.64)#297 | 6.9%(+2.97)#4,723 |
| 2. | 75067 | 8.0% | 7.2%(+0.789)#556 | 6.9%(+1.11)#7,828 |
| 3. | 75077 | 6.4% | 7.2%(-0.843)#853 | 6.9%(-0.518)#12,285 |
1
Common Questions
What are the Top Zip Codes with the Highest Percentage of Population Employed in Accommodation & Food Services in Lewisville, TX?
Top Zip Codes with the Highest Percentage of Population Employed in Accommodation & Food Services in Lewisville, TX are:
What zip code has the Highest Percentage of Population Employed in Accommodation & Food Services in Lewisville, TX?
75057 has the Highest Percentage of Population Employed in Accommodation & Food Services in Lewisville, TX with 9.9%.
What is the Percentage of Population Employed in Accommodation & Food Services in Lewisville, TX?
Percentage of Population Employed in Accommodation & Food Services in Lewisville is 7.5%.
What is the Percentage of Population Employed in Accommodation & Food Services in Texas?
Percentage of Population Employed in Accommodation & Food Services in Texas is 7.2%.
What is the Percentage of Population Employed in Accommodation & Food Services in the United States?
Percentage of Population Employed in Accommodation & Food Services in the United States is 6.9%.