Zip Codes with the Highest Percentage of Population Employed in Accommodation & Food Services in New Braunfels, TX
RELATED REPORTS & OPTIONS
Accommodation & Food Services
New Braunfels
Compare Zip Codes
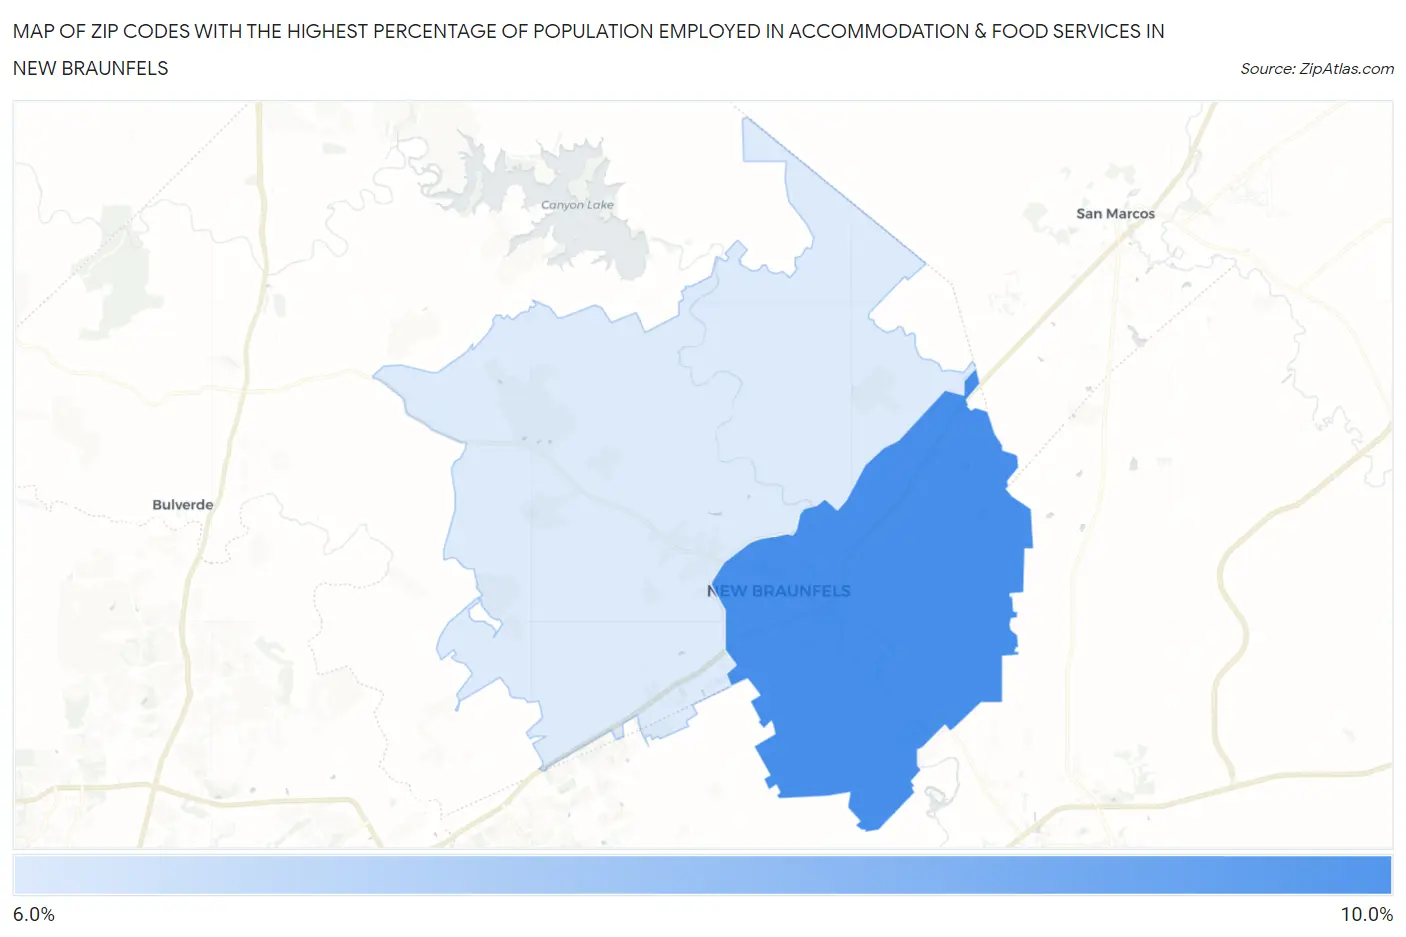
Map of Zip Codes with the Highest Percentage of Population Employed in Accommodation & Food Services in New Braunfels
6.5%
9.5%
Zip Codes with the Highest Percentage of Population Employed in Accommodation & Food Services in New Braunfels, TX
| Zip Code | % Employed | vs State | vs National | |
| 1. | 78130 | 9.5% | 7.2%(+2.29)#336 | 6.9%(+2.61)#5,222 |
| 2. | 78132 | 6.5% | 7.2%(-0.741)#825 | 6.9%(-0.417)#11,954 |
1
Common Questions
What are the Top Zip Codes with the Highest Percentage of Population Employed in Accommodation & Food Services in New Braunfels, TX?
Top Zip Codes with the Highest Percentage of Population Employed in Accommodation & Food Services in New Braunfels, TX are:
What zip code has the Highest Percentage of Population Employed in Accommodation & Food Services in New Braunfels, TX?
78130 has the Highest Percentage of Population Employed in Accommodation & Food Services in New Braunfels, TX with 9.5%.
What is the Percentage of Population Employed in Accommodation & Food Services in New Braunfels, TX?
Percentage of Population Employed in Accommodation & Food Services in New Braunfels is 9.4%.
What is the Percentage of Population Employed in Accommodation & Food Services in Texas?
Percentage of Population Employed in Accommodation & Food Services in Texas is 7.2%.
What is the Percentage of Population Employed in Accommodation & Food Services in the United States?
Percentage of Population Employed in Accommodation & Food Services in the United States is 6.9%.