Zip Codes with the Highest Percentage of Population Employed in Accommodation & Food Services in Greenville, TX
RELATED REPORTS & OPTIONS
Accommodation & Food Services
Greenville
Compare Zip Codes
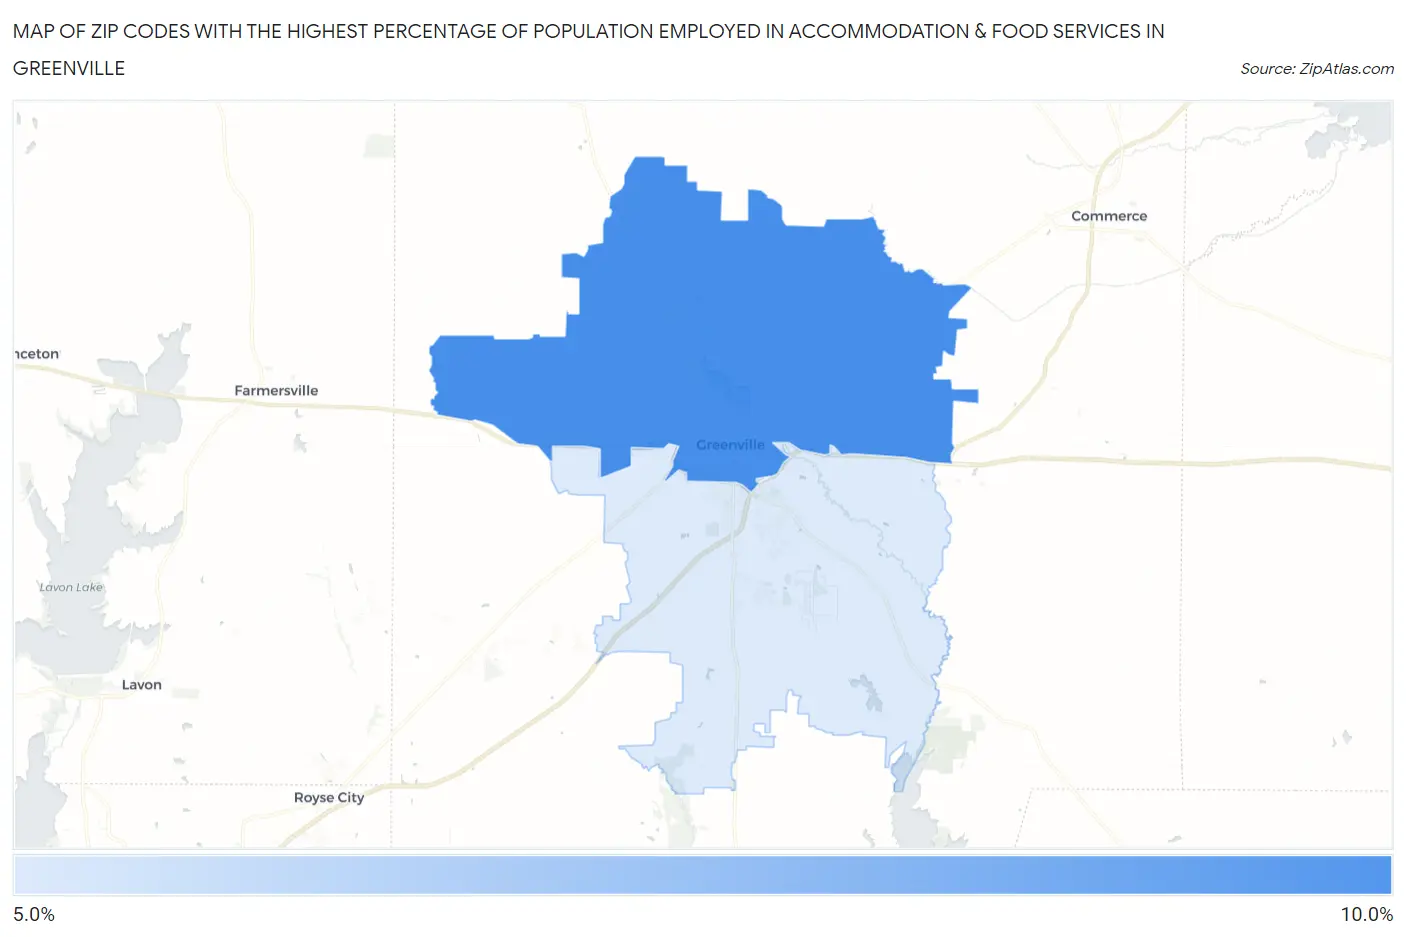
Map of Zip Codes with the Highest Percentage of Population Employed in Accommodation & Food Services in Greenville
5.4%
8.8%
Zip Codes with the Highest Percentage of Population Employed in Accommodation & Food Services in Greenville, TX
| Zip Code | % Employed | vs State | vs National | |
| 1. | 75401 | 8.8% | 7.2%(+1.55)#434 | 6.9%(+1.87)#6,386 |
| 2. | 75402 | 5.4% | 7.2%(-1.76)#1,012 | 6.9%(-1.43)#15,217 |
1
Common Questions
What are the Top Zip Codes with the Highest Percentage of Population Employed in Accommodation & Food Services in Greenville, TX?
Top Zip Codes with the Highest Percentage of Population Employed in Accommodation & Food Services in Greenville, TX are:
What zip code has the Highest Percentage of Population Employed in Accommodation & Food Services in Greenville, TX?
75401 has the Highest Percentage of Population Employed in Accommodation & Food Services in Greenville, TX with 8.8%.
What is the Percentage of Population Employed in Accommodation & Food Services in Greenville, TX?
Percentage of Population Employed in Accommodation & Food Services in Greenville is 7.0%.
What is the Percentage of Population Employed in Accommodation & Food Services in Texas?
Percentage of Population Employed in Accommodation & Food Services in Texas is 7.2%.
What is the Percentage of Population Employed in Accommodation & Food Services in the United States?
Percentage of Population Employed in Accommodation & Food Services in the United States is 6.9%.