Zip Codes with the Highest Percentage of Population Employed in Accommodation & Food Services in Granbury, TX
RELATED REPORTS & OPTIONS
Accommodation & Food Services
Granbury
Compare Zip Codes
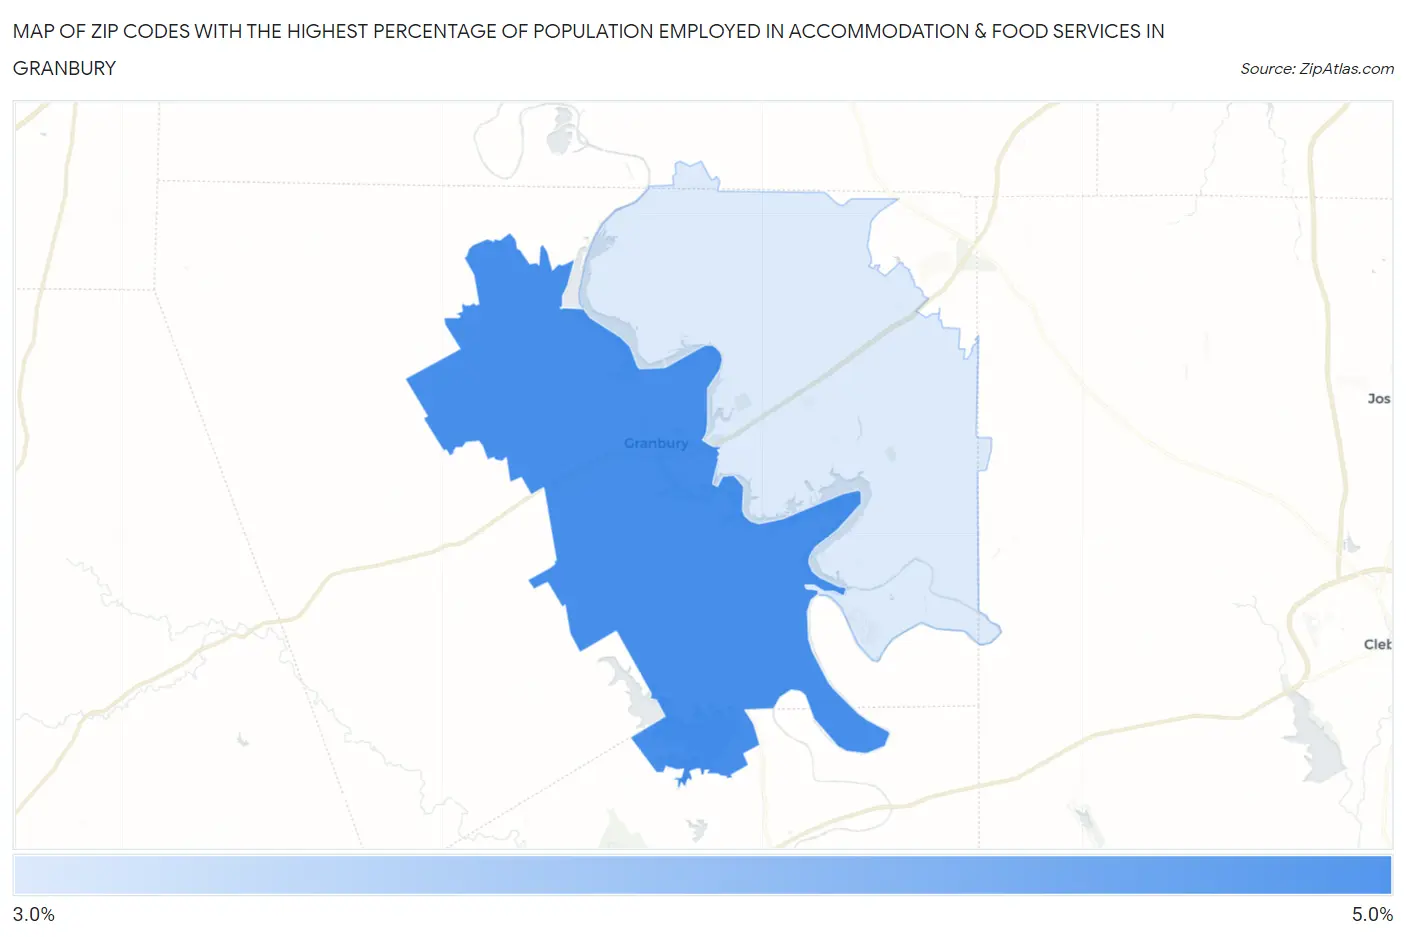
Map of Zip Codes with the Highest Percentage of Population Employed in Accommodation & Food Services in Granbury
3.4%
5.0%
Zip Codes with the Highest Percentage of Population Employed in Accommodation & Food Services in Granbury, TX
| Zip Code | % Employed | vs State | vs National | |
| 1. | 76048 | 5.0% | 7.2%(-2.23)#1,093 | 6.9%(-1.91)#16,919 |
| 2. | 76049 | 3.4% | 7.2%(-3.84)#1,382 | 6.9%(-3.52)#22,207 |
1
Common Questions
What are the Top Zip Codes with the Highest Percentage of Population Employed in Accommodation & Food Services in Granbury, TX?
Top Zip Codes with the Highest Percentage of Population Employed in Accommodation & Food Services in Granbury, TX are:
What zip code has the Highest Percentage of Population Employed in Accommodation & Food Services in Granbury, TX?
76048 has the Highest Percentage of Population Employed in Accommodation & Food Services in Granbury, TX with 5.0%.
What is the Percentage of Population Employed in Accommodation & Food Services in Granbury, TX?
Percentage of Population Employed in Accommodation & Food Services in Granbury is 3.9%.
What is the Percentage of Population Employed in Accommodation & Food Services in Texas?
Percentage of Population Employed in Accommodation & Food Services in Texas is 7.2%.
What is the Percentage of Population Employed in Accommodation & Food Services in the United States?
Percentage of Population Employed in Accommodation & Food Services in the United States is 6.9%.