Zip Codes with the Highest Percentage of Population Employed in Accommodation & Food Services in Richmond, TX
RELATED REPORTS & OPTIONS
Accommodation & Food Services
Richmond
Compare Zip Codes
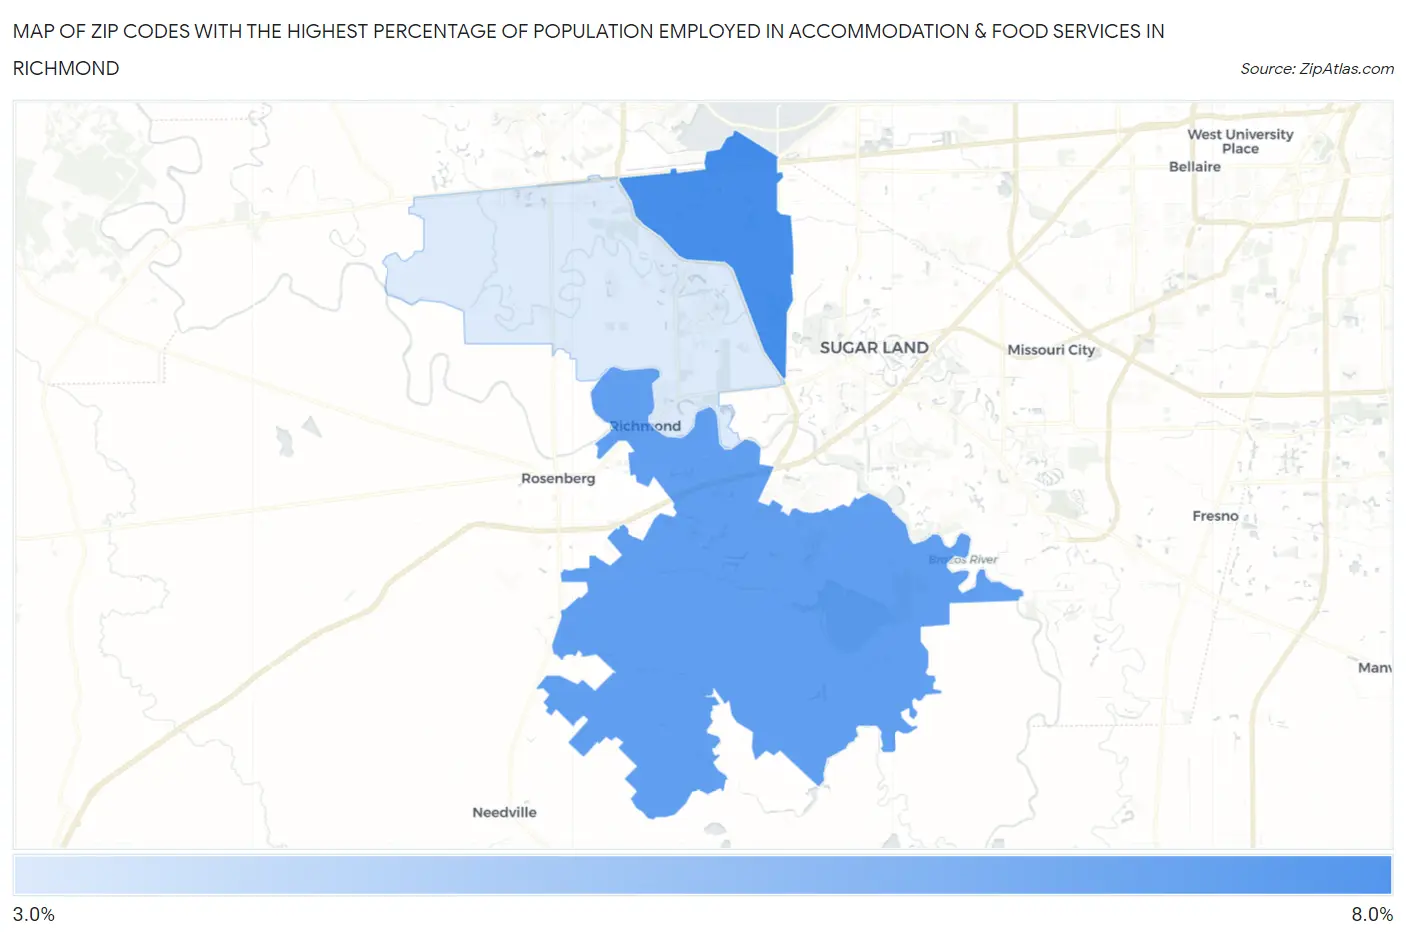
Map of Zip Codes with the Highest Percentage of Population Employed in Accommodation & Food Services in Richmond
3.4%
6.4%
Zip Codes with the Highest Percentage of Population Employed in Accommodation & Food Services in Richmond, TX
| Zip Code | % Employed | vs State | vs National | |
| 1. | 77407 | 6.4% | 7.2%(-0.761)#830 | 6.9%(-0.436)#12,017 |
| 2. | 77469 | 5.9% | 7.2%(-1.28)#929 | 6.9%(-0.957)#13,704 |
| 3. | 77406 | 3.4% | 7.2%(-3.76)#1,370 | 6.9%(-3.44)#21,963 |
1
Common Questions
What are the Top Zip Codes with the Highest Percentage of Population Employed in Accommodation & Food Services in Richmond, TX?
Top Zip Codes with the Highest Percentage of Population Employed in Accommodation & Food Services in Richmond, TX are:
What zip code has the Highest Percentage of Population Employed in Accommodation & Food Services in Richmond, TX?
77407 has the Highest Percentage of Population Employed in Accommodation & Food Services in Richmond, TX with 6.4%.
What is the Percentage of Population Employed in Accommodation & Food Services in Richmond, TX?
Percentage of Population Employed in Accommodation & Food Services in Richmond is 10.9%.
What is the Percentage of Population Employed in Accommodation & Food Services in Texas?
Percentage of Population Employed in Accommodation & Food Services in Texas is 7.2%.
What is the Percentage of Population Employed in Accommodation & Food Services in the United States?
Percentage of Population Employed in Accommodation & Food Services in the United States is 6.9%.