Zip Codes with the Highest Percentage of Population Employed in Accommodation & Food Services in Midland, TX
RELATED REPORTS & OPTIONS
Accommodation & Food Services
Midland
Compare Zip Codes
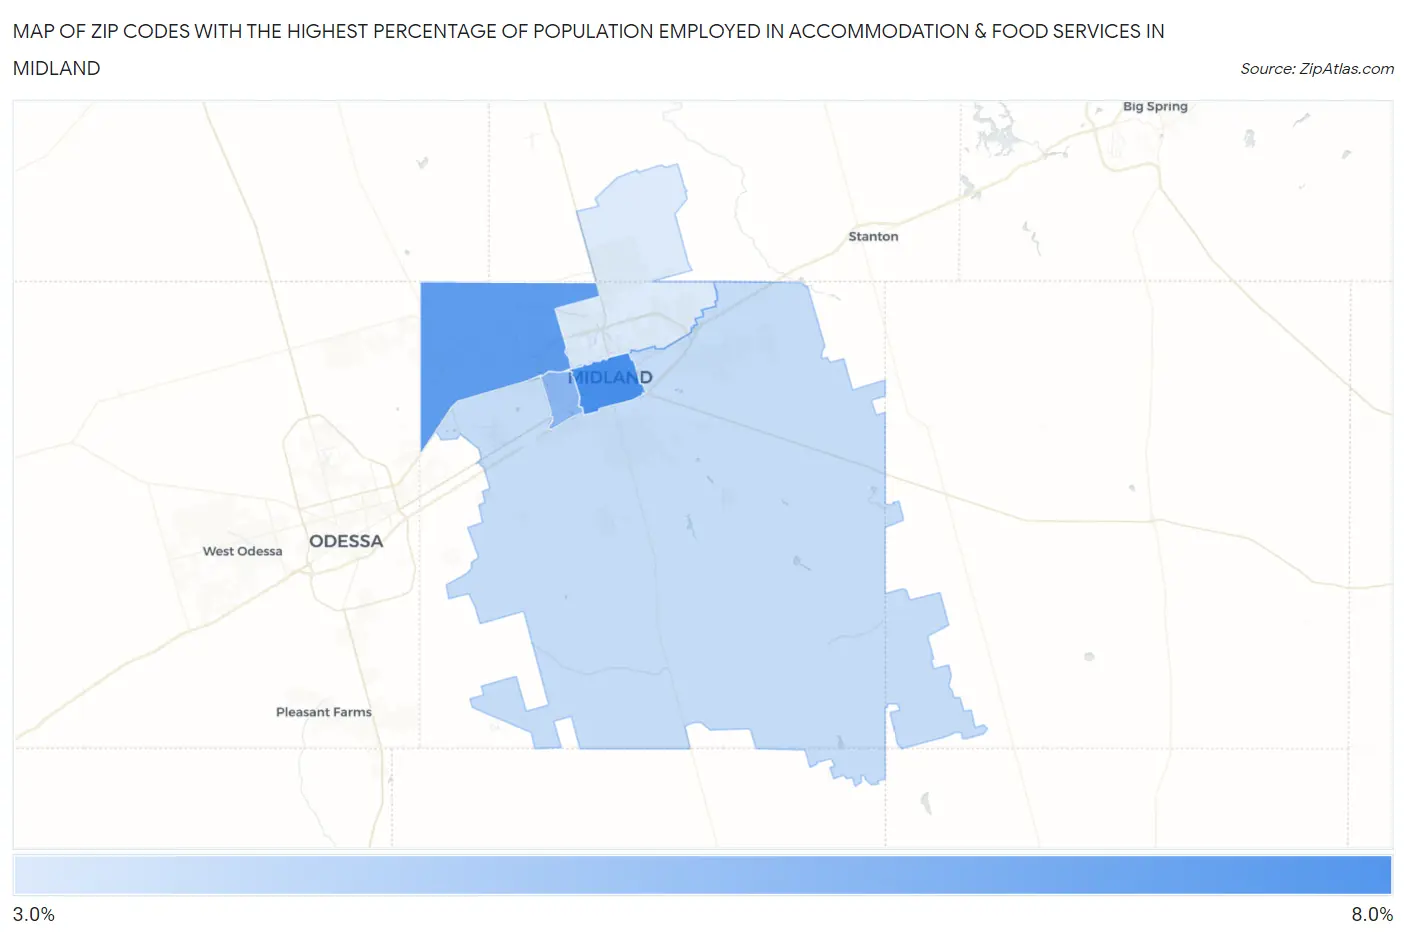
Map of Zip Codes with the Highest Percentage of Population Employed in Accommodation & Food Services in Midland
3.9%
8.0%
Zip Codes with the Highest Percentage of Population Employed in Accommodation & Food Services in Midland, TX
| Zip Code | % Employed | vs State | vs National | |
| 1. | 79701 | 8.0% | 7.2%(+0.744)#564 | 6.9%(+1.07)#7,924 |
| 2. | 79707 | 7.3% | 7.2%(+0.110)#663 | 6.9%(+0.435)#9,471 |
| 3. | 79703 | 6.1% | 7.2%(-1.08)#894 | 6.9%(-0.756)#13,046 |
| 4. | 79706 | 4.5% | 7.2%(-2.69)#1,183 | 6.9%(-2.36)#18,428 |
| 5. | 79705 | 3.9% | 7.2%(-3.28)#1,277 | 6.9%(-2.95)#20,380 |
1
Common Questions
What are the Top 3 Zip Codes with the Highest Percentage of Population Employed in Accommodation & Food Services in Midland, TX?
Top 3 Zip Codes with the Highest Percentage of Population Employed in Accommodation & Food Services in Midland, TX are:
What zip code has the Highest Percentage of Population Employed in Accommodation & Food Services in Midland, TX?
79701 has the Highest Percentage of Population Employed in Accommodation & Food Services in Midland, TX with 8.0%.
What is the Percentage of Population Employed in Accommodation & Food Services in Midland, TX?
Percentage of Population Employed in Accommodation & Food Services in Midland is 6.0%.
What is the Percentage of Population Employed in Accommodation & Food Services in Texas?
Percentage of Population Employed in Accommodation & Food Services in Texas is 7.2%.
What is the Percentage of Population Employed in Accommodation & Food Services in the United States?
Percentage of Population Employed in Accommodation & Food Services in the United States is 6.9%.