Zip Codes with the Highest Percentage of Population Employed in Accommodation & Food Services in Nevada
RELATED REPORTS & OPTIONS
Accommodation & Food Services
Nevada
Compare Zip Codes
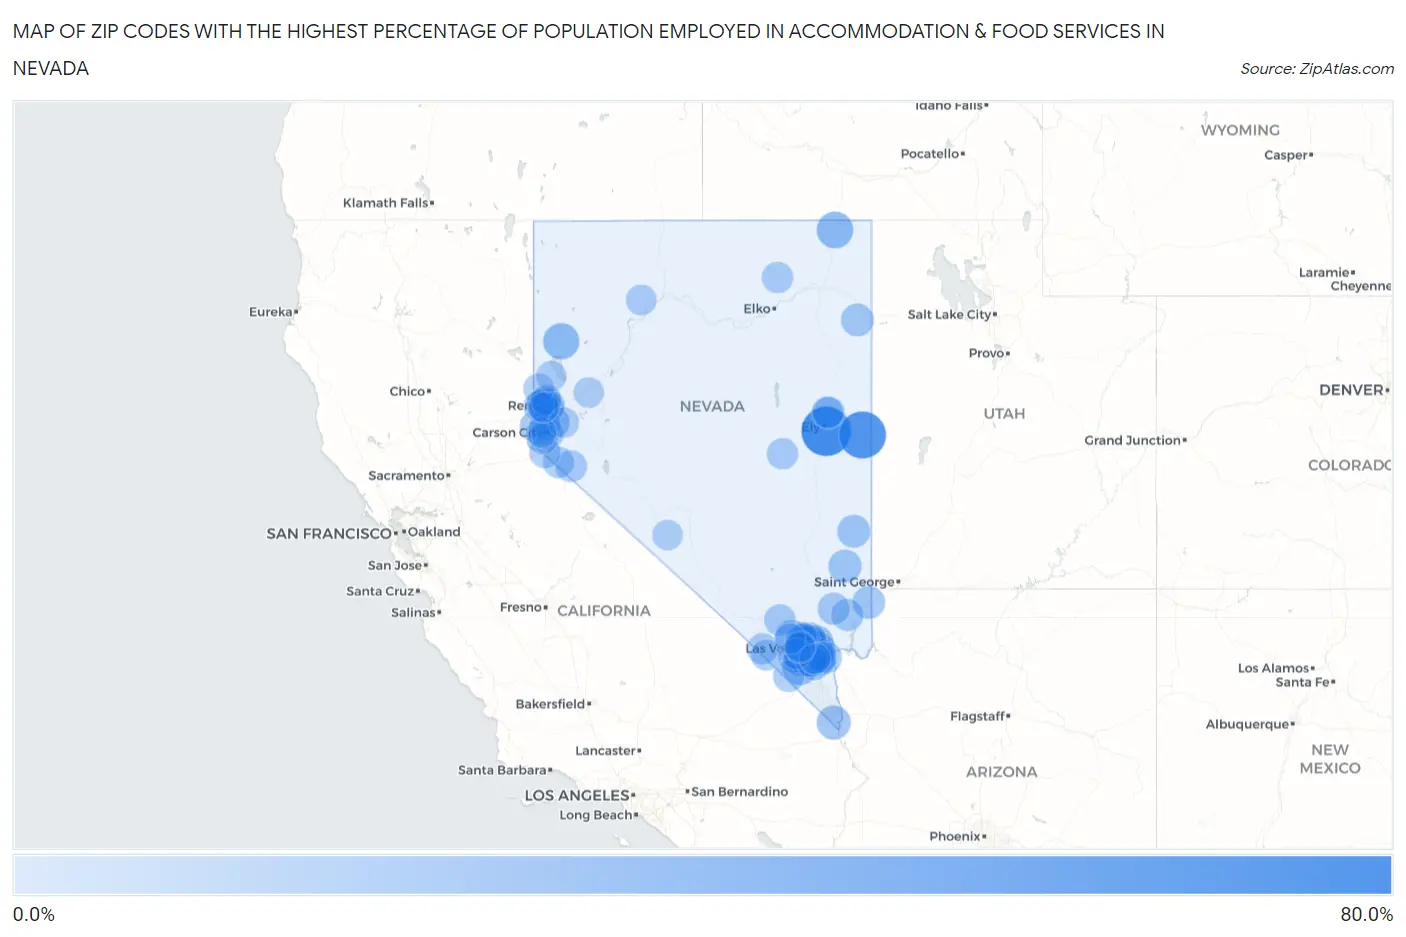
Map of Zip Codes with the Highest Percentage of Population Employed in Accommodation & Food Services in Nevada
0.0%
80.0%
Zip Codes with the Highest Percentage of Population Employed in Accommodation & Food Services in Nevada
| Zip Code | % Employed | vs State | vs National | |
| 1. | 89315 | 62.9% | 13.3%(+49.6)#1 | 6.9%(+56.0)#45 |
| 2. | 89311 | 55.4% | 13.3%(+42.2)#2 | 6.9%(+48.5)#69 |
| 3. | 89825 | 24.8% | 13.3%(+11.6)#3 | 6.9%(+18.0)#515 |
| 4. | 89103 | 24.7% | 13.3%(+11.4)#4 | 6.9%(+17.8)#521 |
| 5. | 89158 | 23.5% | 13.3%(+10.3)#5 | 6.9%(+16.7)#583 |
| 6. | 89405 | 23.5% | 13.3%(+10.2)#6 | 6.9%(+16.6)#586 |
| 7. | 89119 | 22.2% | 13.3%(+8.96)#7 | 6.9%(+15.3)#660 |
| 8. | 89102 | 21.3% | 13.3%(+8.01)#8 | 6.9%(+14.4)#730 |
| 9. | 89121 | 20.9% | 13.3%(+7.61)#9 | 6.9%(+14.0)#755 |
| 10. | 89179 | 20.8% | 13.3%(+7.58)#10 | 6.9%(+14.0)#757 |
| 11. | 89104 | 20.8% | 13.3%(+7.52)#11 | 6.9%(+13.9)#762 |
| 12. | 89106 | 19.7% | 13.3%(+6.45)#12 | 6.9%(+12.8)#859 |
| 13. | 89147 | 19.7% | 13.3%(+6.40)#13 | 6.9%(+12.8)#862 |
| 14. | 89120 | 19.6% | 13.3%(+6.32)#14 | 6.9%(+12.7)#868 |
| 15. | 89169 | 19.1% | 13.3%(+5.87)#15 | 6.9%(+12.3)#932 |
| 16. | 89139 | 18.9% | 13.3%(+5.65)#16 | 6.9%(+12.0)#957 |
| 17. | 89109 | 18.8% | 13.3%(+5.55)#17 | 6.9%(+11.9)#966 |
| 18. | 89115 | 18.5% | 13.3%(+5.25)#18 | 6.9%(+11.6)#1,012 |
| 19. | 89110 | 18.3% | 13.3%(+5.03)#19 | 6.9%(+11.4)#1,048 |
| 20. | 89146 | 18.1% | 13.3%(+4.79)#20 | 6.9%(+11.2)#1,087 |
| 21. | 89113 | 18.0% | 13.3%(+4.74)#21 | 6.9%(+11.1)#1,094 |
| 22. | 89118 | 17.8% | 13.3%(+4.51)#22 | 6.9%(+10.9)#1,131 |
| 23. | 89122 | 17.7% | 13.3%(+4.46)#23 | 6.9%(+10.8)#1,139 |
| 24. | 89032 | 17.5% | 13.3%(+4.23)#24 | 6.9%(+10.6)#1,183 |
| 25. | 89142 | 17.5% | 13.3%(+4.19)#25 | 6.9%(+10.6)#1,189 |
| 26. | 89029 | 17.4% | 13.3%(+4.09)#26 | 6.9%(+10.5)#1,202 |
| 27. | 89101 | 17.3% | 13.3%(+4.06)#27 | 6.9%(+10.4)#1,207 |
| 28. | 89178 | 17.3% | 13.3%(+4.01)#28 | 6.9%(+10.4)#1,222 |
| 29. | 89183 | 17.2% | 13.3%(+3.96)#29 | 6.9%(+10.3)#1,229 |
| 30. | 89148 | 17.1% | 13.3%(+3.86)#30 | 6.9%(+10.2)#1,241 |
| 31. | 89440 | 16.7% | 13.3%(+3.40)#31 | 6.9%(+9.79)#1,314 |
| 32. | 89108 | 16.6% | 13.3%(+3.30)#32 | 6.9%(+9.68)#1,335 |
| 33. | 89030 | 16.3% | 13.3%(+3.02)#33 | 6.9%(+9.41)#1,392 |
| 34. | 89156 | 16.2% | 13.3%(+2.92)#34 | 6.9%(+9.30)#1,410 |
| 35. | 89141 | 15.4% | 13.3%(+2.13)#35 | 6.9%(+8.52)#1,576 |
| 36. | 89004 | 15.3% | 13.3%(+2.01)#36 | 6.9%(+8.40)#1,607 |
| 37. | 89123 | 15.3% | 13.3%(+2.00)#37 | 6.9%(+8.38)#1,608 |
| 38. | 89145 | 15.1% | 13.3%(+1.82)#38 | 6.9%(+8.21)#1,648 |
| 39. | 89008 | 14.9% | 13.3%(+1.67)#39 | 6.9%(+8.05)#1,685 |
| 40. | 89557 | 14.9% | 13.3%(+1.62)#40 | 6.9%(+8.00)#1,707 |
| 41. | 89107 | 14.7% | 13.3%(+1.40)#41 | 6.9%(+7.78)#1,767 |
| 42. | 89042 | 14.2% | 13.3%(+0.979)#42 | 6.9%(+7.36)#1,896 |
| 43. | 89044 | 14.2% | 13.3%(+0.890)#43 | 6.9%(+7.28)#1,915 |
| 44. | 89883 | 13.7% | 13.3%(+0.449)#44 | 6.9%(+6.83)#2,047 |
| 45. | 89166 | 13.7% | 13.3%(+0.387)#45 | 6.9%(+6.77)#2,070 |
| 46. | 89451 | 13.6% | 13.3%(+0.336)#46 | 6.9%(+6.72)#2,094 |
| 47. | 89027 | 13.5% | 13.3%(+0.252)#47 | 6.9%(+6.64)#2,130 |
| 48. | 89130 | 13.4% | 13.3%(+0.175)#48 | 6.9%(+6.56)#2,162 |
| 49. | 89502 | 13.1% | 13.3%(-0.184)#49 | 6.9%(+6.20)#2,313 |
| 50. | 89084 | 12.7% | 13.3%(-0.522)#50 | 6.9%(+5.86)#2,464 |
| 51. | 89031 | 12.7% | 13.3%(-0.541)#51 | 6.9%(+5.84)#2,473 |
| 52. | 89117 | 12.6% | 13.3%(-0.629)#52 | 6.9%(+5.76)#2,506 |
| 53. | 89128 | 12.5% | 13.3%(-0.728)#53 | 6.9%(+5.66)#2,568 |
| 54. | 89074 | 12.5% | 13.3%(-0.797)#54 | 6.9%(+5.59)#2,607 |
| 55. | 89014 | 12.1% | 13.3%(-1.12)#55 | 6.9%(+5.27)#2,752 |
| 56. | 89503 | 12.0% | 13.3%(-1.30)#56 | 6.9%(+5.08)#2,856 |
| 57. | 89021 | 11.9% | 13.3%(-1.38)#57 | 6.9%(+5.01)#2,912 |
| 58. | 89011 | 11.6% | 13.3%(-1.66)#58 | 6.9%(+4.73)#3,086 |
| 59. | 89025 | 11.6% | 13.3%(-1.68)#59 | 6.9%(+4.71)#3,100 |
| 60. | 89701 | 11.6% | 13.3%(-1.69)#60 | 6.9%(+4.70)#3,107 |
| 61. | 89081 | 11.3% | 13.3%(-1.96)#61 | 6.9%(+4.42)#3,318 |
| 62. | 89501 | 11.3% | 13.3%(-1.96)#62 | 6.9%(+4.42)#3,319 |
| 63. | 89512 | 11.1% | 13.3%(-2.14)#63 | 6.9%(+4.25)#3,447 |
| 64. | 89431 | 11.1% | 13.3%(-2.20)#64 | 6.9%(+4.18)#3,500 |
| 65. | 89129 | 11.0% | 13.3%(-2.29)#65 | 6.9%(+4.09)#3,575 |
| 66. | 89318 | 10.6% | 13.3%(-2.65)#66 | 6.9%(+3.73)#3,867 |
| 67. | 89018 | 10.5% | 13.3%(-2.75)#67 | 6.9%(+3.63)#3,979 |
| 68. | 89301 | 10.5% | 13.3%(-2.79)#68 | 6.9%(+3.60)#4,016 |
| 69. | 89444 | 10.4% | 13.3%(-2.84)#69 | 6.9%(+3.54)#4,082 |
| 70. | 89005 | 10.4% | 13.3%(-2.85)#70 | 6.9%(+3.54)#4,085 |
| 71. | 89149 | 10.2% | 13.3%(-3.12)#71 | 6.9%(+3.27)#4,353 |
| 72. | 89704 | 10.0% | 13.3%(-3.24)#72 | 6.9%(+3.15)#4,496 |
| 73. | 89019 | 10.0% | 13.3%(-3.24)#73 | 6.9%(+3.14)#4,508 |
| 74. | 89143 | 9.9% | 13.3%(-3.32)#74 | 6.9%(+3.06)#4,616 |
| 75. | 89002 | 9.9% | 13.3%(-3.37)#75 | 6.9%(+3.02)#4,665 |
| 76. | 89410 | 9.8% | 13.3%(-3.46)#76 | 6.9%(+2.93)#4,780 |
| 77. | 89052 | 9.8% | 13.3%(-3.50)#77 | 6.9%(+2.88)#4,838 |
| 78. | 89801 | 9.7% | 13.3%(-3.60)#78 | 6.9%(+2.78)#4,971 |
| 79. | 89131 | 9.6% | 13.3%(-3.67)#79 | 6.9%(+2.72)#5,069 |
| 80. | 89460 | 9.5% | 13.3%(-3.74)#80 | 6.9%(+2.64)#5,185 |
| 81. | 89134 | 9.4% | 13.3%(-3.91)#81 | 6.9%(+2.47)#5,415 |
| 82. | 89015 | 9.3% | 13.3%(-3.92)#82 | 6.9%(+2.46)#5,434 |
| 83. | 89314 | 9.2% | 13.3%(-4.06)#83 | 6.9%(+2.33)#5,636 |
| 84. | 89135 | 9.2% | 13.3%(-4.11)#84 | 6.9%(+2.28)#5,713 |
| 85. | 89048 | 9.0% | 13.3%(-4.23)#85 | 6.9%(+2.16)#5,899 |
| 86. | 89705 | 9.0% | 13.3%(-4.23)#86 | 6.9%(+2.15)#5,904 |
| 87. | 89061 | 8.8% | 13.3%(-4.46)#87 | 6.9%(+1.93)#6,266 |
| 88. | 89012 | 8.4% | 13.3%(-4.82)#88 | 6.9%(+1.56)#6,918 |
| 89. | 89445 | 8.0% | 13.3%(-5.23)#89 | 6.9%(+1.15)#7,757 |
| 90. | 89508 | 7.9% | 13.3%(-5.41)#90 | 6.9%(+0.980)#8,125 |
| 91. | 89124 | 7.6% | 13.3%(-5.70)#91 | 6.9%(+0.685)#8,814 |
| 92. | 89523 | 7.5% | 13.3%(-5.80)#92 | 6.9%(+0.587)#9,063 |
| 93. | 89433 | 7.4% | 13.3%(-5.82)#93 | 6.9%(+0.565)#9,118 |
| 94. | 89403 | 7.4% | 13.3%(-5.82)#94 | 6.9%(+0.562)#9,128 |
| 95. | 89408 | 7.4% | 13.3%(-5.84)#95 | 6.9%(+0.550)#9,167 |
| 96. | 89144 | 7.3% | 13.3%(-5.92)#96 | 6.9%(+0.463)#9,397 |
| 97. | 89047 | 7.3% | 13.3%(-5.98)#97 | 6.9%(+0.404)#9,579 |
| 98. | 89510 | 7.3% | 13.3%(-6.01)#98 | 6.9%(+0.373)#9,663 |
| 99. | 89703 | 7.2% | 13.3%(-6.06)#99 | 6.9%(+0.325)#9,797 |
| 100. | 89509 | 6.9% | 13.3%(-6.34)#100 | 6.9%(+0.047)#10,527 |
1
2Common Questions
What are the Top 10 Zip Codes with the Highest Percentage of Population Employed in Accommodation & Food Services in Nevada?
Top 10 Zip Codes with the Highest Percentage of Population Employed in Accommodation & Food Services in Nevada are:
What zip code has the Highest Percentage of Population Employed in Accommodation & Food Services in Nevada?
89315 has the Highest Percentage of Population Employed in Accommodation & Food Services in Nevada with 62.9%.
What is the Percentage of Population Employed in Accommodation & Food Services in the State of Nevada?
Percentage of Population Employed in Accommodation & Food Services in Nevada is 13.3%.
What is the Percentage of Population Employed in Accommodation & Food Services in the United States?
Percentage of Population Employed in Accommodation & Food Services in the United States is 6.9%.