Zip Codes with the Highest Percentage of Population Employed in Accommodation & Food Services in Port Arthur, TX
RELATED REPORTS & OPTIONS
Accommodation & Food Services
Port Arthur
Compare Zip Codes
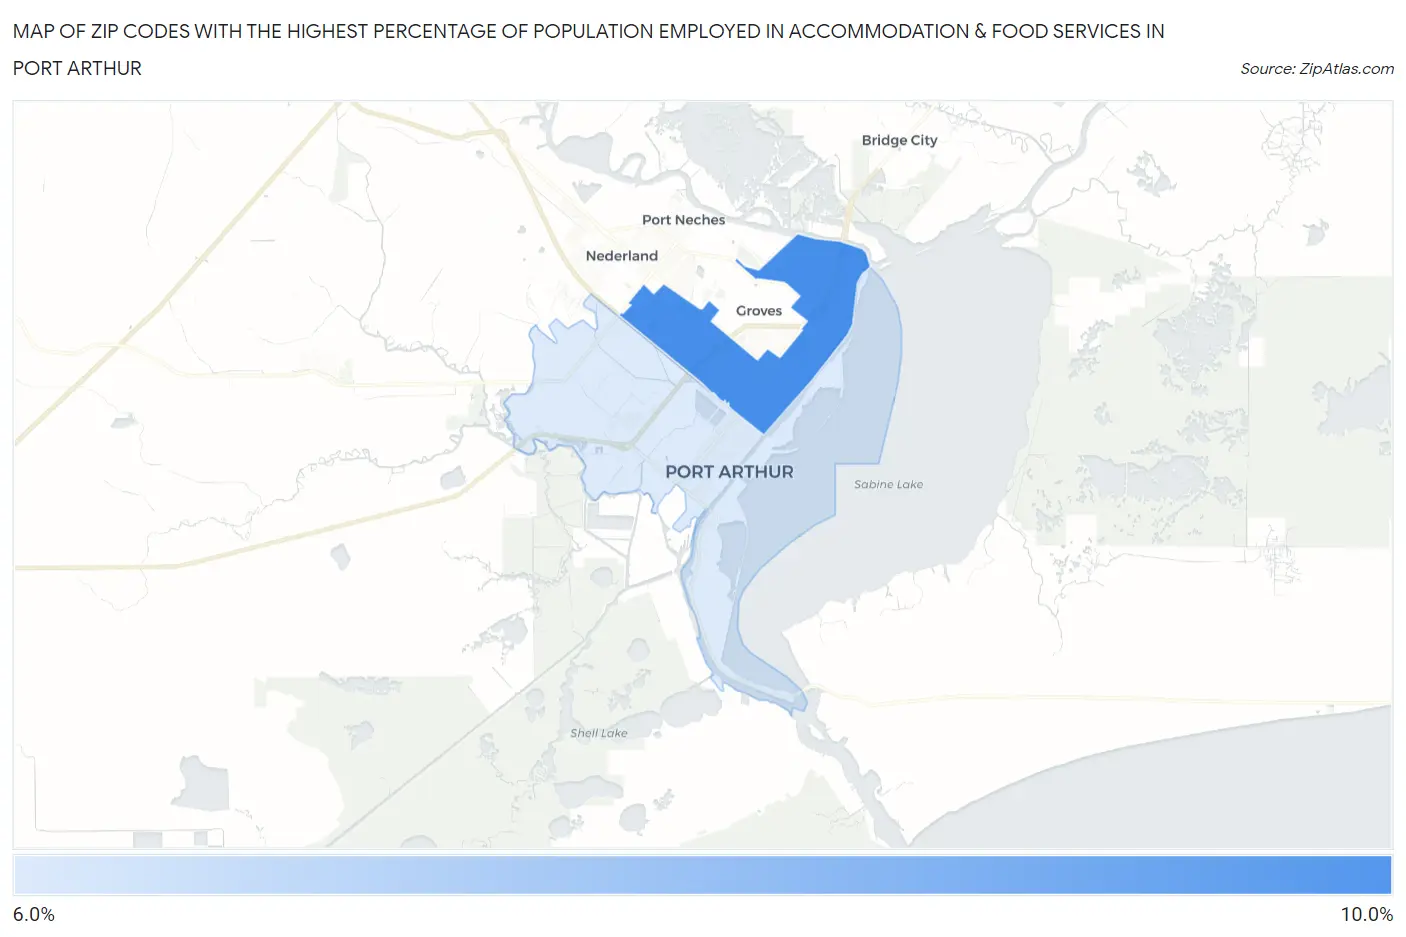
Map of Zip Codes with the Highest Percentage of Population Employed in Accommodation & Food Services in Port Arthur
6.9%
8.6%
Zip Codes with the Highest Percentage of Population Employed in Accommodation & Food Services in Port Arthur, TX
| Zip Code | % Employed | vs State | vs National | |
| 1. | 77642 | 8.6% | 7.2%(+1.43)#451 | 6.9%(+1.75)#6,571 |
| 2. | 77640 | 6.9% | 7.2%(-0.355)#749 | 6.9%(-0.030)#10,720 |
1
Common Questions
What are the Top Zip Codes with the Highest Percentage of Population Employed in Accommodation & Food Services in Port Arthur, TX?
Top Zip Codes with the Highest Percentage of Population Employed in Accommodation & Food Services in Port Arthur, TX are:
What zip code has the Highest Percentage of Population Employed in Accommodation & Food Services in Port Arthur, TX?
77642 has the Highest Percentage of Population Employed in Accommodation & Food Services in Port Arthur, TX with 8.6%.
What is the Percentage of Population Employed in Accommodation & Food Services in Port Arthur, TX?
Percentage of Population Employed in Accommodation & Food Services in Port Arthur is 8.0%.
What is the Percentage of Population Employed in Accommodation & Food Services in Texas?
Percentage of Population Employed in Accommodation & Food Services in Texas is 7.2%.
What is the Percentage of Population Employed in Accommodation & Food Services in the United States?
Percentage of Population Employed in Accommodation & Food Services in the United States is 6.9%.