Zip Codes with the Highest Percentage of Population Employed in Accommodation & Food Services in Temple, TX
RELATED REPORTS & OPTIONS
Accommodation & Food Services
Temple
Compare Zip Codes
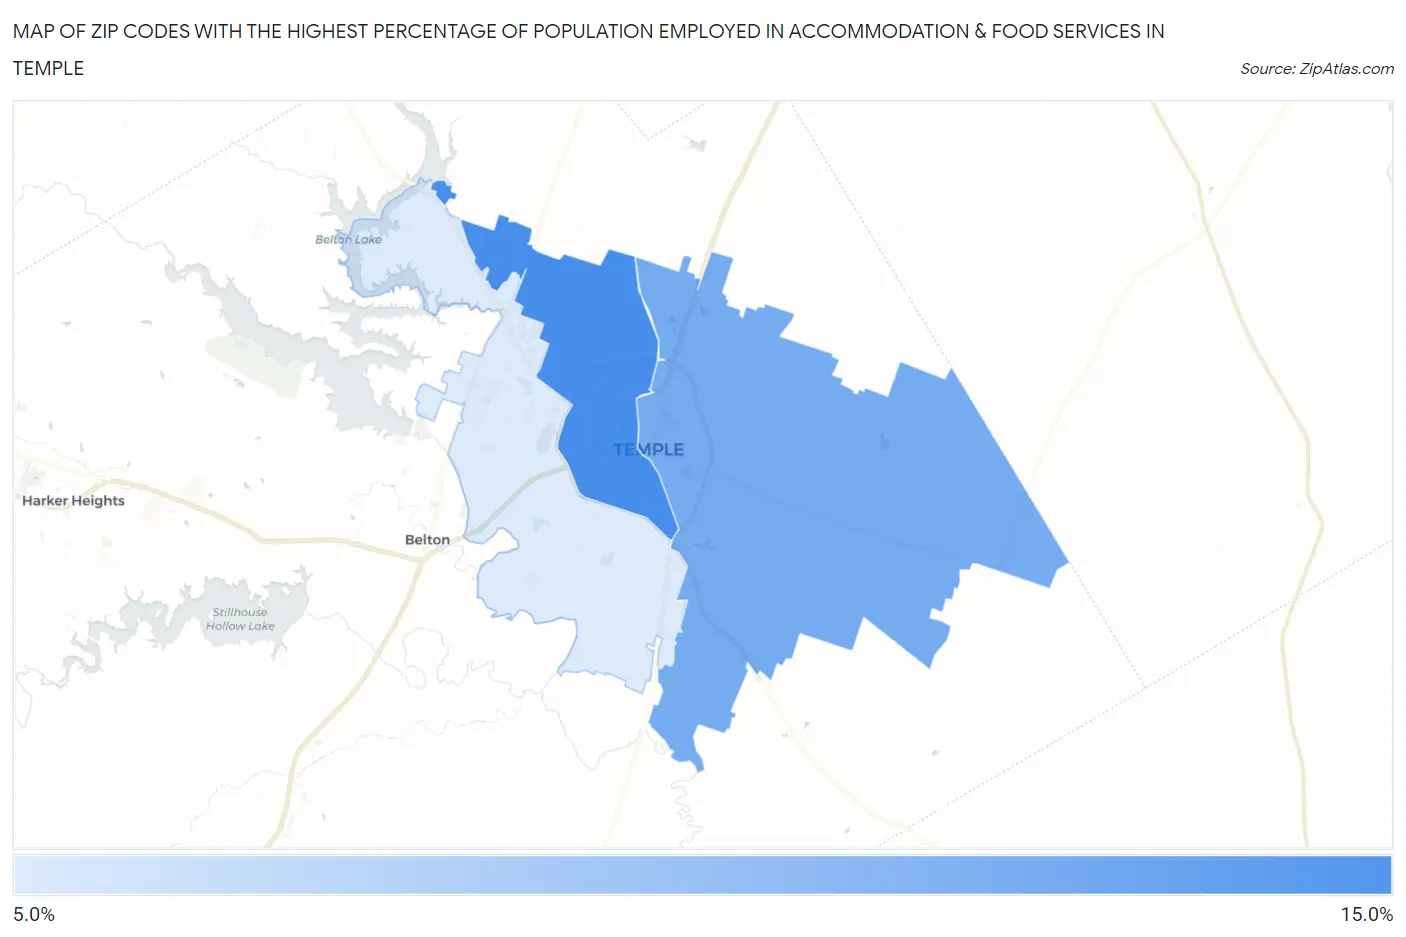
Map of Zip Codes with the Highest Percentage of Population Employed in Accommodation & Food Services in Temple
6.3%
10.4%
Zip Codes with the Highest Percentage of Population Employed in Accommodation & Food Services in Temple, TX
| Zip Code | % Employed | vs State | vs National | |
| 1. | 76504 | 10.4% | 7.2%(+3.22)#248 | 6.9%(+3.55)#4,071 |
| 2. | 76501 | 9.1% | 7.2%(+1.92)#380 | 6.9%(+2.25)#5,758 |
| 3. | 76502 | 6.3% | 7.2%(-0.885)#862 | 6.9%(-0.560)#12,414 |
1
Common Questions
What are the Top Zip Codes with the Highest Percentage of Population Employed in Accommodation & Food Services in Temple, TX?
Top Zip Codes with the Highest Percentage of Population Employed in Accommodation & Food Services in Temple, TX are:
What zip code has the Highest Percentage of Population Employed in Accommodation & Food Services in Temple, TX?
76504 has the Highest Percentage of Population Employed in Accommodation & Food Services in Temple, TX with 10.4%.
What is the Percentage of Population Employed in Accommodation & Food Services in Temple, TX?
Percentage of Population Employed in Accommodation & Food Services in Temple is 8.6%.
What is the Percentage of Population Employed in Accommodation & Food Services in Texas?
Percentage of Population Employed in Accommodation & Food Services in Texas is 7.2%.
What is the Percentage of Population Employed in Accommodation & Food Services in the United States?
Percentage of Population Employed in Accommodation & Food Services in the United States is 6.9%.