Zip Codes with the Highest Percentage of Population Employed in Accommodation & Food Services in Allen, TX
RELATED REPORTS & OPTIONS
Accommodation & Food Services
Allen
Compare Zip Codes
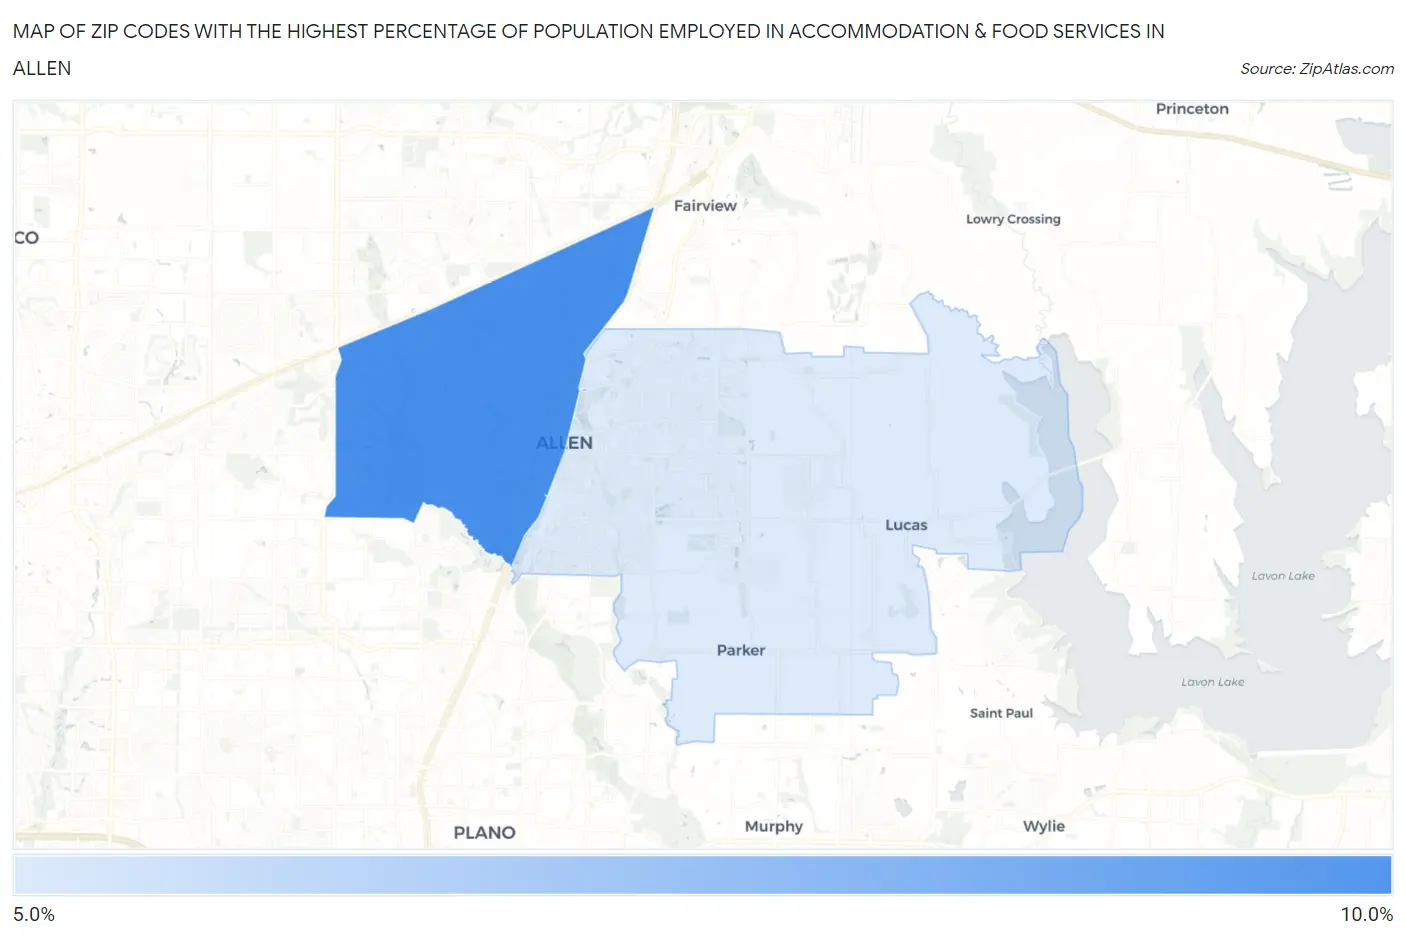
Map of Zip Codes with the Highest Percentage of Population Employed in Accommodation & Food Services in Allen
5.0%
8.8%
Zip Codes with the Highest Percentage of Population Employed in Accommodation & Food Services in Allen, TX
| Zip Code | % Employed | vs State | vs National | |
| 1. | 75013 | 8.8% | 7.2%(+1.55)#433 | 6.9%(+1.88)#6,380 |
| 2. | 75002 | 5.0% | 7.2%(-2.20)#1,088 | 6.9%(-1.88)#16,814 |
1
Common Questions
What are the Top Zip Codes with the Highest Percentage of Population Employed in Accommodation & Food Services in Allen, TX?
Top Zip Codes with the Highest Percentage of Population Employed in Accommodation & Food Services in Allen, TX are:
What zip code has the Highest Percentage of Population Employed in Accommodation & Food Services in Allen, TX?
75013 has the Highest Percentage of Population Employed in Accommodation & Food Services in Allen, TX with 8.8%.
What is the Percentage of Population Employed in Accommodation & Food Services in Allen, TX?
Percentage of Population Employed in Accommodation & Food Services in Allen is 7.0%.
What is the Percentage of Population Employed in Accommodation & Food Services in Texas?
Percentage of Population Employed in Accommodation & Food Services in Texas is 7.2%.
What is the Percentage of Population Employed in Accommodation & Food Services in the United States?
Percentage of Population Employed in Accommodation & Food Services in the United States is 6.9%.