Zip Codes with the Highest Percentage of Population Employed in Accommodation & Food Services in Weatherford, TX
RELATED REPORTS & OPTIONS
Accommodation & Food Services
Weatherford
Compare Zip Codes
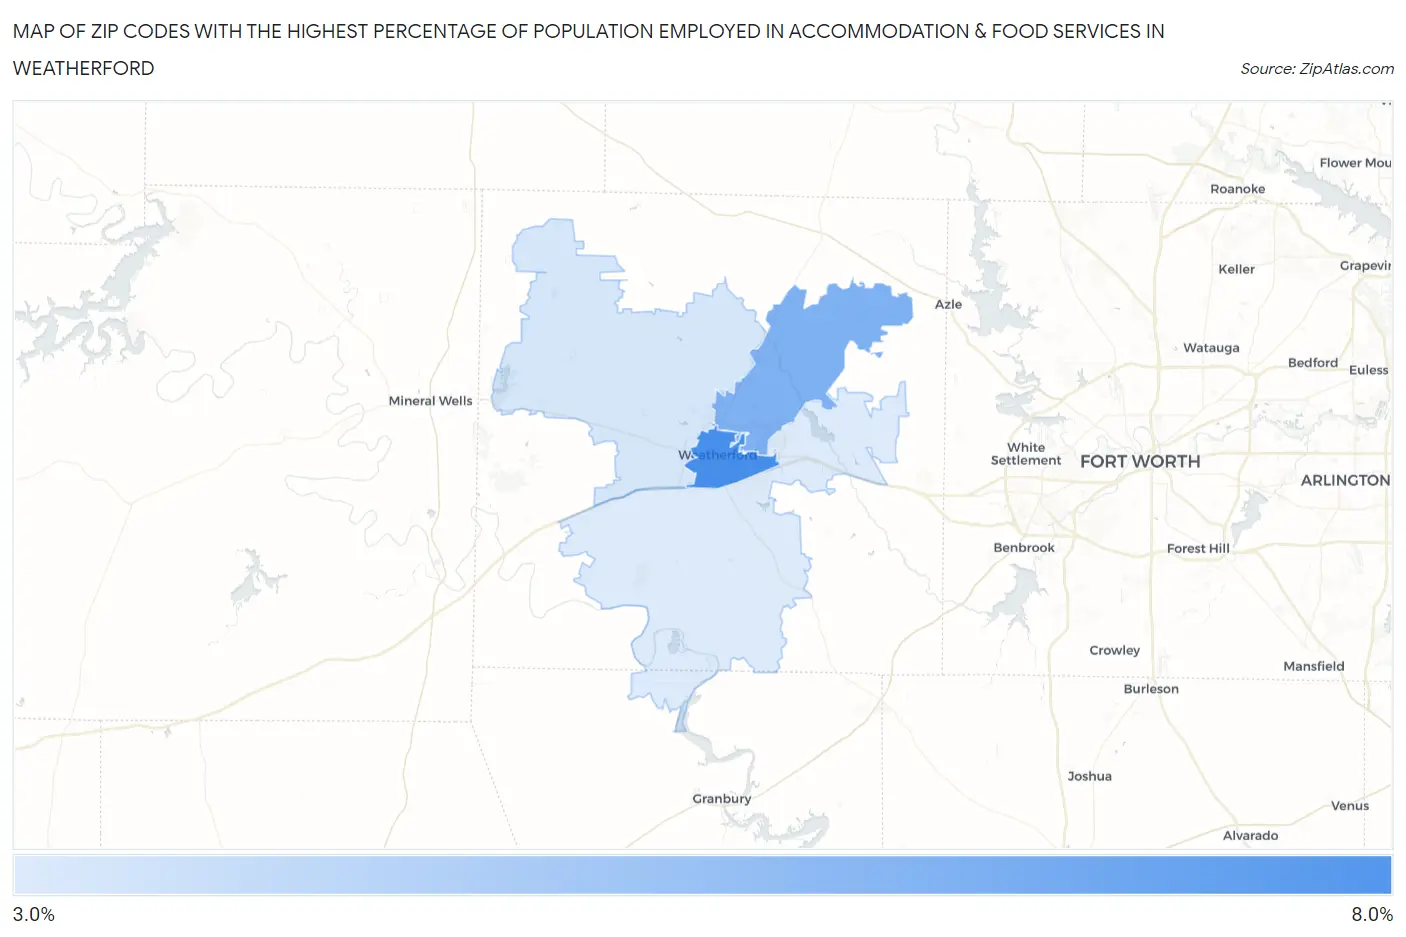
Map of Zip Codes with the Highest Percentage of Population Employed in Accommodation & Food Services in Weatherford
3.1%
7.2%
Zip Codes with the Highest Percentage of Population Employed in Accommodation & Food Services in Weatherford, TX
| Zip Code | % Employed | vs State | vs National | |
| 1. | 76086 | 7.2% | 7.2%(-0.049)#698 | 6.9%(+0.276)#9,905 |
| 2. | 76085 | 5.6% | 7.2%(-1.60)#985 | 6.9%(-1.27)#14,668 |
| 3. | 76088 | 3.2% | 7.2%(-3.98)#1,406 | 6.9%(-3.65)#22,618 |
| 4. | 76087 | 3.1% | 7.2%(-4.13)#1,422 | 6.9%(-3.81)#23,022 |
1
Common Questions
What are the Top 3 Zip Codes with the Highest Percentage of Population Employed in Accommodation & Food Services in Weatherford, TX?
Top 3 Zip Codes with the Highest Percentage of Population Employed in Accommodation & Food Services in Weatherford, TX are:
What zip code has the Highest Percentage of Population Employed in Accommodation & Food Services in Weatherford, TX?
76086 has the Highest Percentage of Population Employed in Accommodation & Food Services in Weatherford, TX with 7.2%.
What is the Percentage of Population Employed in Accommodation & Food Services in Weatherford, TX?
Percentage of Population Employed in Accommodation & Food Services in Weatherford is 6.3%.
What is the Percentage of Population Employed in Accommodation & Food Services in Texas?
Percentage of Population Employed in Accommodation & Food Services in Texas is 7.2%.
What is the Percentage of Population Employed in Accommodation & Food Services in the United States?
Percentage of Population Employed in Accommodation & Food Services in the United States is 6.9%.