Zip Codes with the Highest Percentage of Population Employed in Accommodation & Food Services in College Station, TX
RELATED REPORTS & OPTIONS
Accommodation & Food Services
College Station
Compare Zip Codes
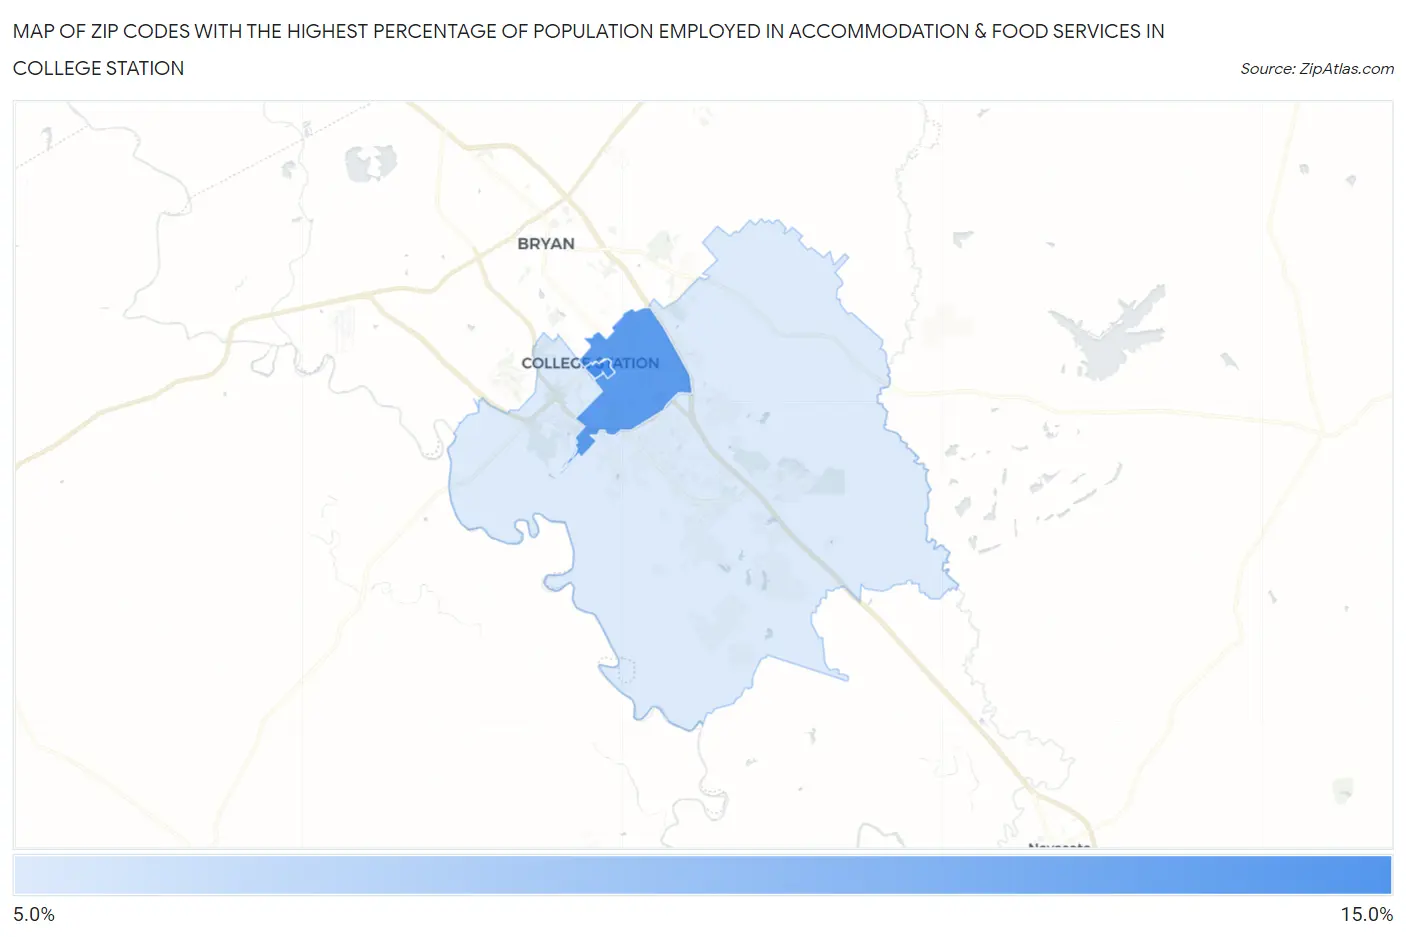
Map of Zip Codes with the Highest Percentage of Population Employed in Accommodation & Food Services in College Station
6.6%
14.3%
Zip Codes with the Highest Percentage of Population Employed in Accommodation & Food Services in College Station, TX
| Zip Code | % Employed | vs State | vs National | |
| 1. | 77843 | 14.3% | 7.2%(+7.10)#97 | 6.9%(+7.42)#1,871 |
| 2. | 77840 | 13.4% | 7.2%(+6.16)#118 | 6.9%(+6.48)#2,195 |
| 3. | 77845 | 6.6% | 7.2%(-0.613)#799 | 6.9%(-0.288)#11,543 |
1
Common Questions
What are the Top Zip Codes with the Highest Percentage of Population Employed in Accommodation & Food Services in College Station, TX?
Top Zip Codes with the Highest Percentage of Population Employed in Accommodation & Food Services in College Station, TX are:
What zip code has the Highest Percentage of Population Employed in Accommodation & Food Services in College Station, TX?
77843 has the Highest Percentage of Population Employed in Accommodation & Food Services in College Station, TX with 14.3%.
What is the Percentage of Population Employed in Accommodation & Food Services in College Station, TX?
Percentage of Population Employed in Accommodation & Food Services in College Station is 10.2%.
What is the Percentage of Population Employed in Accommodation & Food Services in Texas?
Percentage of Population Employed in Accommodation & Food Services in Texas is 7.2%.
What is the Percentage of Population Employed in Accommodation & Food Services in the United States?
Percentage of Population Employed in Accommodation & Food Services in the United States is 6.9%.