Zip Codes with the Highest Percentage of Population Employed in Accommodation & Food Services in Florida
RELATED REPORTS & OPTIONS
Accommodation & Food Services
Florida
Compare Zip Codes
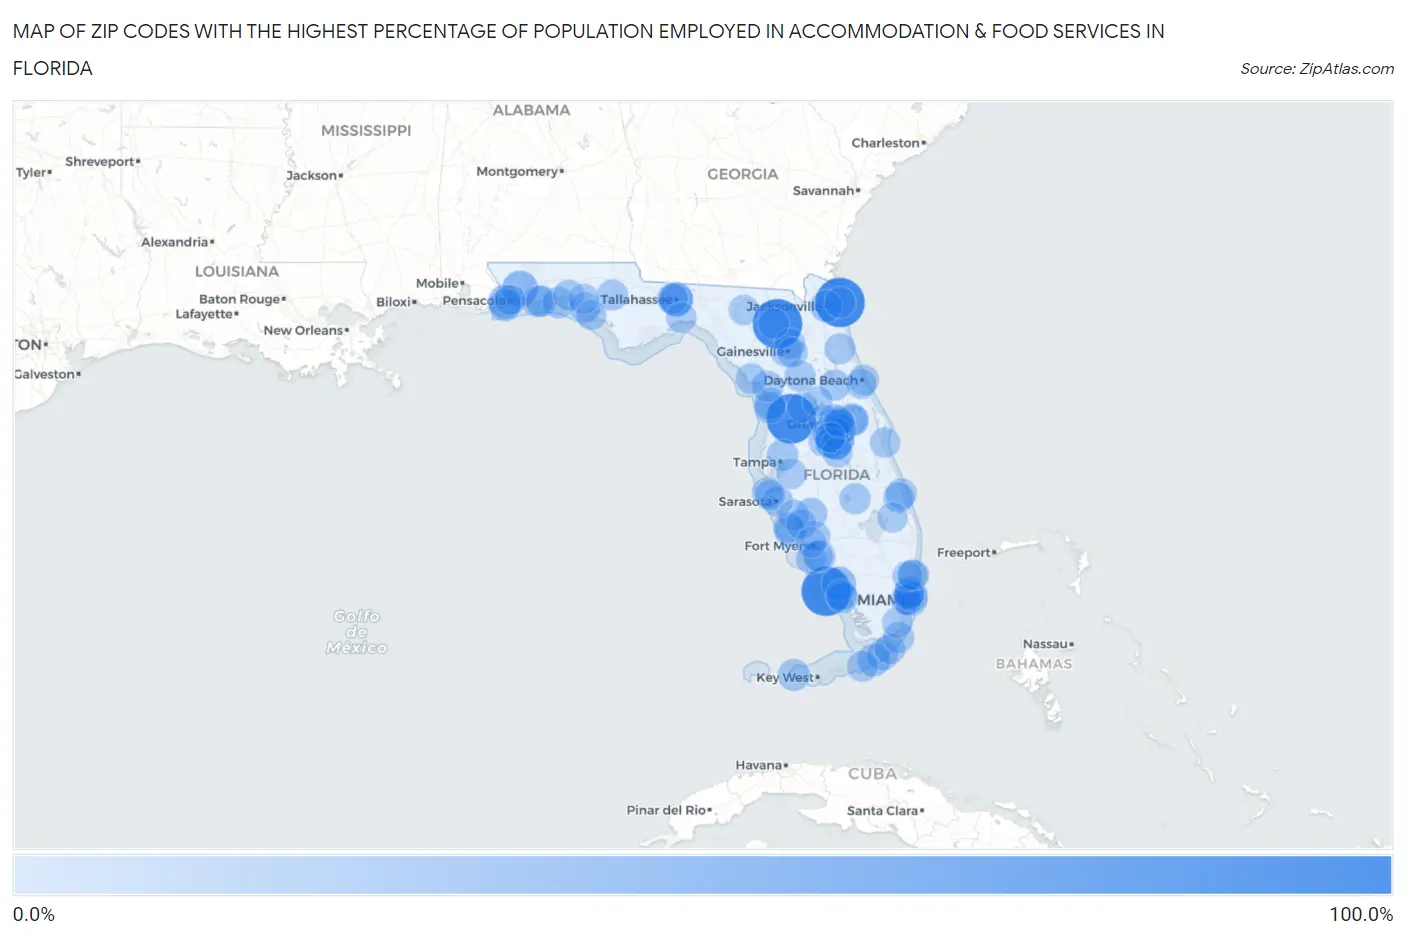
Map of Zip Codes with the Highest Percentage of Population Employed in Accommodation & Food Services in Florida
0.0%
100.0%
Zip Codes with the Highest Percentage of Population Employed in Accommodation & Food Services in Florida
| Zip Code | % Employed | vs State | vs National | |
| 1. | 34661 | 100.0% | 8.4%(+91.6)#1 | 6.9%(+93.1)#3 |
| 2. | 32228 | 100.0% | 8.4%(+91.6)#2 | 6.9%(+93.1)#4 |
| 3. | 34140 | 100.0% | 8.4%(+91.6)#3 | 6.9%(+93.1)#8 |
| 4. | 32061 | 100.0% | 8.4%(+91.6)#4 | 6.9%(+93.1)#15 |
| 5. | 33848 | 48.0% | 8.4%(+39.6)#5 | 6.9%(+41.1)#108 |
| 6. | 32830 | 42.5% | 8.4%(+34.1)#6 | 6.9%(+35.6)#147 |
| 7. | 32530 | 38.1% | 8.4%(+29.7)#7 | 6.9%(+31.2)#179 |
| 8. | 34137 | 30.9% | 8.4%(+22.5)#8 | 6.9%(+24.0)#304 |
| 9. | 32306 | 28.4% | 8.4%(+20.0)#9 | 6.9%(+21.5)#373 |
| 10. | 32511 | 26.2% | 8.4%(+17.8)#10 | 6.9%(+19.3)#454 |
| 11. | 32307 | 25.7% | 8.4%(+17.3)#11 | 6.9%(+18.8)#473 |
| 12. | 33001 | 24.3% | 8.4%(+16.0)#12 | 6.9%(+17.4)#540 |
| 13. | 32816 | 24.3% | 8.4%(+15.9)#13 | 6.9%(+17.4)#545 |
| 14. | 32508 | 22.9% | 8.4%(+14.5)#14 | 6.9%(+16.0)#621 |
| 15. | 33139 | 22.4% | 8.4%(+14.0)#15 | 6.9%(+15.5)#653 |
| 16. | 34268 | 20.5% | 8.4%(+12.2)#16 | 6.9%(+13.7)#782 |
| 17. | 32202 | 20.1% | 8.4%(+11.8)#17 | 6.9%(+13.3)#818 |
| 18. | 33040 | 20.1% | 8.4%(+11.7)#18 | 6.9%(+13.2)#820 |
| 19. | 34429 | 18.8% | 8.4%(+10.4)#19 | 6.9%(+11.9)#977 |
| 20. | 32550 | 18.7% | 8.4%(+10.3)#20 | 6.9%(+11.8)#981 |
| 21. | 32569 | 18.7% | 8.4%(+10.3)#21 | 6.9%(+11.8)#991 |
| 22. | 33620 | 18.6% | 8.4%(+10.2)#22 | 6.9%(+11.7)#1,008 |
| 23. | 33946 | 18.4% | 8.4%(+10.00)#23 | 6.9%(+11.5)#1,037 |
| 24. | 32839 | 18.3% | 8.4%(+9.92)#24 | 6.9%(+11.4)#1,049 |
| 25. | 32603 | 18.1% | 8.4%(+9.75)#25 | 6.9%(+11.2)#1,072 |
| 26. | 33161 | 17.9% | 8.4%(+9.54)#26 | 6.9%(+11.0)#1,112 |
| 27. | 32548 | 17.9% | 8.4%(+9.52)#27 | 6.9%(+11.0)#1,116 |
| 28. | 34448 | 17.6% | 8.4%(+9.22)#28 | 6.9%(+10.7)#1,165 |
| 29. | 34138 | 17.4% | 8.4%(+9.07)#29 | 6.9%(+10.6)#1,192 |
| 30. | 33965 | 17.3% | 8.4%(+8.94)#30 | 6.9%(+10.4)#1,211 |
| 31. | 34449 | 17.3% | 8.4%(+8.88)#31 | 6.9%(+10.4)#1,225 |
| 32. | 34479 | 17.2% | 8.4%(+8.85)#32 | 6.9%(+10.3)#1,231 |
| 33. | 34139 | 17.1% | 8.4%(+8.74)#33 | 6.9%(+10.2)#1,246 |
| 34. | 33857 | 16.9% | 8.4%(+8.56)#34 | 6.9%(+10.0)#1,280 |
| 35. | 32438 | 16.8% | 8.4%(+8.45)#35 | 6.9%(+9.94)#1,293 |
| 36. | 33036 | 16.6% | 8.4%(+8.20)#36 | 6.9%(+9.69)#1,332 |
| 37. | 32625 | 16.6% | 8.4%(+8.19)#37 | 6.9%(+9.68)#1,336 |
| 38. | 34741 | 16.5% | 8.4%(+8.17)#38 | 6.9%(+9.66)#1,344 |
| 39. | 34950 | 16.5% | 8.4%(+8.16)#39 | 6.9%(+9.65)#1,346 |
| 40. | 32145 | 16.4% | 8.4%(+8.02)#40 | 6.9%(+9.50)#1,369 |
| 41. | 32227 | 16.4% | 8.4%(+7.99)#41 | 6.9%(+9.47)#1,376 |
| 42. | 33037 | 16.3% | 8.4%(+7.95)#42 | 6.9%(+9.43)#1,384 |
| 43. | 34734 | 16.2% | 8.4%(+7.85)#43 | 6.9%(+9.34)#1,406 |
| 44. | 33051 | 16.2% | 8.4%(+7.80)#44 | 6.9%(+9.28)#1,414 |
| 45. | 32818 | 16.1% | 8.4%(+7.73)#45 | 6.9%(+9.22)#1,430 |
| 46. | 32102 | 16.0% | 8.4%(+7.67)#46 | 6.9%(+9.16)#1,446 |
| 47. | 34215 | 16.0% | 8.4%(+7.65)#47 | 6.9%(+9.14)#1,450 |
| 48. | 34291 | 15.9% | 8.4%(+7.55)#48 | 6.9%(+9.03)#1,471 |
| 49. | 34237 | 15.8% | 8.4%(+7.46)#49 | 6.9%(+8.95)#1,488 |
| 50. | 32304 | 15.7% | 8.4%(+7.30)#50 | 6.9%(+8.79)#1,522 |
| 51. | 34981 | 15.6% | 8.4%(+7.27)#51 | 6.9%(+8.76)#1,530 |
| 52. | 33070 | 15.5% | 8.4%(+7.11)#52 | 6.9%(+8.60)#1,559 |
| 53. | 32821 | 15.5% | 8.4%(+7.10)#53 | 6.9%(+8.58)#1,563 |
| 54. | 32439 | 15.4% | 8.4%(+7.03)#54 | 6.9%(+8.52)#1,575 |
| 55. | 33931 | 15.3% | 8.4%(+6.95)#55 | 6.9%(+8.44)#1,598 |
| 56. | 33035 | 15.2% | 8.4%(+6.84)#56 | 6.9%(+8.33)#1,622 |
| 57. | 33168 | 15.2% | 8.4%(+6.82)#57 | 6.9%(+8.31)#1,626 |
| 58. | 34224 | 15.2% | 8.4%(+6.79)#58 | 6.9%(+8.28)#1,633 |
| 59. | 33306 | 15.1% | 8.4%(+6.74)#59 | 6.9%(+8.23)#1,643 |
| 60. | 33141 | 15.1% | 8.4%(+6.70)#60 | 6.9%(+8.19)#1,653 |
| 61. | 32609 | 15.1% | 8.4%(+6.69)#61 | 6.9%(+8.18)#1,657 |
| 62. | 32025 | 14.9% | 8.4%(+6.57)#62 | 6.9%(+8.06)#1,684 |
| 63. | 34756 | 14.9% | 8.4%(+6.51)#63 | 6.9%(+8.00)#1,708 |
| 64. | 33136 | 14.8% | 8.4%(+6.42)#64 | 6.9%(+7.90)#1,733 |
| 65. | 32501 | 14.7% | 8.4%(+6.38)#65 | 6.9%(+7.87)#1,747 |
| 66. | 32835 | 14.7% | 8.4%(+6.34)#66 | 6.9%(+7.82)#1,759 |
| 67. | 32413 | 14.7% | 8.4%(+6.32)#67 | 6.9%(+7.81)#1,761 |
| 68. | 32819 | 14.6% | 8.4%(+6.28)#68 | 6.9%(+7.77)#1,773 |
| 69. | 33125 | 14.6% | 8.4%(+6.26)#69 | 6.9%(+7.75)#1,782 |
| 70. | 33897 | 14.6% | 8.4%(+6.21)#70 | 6.9%(+7.70)#1,796 |
| 71. | 32837 | 14.6% | 8.4%(+6.18)#71 | 6.9%(+7.67)#1,804 |
| 72. | 32118 | 14.5% | 8.4%(+6.17)#72 | 6.9%(+7.66)#1,808 |
| 73. | 33967 | 14.5% | 8.4%(+6.08)#73 | 6.9%(+7.57)#1,829 |
| 74. | 32826 | 14.3% | 8.4%(+5.96)#74 | 6.9%(+7.45)#1,860 |
| 75. | 32809 | 14.3% | 8.4%(+5.95)#75 | 6.9%(+7.44)#1,866 |
| 76. | 32836 | 14.1% | 8.4%(+5.77)#76 | 6.9%(+7.25)#1,925 |
| 77. | 32355 | 14.1% | 8.4%(+5.75)#77 | 6.9%(+7.24)#1,932 |
| 78. | 33150 | 13.9% | 8.4%(+5.57)#78 | 6.9%(+7.06)#1,993 |
| 79. | 33896 | 13.8% | 8.4%(+5.42)#79 | 6.9%(+6.91)#2,029 |
| 80. | 33917 | 13.8% | 8.4%(+5.41)#80 | 6.9%(+6.90)#2,031 |
| 81. | 33313 | 13.7% | 8.4%(+5.35)#81 | 6.9%(+6.84)#2,046 |
| 82. | 32119 | 13.7% | 8.4%(+5.32)#82 | 6.9%(+6.81)#2,057 |
| 83. | 33503 | 13.7% | 8.4%(+5.31)#83 | 6.9%(+6.80)#2,060 |
| 84. | 33952 | 13.6% | 8.4%(+5.27)#84 | 6.9%(+6.76)#2,074 |
| 85. | 32437 | 13.6% | 8.4%(+5.27)#85 | 6.9%(+6.76)#2,077 |
| 86. | 34210 | 13.6% | 8.4%(+5.23)#86 | 6.9%(+6.72)#2,095 |
| 87. | 32064 | 13.5% | 8.4%(+5.15)#87 | 6.9%(+6.64)#2,127 |
| 88. | 34758 | 13.5% | 8.4%(+5.14)#88 | 6.9%(+6.62)#2,140 |
| 89. | 34956 | 13.5% | 8.4%(+5.08)#89 | 6.9%(+6.57)#2,157 |
| 90. | 32925 | 13.5% | 8.4%(+5.08)#90 | 6.9%(+6.57)#2,158 |
| 91. | 32805 | 13.4% | 8.4%(+5.05)#91 | 6.9%(+6.54)#2,175 |
| 92. | 34759 | 13.4% | 8.4%(+5.01)#92 | 6.9%(+6.50)#2,188 |
| 93. | 32641 | 13.4% | 8.4%(+4.99)#93 | 6.9%(+6.48)#2,196 |
| 94. | 32407 | 13.3% | 8.4%(+4.97)#94 | 6.9%(+6.46)#2,203 |
| 95. | 33521 | 13.3% | 8.4%(+4.94)#95 | 6.9%(+6.43)#2,221 |
| 96. | 34788 | 13.3% | 8.4%(+4.90)#96 | 6.9%(+6.39)#2,240 |
| 97. | 33334 | 13.1% | 8.4%(+4.71)#97 | 6.9%(+6.20)#2,314 |
| 98. | 32808 | 13.1% | 8.4%(+4.71)#98 | 6.9%(+6.20)#2,315 |
| 99. | 33903 | 13.1% | 8.4%(+4.69)#99 | 6.9%(+6.18)#2,322 |
| 100. | 34747 | 13.0% | 8.4%(+4.63)#100 | 6.9%(+6.12)#2,347 |
Common Questions
What are the Top 10 Zip Codes with the Highest Percentage of Population Employed in Accommodation & Food Services in Florida?
Top 10 Zip Codes with the Highest Percentage of Population Employed in Accommodation & Food Services in Florida are:
What zip code has the Highest Percentage of Population Employed in Accommodation & Food Services in Florida?
34661 has the Highest Percentage of Population Employed in Accommodation & Food Services in Florida with 100.0%.
What is the Percentage of Population Employed in Accommodation & Food Services in the State of Florida?
Percentage of Population Employed in Accommodation & Food Services in Florida is 8.4%.
What is the Percentage of Population Employed in Accommodation & Food Services in the United States?
Percentage of Population Employed in Accommodation & Food Services in the United States is 6.9%.