Zip Codes with the Highest Percentage of Population Employed in Accommodation & Food Services in Henderson, TX
RELATED REPORTS & OPTIONS
Accommodation & Food Services
Henderson
Compare Zip Codes
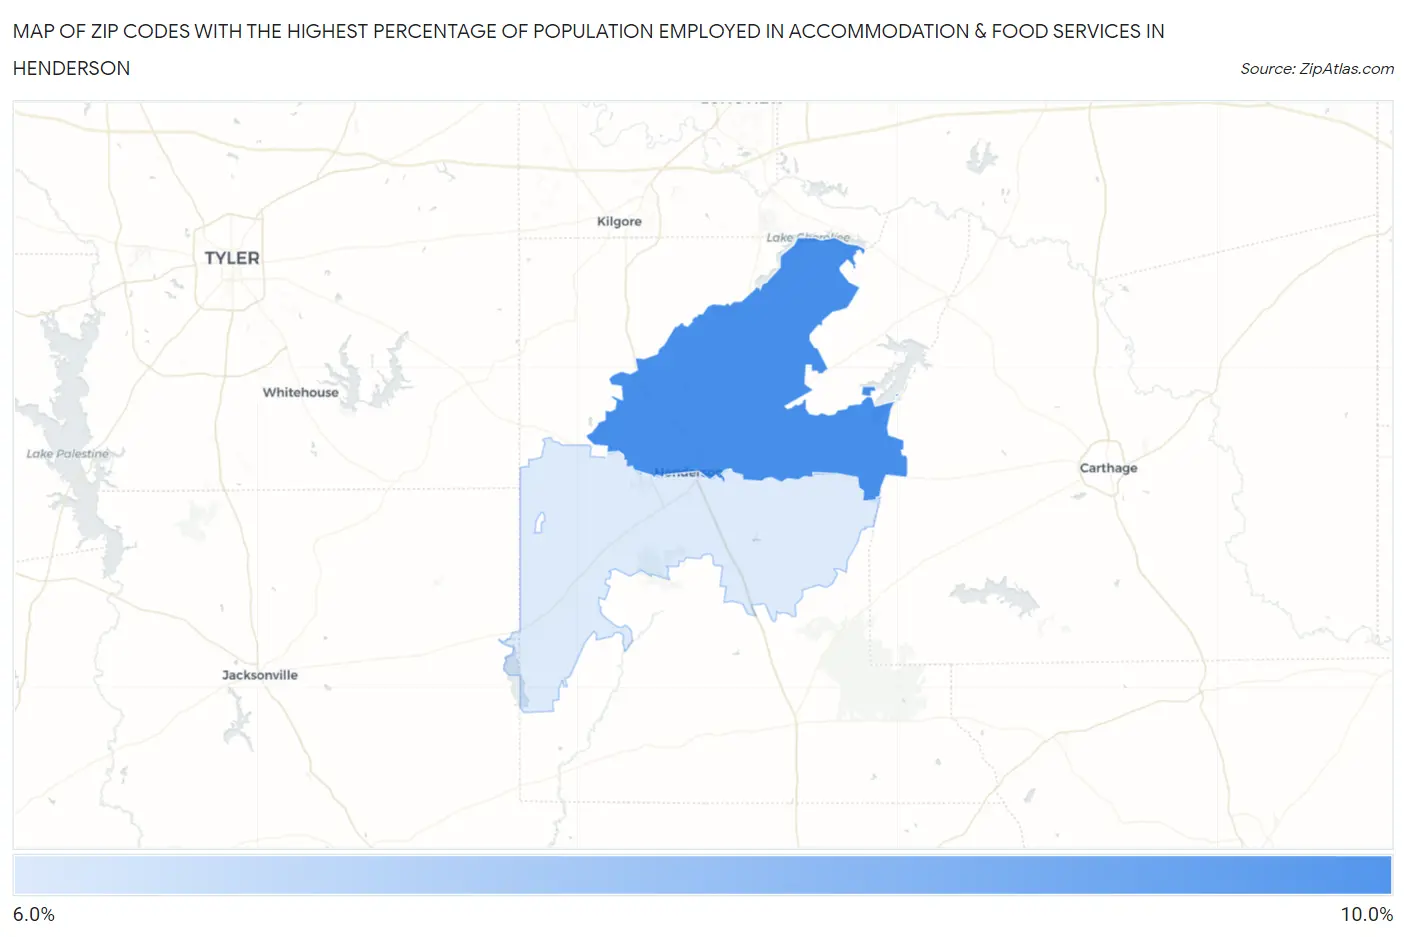
Map of Zip Codes with the Highest Percentage of Population Employed in Accommodation & Food Services in Henderson
6.4%
8.1%
Zip Codes with the Highest Percentage of Population Employed in Accommodation & Food Services in Henderson, TX
| Zip Code | % Employed | vs State | vs National | |
| 1. | 75652 | 8.1% | 7.2%(+0.866)#549 | 6.9%(+1.19)#7,681 |
| 2. | 75654 | 6.4% | 7.2%(-0.846)#854 | 6.9%(-0.521)#12,292 |
1
Common Questions
What are the Top Zip Codes with the Highest Percentage of Population Employed in Accommodation & Food Services in Henderson, TX?
Top Zip Codes with the Highest Percentage of Population Employed in Accommodation & Food Services in Henderson, TX are:
What zip code has the Highest Percentage of Population Employed in Accommodation & Food Services in Henderson, TX?
75652 has the Highest Percentage of Population Employed in Accommodation & Food Services in Henderson, TX with 8.1%.
What is the Percentage of Population Employed in Accommodation & Food Services in Henderson, TX?
Percentage of Population Employed in Accommodation & Food Services in Henderson is 10.1%.
What is the Percentage of Population Employed in Accommodation & Food Services in Texas?
Percentage of Population Employed in Accommodation & Food Services in Texas is 7.2%.
What is the Percentage of Population Employed in Accommodation & Food Services in the United States?
Percentage of Population Employed in Accommodation & Food Services in the United States is 6.9%.