Oak Grove, TX Map & Demographics
Oak Grove Map
Oak Grove Overview
$45,648
PER CAPITA INCOME
$121,667
AVG FAMILY INCOME
$107,500
AVG HOUSEHOLD INCOME
39.3%
WAGE / INCOME GAP [ % ]
60.7¢/ $1
WAGE / INCOME GAP [ $ ]
0.33
INEQUALITY / GINI INDEX
620
TOTAL POPULATION
347
MALE POPULATION
273
FEMALE POPULATION
127.11
MALES / 100 FEMALES
78.67
FEMALES / 100 MALES
52.0
MEDIAN AGE
2.7
AVG FAMILY SIZE
2.5
AVG HOUSEHOLD SIZE
313
LABOR FORCE [ PEOPLE ]
64.0%
PERCENT IN LABOR FORCE
Income in Oak Grove
Income Overview in Oak Grove
Per Capita Income in Oak Grove is $45,648, while median incomes of families and households are $121,667 and $107,500 respectively.
| Characteristic | Number | Measure |
| Per Capita Income | 620 | $45,648 |
| Median Family Income | 210 | $121,667 |
| Mean Family Income | 210 | $137,873 |
| Median Household Income | 252 | $107,500 |
| Mean Household Income | 252 | $123,526 |
| Income Deficit | 210 | $0 |
| Wage / Income Gap (%) | 620 | 39.25% |
| Wage / Income Gap ($) | 620 | 60.75¢ per $1 |
| Gini / Inequality Index | 620 | 0.33 |
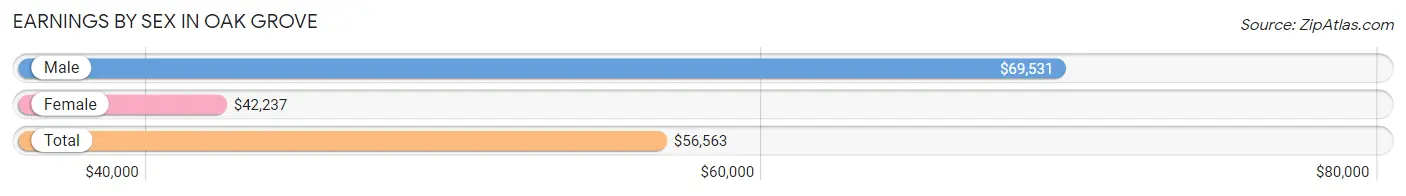
Earnings by Sex in Oak Grove
Average Earnings in Oak Grove are $56,563, $69,531 for men and $42,237 for women, a difference of 39.3%.
| Sex | Number | Average Earnings |
| Male | 187 (56.2%) | $69,531 |
| Female | 146 (43.8%) | $42,237 |
| Total | 333 (100.0%) | $56,563 |
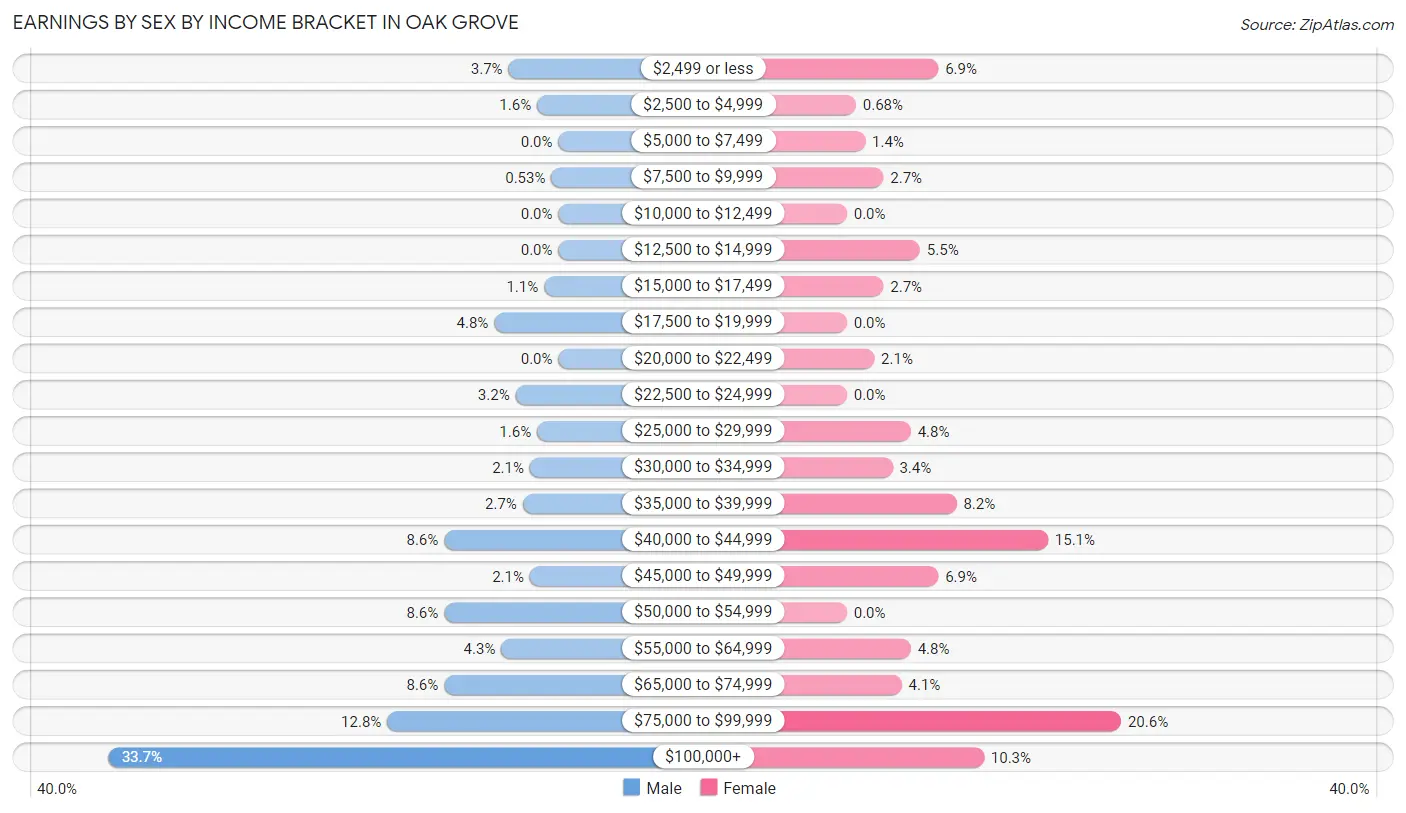
Earnings by Sex by Income Bracket in Oak Grove
The most common earnings brackets in Oak Grove are $100,000+ for men (63 | 33.7%) and $75,000 to $99,999 for women (30 | 20.5%).
| Income | Male | Female |
| $2,499 or less | 7 (3.7%) | 10 (6.9%) |
| $2,500 to $4,999 | 3 (1.6%) | 1 (0.7%) |
| $5,000 to $7,499 | 0 (0.0%) | 2 (1.4%) |
| $7,500 to $9,999 | 1 (0.5%) | 4 (2.7%) |
| $10,000 to $12,499 | 0 (0.0%) | 0 (0.0%) |
| $12,500 to $14,999 | 0 (0.0%) | 8 (5.5%) |
| $15,000 to $17,499 | 2 (1.1%) | 4 (2.7%) |
| $17,500 to $19,999 | 9 (4.8%) | 0 (0.0%) |
| $20,000 to $22,499 | 0 (0.0%) | 3 (2.1%) |
| $22,500 to $24,999 | 6 (3.2%) | 0 (0.0%) |
| $25,000 to $29,999 | 3 (1.6%) | 7 (4.8%) |
| $30,000 to $34,999 | 4 (2.1%) | 5 (3.4%) |
| $35,000 to $39,999 | 5 (2.7%) | 12 (8.2%) |
| $40,000 to $44,999 | 16 (8.6%) | 22 (15.1%) |
| $45,000 to $49,999 | 4 (2.1%) | 10 (6.9%) |
| $50,000 to $54,999 | 16 (8.6%) | 0 (0.0%) |
| $55,000 to $64,999 | 8 (4.3%) | 7 (4.8%) |
| $65,000 to $74,999 | 16 (8.6%) | 6 (4.1%) |
| $75,000 to $99,999 | 24 (12.8%) | 30 (20.5%) |
| $100,000+ | 63 (33.7%) | 15 (10.3%) |
| Total | 187 (100.0%) | 146 (100.0%) |
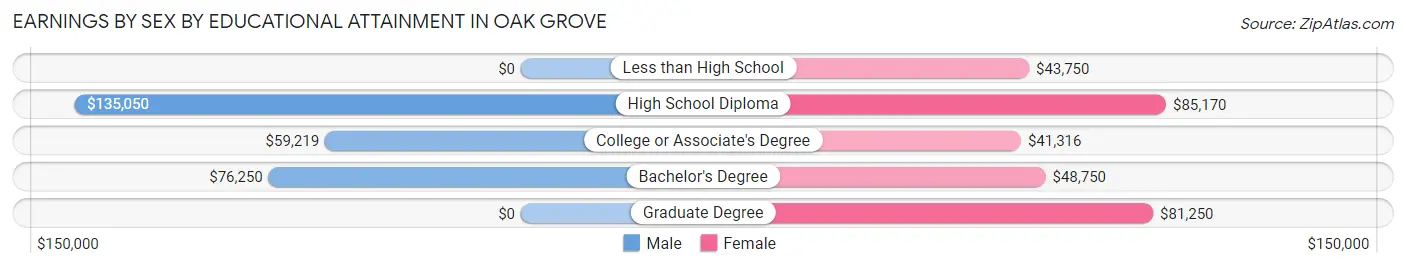
Earnings by Sex by Educational Attainment in Oak Grove
Average earnings in Oak Grove are $72,500 for men and $44,583 for women, a difference of 38.5%. Men with an educational attainment of high school diploma enjoy the highest average annual earnings of $135,050, while those with college or associate's degree education earn the least with $59,219. Women with an educational attainment of high school diploma earn the most with the average annual earnings of $85,170, while those with college or associate's degree education have the smallest earnings of $41,316.
| Educational Attainment | Male Income | Female Income |
| Less than High School | - | - |
| High School Diploma | $135,050 | $85,170 |
| College or Associate's Degree | $59,219 | $41,316 |
| Bachelor's Degree | $76,250 | $48,750 |
| Graduate Degree | - | - |
| Total | $72,500 | $44,583 |
Family Income in Oak Grove
Family Income Brackets in Oak Grove
According to the Oak Grove family income data, there are 61 families falling into the $200,000+ income range, which is the most common income bracket and makes up 29.0% of all families.
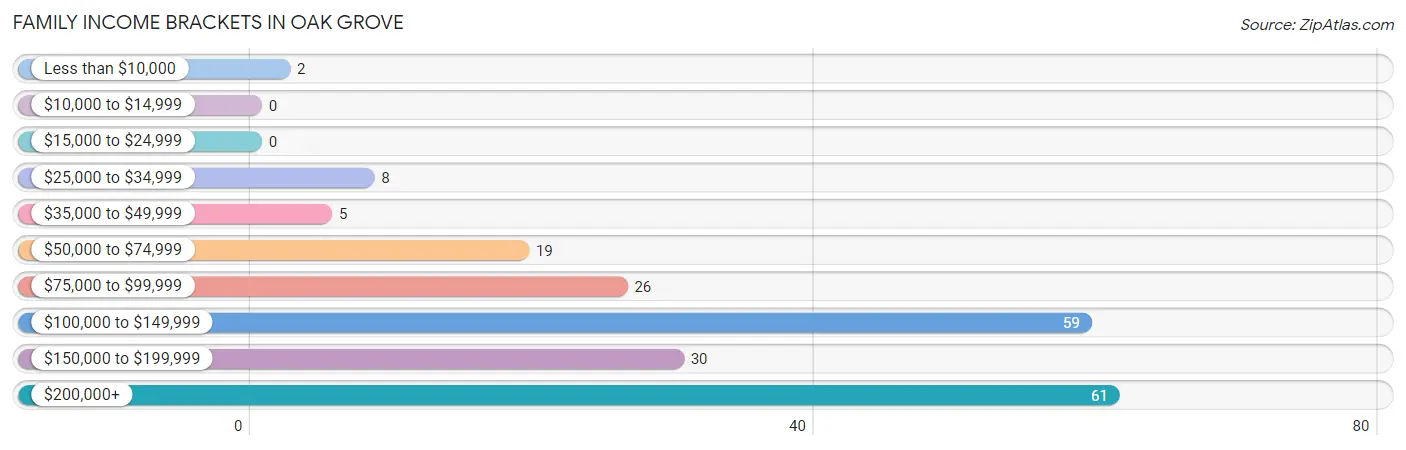
| Income Bracket | # Families | % Families |
| Less than $10,000 | 2 | 1.0% |
| $10,000 to $14,999 | 0 | 0.0% |
| $15,000 to $24,999 | 0 | 0.0% |
| $25,000 to $34,999 | 8 | 3.8% |
| $35,000 to $49,999 | 5 | 2.4% |
| $50,000 to $74,999 | 19 | 9.0% |
| $75,000 to $99,999 | 26 | 12.4% |
| $100,000 to $149,999 | 59 | 28.1% |
| $150,000 to $199,999 | 30 | 14.3% |
| $200,000+ | 61 | 29.0% |
Family Income by Famaliy Size in Oak Grove
4-person families (26 | 12.4%) account for the highest median family income in Oak Grove with $168,750 per family, while 2-person families (136 | 64.8%) have the highest median income of $78,889 per family member.
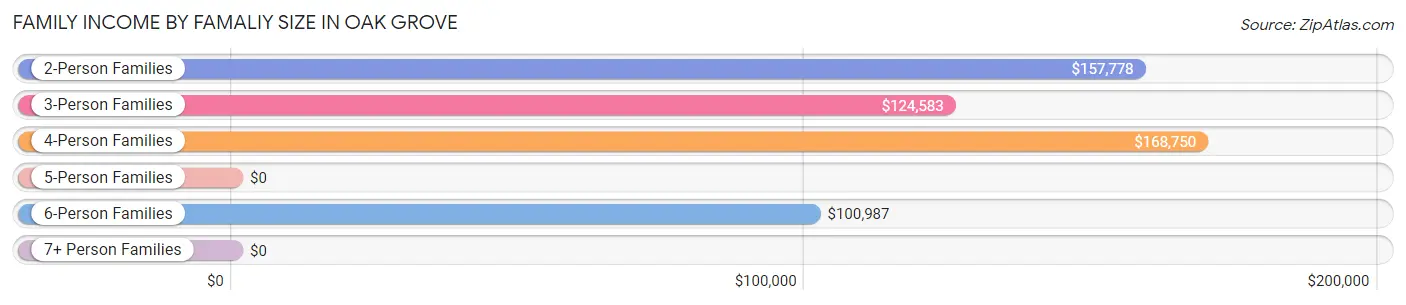
| Income Bracket | # Families | Median Income |
| 2-Person Families | 136 (64.8%) | $157,778 |
| 3-Person Families | 17 (8.1%) | $124,583 |
| 4-Person Families | 26 (12.4%) | $168,750 |
| 5-Person Families | 6 (2.9%) | $0 |
| 6-Person Families | 25 (11.9%) | $100,987 |
| 7+ Person Families | 0 (0.0%) | $0 |
| Total | 210 (100.0%) | $121,667 |
Family Income by Number of Earners in Oak Grove
The median family income in Oak Grove is $121,667, with families comprising 2 earners (111) having the highest median family income of $201,458, while families with no earners (43) have the lowest median family income of $76,125, accounting for 52.9% and 20.5% of families, respectively.
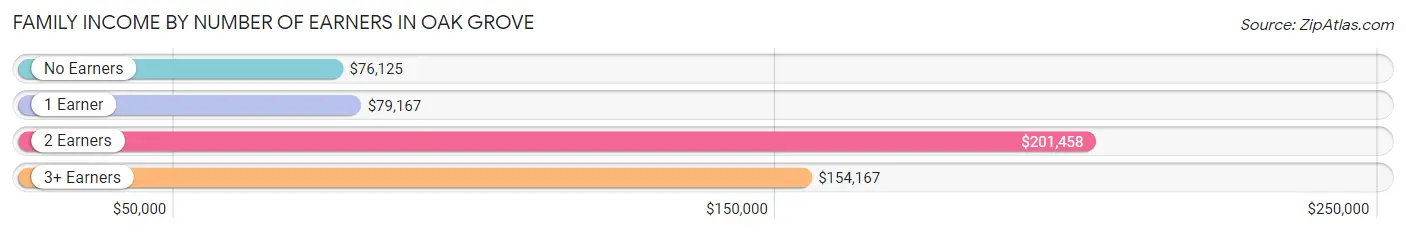
| Number of Earners | # Families | Median Income |
| No Earners | 43 (20.5%) | $76,125 |
| 1 Earner | 32 (15.2%) | $79,167 |
| 2 Earners | 111 (52.9%) | $201,458 |
| 3+ Earners | 24 (11.4%) | $154,167 |
| Total | 210 (100.0%) | $121,667 |
Household Income in Oak Grove
Household Income Brackets in Oak Grove
With 63 households falling in the category, the $100,000 to $149,999 income range is the most frequent in Oak Grove, accounting for 25.0% of all households. In contrast, only 4 households (1.6%) fall into the $15,000 to $24,999 income bracket, making it the least populous group.
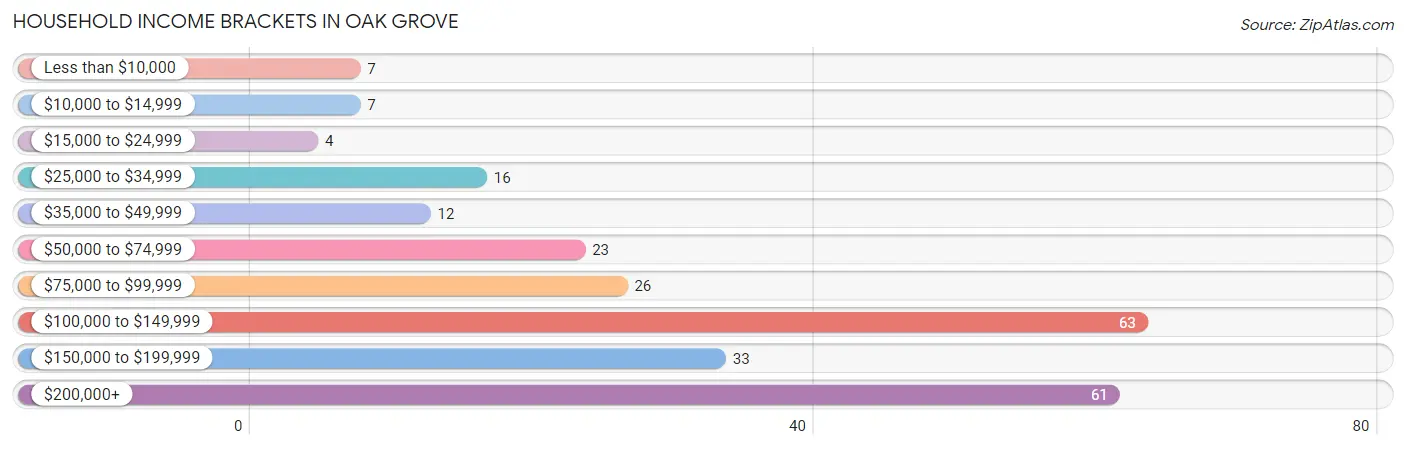
| Income Bracket | # Households | % Households |
| Less than $10,000 | 7 | 2.8% |
| $10,000 to $14,999 | 7 | 2.8% |
| $15,000 to $24,999 | 4 | 1.6% |
| $25,000 to $34,999 | 16 | 6.3% |
| $35,000 to $49,999 | 12 | 4.8% |
| $50,000 to $74,999 | 23 | 9.1% |
| $75,000 to $99,999 | 26 | 10.3% |
| $100,000 to $149,999 | 63 | 25.0% |
| $150,000 to $199,999 | 33 | 13.1% |
| $200,000+ | 61 | 24.2% |
Household Income by Householder Age in Oak Grove
The median household income in Oak Grove is $107,500, with the highest median household income of $191,042 found in the 45 to 64 years age bracket for the primary householder. A total of 113 households (44.8%) fall into this category.
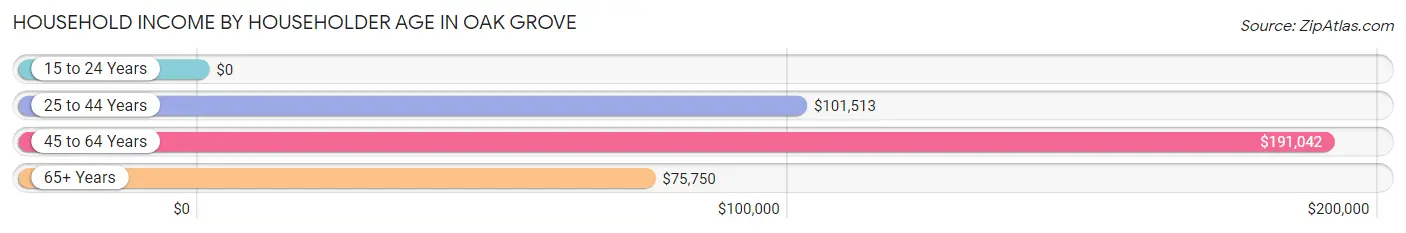
| Income Bracket | # Households | Median Income |
| 15 to 24 Years | 0 (0.0%) | $0 |
| 25 to 44 Years | 41 (16.3%) | $101,513 |
| 45 to 64 Years | 113 (44.8%) | $191,042 |
| 65+ Years | 98 (38.9%) | $75,750 |
| Total | 252 (100.0%) | $107,500 |
Poverty in Oak Grove
Income Below Poverty by Sex and Age in Oak Grove
With 5.5% poverty level for males and 10.6% for females among the residents of Oak Grove, 6 to 11 year old males and 6 to 11 year old females are the most vulnerable to poverty, with 6 males (37.5%) and 11 females (73.3%) in their respective age groups living below the poverty level.
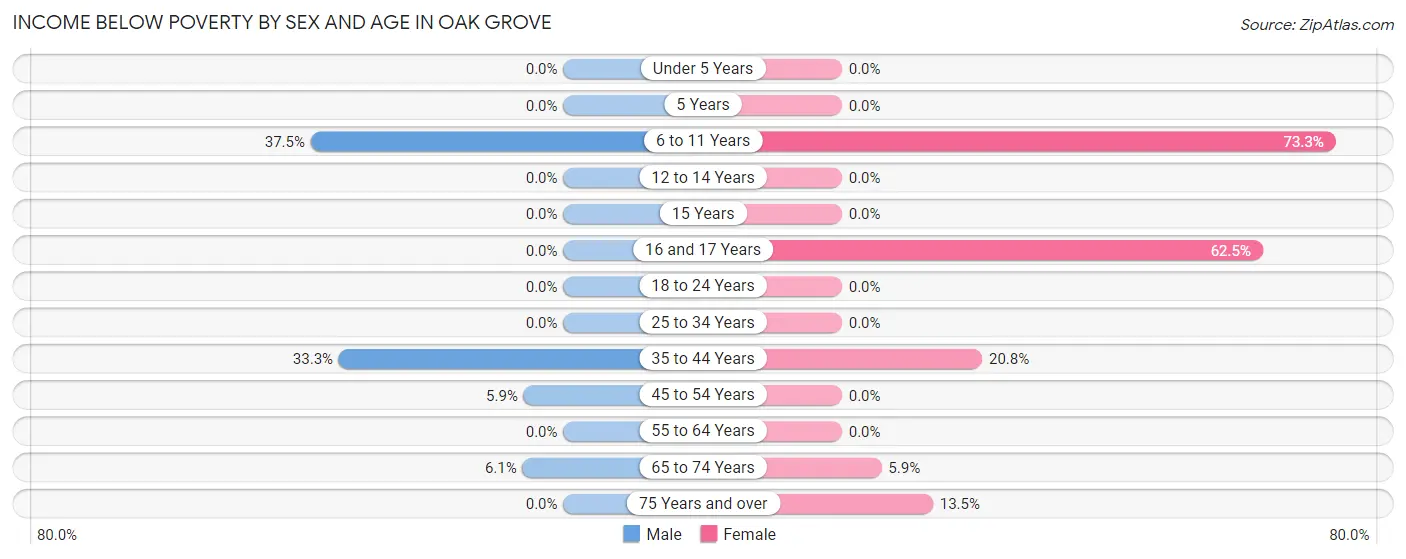
| Age Bracket | Male | Female |
| Under 5 Years | 0 (0.0%) | 0 (0.0%) |
| 5 Years | 0 (0.0%) | 0 (0.0%) |
| 6 to 11 Years | 6 (37.5%) | 11 (73.3%) |
| 12 to 14 Years | 0 (0.0%) | 0 (0.0%) |
| 15 Years | 0 (0.0%) | 0 (0.0%) |
| 16 and 17 Years | 0 (0.0%) | 5 (62.5%) |
| 18 to 24 Years | 0 (0.0%) | 0 (0.0%) |
| 25 to 34 Years | 0 (0.0%) | 0 (0.0%) |
| 35 to 44 Years | 6 (33.3%) | 5 (20.8%) |
| 45 to 54 Years | 5 (5.9%) | 0 (0.0%) |
| 55 to 64 Years | 0 (0.0%) | 0 (0.0%) |
| 65 to 74 Years | 2 (6.1%) | 3 (5.9%) |
| 75 Years and over | 0 (0.0%) | 5 (13.5%) |
| Total | 19 (5.5%) | 29 (10.6%) |
Income Above Poverty by Sex and Age in Oak Grove
According to the poverty statistics in Oak Grove, males aged under 5 years and females aged under 5 years are the age groups that are most secure financially, with 100.0% of males and 100.0% of females in these age groups living above the poverty line.
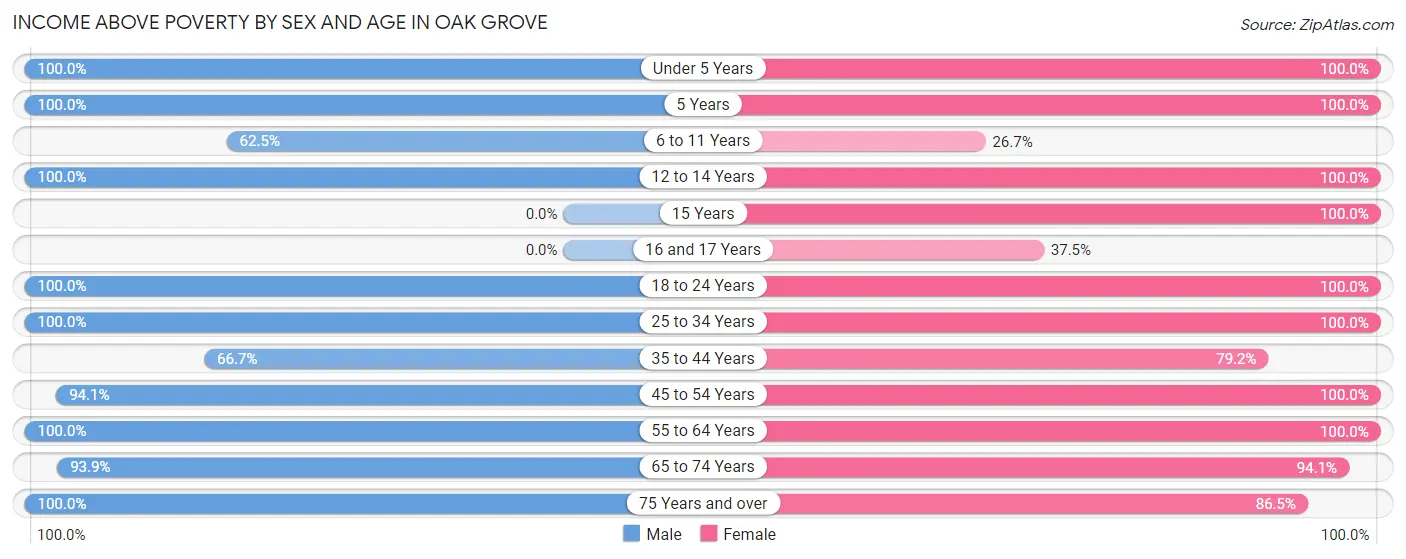
| Age Bracket | Male | Female |
| Under 5 Years | 40 (100.0%) | 5 (100.0%) |
| 5 Years | 20 (100.0%) | 2 (100.0%) |
| 6 to 11 Years | 10 (62.5%) | 4 (26.7%) |
| 12 to 14 Years | 21 (100.0%) | 10 (100.0%) |
| 15 Years | 0 (0.0%) | 2 (100.0%) |
| 16 and 17 Years | 0 (0.0%) | 3 (37.5%) |
| 18 to 24 Years | 9 (100.0%) | 13 (100.0%) |
| 25 to 34 Years | 33 (100.0%) | 35 (100.0%) |
| 35 to 44 Years | 12 (66.7%) | 19 (79.2%) |
| 45 to 54 Years | 80 (94.1%) | 29 (100.0%) |
| 55 to 64 Years | 35 (100.0%) | 42 (100.0%) |
| 65 to 74 Years | 31 (93.9%) | 48 (94.1%) |
| 75 Years and over | 37 (100.0%) | 32 (86.5%) |
| Total | 328 (94.5%) | 244 (89.4%) |
Income Below Poverty Among Married-Couple Families in Oak Grove
The poverty statistics for married-couple families in Oak Grove show that 3.5% or 7 of the total 198 families live below the poverty line. Families with 3 or 4 children have the highest poverty rate of 19.2%, comprising of 5 families. On the other hand, families with 1 or 2 children have the lowest poverty rate of 0.0%, which includes 0 families.
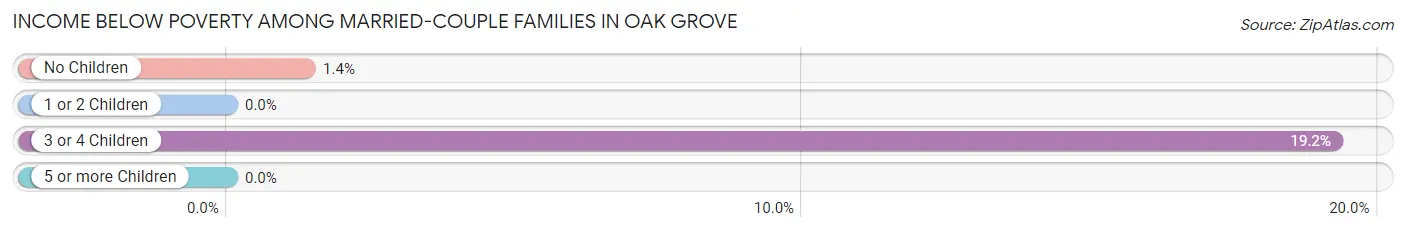
| Children | Above Poverty | Below Poverty |
| No Children | 145 (98.6%) | 2 (1.4%) |
| 1 or 2 Children | 25 (100.0%) | 0 (0.0%) |
| 3 or 4 Children | 21 (80.8%) | 5 (19.2%) |
| 5 or more Children | 0 (0.0%) | 0 (0.0%) |
| Total | 191 (96.5%) | 7 (3.5%) |
Income Below Poverty Among Single-Parent Households in Oak Grove
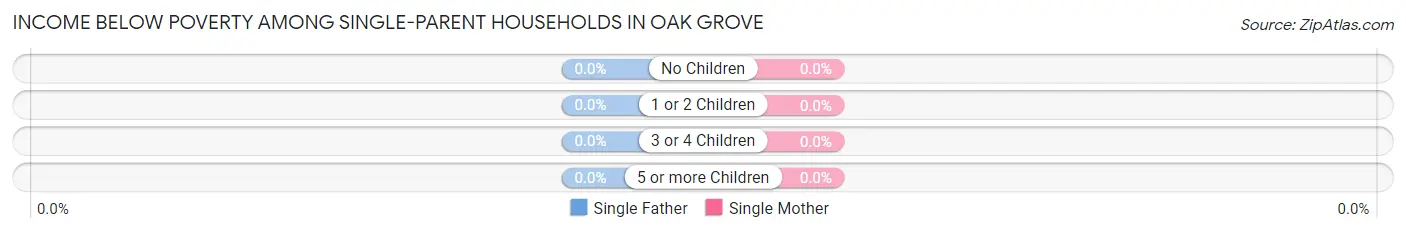
| Children | Single Father | Single Mother |
| No Children | 0 (0.0%) | 0 (0.0%) |
| 1 or 2 Children | 0 (0.0%) | 0 (0.0%) |
| 3 or 4 Children | 0 (0.0%) | 0 (0.0%) |
| 5 or more Children | 0 (0.0%) | 0 (0.0%) |
| Total | 0 (0.0%) | 0 (0.0%) |
Income Below Poverty Among Married-Couple vs Single-Parent Households in Oak Grove
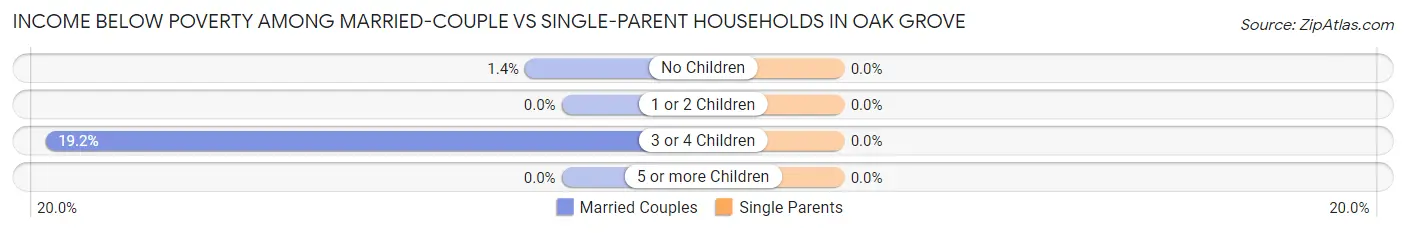
| Children | Married-Couple Families | Single-Parent Households |
| No Children | 2 (1.4%) | 0 (0.0%) |
| 1 or 2 Children | 0 (0.0%) | 0 (0.0%) |
| 3 or 4 Children | 5 (19.2%) | 0 (0.0%) |
| 5 or more Children | 0 (0.0%) | 0 (0.0%) |
| Total | 7 (3.5%) | 0 (0.0%) |
Race in Oak Grove
The most populous races in Oak Grove are White / Caucasian (369 | 59.5%), Two or more Races (232 | 37.4%), and Hispanic or Latino (218 | 35.2%).
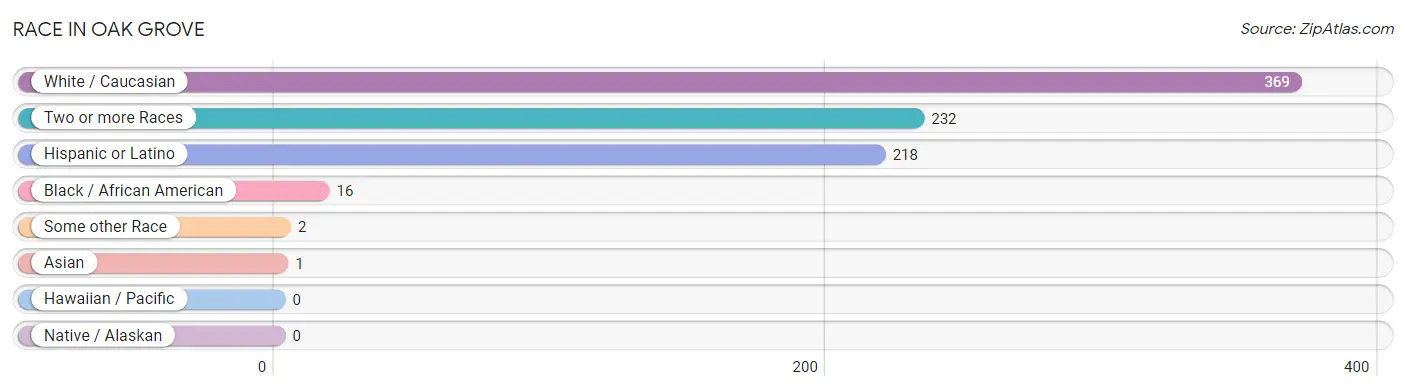
| Race | # Population | % Population |
| Asian | 1 | 0.2% |
| Black / African American | 16 | 2.6% |
| Hawaiian / Pacific | 0 | 0.0% |
| Hispanic or Latino | 218 | 35.2% |
| Native / Alaskan | 0 | 0.0% |
| White / Caucasian | 369 | 59.5% |
| Two or more Races | 232 | 37.4% |
| Some other Race | 2 | 0.3% |
| Total | 620 | 100.0% |
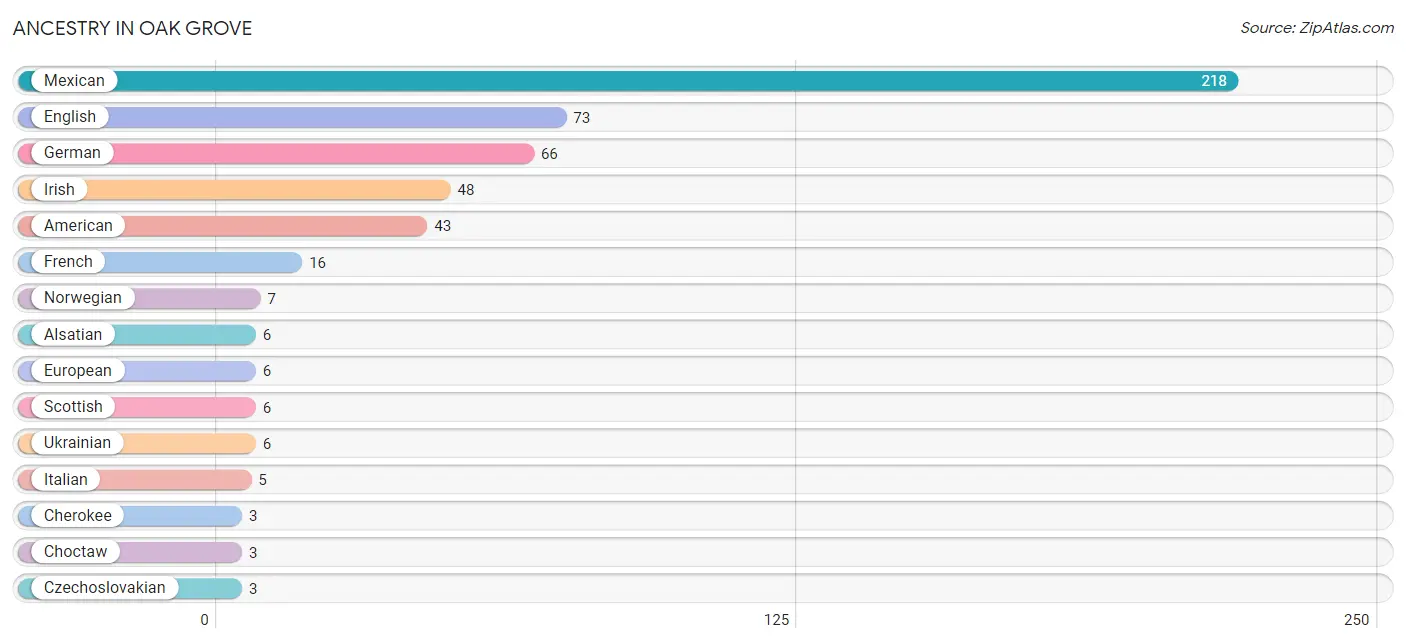
Ancestry in Oak Grove
The most populous ancestries reported in Oak Grove are Mexican (218 | 35.2%), English (73 | 11.8%), German (66 | 10.6%), Irish (48 | 7.7%), and American (43 | 6.9%), together accounting for 72.3% of all Oak Grove residents.
| Ancestry | # Population | % Population |
| Alsatian | 6 | 1.0% |
| American | 43 | 6.9% |
| British | 2 | 0.3% |
| Burmese | 1 | 0.2% |
| Cherokee | 3 | 0.5% |
| Choctaw | 3 | 0.5% |
| Czech | 1 | 0.2% |
| Czechoslovakian | 3 | 0.5% |
| English | 73 | 11.8% |
| European | 6 | 1.0% |
| French | 16 | 2.6% |
| German | 66 | 10.6% |
| Hungarian | 1 | 0.2% |
| Irish | 48 | 7.7% |
| Italian | 5 | 0.8% |
| Mexican | 218 | 35.2% |
| Norwegian | 7 | 1.1% |
| Polish | 2 | 0.3% |
| Scotch-Irish | 3 | 0.5% |
| Scottish | 6 | 1.0% |
| Ukrainian | 6 | 1.0% |
| Welsh | 2 | 0.3% | View All 22 Rows |
Immigrants in Oak Grove
The most numerous immigrant groups reported in Oak Grove came from Central America (19 | 3.1%), Latin America (19 | 3.1%), Mexico (19 | 3.1%), Canada (6 | 1.0%), and Asia (1 | 0.2%), together accounting for 10.3% of all Oak Grove residents.
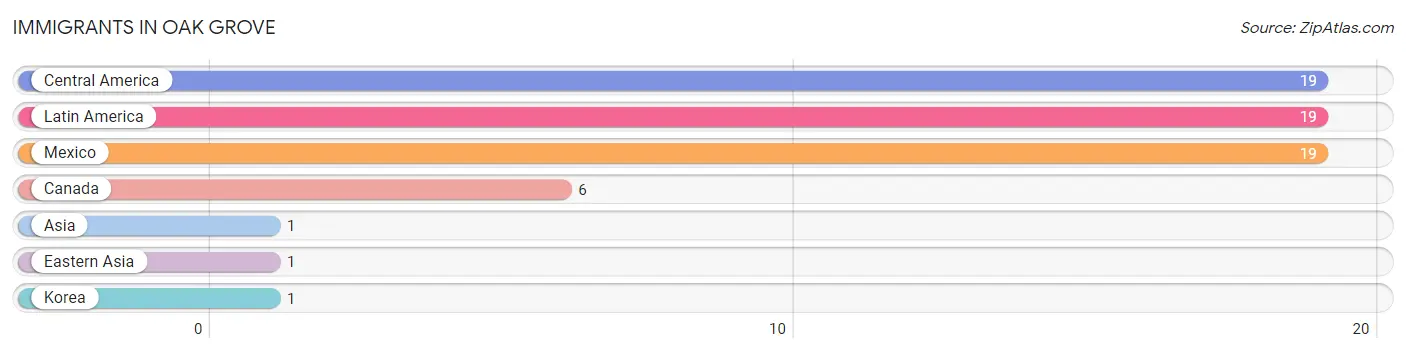
| Immigration Origin | # Population | % Population |
| Asia | 1 | 0.2% |
| Canada | 6 | 1.0% |
| Central America | 19 | 3.1% |
| Eastern Asia | 1 | 0.2% |
| Korea | 1 | 0.2% |
| Latin America | 19 | 3.1% |
| Mexico | 19 | 3.1% | View All 7 Rows |
Sex and Age in Oak Grove
Sex and Age in Oak Grove
The most populous age groups in Oak Grove are 50 to 54 Years (69 | 19.9%) for men and 55 to 59 Years (33 | 12.1%) for women.
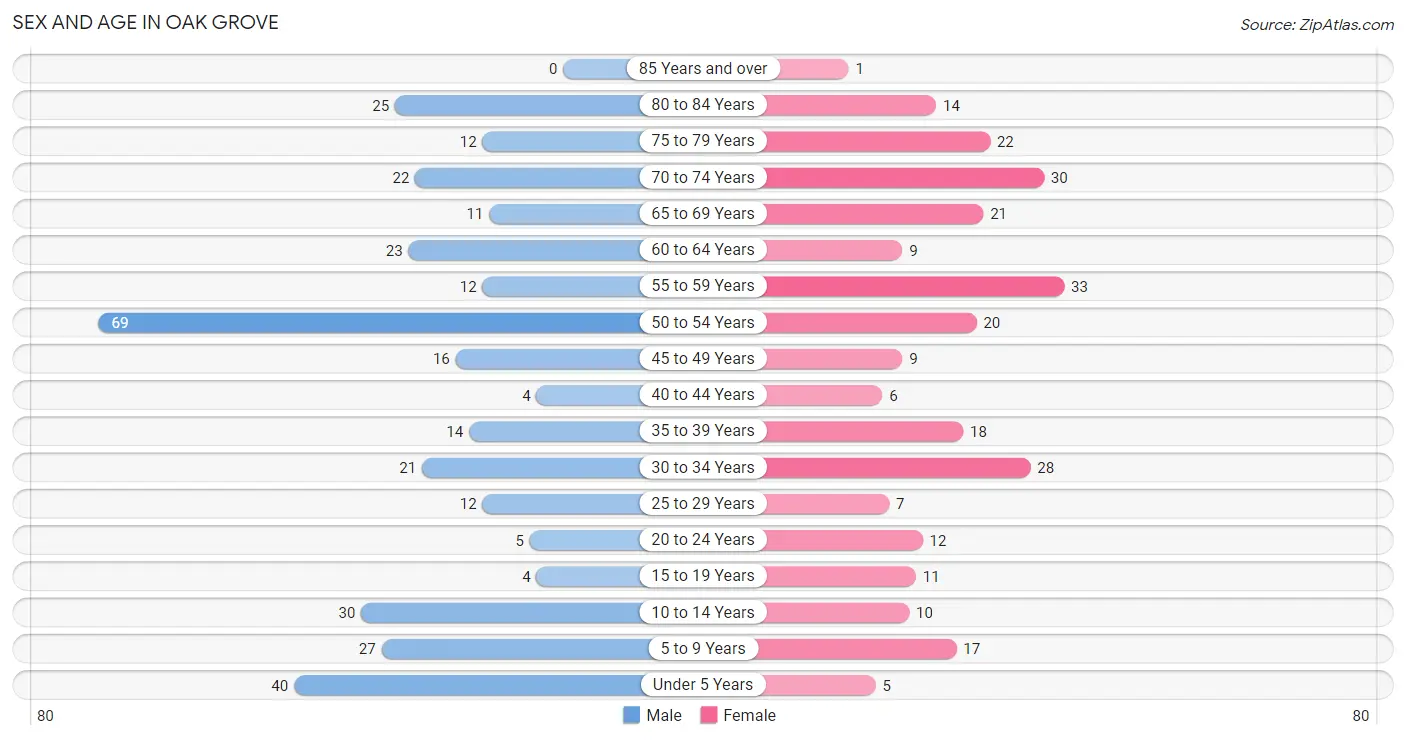
| Age Bracket | Male | Female |
| Under 5 Years | 40 (11.5%) | 5 (1.8%) |
| 5 to 9 Years | 27 (7.8%) | 17 (6.2%) |
| 10 to 14 Years | 30 (8.6%) | 10 (3.7%) |
| 15 to 19 Years | 4 (1.1%) | 11 (4.0%) |
| 20 to 24 Years | 5 (1.4%) | 12 (4.4%) |
| 25 to 29 Years | 12 (3.5%) | 7 (2.6%) |
| 30 to 34 Years | 21 (6.0%) | 28 (10.3%) |
| 35 to 39 Years | 14 (4.0%) | 18 (6.6%) |
| 40 to 44 Years | 4 (1.1%) | 6 (2.2%) |
| 45 to 49 Years | 16 (4.6%) | 9 (3.3%) |
| 50 to 54 Years | 69 (19.9%) | 20 (7.3%) |
| 55 to 59 Years | 12 (3.5%) | 33 (12.1%) |
| 60 to 64 Years | 23 (6.6%) | 9 (3.3%) |
| 65 to 69 Years | 11 (3.2%) | 21 (7.7%) |
| 70 to 74 Years | 22 (6.3%) | 30 (11.0%) |
| 75 to 79 Years | 12 (3.5%) | 22 (8.1%) |
| 80 to 84 Years | 25 (7.2%) | 14 (5.1%) |
| 85 Years and over | 0 (0.0%) | 1 (0.4%) |
| Total | 347 (100.0%) | 273 (100.0%) |
Families and Households in Oak Grove
Median Family Size in Oak Grove
The median family size in Oak Grove is 2.72 persons per family, with single female/mother families (6 | 2.9%) accounting for the largest median family size of 3.5 persons per family. On the other hand, single male/father families (6 | 2.9%) represent the smallest median family size with 2.33 persons per family.
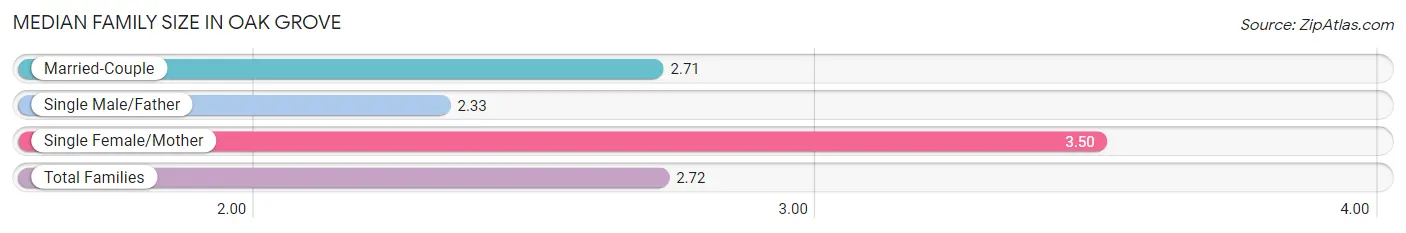
| Family Type | # Families | Family Size |
| Married-Couple | 198 (94.3%) | 2.71 |
| Single Male/Father | 6 (2.9%) | 2.33 |
| Single Female/Mother | 6 (2.9%) | 3.50 |
| Total Families | 210 (100.0%) | 2.72 |
Median Household Size in Oak Grove
The median household size in Oak Grove is 2.46 persons per household, with single female/mother households (6 | 2.4%) accounting for the largest median household size of 3.5 persons per household. non-family households (42 | 16.7%) represent the smallest median household size with 1.05 persons per household.
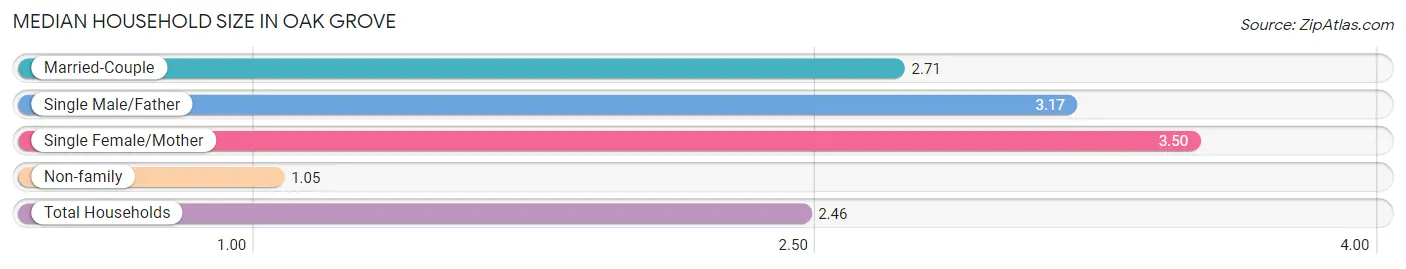
| Household Type | # Households | Household Size |
| Married-Couple | 198 (78.6%) | 2.71 |
| Single Male/Father | 6 (2.4%) | 3.17 |
| Single Female/Mother | 6 (2.4%) | 3.50 |
| Non-family | 42 (16.7%) | 1.05 |
| Total Households | 252 (100.0%) | 2.46 |
Household Size by Marriage Status in Oak Grove
Out of a total of 252 households in Oak Grove, 210 (83.3%) are family households, while 42 (16.7%) are nonfamily households. The most numerous type of family households are 2-person households, comprising 136, and the most common type of nonfamily households are 1-person households, comprising 39.
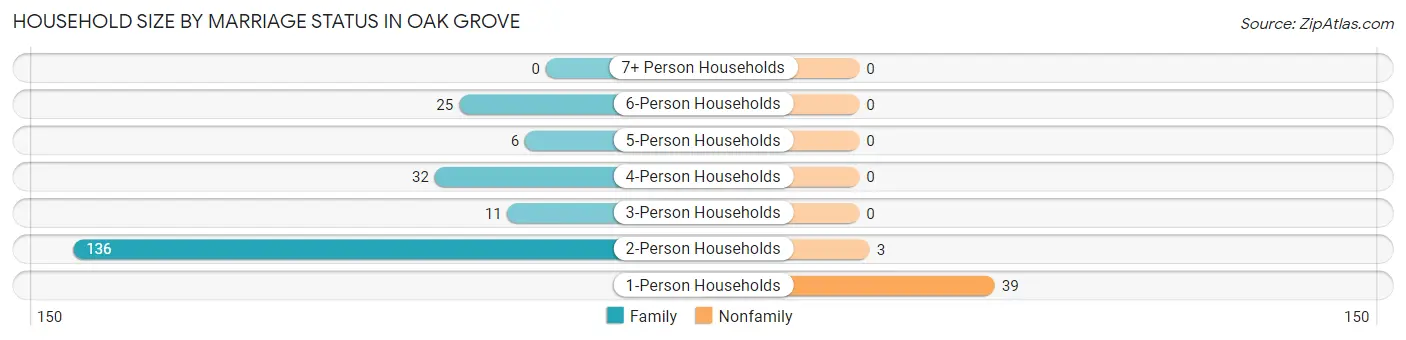
| Household Size | Family Households | Nonfamily Households |
| 1-Person Households | - | 39 (15.5%) |
| 2-Person Households | 136 (54.0%) | 3 (1.2%) |
| 3-Person Households | 11 (4.4%) | 0 (0.0%) |
| 4-Person Households | 32 (12.7%) | 0 (0.0%) |
| 5-Person Households | 6 (2.4%) | 0 (0.0%) |
| 6-Person Households | 25 (9.9%) | 0 (0.0%) |
| 7+ Person Households | 0 (0.0%) | 0 (0.0%) |
| Total | 210 (83.3%) | 42 (16.7%) |
Female Fertility in Oak Grove
Fertility by Age in Oak Grove
Average fertility rate in Oak Grove is 55.0 births per 1,000 women. Women in the age bracket of 20 to 34 years have the highest fertility rate with 106.0 births per 1,000 women. Women in the age bracket of 20 to 34 years acount for 100.0% of all women with births.
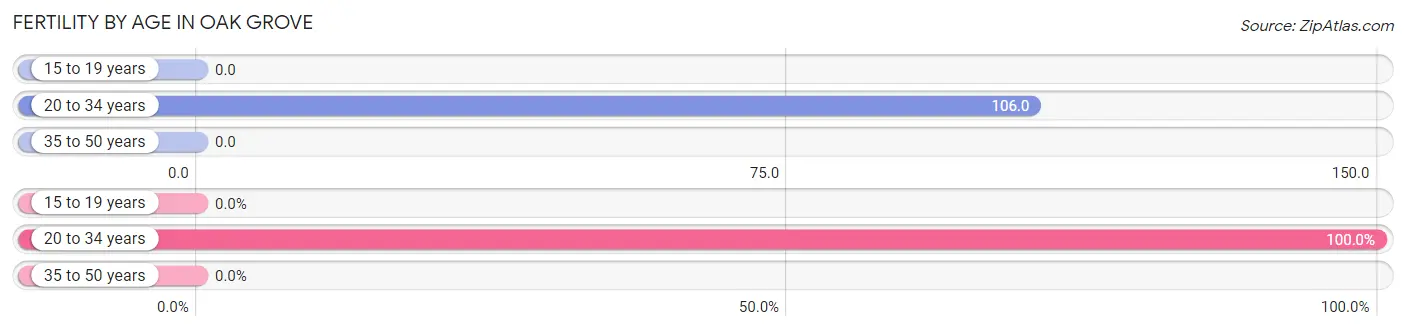
| Age Bracket | Women with Births | Births / 1,000 Women |
| 15 to 19 years | 0 (0.0%) | 0.0 |
| 20 to 34 years | 5 (100.0%) | 106.0 |
| 35 to 50 years | 0 (0.0%) | 0.0 |
| Total | 5 (100.0%) | 55.0 |
Fertility by Age by Marriage Status in Oak Grove
40.0% of women with births (5) in Oak Grove are married. The highest percentage of unmarried women with births falls into 20 to 34 years age bracket with 60.0% of them unmarried at the time of birth, while the lowest percentage of unmarried women with births belong to 20 to 34 years age bracket with 60.0% of them unmarried.
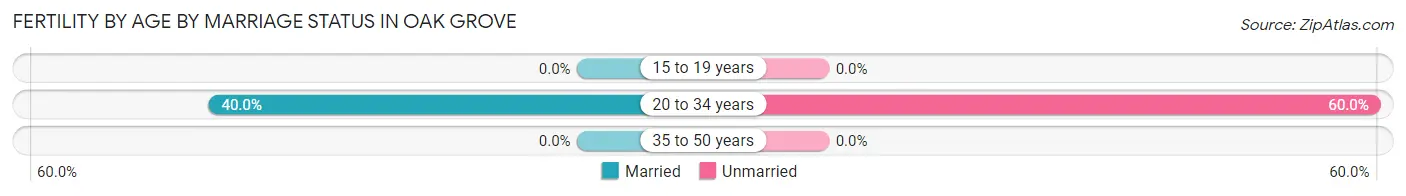
| Age Bracket | Married | Unmarried |
| 15 to 19 years | 0 (0.0%) | 0 (0.0%) |
| 20 to 34 years | 2 (40.0%) | 3 (60.0%) |
| 35 to 50 years | 0 (0.0%) | 0 (0.0%) |
| Total | 2 (40.0%) | 3 (60.0%) |
Fertility by Education in Oak Grove
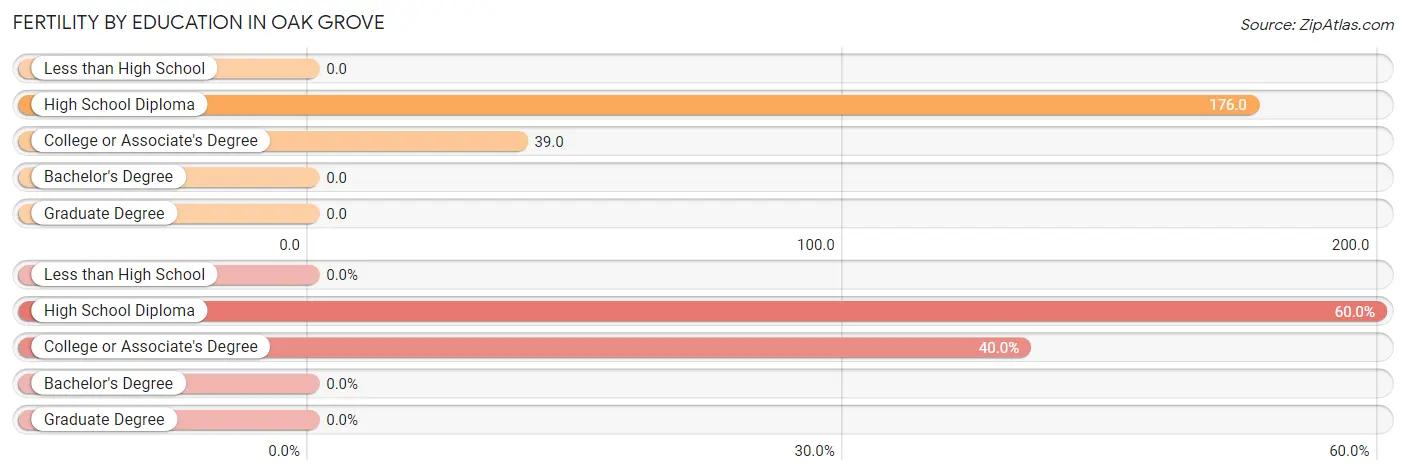
| Educational Attainment | Women with Births | Births / 1,000 Women |
| Less than High School | 0 (0.0%) | 0.0 |
| High School Diploma | 3 (60.0%) | 176.0 |
| College or Associate's Degree | 2 (40.0%) | 39.0 |
| Bachelor's Degree | 0 (0.0%) | 0.0 |
| Graduate Degree | 0 (0.0%) | 0.0 |
| Total | 5 (100.0%) | 55.0 |
Fertility by Education by Marriage Status in Oak Grove
60.0% of women with births in Oak Grove are unmarried. Women with the educational attainment of college or associate's degree are most likely to be married with 100.0% of them married at childbirth, while women with the educational attainment of high school diploma are least likely to be married with 100.0% of them unmarried at childbirth.
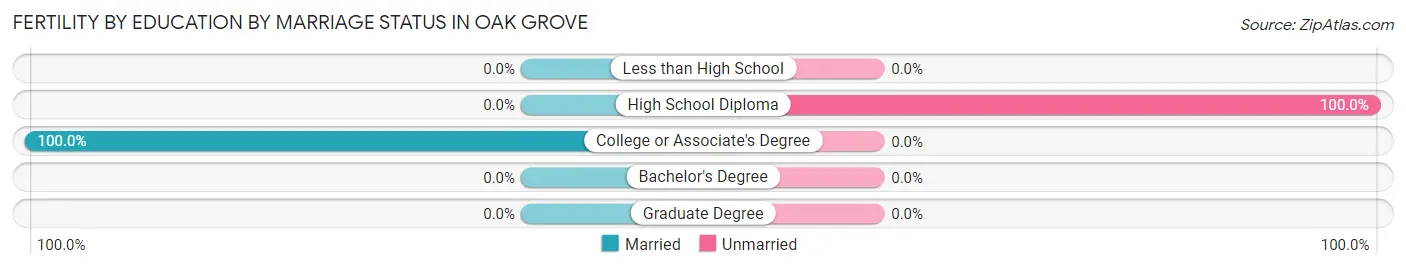
| Educational Attainment | Married | Unmarried |
| Less than High School | 0 (0.0%) | 0 (0.0%) |
| High School Diploma | 0 (0.0%) | 3 (100.0%) |
| College or Associate's Degree | 2 (100.0%) | 0 (0.0%) |
| Bachelor's Degree | 0 (0.0%) | 0 (0.0%) |
| Graduate Degree | 0 (0.0%) | 0 (0.0%) |
| Total | 2 (40.0%) | 3 (60.0%) |
Employment Characteristics in Oak Grove
Employment by Class of Employer in Oak Grove
Among the 307 employed individuals in Oak Grove, private company employees (242 | 78.8%), local government employees (23 | 7.5%), and self-employed (incorporated) (14 | 4.6%) make up the most common classes of employment.
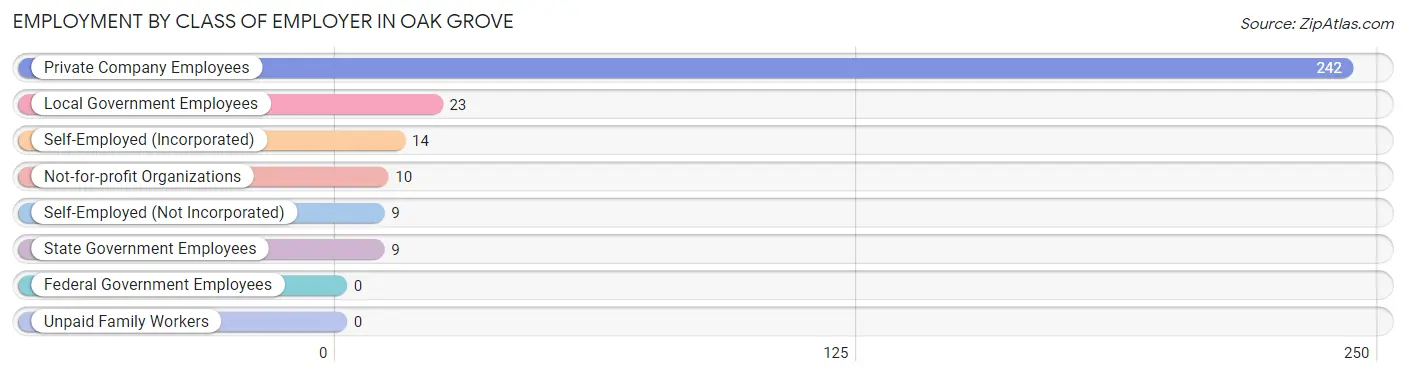
| Employer Class | # Employees | % Employees |
| Private Company Employees | 242 | 78.8% |
| Self-Employed (Incorporated) | 14 | 4.6% |
| Self-Employed (Not Incorporated) | 9 | 2.9% |
| Not-for-profit Organizations | 10 | 3.3% |
| Local Government Employees | 23 | 7.5% |
| State Government Employees | 9 | 2.9% |
| Federal Government Employees | 0 | 0.0% |
| Unpaid Family Workers | 0 | 0.0% |
| Total | 307 | 100.0% |
Employment Status by Age in Oak Grove
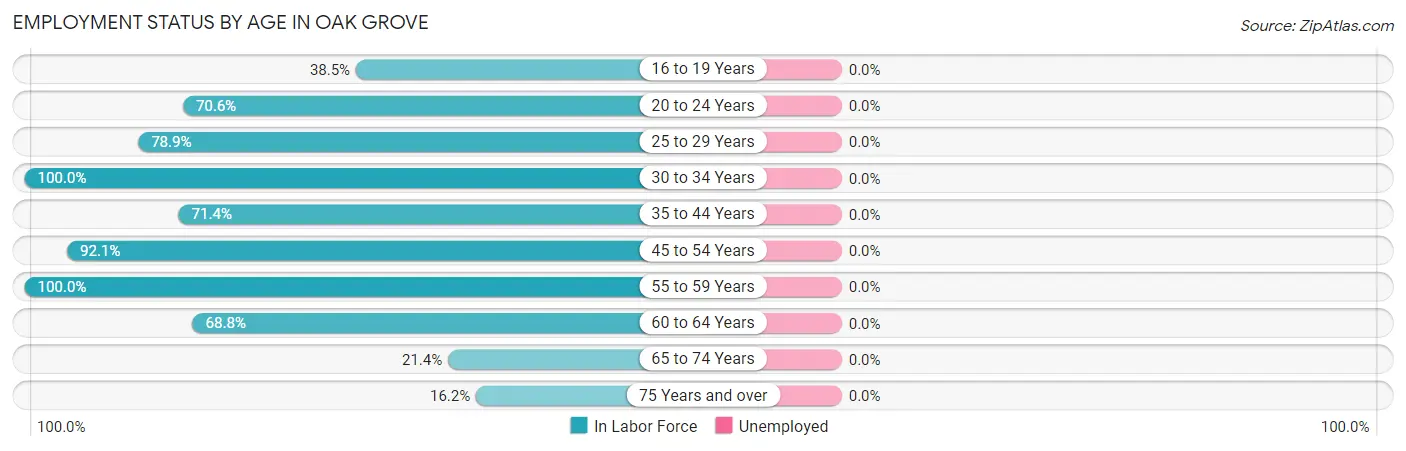
| Age Bracket | In Labor Force | Unemployed |
| 16 to 19 Years | 5 (38.5%) | 0 (0.0%) |
| 20 to 24 Years | 12 (70.6%) | 0 (0.0%) |
| 25 to 29 Years | 15 (78.9%) | 0 (0.0%) |
| 30 to 34 Years | 49 (100.0%) | 0 (0.0%) |
| 35 to 44 Years | 30 (71.4%) | 0 (0.0%) |
| 45 to 54 Years | 105 (92.1%) | 0 (0.0%) |
| 55 to 59 Years | 45 (100.0%) | 0 (0.0%) |
| 60 to 64 Years | 22 (68.8%) | 0 (0.0%) |
| 65 to 74 Years | 18 (21.4%) | 0 (0.0%) |
| 75 Years and over | 12 (16.2%) | 0 (0.0%) |
| Total | 313 (64.0%) | 0 (0.0%) |
Employment Status by Educational Attainment in Oak Grove
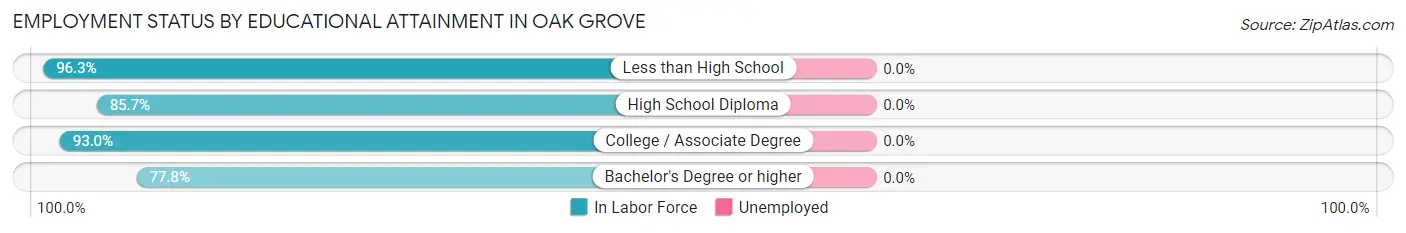
| Educational Attainment | In Labor Force | Unemployed |
| Less than High School | 26 (96.3%) | 0 (0.0%) |
| High School Diploma | 126 (85.7%) | 0 (0.0%) |
| College / Associate Degree | 93 (93.0%) | 0 (0.0%) |
| Bachelor's Degree or higher | 21 (77.8%) | 0 (0.0%) |
| Total | 266 (88.4%) | 0 (0.0%) |
Employment Occupations by Sex in Oak Grove
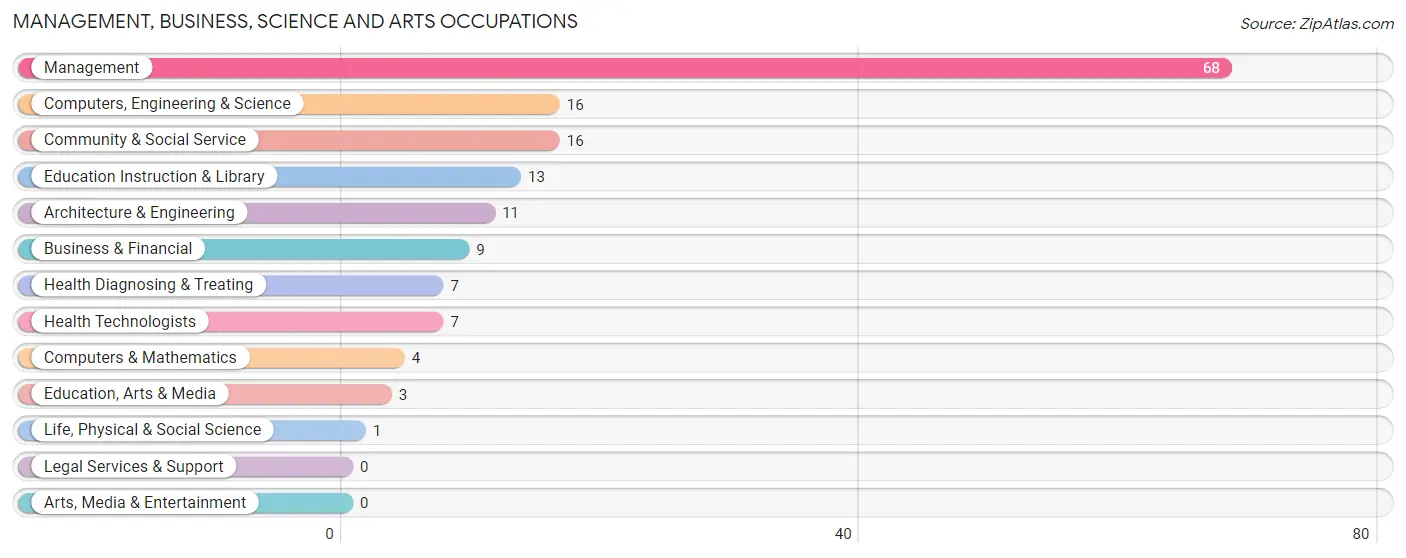
Management, Business, Science and Arts Occupations
The most common Management, Business, Science and Arts occupations in Oak Grove are Management (68 | 21.7%), Computers, Engineering & Science (16 | 5.1%), Community & Social Service (16 | 5.1%), Education Instruction & Library (13 | 4.2%), and Architecture & Engineering (11 | 3.5%).
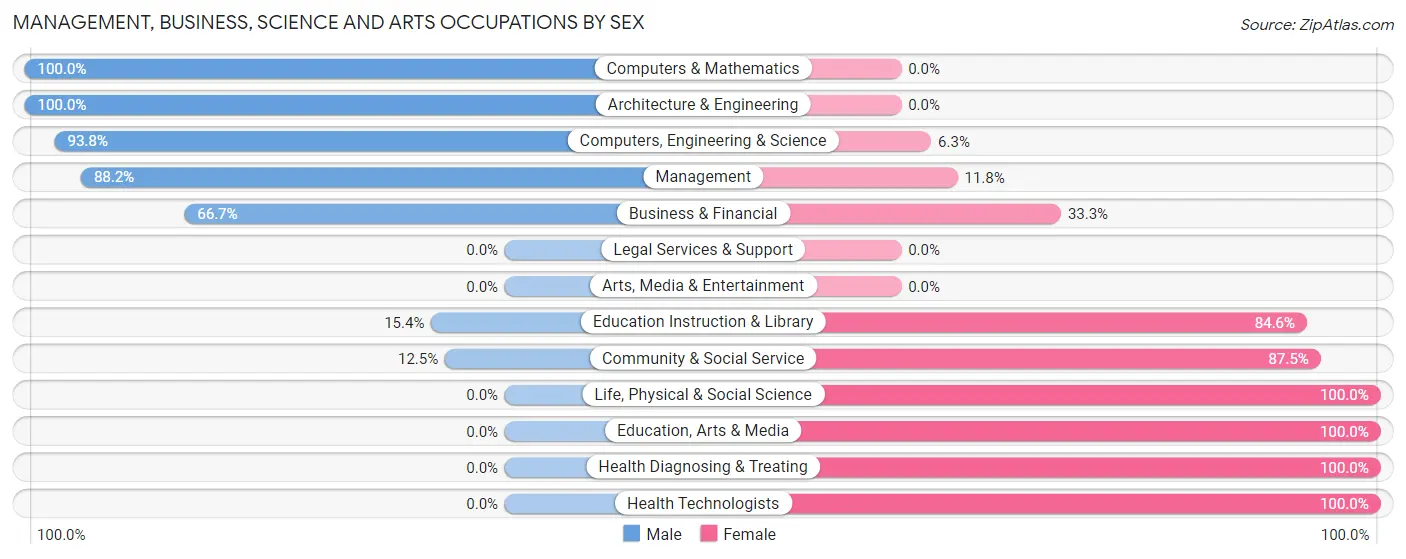
Management, Business, Science and Arts Occupations by Sex
Within the Management, Business, Science and Arts occupations in Oak Grove, the most male-oriented occupations are Computers & Mathematics (100.0%), Architecture & Engineering (100.0%), and Computers, Engineering & Science (93.8%), while the most female-oriented occupations are Life, Physical & Social Science (100.0%), Education, Arts & Media (100.0%), and Health Diagnosing & Treating (100.0%).
| Occupation | Male | Female |
| Management | 60 (88.2%) | 8 (11.8%) |
| Business & Financial | 6 (66.7%) | 3 (33.3%) |
| Computers, Engineering & Science | 15 (93.8%) | 1 (6.2%) |
| Computers & Mathematics | 4 (100.0%) | 0 (0.0%) |
| Architecture & Engineering | 11 (100.0%) | 0 (0.0%) |
| Life, Physical & Social Science | 0 (0.0%) | 1 (100.0%) |
| Community & Social Service | 2 (12.5%) | 14 (87.5%) |
| Education, Arts & Media | 0 (0.0%) | 3 (100.0%) |
| Legal Services & Support | 0 (0.0%) | 0 (0.0%) |
| Education Instruction & Library | 2 (15.4%) | 11 (84.6%) |
| Arts, Media & Entertainment | 0 (0.0%) | 0 (0.0%) |
| Health Diagnosing & Treating | 0 (0.0%) | 7 (100.0%) |
| Health Technologists | 0 (0.0%) | 7 (100.0%) |
| Total (Category) | 83 (71.6%) | 33 (28.4%) |
| Total (Overall) | 174 (55.6%) | 139 (44.4%) |
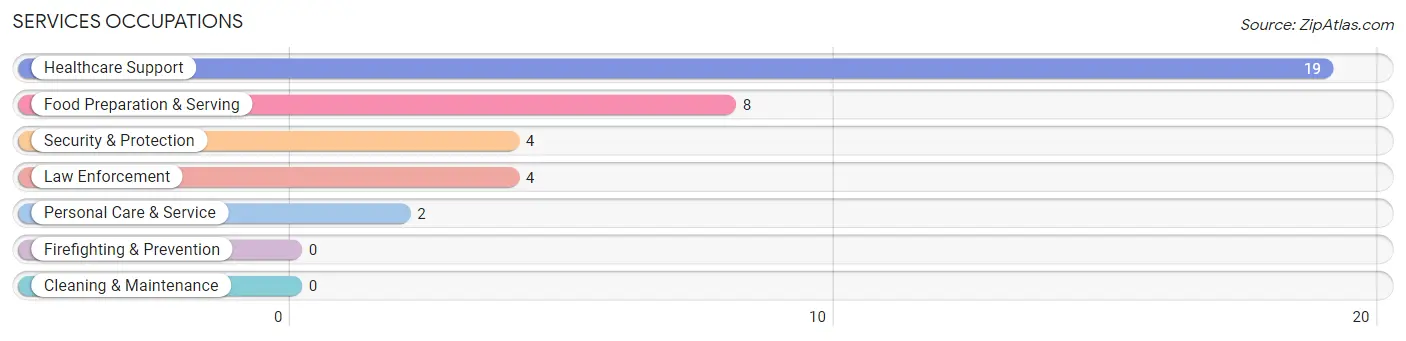
Services Occupations
The most common Services occupations in Oak Grove are Healthcare Support (19 | 6.1%), Food Preparation & Serving (8 | 2.6%), Security & Protection (4 | 1.3%), Law Enforcement (4 | 1.3%), and Personal Care & Service (2 | 0.6%).
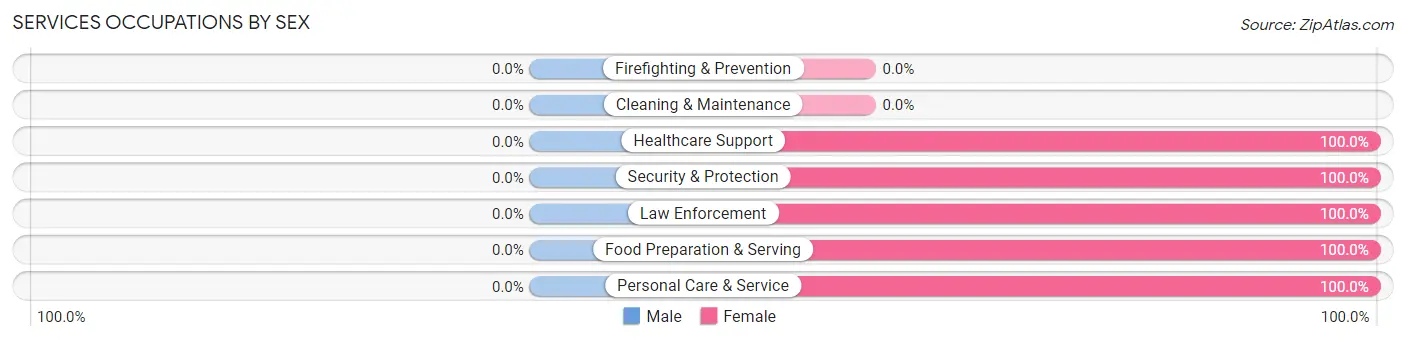
Services Occupations by Sex
| Occupation | Male | Female |
| Healthcare Support | 0 (0.0%) | 19 (100.0%) |
| Security & Protection | 0 (0.0%) | 4 (100.0%) |
| Firefighting & Prevention | 0 (0.0%) | 0 (0.0%) |
| Law Enforcement | 0 (0.0%) | 4 (100.0%) |
| Food Preparation & Serving | 0 (0.0%) | 8 (100.0%) |
| Cleaning & Maintenance | 0 (0.0%) | 0 (0.0%) |
| Personal Care & Service | 0 (0.0%) | 2 (100.0%) |
| Total (Category) | 0 (0.0%) | 33 (100.0%) |
| Total (Overall) | 174 (55.6%) | 139 (44.4%) |
Sales and Office Occupations
The most common Sales and Office occupations in Oak Grove are Office & Administration (39 | 12.5%), and Sales & Related (28 | 8.9%).
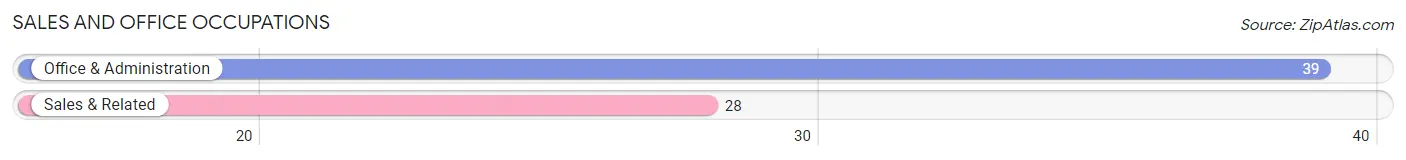
Sales and Office Occupations by Sex

| Occupation | Male | Female |
| Sales & Related | 13 (46.4%) | 15 (53.6%) |
| Office & Administration | 5 (12.8%) | 34 (87.2%) |
| Total (Category) | 18 (26.9%) | 49 (73.1%) |
| Total (Overall) | 174 (55.6%) | 139 (44.4%) |
Natural Resources, Construction and Maintenance Occupations
The most common Natural Resources, Construction and Maintenance occupations in Oak Grove are Installation, Maintenance & Repair (23 | 7.3%), and Construction & Extraction (17 | 5.4%).
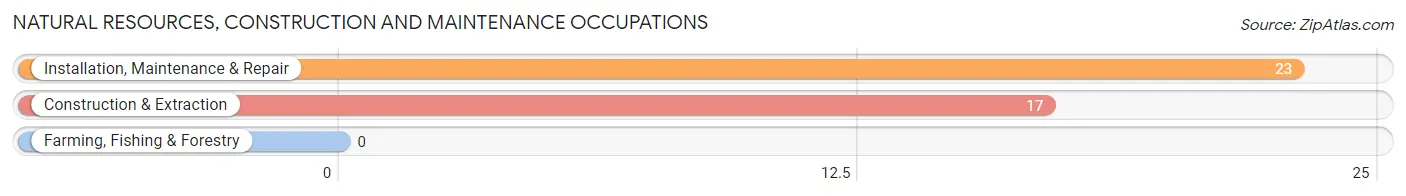
Natural Resources, Construction and Maintenance Occupations by Sex

| Occupation | Male | Female |
| Farming, Fishing & Forestry | 0 (0.0%) | 0 (0.0%) |
| Construction & Extraction | 17 (100.0%) | 0 (0.0%) |
| Installation, Maintenance & Repair | 23 (100.0%) | 0 (0.0%) |
| Total (Category) | 40 (100.0%) | 0 (0.0%) |
| Total (Overall) | 174 (55.6%) | 139 (44.4%) |
Production, Transportation and Moving Occupations
The most common Production, Transportation and Moving occupations in Oak Grove are Production (39 | 12.5%), and Transportation (18 | 5.8%).
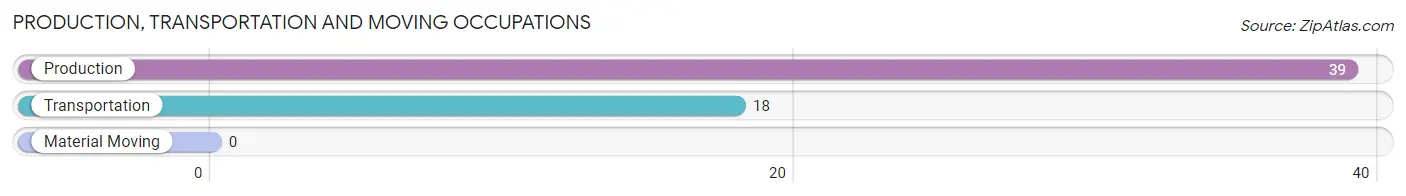
Production, Transportation and Moving Occupations by Sex

| Occupation | Male | Female |
| Production | 17 (43.6%) | 22 (56.4%) |
| Transportation | 16 (88.9%) | 2 (11.1%) |
| Material Moving | 0 (0.0%) | 0 (0.0%) |
| Total (Category) | 33 (57.9%) | 24 (42.1%) |
| Total (Overall) | 174 (55.6%) | 139 (44.4%) |
Employment Industries by Sex in Oak Grove
Employment Industries in Oak Grove
The major employment industries in Oak Grove include Manufacturing (59 | 18.9%), Information (53 | 16.9%), Health Care & Social Assistance (39 | 12.5%), Educational Services (24 | 7.7%), and Retail Trade (20 | 6.4%).
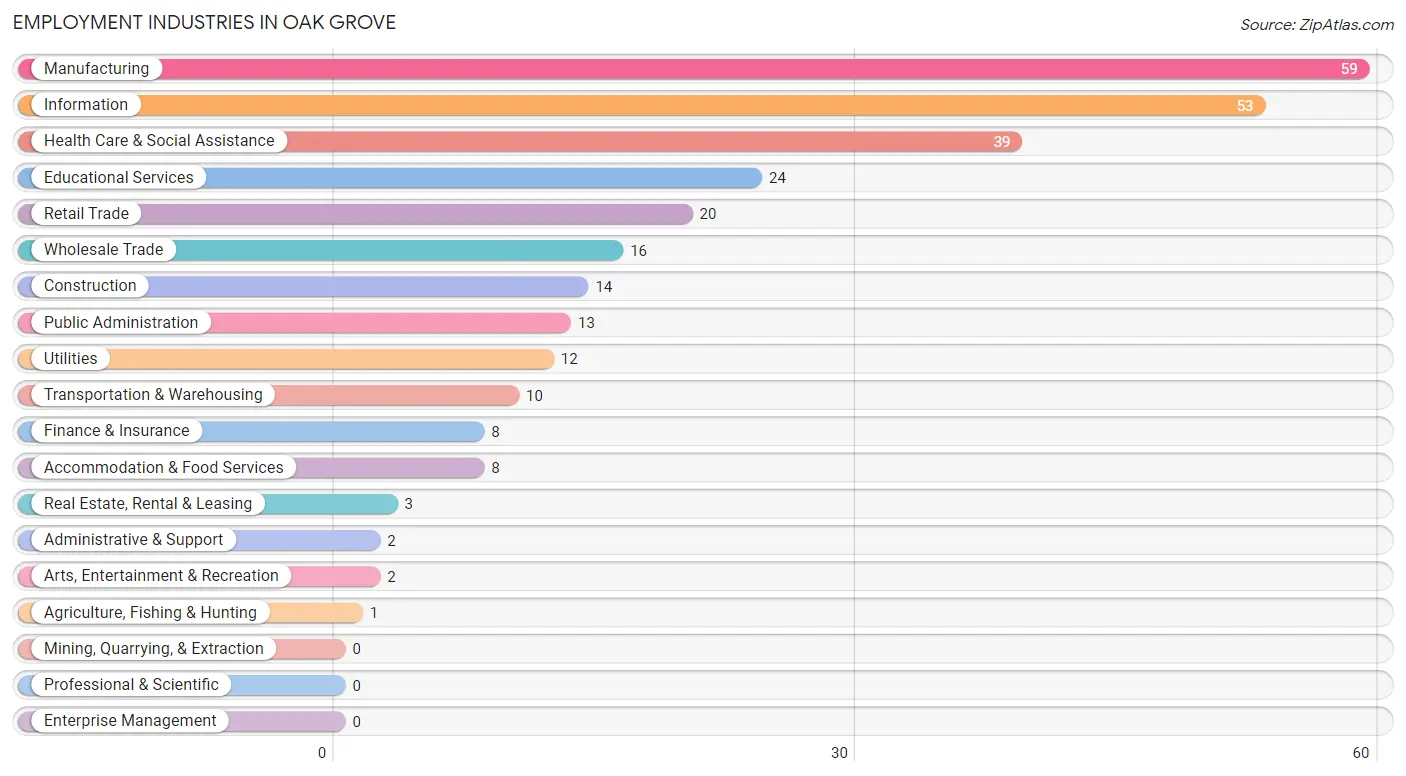
Employment Industries by Sex in Oak Grove
The Oak Grove industries that see more men than women are Agriculture, Fishing & Hunting (100.0%), Construction (100.0%), and Real Estate, Rental & Leasing (100.0%), whereas the industries that tend to have a higher number of women are Finance & Insurance (100.0%), Health Care & Social Assistance (100.0%), and Arts, Entertainment & Recreation (100.0%).
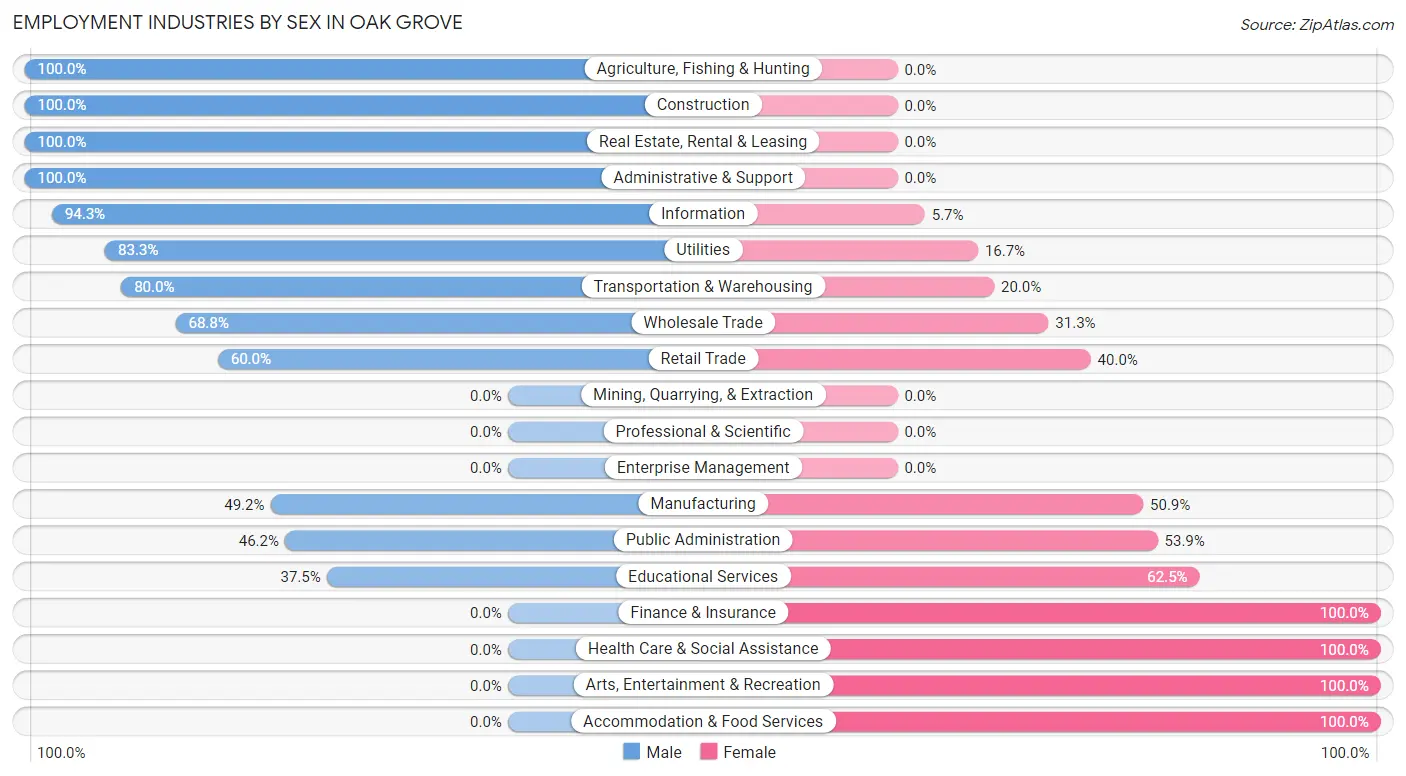
| Industry | Male | Female |
| Agriculture, Fishing & Hunting | 1 (100.0%) | 0 (0.0%) |
| Mining, Quarrying, & Extraction | 0 (0.0%) | 0 (0.0%) |
| Construction | 14 (100.0%) | 0 (0.0%) |
| Manufacturing | 29 (49.1%) | 30 (50.8%) |
| Wholesale Trade | 11 (68.8%) | 5 (31.2%) |
| Retail Trade | 12 (60.0%) | 8 (40.0%) |
| Transportation & Warehousing | 8 (80.0%) | 2 (20.0%) |
| Utilities | 10 (83.3%) | 2 (16.7%) |
| Information | 50 (94.3%) | 3 (5.7%) |
| Finance & Insurance | 0 (0.0%) | 8 (100.0%) |
| Real Estate, Rental & Leasing | 3 (100.0%) | 0 (0.0%) |
| Professional & Scientific | 0 (0.0%) | 0 (0.0%) |
| Enterprise Management | 0 (0.0%) | 0 (0.0%) |
| Administrative & Support | 2 (100.0%) | 0 (0.0%) |
| Educational Services | 9 (37.5%) | 15 (62.5%) |
| Health Care & Social Assistance | 0 (0.0%) | 39 (100.0%) |
| Arts, Entertainment & Recreation | 0 (0.0%) | 2 (100.0%) |
| Accommodation & Food Services | 0 (0.0%) | 8 (100.0%) |
| Public Administration | 6 (46.2%) | 7 (53.8%) |
| Total | 174 (55.6%) | 139 (44.4%) |
Education in Oak Grove
School Enrollment in Oak Grove
The most common levels of schooling among the 112 students in Oak Grove are college / undergraduate (26 | 23.2%), middle school (25 | 22.3%), and elementary school (22 | 19.6%).
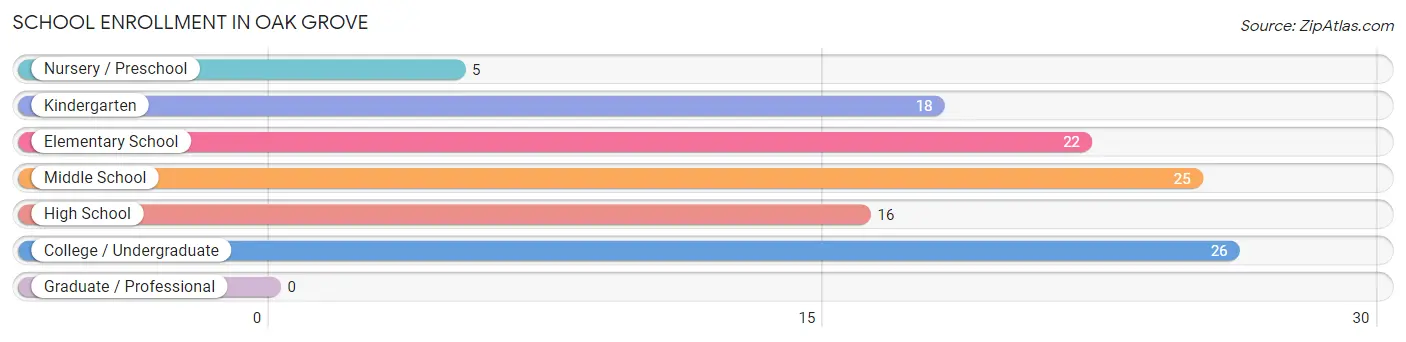
| School Level | # Students | % Students |
| Nursery / Preschool | 5 | 4.5% |
| Kindergarten | 18 | 16.1% |
| Elementary School | 22 | 19.6% |
| Middle School | 25 | 22.3% |
| High School | 16 | 14.3% |
| College / Undergraduate | 26 | 23.2% |
| Graduate / Professional | 0 | 0.0% |
| Total | 112 | 100.0% |
School Enrollment by Age by Funding Source in Oak Grove
Out of a total of 112 students who are enrolled in schools in Oak Grove, 25 (22.3%) attend a private institution, while the remaining 87 (77.7%) are enrolled in public schools. The age group of 25 to 34 year olds has the highest likelihood of being enrolled in private schools, with 19 (100.0% in the age bracket) enrolled. Conversely, the age group of 3 to 4 year olds has the lowest likelihood of being enrolled in a private school, with 1 (100.0% in the age bracket) attending a public institution.
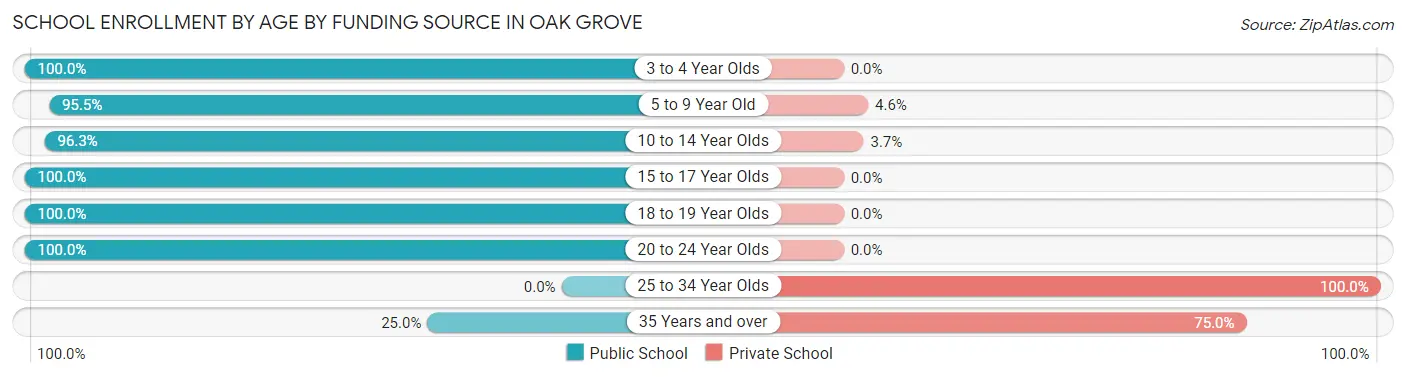
| Age Bracket | Public School | Private School |
| 3 to 4 Year Olds | 1 (100.0%) | 0 (0.0%) |
| 5 to 9 Year Old | 42 (95.5%) | 2 (4.5%) |
| 10 to 14 Year Olds | 26 (96.3%) | 1 (3.7%) |
| 15 to 17 Year Olds | 10 (100.0%) | 0 (0.0%) |
| 18 to 19 Year Olds | 5 (100.0%) | 0 (0.0%) |
| 20 to 24 Year Olds | 2 (100.0%) | 0 (0.0%) |
| 25 to 34 Year Olds | 0 (0.0%) | 19 (100.0%) |
| 35 Years and over | 1 (25.0%) | 3 (75.0%) |
| Total | 87 (77.7%) | 25 (22.3%) |
Educational Attainment by Field of Study in Oak Grove
Education (26 | 34.7%), business (19 | 25.3%), science & technology (11 | 14.7%), arts & humanities (7 | 9.3%), and computers & mathematics (3 | 4.0%) are the most common fields of study among 75 individuals in Oak Grove who have obtained a bachelor's degree or higher.
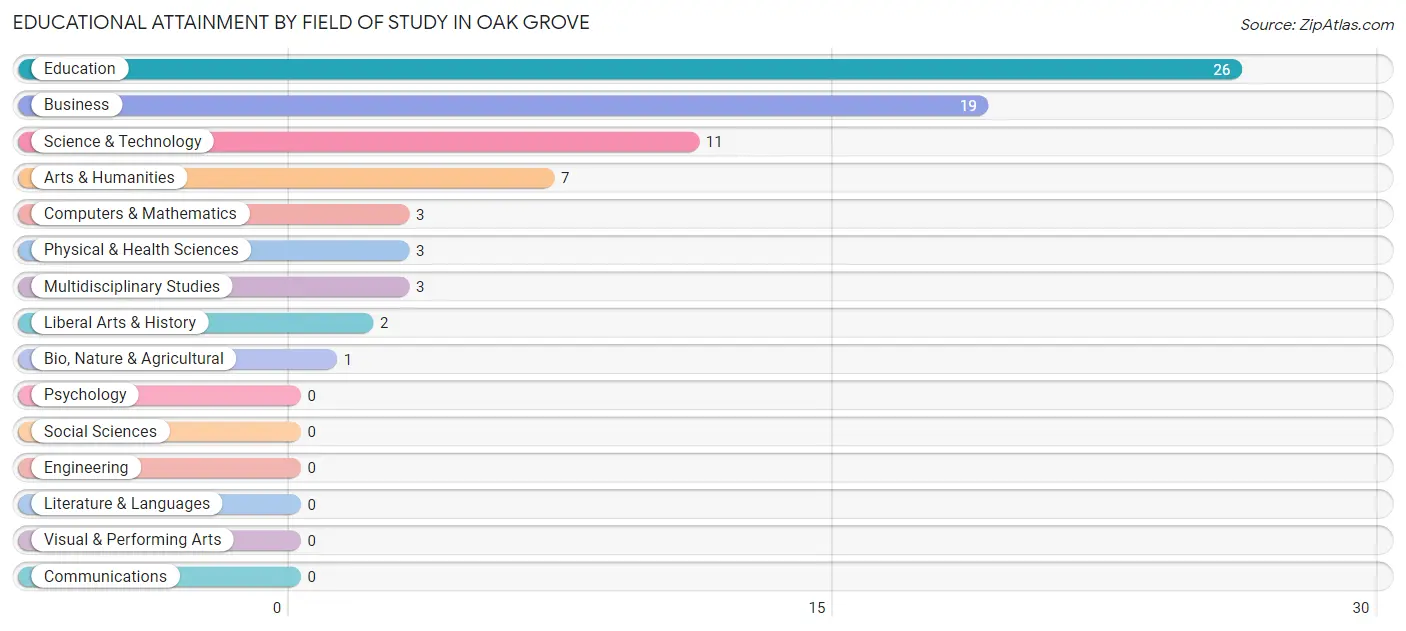
| Field of Study | # Graduates | % Graduates |
| Computers & Mathematics | 3 | 4.0% |
| Bio, Nature & Agricultural | 1 | 1.3% |
| Physical & Health Sciences | 3 | 4.0% |
| Psychology | 0 | 0.0% |
| Social Sciences | 0 | 0.0% |
| Engineering | 0 | 0.0% |
| Multidisciplinary Studies | 3 | 4.0% |
| Science & Technology | 11 | 14.7% |
| Business | 19 | 25.3% |
| Education | 26 | 34.7% |
| Literature & Languages | 0 | 0.0% |
| Liberal Arts & History | 2 | 2.7% |
| Visual & Performing Arts | 0 | 0.0% |
| Communications | 0 | 0.0% |
| Arts & Humanities | 7 | 9.3% |
| Total | 75 | 100.0% |
Transportation & Commute in Oak Grove
Vehicle Availability by Sex in Oak Grove
The most prevalent vehicle ownership categories in Oak Grove are males with 2 vehicles (76, accounting for 45.2%) and females with 2 vehicles (68, making up 54.7%).
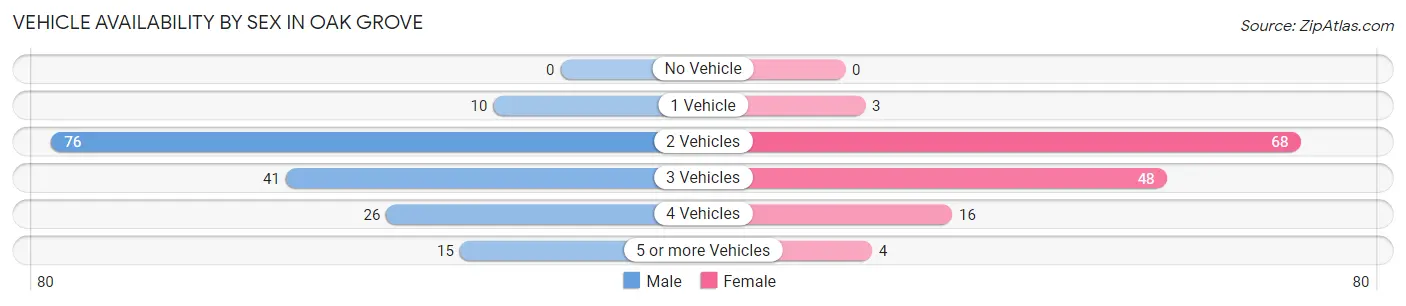
| Vehicles Available | Male | Female |
| No Vehicle | 0 (0.0%) | 0 (0.0%) |
| 1 Vehicle | 10 (5.9%) | 3 (2.2%) |
| 2 Vehicles | 76 (45.2%) | 68 (48.9%) |
| 3 Vehicles | 41 (24.4%) | 48 (34.5%) |
| 4 Vehicles | 26 (15.5%) | 16 (11.5%) |
| 5 or more Vehicles | 15 (8.9%) | 4 (2.9%) |
| Total | 168 (100.0%) | 139 (100.0%) |
Commute Time in Oak Grove
The most frequently occuring commute durations in Oak Grove are 45 to 59 minutes (115 commuters, 39.0%), 30 to 34 minutes (35 commuters, 11.9%), and 60 to 89 minutes (33 commuters, 11.2%).
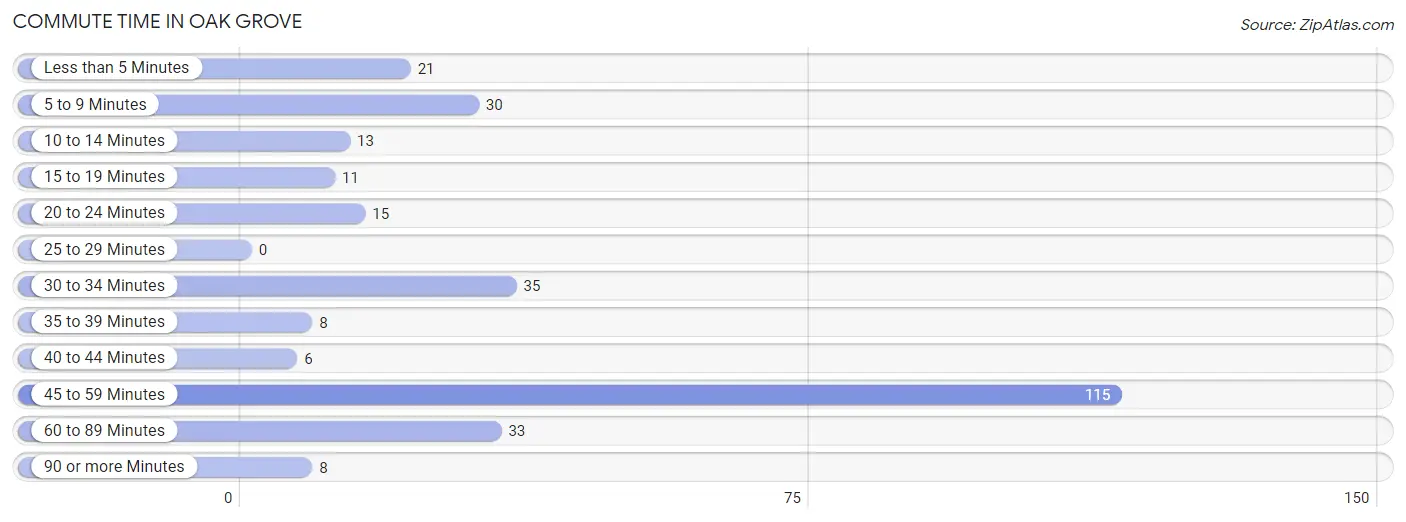
| Commute Time | # Commuters | % Commuters |
| Less than 5 Minutes | 21 | 7.1% |
| 5 to 9 Minutes | 30 | 10.2% |
| 10 to 14 Minutes | 13 | 4.4% |
| 15 to 19 Minutes | 11 | 3.7% |
| 20 to 24 Minutes | 15 | 5.1% |
| 25 to 29 Minutes | 0 | 0.0% |
| 30 to 34 Minutes | 35 | 11.9% |
| 35 to 39 Minutes | 8 | 2.7% |
| 40 to 44 Minutes | 6 | 2.0% |
| 45 to 59 Minutes | 115 | 39.0% |
| 60 to 89 Minutes | 33 | 11.2% |
| 90 or more Minutes | 8 | 2.7% |
Commute Time by Sex in Oak Grove
The most common commute times in Oak Grove are 45 to 59 minutes (66 commuters, 39.5%) for males and 45 to 59 minutes (49 commuters, 38.3%) for females.
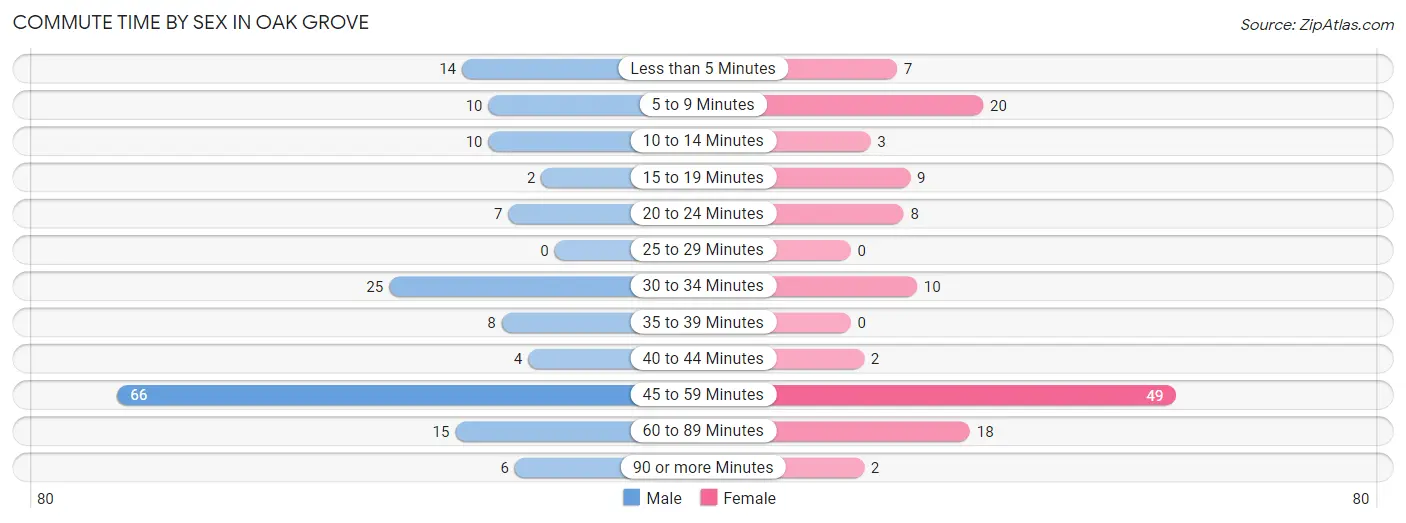
| Commute Time | Male | Female |
| Less than 5 Minutes | 14 (8.4%) | 7 (5.5%) |
| 5 to 9 Minutes | 10 (6.0%) | 20 (15.6%) |
| 10 to 14 Minutes | 10 (6.0%) | 3 (2.3%) |
| 15 to 19 Minutes | 2 (1.2%) | 9 (7.0%) |
| 20 to 24 Minutes | 7 (4.2%) | 8 (6.2%) |
| 25 to 29 Minutes | 0 (0.0%) | 0 (0.0%) |
| 30 to 34 Minutes | 25 (15.0%) | 10 (7.8%) |
| 35 to 39 Minutes | 8 (4.8%) | 0 (0.0%) |
| 40 to 44 Minutes | 4 (2.4%) | 2 (1.6%) |
| 45 to 59 Minutes | 66 (39.5%) | 49 (38.3%) |
| 60 to 89 Minutes | 15 (9.0%) | 18 (14.1%) |
| 90 or more Minutes | 6 (3.6%) | 2 (1.6%) |
Time of Departure to Work by Sex in Oak Grove
The most frequent times of departure to work in Oak Grove are 8:00 AM to 8:29 AM (68, 40.7%) for males and 7:30 AM to 7:59 AM (34, 26.6%) for females.
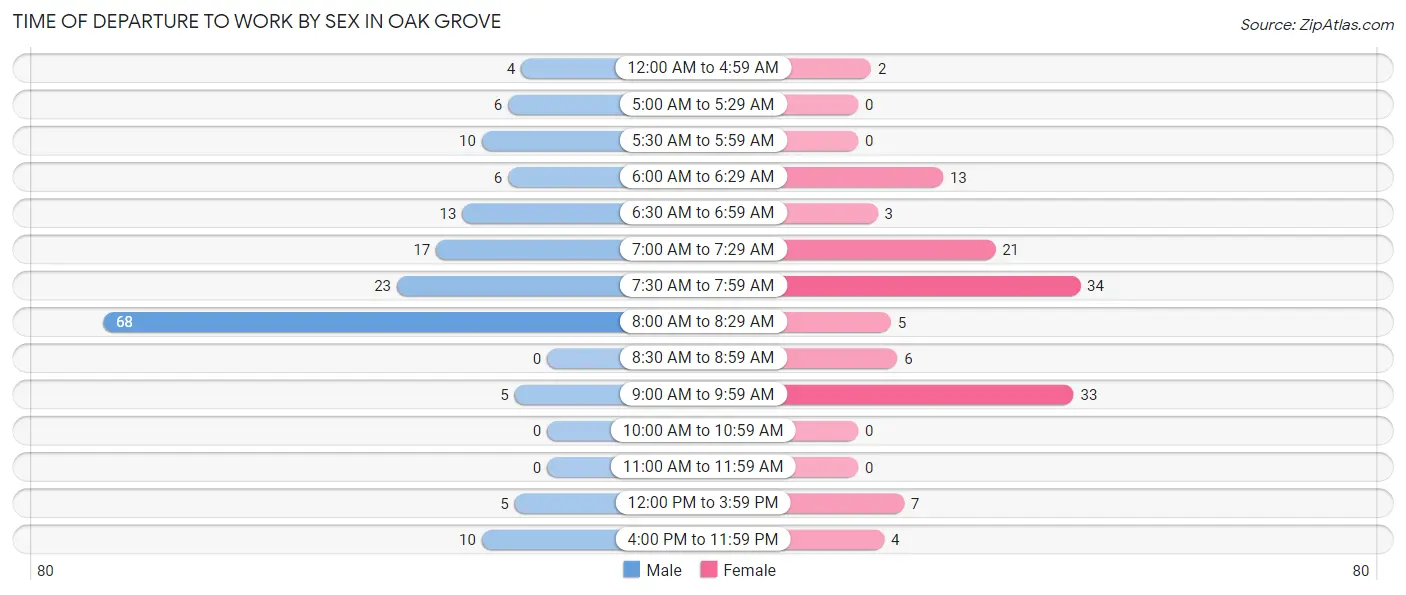
| Time of Departure | Male | Female |
| 12:00 AM to 4:59 AM | 4 (2.4%) | 2 (1.6%) |
| 5:00 AM to 5:29 AM | 6 (3.6%) | 0 (0.0%) |
| 5:30 AM to 5:59 AM | 10 (6.0%) | 0 (0.0%) |
| 6:00 AM to 6:29 AM | 6 (3.6%) | 13 (10.2%) |
| 6:30 AM to 6:59 AM | 13 (7.8%) | 3 (2.3%) |
| 7:00 AM to 7:29 AM | 17 (10.2%) | 21 (16.4%) |
| 7:30 AM to 7:59 AM | 23 (13.8%) | 34 (26.6%) |
| 8:00 AM to 8:29 AM | 68 (40.7%) | 5 (3.9%) |
| 8:30 AM to 8:59 AM | 0 (0.0%) | 6 (4.7%) |
| 9:00 AM to 9:59 AM | 5 (3.0%) | 33 (25.8%) |
| 10:00 AM to 10:59 AM | 0 (0.0%) | 0 (0.0%) |
| 11:00 AM to 11:59 AM | 0 (0.0%) | 0 (0.0%) |
| 12:00 PM to 3:59 PM | 5 (3.0%) | 7 (5.5%) |
| 4:00 PM to 11:59 PM | 10 (6.0%) | 4 (3.1%) |
| Total | 167 (100.0%) | 128 (100.0%) |
Housing Occupancy in Oak Grove
Occupancy by Ownership in Oak Grove
Of the total 252 dwellings in Oak Grove, owner-occupied units account for 235 (93.2%), while renter-occupied units make up 17 (6.8%).
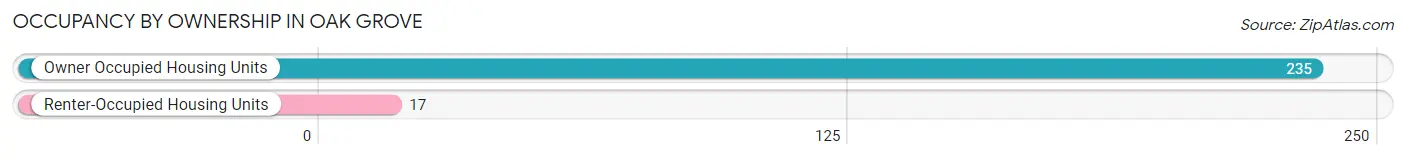
| Occupancy | # Housing Units | % Housing Units |
| Owner Occupied Housing Units | 235 | 93.2% |
| Renter-Occupied Housing Units | 17 | 6.8% |
| Total Occupied Housing Units | 252 | 100.0% |
Occupancy by Household Size in Oak Grove
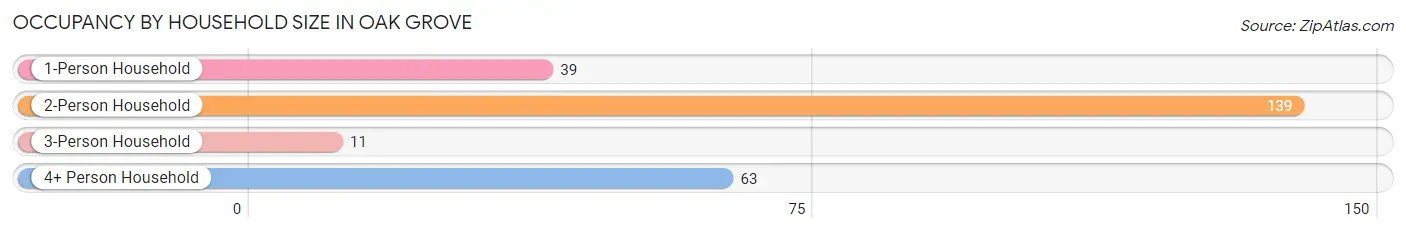
| Household Size | # Housing Units | % Housing Units |
| 1-Person Household | 39 | 15.5% |
| 2-Person Household | 139 | 55.2% |
| 3-Person Household | 11 | 4.4% |
| 4+ Person Household | 63 | 25.0% |
| Total Housing Units | 252 | 100.0% |
Occupancy by Ownership by Household Size in Oak Grove
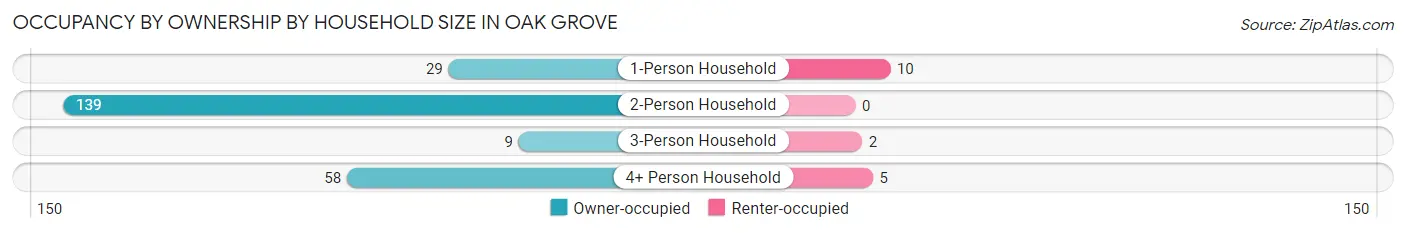
| Household Size | Owner-occupied | Renter-occupied |
| 1-Person Household | 29 (74.4%) | 10 (25.6%) |
| 2-Person Household | 139 (100.0%) | 0 (0.0%) |
| 3-Person Household | 9 (81.8%) | 2 (18.2%) |
| 4+ Person Household | 58 (92.1%) | 5 (7.9%) |
| Total Housing Units | 235 (93.2%) | 17 (6.8%) |
Occupancy by Educational Attainment in Oak Grove
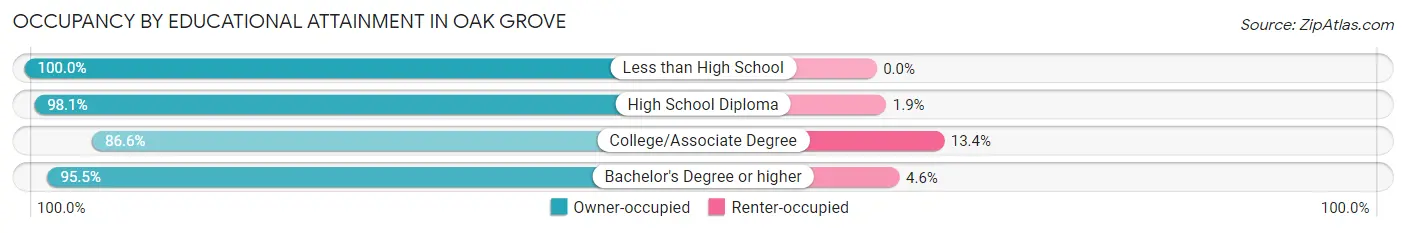
| Household Size | Owner-occupied | Renter-occupied |
| Less than High School | 7 (100.0%) | 0 (0.0%) |
| High School Diploma | 102 (98.1%) | 2 (1.9%) |
| College/Associate Degree | 84 (86.6%) | 13 (13.4%) |
| Bachelor's Degree or higher | 42 (95.5%) | 2 (4.5%) |
Occupancy by Age of Householder in Oak Grove
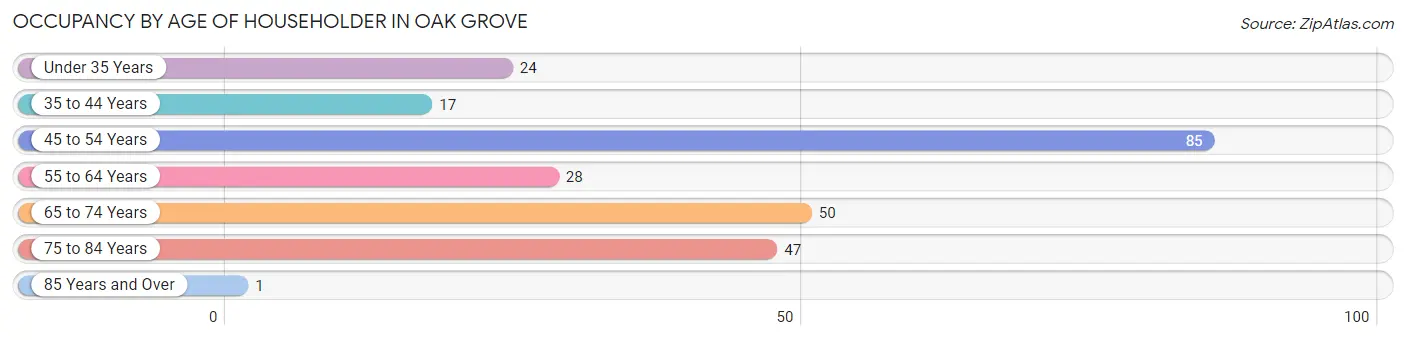
| Age Bracket | # Households | % Households |
| Under 35 Years | 24 | 9.5% |
| 35 to 44 Years | 17 | 6.8% |
| 45 to 54 Years | 85 | 33.7% |
| 55 to 64 Years | 28 | 11.1% |
| 65 to 74 Years | 50 | 19.8% |
| 75 to 84 Years | 47 | 18.6% |
| 85 Years and Over | 1 | 0.4% |
| Total | 252 | 100.0% |
Housing Finances in Oak Grove
Median Income by Occupancy in Oak Grove
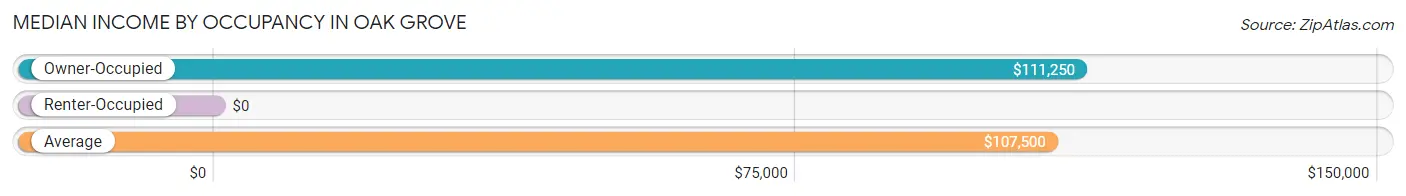
| Occupancy Type | # Households | Median Income |
| Owner-Occupied | 235 (93.2%) | $111,250 |
| Renter-Occupied | 17 (6.8%) | $0 |
| Average | 252 (100.0%) | $107,500 |
Occupancy by Householder Income Bracket in Oak Grove
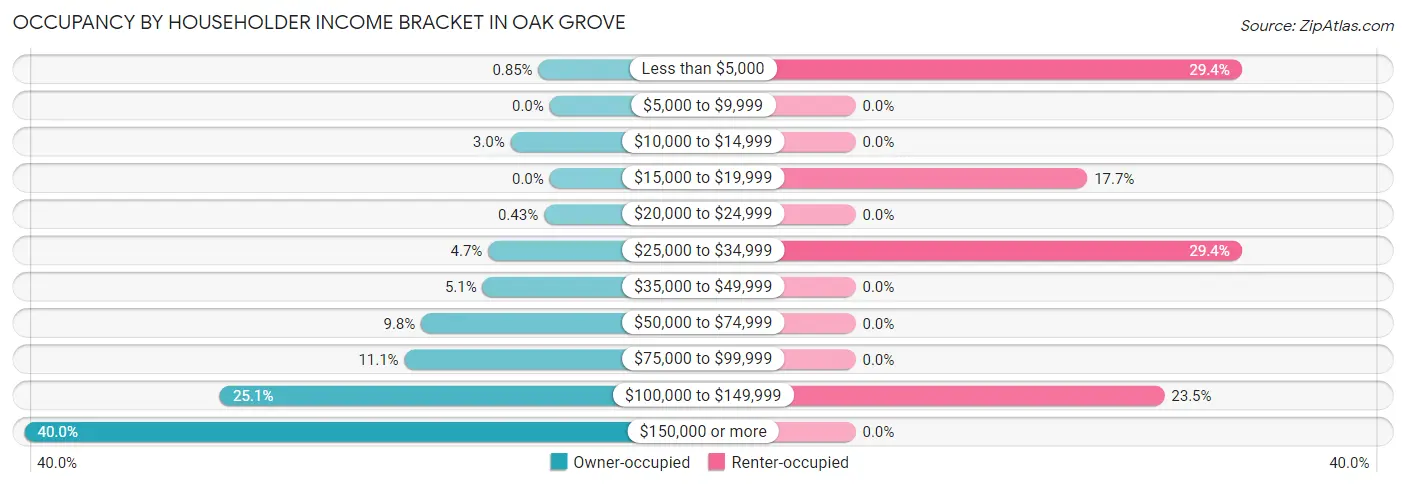
| Income Bracket | Owner-occupied | Renter-occupied |
| Less than $5,000 | 2 (0.9%) | 5 (29.4%) |
| $5,000 to $9,999 | 0 (0.0%) | 0 (0.0%) |
| $10,000 to $14,999 | 7 (3.0%) | 0 (0.0%) |
| $15,000 to $19,999 | 0 (0.0%) | 3 (17.6%) |
| $20,000 to $24,999 | 1 (0.4%) | 0 (0.0%) |
| $25,000 to $34,999 | 11 (4.7%) | 5 (29.4%) |
| $35,000 to $49,999 | 12 (5.1%) | 0 (0.0%) |
| $50,000 to $74,999 | 23 (9.8%) | 0 (0.0%) |
| $75,000 to $99,999 | 26 (11.1%) | 0 (0.0%) |
| $100,000 to $149,999 | 59 (25.1%) | 4 (23.5%) |
| $150,000 or more | 94 (40.0%) | 0 (0.0%) |
| Total | 235 (100.0%) | 17 (100.0%) |
Monthly Housing Cost Tiers in Oak Grove
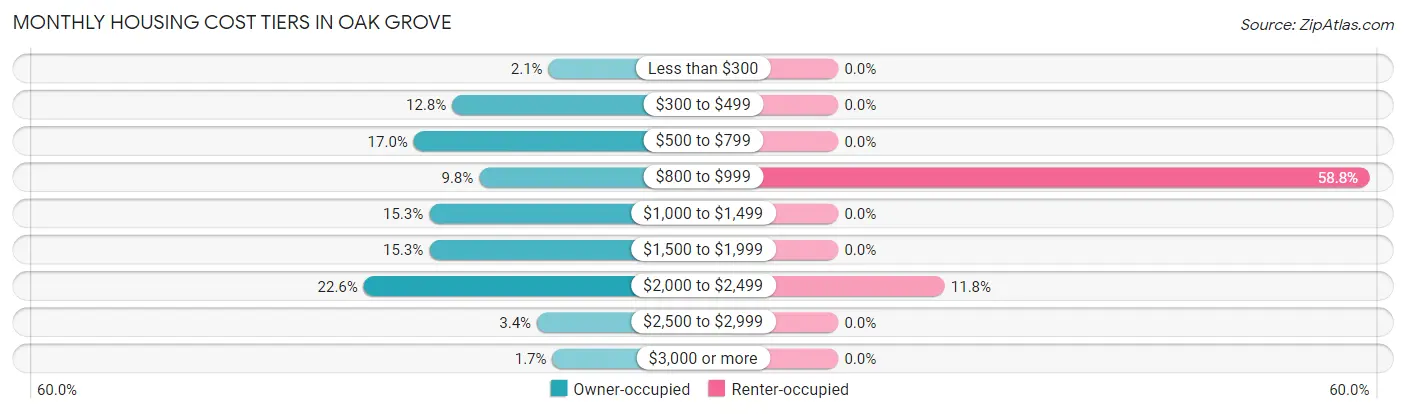
| Monthly Cost | Owner-occupied | Renter-occupied |
| Less than $300 | 5 (2.1%) | 0 (0.0%) |
| $300 to $499 | 30 (12.8%) | 0 (0.0%) |
| $500 to $799 | 40 (17.0%) | 0 (0.0%) |
| $800 to $999 | 23 (9.8%) | 10 (58.8%) |
| $1,000 to $1,499 | 36 (15.3%) | 0 (0.0%) |
| $1,500 to $1,999 | 36 (15.3%) | 0 (0.0%) |
| $2,000 to $2,499 | 53 (22.6%) | 2 (11.8%) |
| $2,500 to $2,999 | 8 (3.4%) | 0 (0.0%) |
| $3,000 or more | 4 (1.7%) | 0 (0.0%) |
| Total | 235 (100.0%) | 17 (100.0%) |
Physical Housing Characteristics in Oak Grove
Housing Structures in Oak Grove
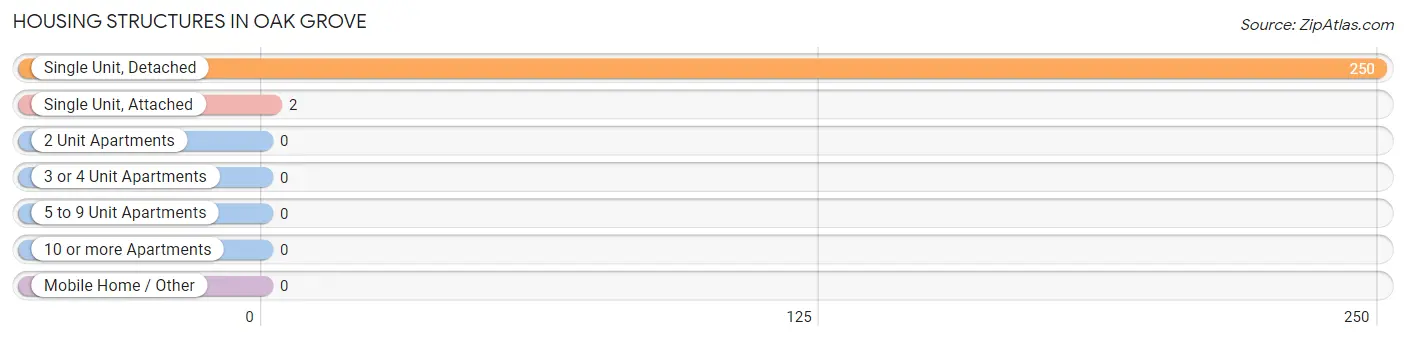
| Structure Type | # Housing Units | % Housing Units |
| Single Unit, Detached | 250 | 99.2% |
| Single Unit, Attached | 2 | 0.8% |
| 2 Unit Apartments | 0 | 0.0% |
| 3 or 4 Unit Apartments | 0 | 0.0% |
| 5 to 9 Unit Apartments | 0 | 0.0% |
| 10 or more Apartments | 0 | 0.0% |
| Mobile Home / Other | 0 | 0.0% |
| Total | 252 | 100.0% |
Housing Structures by Occupancy in Oak Grove
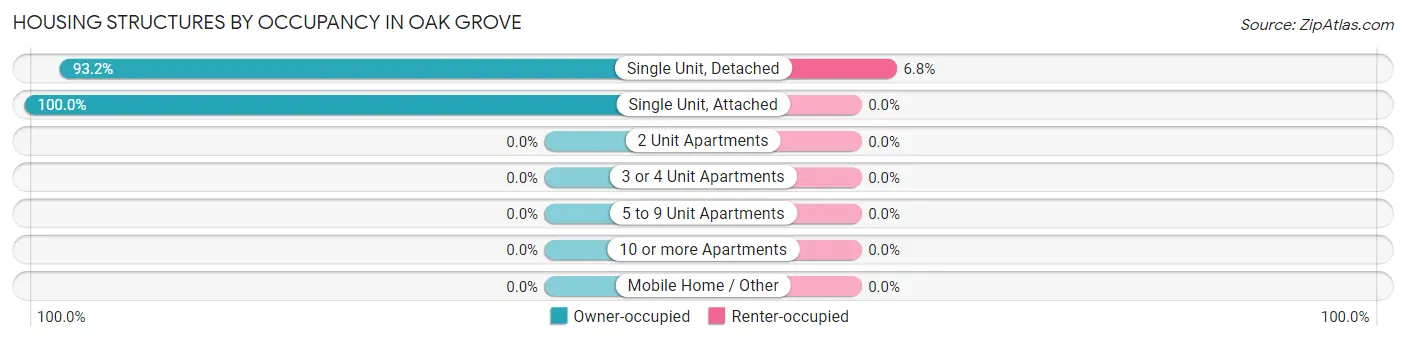
| Structure Type | Owner-occupied | Renter-occupied |
| Single Unit, Detached | 233 (93.2%) | 17 (6.8%) |
| Single Unit, Attached | 2 (100.0%) | 0 (0.0%) |
| 2 Unit Apartments | 0 (0.0%) | 0 (0.0%) |
| 3 or 4 Unit Apartments | 0 (0.0%) | 0 (0.0%) |
| 5 to 9 Unit Apartments | 0 (0.0%) | 0 (0.0%) |
| 10 or more Apartments | 0 (0.0%) | 0 (0.0%) |
| Mobile Home / Other | 0 (0.0%) | 0 (0.0%) |
| Total | 235 (93.2%) | 17 (6.8%) |
Housing Structures by Number of Rooms in Oak Grove
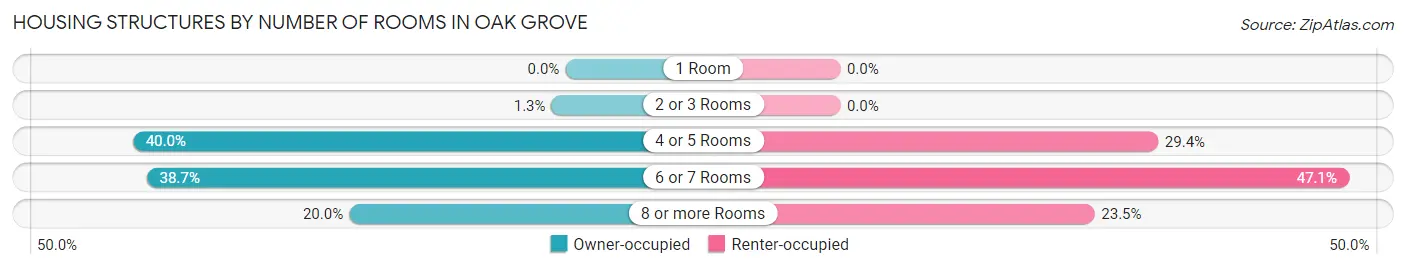
| Number of Rooms | Owner-occupied | Renter-occupied |
| 1 Room | 0 (0.0%) | 0 (0.0%) |
| 2 or 3 Rooms | 3 (1.3%) | 0 (0.0%) |
| 4 or 5 Rooms | 94 (40.0%) | 5 (29.4%) |
| 6 or 7 Rooms | 91 (38.7%) | 8 (47.1%) |
| 8 or more Rooms | 47 (20.0%) | 4 (23.5%) |
| Total | 235 (100.0%) | 17 (100.0%) |
Housing Structure by Heating Type in Oak Grove
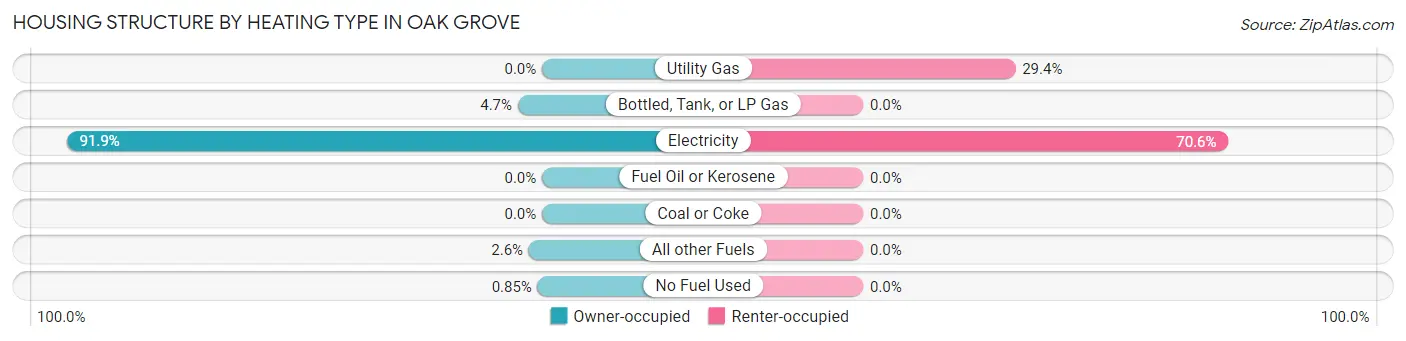
| Heating Type | Owner-occupied | Renter-occupied |
| Utility Gas | 0 (0.0%) | 5 (29.4%) |
| Bottled, Tank, or LP Gas | 11 (4.7%) | 0 (0.0%) |
| Electricity | 216 (91.9%) | 12 (70.6%) |
| Fuel Oil or Kerosene | 0 (0.0%) | 0 (0.0%) |
| Coal or Coke | 0 (0.0%) | 0 (0.0%) |
| All other Fuels | 6 (2.5%) | 0 (0.0%) |
| No Fuel Used | 2 (0.9%) | 0 (0.0%) |
| Total | 235 (100.0%) | 17 (100.0%) |
Household Vehicle Usage in Oak Grove
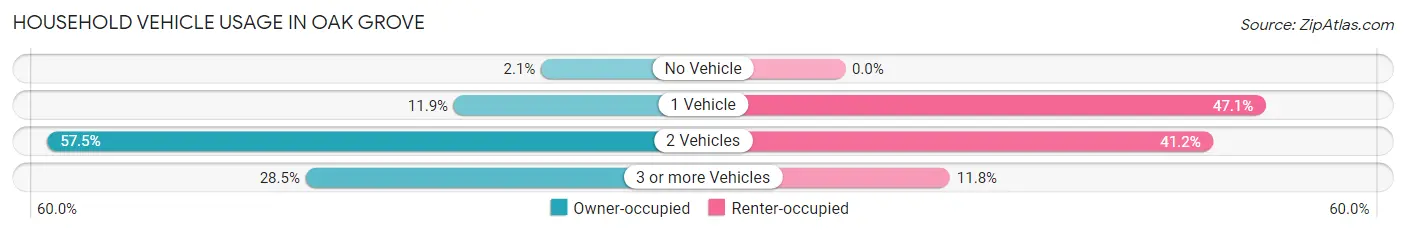
| Vehicles per Household | Owner-occupied | Renter-occupied |
| No Vehicle | 5 (2.1%) | 0 (0.0%) |
| 1 Vehicle | 28 (11.9%) | 8 (47.1%) |
| 2 Vehicles | 135 (57.5%) | 7 (41.2%) |
| 3 or more Vehicles | 67 (28.5%) | 2 (11.8%) |
| Total | 235 (100.0%) | 17 (100.0%) |
Real Estate & Mortgages in Oak Grove
Real Estate and Mortgage Overview in Oak Grove
| Characteristic | Without Mortgage | With Mortgage |
| Housing Units | 119 | 116 |
| Median Property Value | $265,200 | $235,400 |
| Median Household Income | $79,583 | $80 |
| Monthly Housing Costs | $682 | $4 |
| Real Estate Taxes | $2,852 | $0 |
Property Value by Mortgage Status in Oak Grove
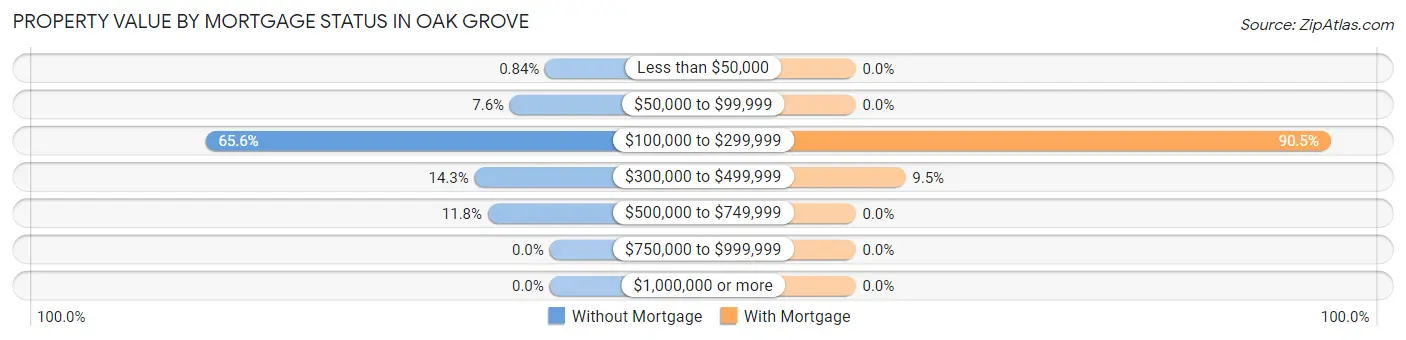
| Property Value | Without Mortgage | With Mortgage |
| Less than $50,000 | 1 (0.8%) | 0 (0.0%) |
| $50,000 to $99,999 | 9 (7.6%) | 0 (0.0%) |
| $100,000 to $299,999 | 78 (65.5%) | 105 (90.5%) |
| $300,000 to $499,999 | 17 (14.3%) | 11 (9.5%) |
| $500,000 to $749,999 | 14 (11.8%) | 0 (0.0%) |
| $750,000 to $999,999 | 0 (0.0%) | 0 (0.0%) |
| $1,000,000 or more | 0 (0.0%) | 0 (0.0%) |
| Total | 119 (100.0%) | 116 (100.0%) |
Household Income by Mortgage Status in Oak Grove
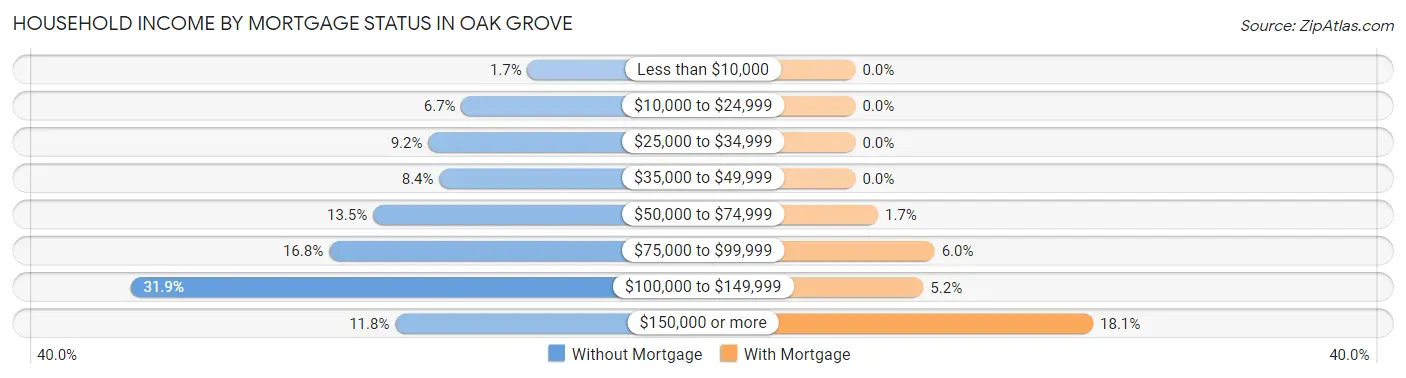
| Household Income | Without Mortgage | With Mortgage |
| Less than $10,000 | 2 (1.7%) | 0 (0.0%) |
| $10,000 to $24,999 | 8 (6.7%) | 0 (0.0%) |
| $25,000 to $34,999 | 11 (9.2%) | 0 (0.0%) |
| $35,000 to $49,999 | 10 (8.4%) | 0 (0.0%) |
| $50,000 to $74,999 | 16 (13.5%) | 2 (1.7%) |
| $75,000 to $99,999 | 20 (16.8%) | 7 (6.0%) |
| $100,000 to $149,999 | 38 (31.9%) | 6 (5.2%) |
| $150,000 or more | 14 (11.8%) | 21 (18.1%) |
| Total | 119 (100.0%) | 116 (100.0%) |
Property Value to Household Income Ratio in Oak Grove
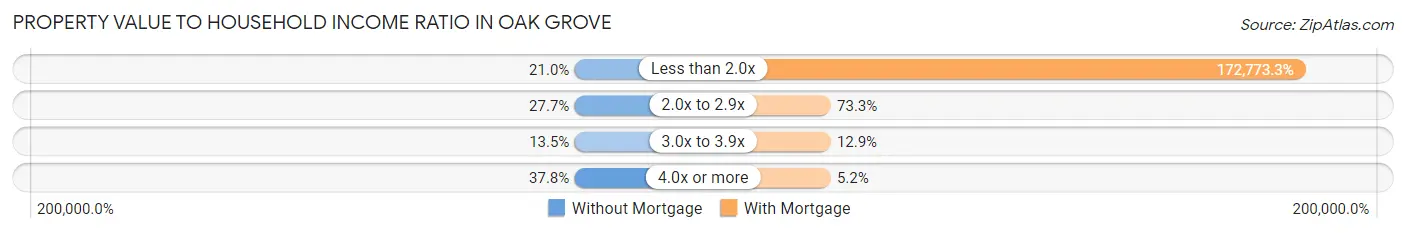
| Value-to-Income Ratio | Without Mortgage | With Mortgage |
| Less than 2.0x | 25 (21.0%) | 200,417 (172,773.3%) |
| 2.0x to 2.9x | 33 (27.7%) | 85 (73.3%) |
| 3.0x to 3.9x | 16 (13.5%) | 15 (12.9%) |
| 4.0x or more | 45 (37.8%) | 6 (5.2%) |
| Total | 119 (100.0%) | 116 (100.0%) |
Real Estate Taxes by Mortgage Status in Oak Grove
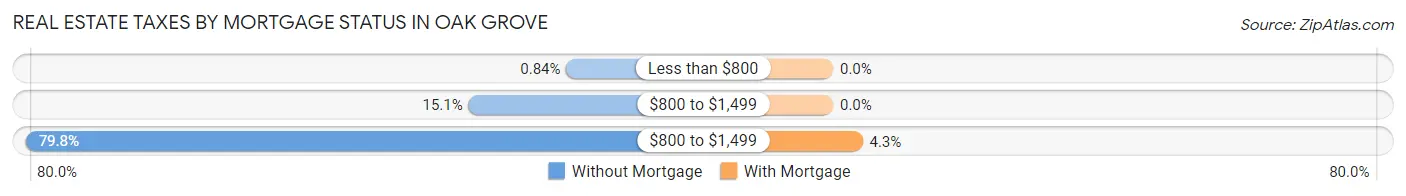
| Property Taxes | Without Mortgage | With Mortgage |
| Less than $800 | 1 (0.8%) | 0 (0.0%) |
| $800 to $1,499 | 18 (15.1%) | 0 (0.0%) |
| $800 to $1,499 | 95 (79.8%) | 5 (4.3%) |
| Total | 119 (100.0%) | 116 (100.0%) |
Health & Disability in Oak Grove
Health Insurance Coverage by Age in Oak Grove
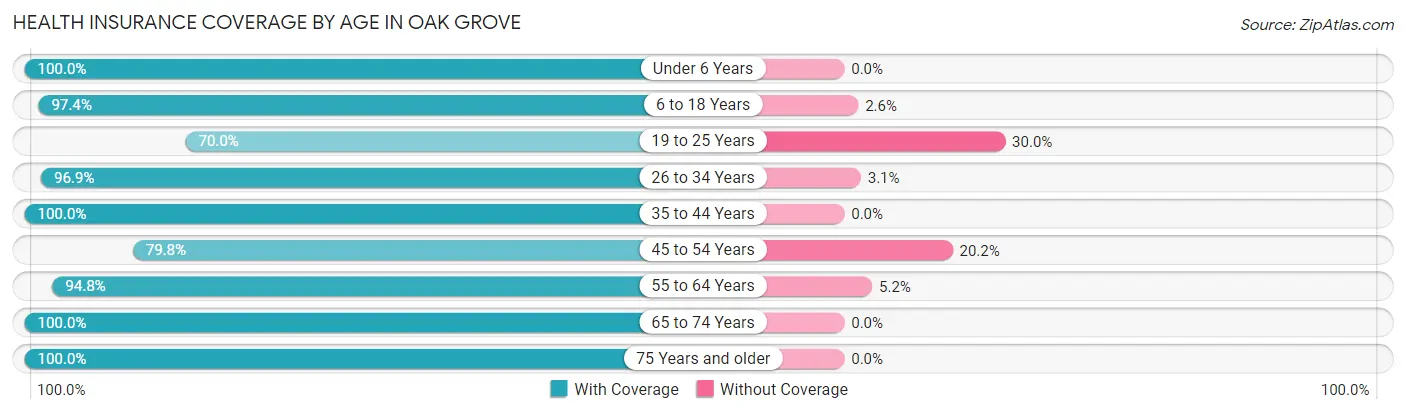
| Age Bracket | With Coverage | Without Coverage |
| Under 6 Years | 67 (100.0%) | 0 (0.0%) |
| 6 to 18 Years | 75 (97.4%) | 2 (2.6%) |
| 19 to 25 Years | 14 (70.0%) | 6 (30.0%) |
| 26 to 34 Years | 63 (96.9%) | 2 (3.1%) |
| 35 to 44 Years | 42 (100.0%) | 0 (0.0%) |
| 45 to 54 Years | 91 (79.8%) | 23 (20.2%) |
| 55 to 64 Years | 73 (94.8%) | 4 (5.2%) |
| 65 to 74 Years | 84 (100.0%) | 0 (0.0%) |
| 75 Years and older | 74 (100.0%) | 0 (0.0%) |
| Total | 583 (94.0%) | 37 (6.0%) |
Health Insurance Coverage by Citizenship Status in Oak Grove

| Citizenship Status | With Coverage | Without Coverage |
| Native Born | 67 (100.0%) | 0 (0.0%) |
| Foreign Born, Citizen | 75 (97.4%) | 2 (2.6%) |
| Foreign Born, not a Citizen | 14 (70.0%) | 6 (30.0%) |
Health Insurance Coverage by Household Income in Oak Grove
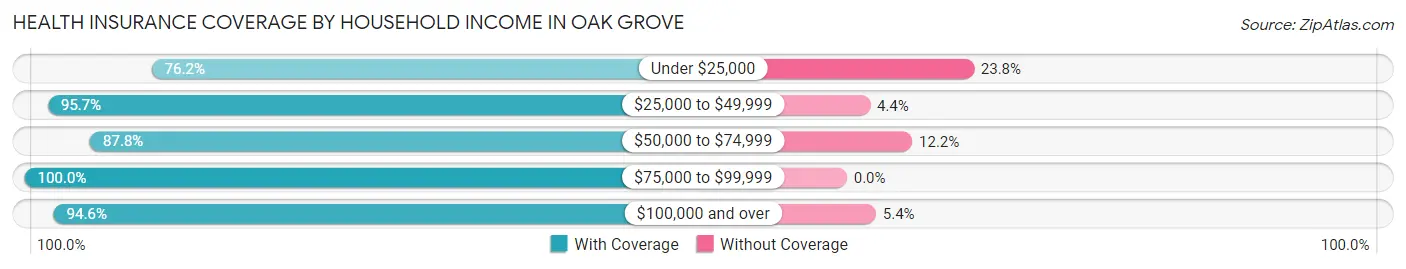
| Household Income | With Coverage | Without Coverage |
| Under $25,000 | 16 (76.2%) | 5 (23.8%) |
| $25,000 to $49,999 | 66 (95.7%) | 3 (4.3%) |
| $50,000 to $74,999 | 43 (87.8%) | 6 (12.2%) |
| $75,000 to $99,999 | 58 (100.0%) | 0 (0.0%) |
| $100,000 and over | 400 (94.6%) | 23 (5.4%) |
Public vs Private Health Insurance Coverage by Age in Oak Grove
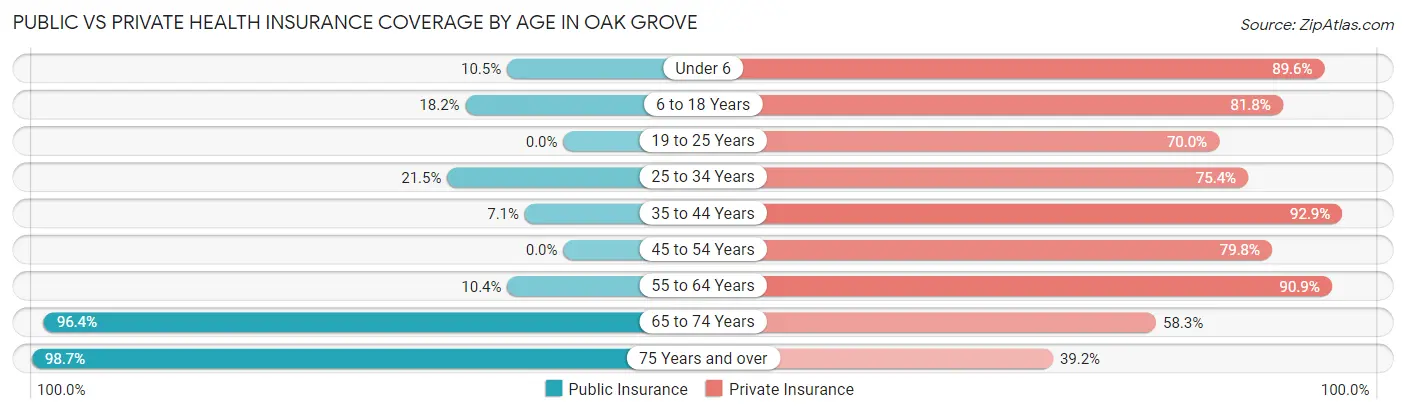
| Age Bracket | Public Insurance | Private Insurance |
| Under 6 | 7 (10.4%) | 60 (89.5%) |
| 6 to 18 Years | 14 (18.2%) | 63 (81.8%) |
| 19 to 25 Years | 0 (0.0%) | 14 (70.0%) |
| 25 to 34 Years | 14 (21.5%) | 49 (75.4%) |
| 35 to 44 Years | 3 (7.1%) | 39 (92.9%) |
| 45 to 54 Years | 0 (0.0%) | 91 (79.8%) |
| 55 to 64 Years | 8 (10.4%) | 70 (90.9%) |
| 65 to 74 Years | 81 (96.4%) | 49 (58.3%) |
| 75 Years and over | 73 (98.7%) | 29 (39.2%) |
| Total | 200 (32.3%) | 464 (74.8%) |
Disability Status by Sex by Age in Oak Grove
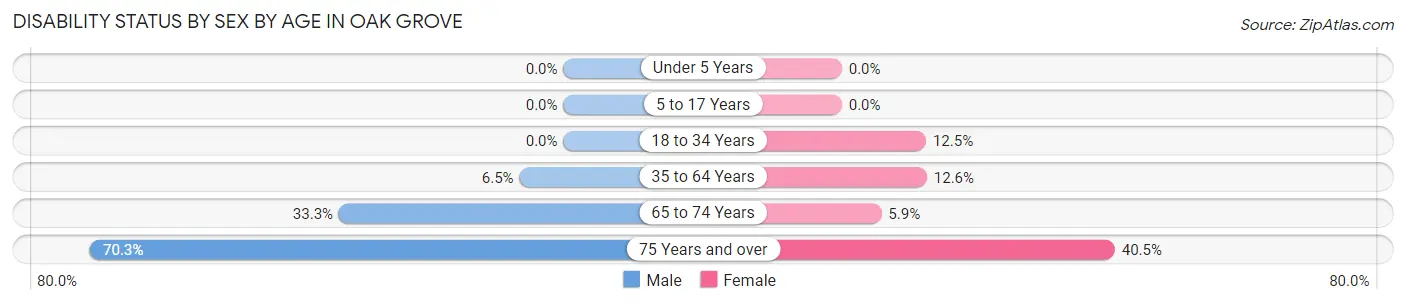
| Age Bracket | Male | Female |
| Under 5 Years | 0 (0.0%) | 0 (0.0%) |
| 5 to 17 Years | 0 (0.0%) | 0 (0.0%) |
| 18 to 34 Years | 0 (0.0%) | 6 (12.5%) |
| 35 to 64 Years | 9 (6.5%) | 12 (12.6%) |
| 65 to 74 Years | 11 (33.3%) | 3 (5.9%) |
| 75 Years and over | 26 (70.3%) | 15 (40.5%) |
Disability Class by Sex by Age in Oak Grove
Disability Class: Hearing Difficulty
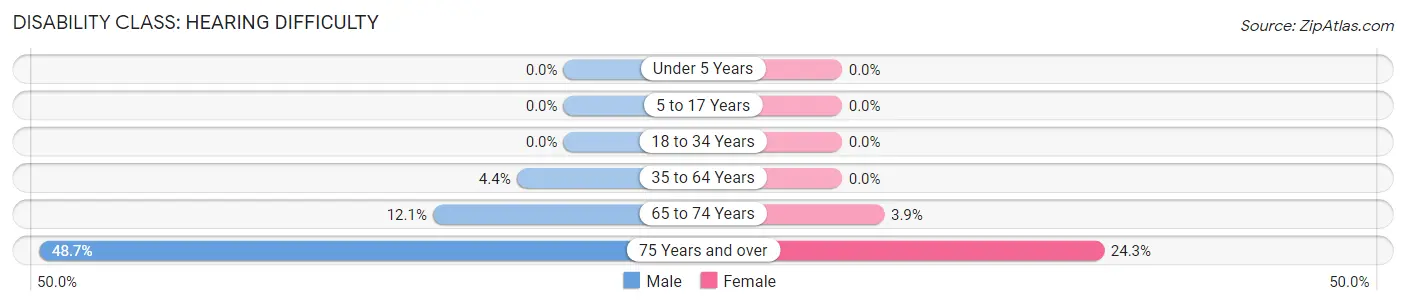
| Age Bracket | Male | Female |
| Under 5 Years | 0 (0.0%) | 0 (0.0%) |
| 5 to 17 Years | 0 (0.0%) | 0 (0.0%) |
| 18 to 34 Years | 0 (0.0%) | 0 (0.0%) |
| 35 to 64 Years | 6 (4.3%) | 0 (0.0%) |
| 65 to 74 Years | 4 (12.1%) | 2 (3.9%) |
| 75 Years and over | 18 (48.6%) | 9 (24.3%) |
Disability Class: Vision Difficulty
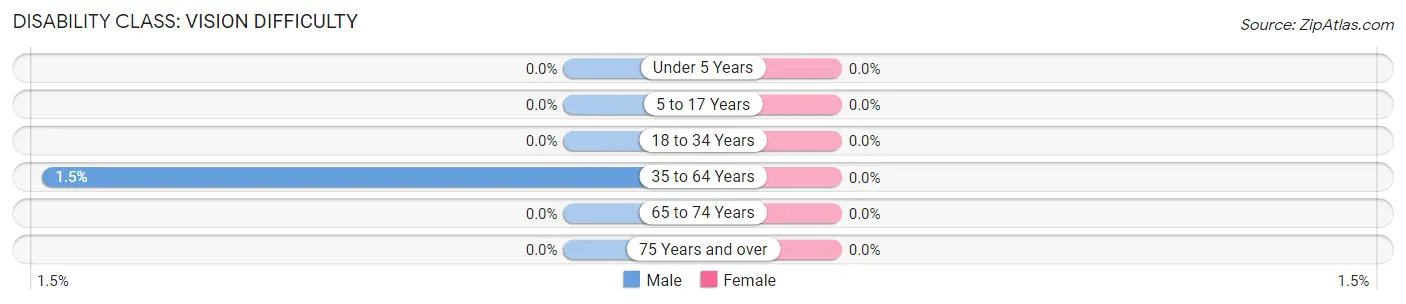
| Age Bracket | Male | Female |
| Under 5 Years | 0 (0.0%) | 0 (0.0%) |
| 5 to 17 Years | 0 (0.0%) | 0 (0.0%) |
| 18 to 34 Years | 0 (0.0%) | 0 (0.0%) |
| 35 to 64 Years | 2 (1.5%) | 0 (0.0%) |
| 65 to 74 Years | 0 (0.0%) | 0 (0.0%) |
| 75 Years and over | 0 (0.0%) | 0 (0.0%) |
Disability Class: Cognitive Difficulty
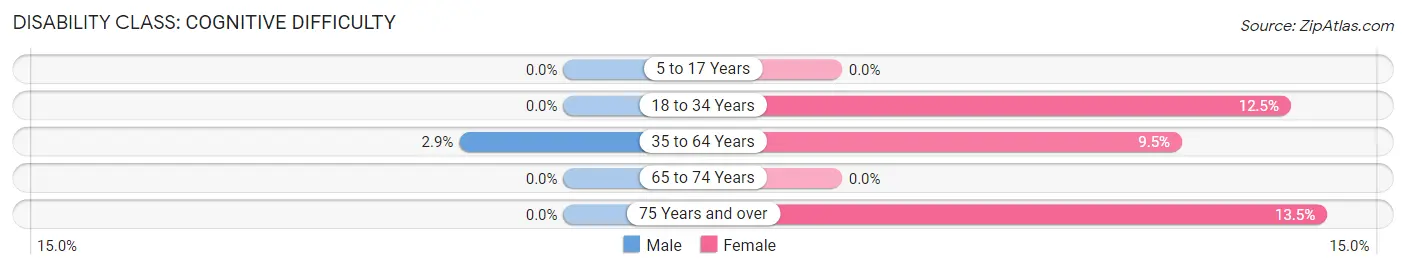
| Age Bracket | Male | Female |
| 5 to 17 Years | 0 (0.0%) | 0 (0.0%) |
| 18 to 34 Years | 0 (0.0%) | 6 (12.5%) |
| 35 to 64 Years | 4 (2.9%) | 9 (9.5%) |
| 65 to 74 Years | 0 (0.0%) | 0 (0.0%) |
| 75 Years and over | 0 (0.0%) | 5 (13.5%) |
Disability Class: Ambulatory Difficulty
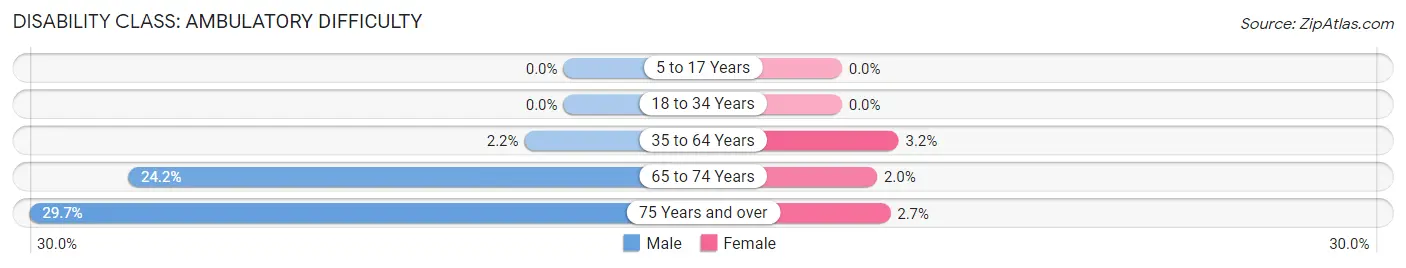
| Age Bracket | Male | Female |
| 5 to 17 Years | 0 (0.0%) | 0 (0.0%) |
| 18 to 34 Years | 0 (0.0%) | 0 (0.0%) |
| 35 to 64 Years | 3 (2.2%) | 3 (3.2%) |
| 65 to 74 Years | 8 (24.2%) | 1 (2.0%) |
| 75 Years and over | 11 (29.7%) | 1 (2.7%) |
Disability Class: Self-Care Difficulty
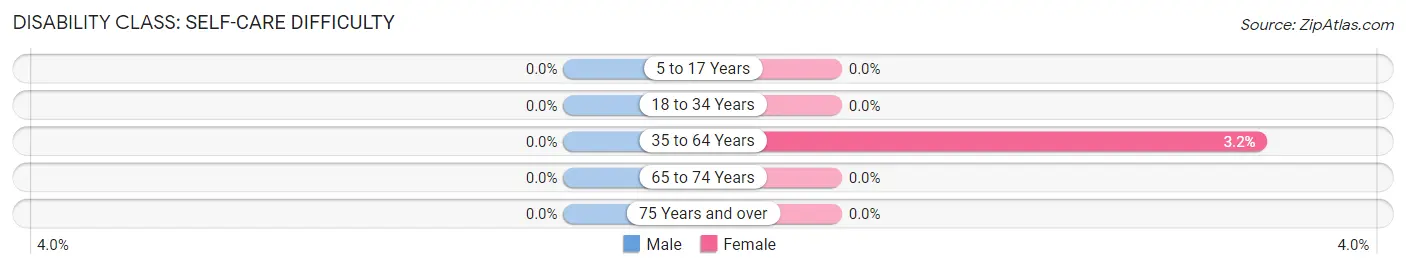
| Age Bracket | Male | Female |
| 5 to 17 Years | 0 (0.0%) | 0 (0.0%) |
| 18 to 34 Years | 0 (0.0%) | 0 (0.0%) |
| 35 to 64 Years | 0 (0.0%) | 3 (3.2%) |
| 65 to 74 Years | 0 (0.0%) | 0 (0.0%) |
| 75 Years and over | 0 (0.0%) | 0 (0.0%) |
Technology Access in Oak Grove
Computing Device Access in Oak Grove
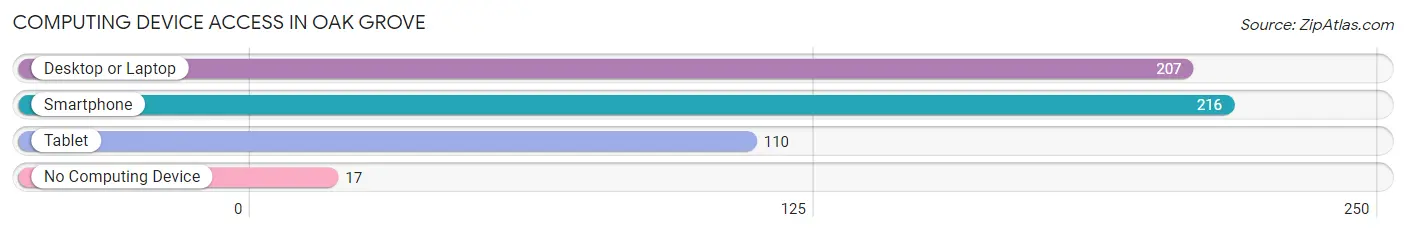
| Device Type | # Households | % Households |
| Desktop or Laptop | 207 | 82.1% |
| Smartphone | 216 | 85.7% |
| Tablet | 110 | 43.6% |
| No Computing Device | 17 | 6.8% |
| Total | 252 | 100.0% |
Internet Access in Oak Grove
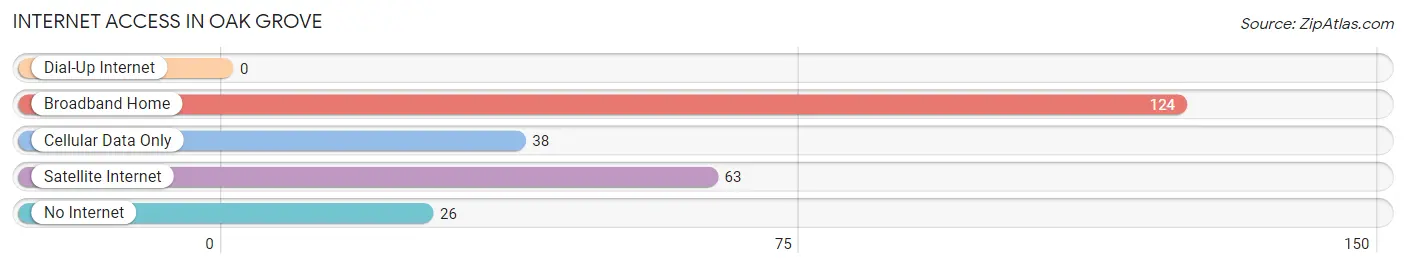
| Internet Type | # Households | % Households |
| Dial-Up Internet | 0 | 0.0% |
| Broadband Home | 124 | 49.2% |
| Cellular Data Only | 38 | 15.1% |
| Satellite Internet | 63 | 25.0% |
| No Internet | 26 | 10.3% |
| Total | 252 | 100.0% |
Oak Grove Summary
Oak Grove is a small unincorporated community located in the southeastern corner of Smith County, Texas. It is situated approximately 10 miles east of Tyler, the county seat, and is part of the Tyler Metropolitan Statistical Area. The community is located on the banks of the Neches River and is surrounded by rolling hills and lush forests.
History
The area that is now Oak Grove was first settled in the early 1800s by a group of settlers from Tennessee. The settlers named the area Oak Grove due to the abundance of oak trees in the area. The community was officially established in 1845 when the first post office was opened.
In the late 1800s, the community began to grow and prosper. The economy was largely based on agriculture, with cotton being the main crop. The community also had several sawmills and gristmills, which provided lumber and grain for the local population.
In the early 1900s, the economy shifted to timber and oil production. The discovery of oil in the area in the 1920s led to a boom in the local economy. The population of Oak Grove grew rapidly during this time, and the community became a hub for the oil industry.
In the 1950s, the economy shifted again, this time to manufacturing. Several factories were built in the area, providing jobs for the local population. The population of Oak Grove continued to grow throughout the 1950s and 1960s, reaching its peak in the 1970s.
Geography
Oak Grove is located in the southeastern corner of Smith County, Texas. It is situated approximately 10 miles east of Tyler, the county seat. The community is located on the banks of the Neches River and is surrounded by rolling hills and lush forests.
The climate in Oak Grove is humid subtropical, with hot summers and mild winters. The average annual temperature is around 70 degrees Fahrenheit, with temperatures reaching as high as 95 degrees in the summer and as low as 40 degrees in the winter.
Economy
The economy of Oak Grove is largely based on agriculture and manufacturing. The area is home to several farms, which produce a variety of crops, including cotton, corn, soybeans, and wheat. The area also has several factories, which produce a variety of products, including furniture, clothing, and electronics.
The area is also home to several oil and gas companies, which provide jobs for the local population. The area is also home to several retail stores, restaurants, and other businesses, which provide services to the local population.
Demographics
As of the 2010 census, the population of Oak Grove was 1,845. The racial makeup of the community was 79.3% White, 16.2% African American, 0.7% Native American, 0.3% Asian, 0.1% Pacific Islander, and 3.4% from other races. The median household income was $37,917, and the median family income was $45,938.
Conclusion
Oak Grove is a small unincorporated community located in the southeastern corner of Smith County, Texas. It is situated approximately 10 miles east of Tyler, the county seat, and is part of the Tyler Metropolitan Statistical Area. The community is located on the banks of the Neches River and is surrounded by rolling hills and lush forests. The economy of Oak Grove is largely based on agriculture and manufacturing, with oil and gas production also playing a role. The population of Oak Grove was 1,845 as of the 2010 census, with the median household income being $37,917.
Common Questions
What is Per Capita Income in Oak Grove?
Per Capita income in Oak Grove is $45,648.
What is the Median Family Income in Oak Grove?
Median Family Income in Oak Grove is $121,667.
What is the Median Household income in Oak Grove?
Median Household Income in Oak Grove is $107,500.
What is Income or Wage Gap in Oak Grove?
Income or Wage Gap in Oak Grove is 39.3%.
Women in Oak Grove earn 60.7 cents for every dollar earned by a man.
What is Inequality or Gini Index in Oak Grove?
Inequality or Gini Index in Oak Grove is 0.33.
What is the Total Population of Oak Grove?
Total Population of Oak Grove is 620.
What is the Total Male Population of Oak Grove?
Total Male Population of Oak Grove is 347.
What is the Total Female Population of Oak Grove?
Total Female Population of Oak Grove is 273.
What is the Ratio of Males per 100 Females in Oak Grove?
There are 127.11 Males per 100 Females in Oak Grove.
What is the Ratio of Females per 100 Males in Oak Grove?
There are 78.67 Females per 100 Males in Oak Grove.
What is the Median Population Age in Oak Grove?
Median Population Age in Oak Grove is 52.0 Years.
What is the Average Family Size in Oak Grove
Average Family Size in Oak Grove is 2.7 People.
What is the Average Household Size in Oak Grove
Average Household Size in Oak Grove is 2.5 People.
How Large is the Labor Force in Oak Grove?
There are 313 People in the Labor Forcein in Oak Grove.
What is the Percentage of People in the Labor Force in Oak Grove?
64.0% of People are in the Labor Force in Oak Grove.