Jones Creek, TX Map & Demographics
Jones Creek Map
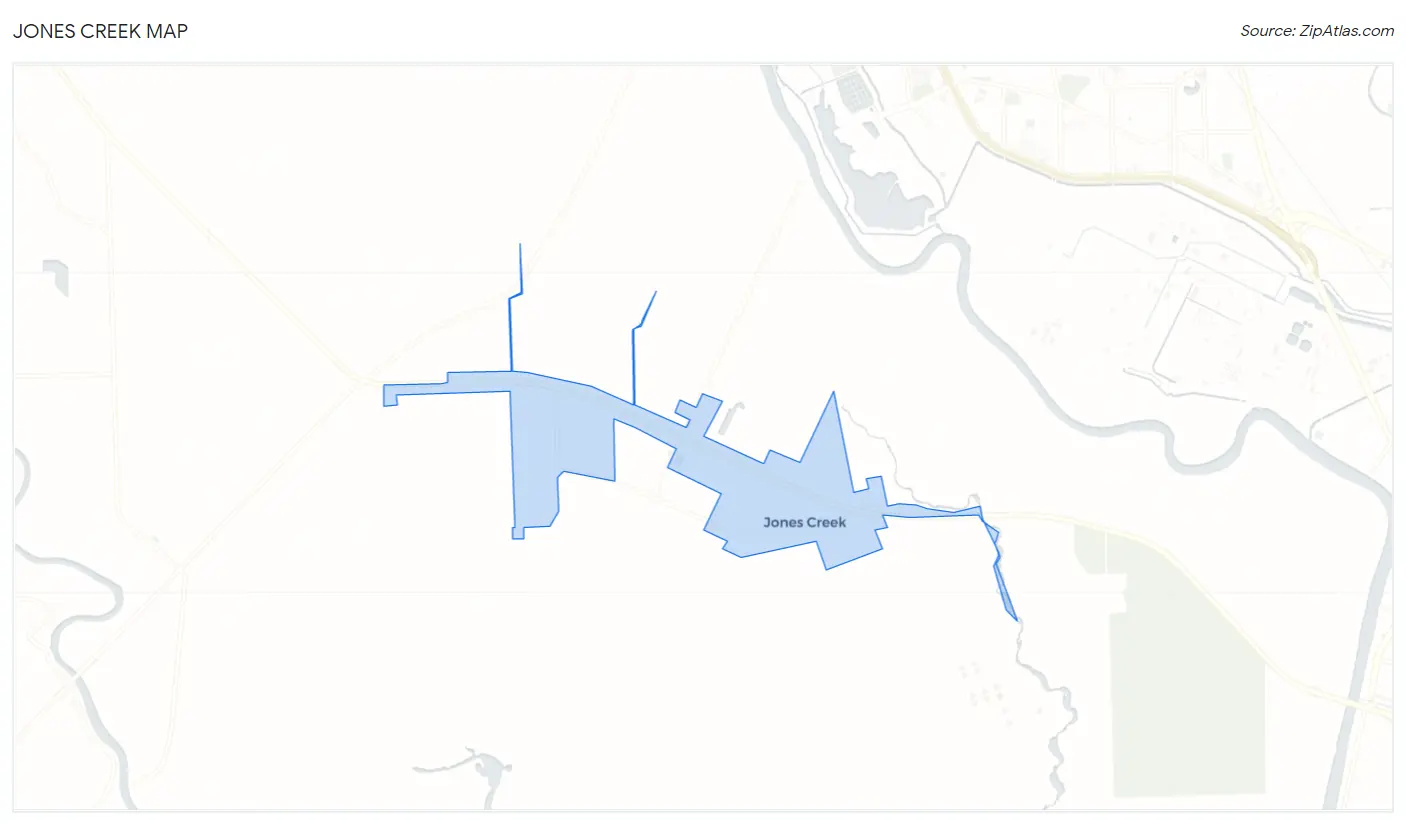
Jones Creek Overview
$27,554
PER CAPITA INCOME
$85,625
AVG FAMILY INCOME
$71,136
AVG HOUSEHOLD INCOME
51.2%
WAGE / INCOME GAP [ % ]
48.8¢/ $1
WAGE / INCOME GAP [ $ ]
0.40
INEQUALITY / GINI INDEX
1,936
TOTAL POPULATION
919
MALE POPULATION
1,017
FEMALE POPULATION
90.36
MALES / 100 FEMALES
110.66
FEMALES / 100 MALES
34.7
MEDIAN AGE
3.2
AVG FAMILY SIZE
2.9
AVG HOUSEHOLD SIZE
787
LABOR FORCE [ PEOPLE ]
52.8%
PERCENT IN LABOR FORCE
4.2%
UNEMPLOYMENT RATE
Jones Creek Area Codes
Income in Jones Creek
Income Overview in Jones Creek
Per Capita Income in Jones Creek is $27,554, while median incomes of families and households are $85,625 and $71,136 respectively.
| Characteristic | Number | Measure |
| Per Capita Income | 1,936 | $27,554 |
| Median Family Income | 542 | $85,625 |
| Mean Family Income | 542 | $84,125 |
| Median Household Income | 678 | $71,136 |
| Mean Household Income | 678 | $77,187 |
| Income Deficit | 542 | $0 |
| Wage / Income Gap (%) | 1,936 | 51.18% |
| Wage / Income Gap ($) | 1,936 | 48.82¢ per $1 |
| Gini / Inequality Index | 1,936 | 0.40 |
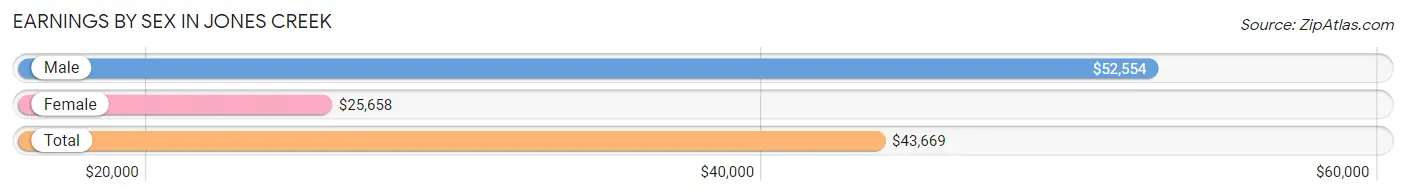
Earnings by Sex in Jones Creek
Average Earnings in Jones Creek are $43,669, $52,554 for men and $25,658 for women, a difference of 51.2%.
| Sex | Number | Average Earnings |
| Male | 449 (53.9%) | $52,554 |
| Female | 384 (46.1%) | $25,658 |
| Total | 833 (100.0%) | $43,669 |
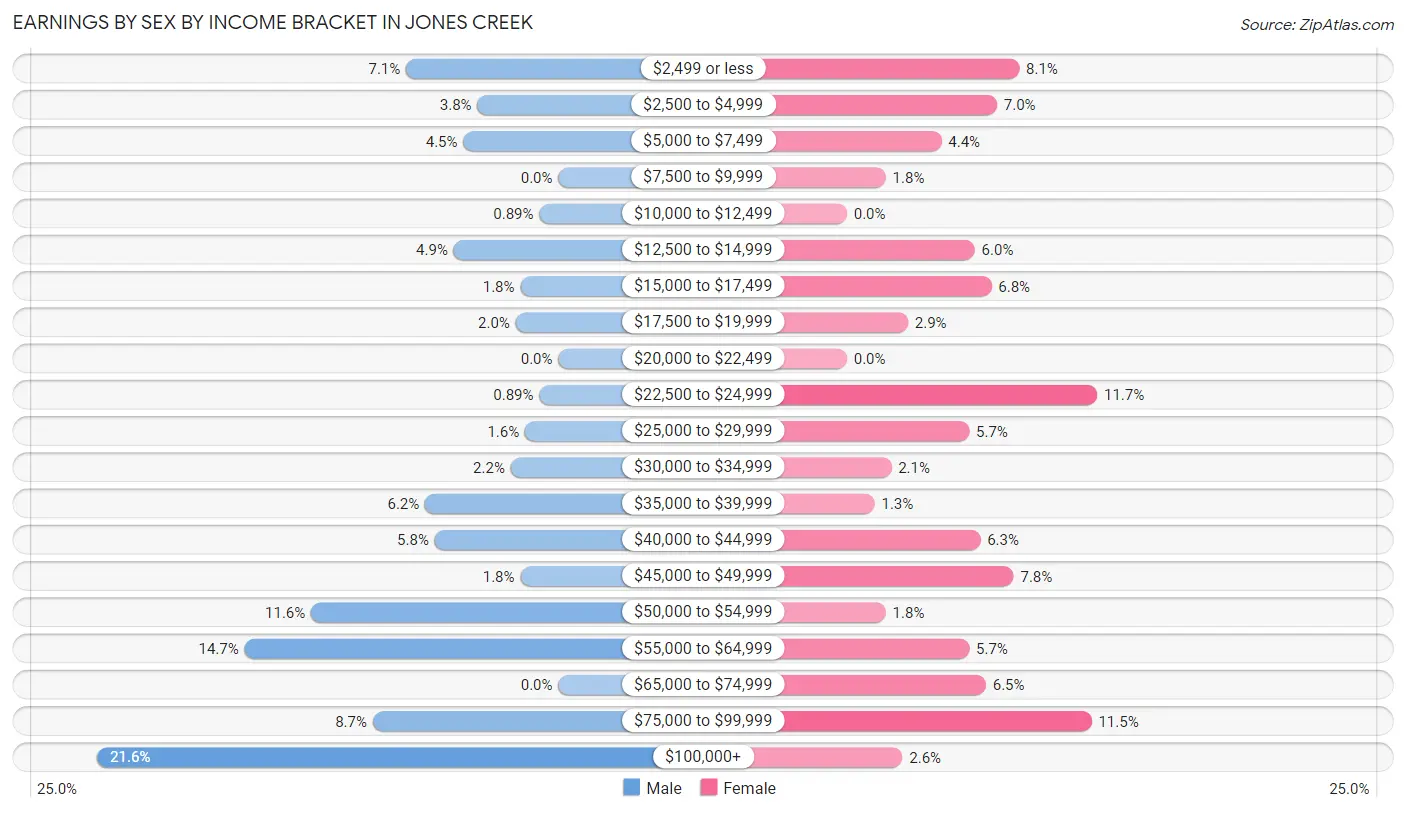
Earnings by Sex by Income Bracket in Jones Creek
The most common earnings brackets in Jones Creek are $100,000+ for men (97 | 21.6%) and $22,500 to $24,999 for women (45 | 11.7%).
| Income | Male | Female |
| $2,499 or less | 32 (7.1%) | 31 (8.1%) |
| $2,500 to $4,999 | 17 (3.8%) | 27 (7.0%) |
| $5,000 to $7,499 | 20 (4.4%) | 17 (4.4%) |
| $7,500 to $9,999 | 0 (0.0%) | 7 (1.8%) |
| $10,000 to $12,499 | 4 (0.9%) | 0 (0.0%) |
| $12,500 to $14,999 | 22 (4.9%) | 23 (6.0%) |
| $15,000 to $17,499 | 8 (1.8%) | 26 (6.8%) |
| $17,500 to $19,999 | 9 (2.0%) | 11 (2.9%) |
| $20,000 to $22,499 | 0 (0.0%) | 0 (0.0%) |
| $22,500 to $24,999 | 4 (0.9%) | 45 (11.7%) |
| $25,000 to $29,999 | 7 (1.6%) | 22 (5.7%) |
| $30,000 to $34,999 | 10 (2.2%) | 8 (2.1%) |
| $35,000 to $39,999 | 28 (6.2%) | 5 (1.3%) |
| $40,000 to $44,999 | 26 (5.8%) | 24 (6.2%) |
| $45,000 to $49,999 | 8 (1.8%) | 30 (7.8%) |
| $50,000 to $54,999 | 52 (11.6%) | 7 (1.8%) |
| $55,000 to $64,999 | 66 (14.7%) | 22 (5.7%) |
| $65,000 to $74,999 | 0 (0.0%) | 25 (6.5%) |
| $75,000 to $99,999 | 39 (8.7%) | 44 (11.5%) |
| $100,000+ | 97 (21.6%) | 10 (2.6%) |
| Total | 449 (100.0%) | 384 (100.0%) |
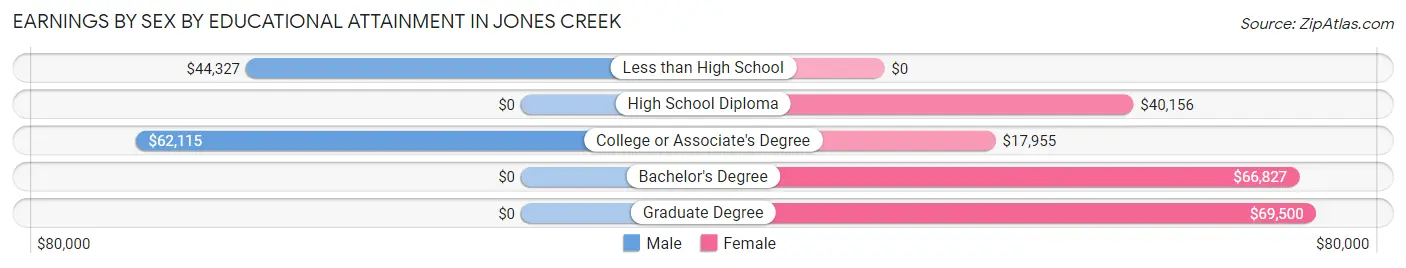
Earnings by Sex by Educational Attainment in Jones Creek
Average earnings in Jones Creek are $59,563 for men and $33,594 for women, a difference of 43.6%. Men with an educational attainment of college or associate's degree enjoy the highest average annual earnings of $62,115, while those with less than high school education earn the least with $44,327. Women with an educational attainment of graduate degree earn the most with the average annual earnings of $69,500, while those with college or associate's degree education have the smallest earnings of $17,955.
| Educational Attainment | Male Income | Female Income |
| Less than High School | $44,327 | $0 |
| High School Diploma | - | - |
| College or Associate's Degree | $62,115 | $17,955 |
| Bachelor's Degree | - | - |
| Graduate Degree | - | - |
| Total | $59,563 | $33,594 |
Family Income in Jones Creek
Family Income Brackets in Jones Creek
According to the Jones Creek family income data, there are 150 families falling into the $100,000 to $149,999 income range, which is the most common income bracket and makes up 27.7% of all families. Conversely, the $200,000+ income bracket is the least frequent group with only 20 families (3.7%) belonging to this category.

| Income Bracket | # Families | % Families |
| Less than $10,000 | 25 | 4.6% |
| $10,000 to $14,999 | 22 | 4.1% |
| $15,000 to $24,999 | 44 | 8.1% |
| $25,000 to $34,999 | 38 | 7.0% |
| $35,000 to $49,999 | 50 | 9.2% |
| $50,000 to $74,999 | 77 | 14.2% |
| $75,000 to $99,999 | 65 | 12.0% |
| $100,000 to $149,999 | 150 | 27.7% |
| $150,000 to $199,999 | 51 | 9.4% |
| $200,000+ | 20 | 3.7% |
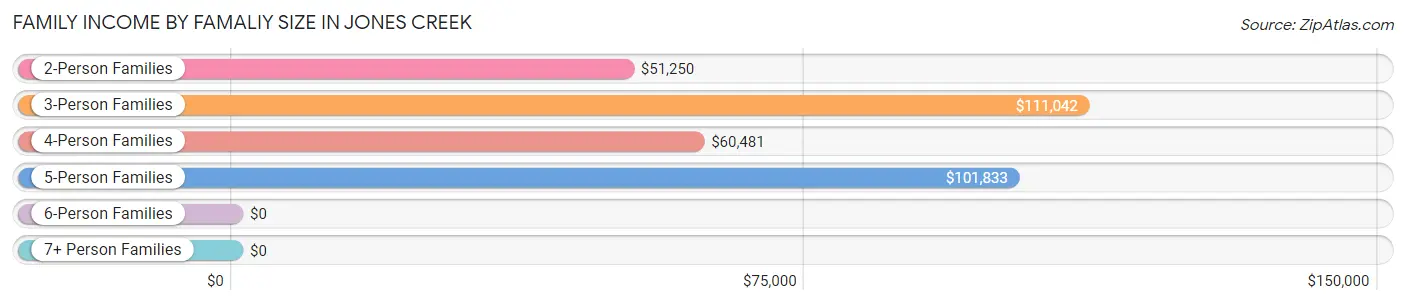
Family Income by Famaliy Size in Jones Creek
3-person families (107 | 19.7%) account for the highest median family income in Jones Creek with $111,042 per family, while 3-person families (107 | 19.7%) have the highest median income of $37,014 per family member.
| Income Bracket | # Families | Median Income |
| 2-Person Families | 235 (43.4%) | $51,250 |
| 3-Person Families | 107 (19.7%) | $111,042 |
| 4-Person Families | 113 (20.8%) | $60,481 |
| 5-Person Families | 72 (13.3%) | $101,833 |
| 6-Person Families | 11 (2.0%) | $0 |
| 7+ Person Families | 4 (0.7%) | $0 |
| Total | 542 (100.0%) | $85,625 |
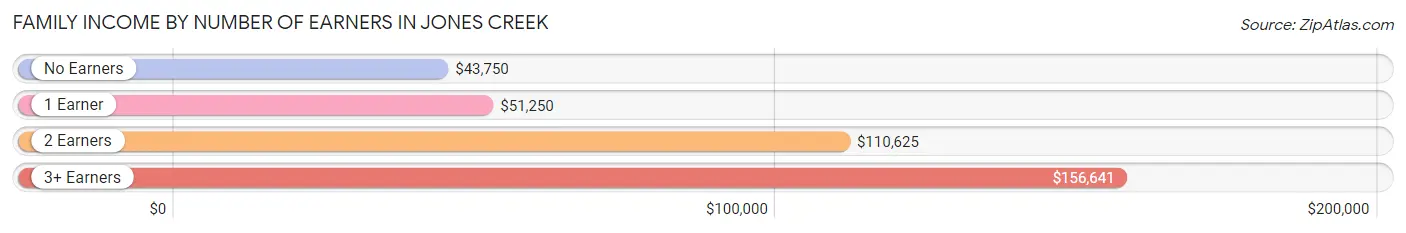
Family Income by Number of Earners in Jones Creek
The median family income in Jones Creek is $85,625, with families comprising 3+ earners (59) having the highest median family income of $156,641, while families with no earners (126) have the lowest median family income of $43,750, accounting for 10.9% and 23.3% of families, respectively.
| Number of Earners | # Families | Median Income |
| No Earners | 126 (23.3%) | $43,750 |
| 1 Earner | 216 (39.9%) | $51,250 |
| 2 Earners | 141 (26.0%) | $110,625 |
| 3+ Earners | 59 (10.9%) | $156,641 |
| Total | 542 (100.0%) | $85,625 |
Household Income in Jones Creek
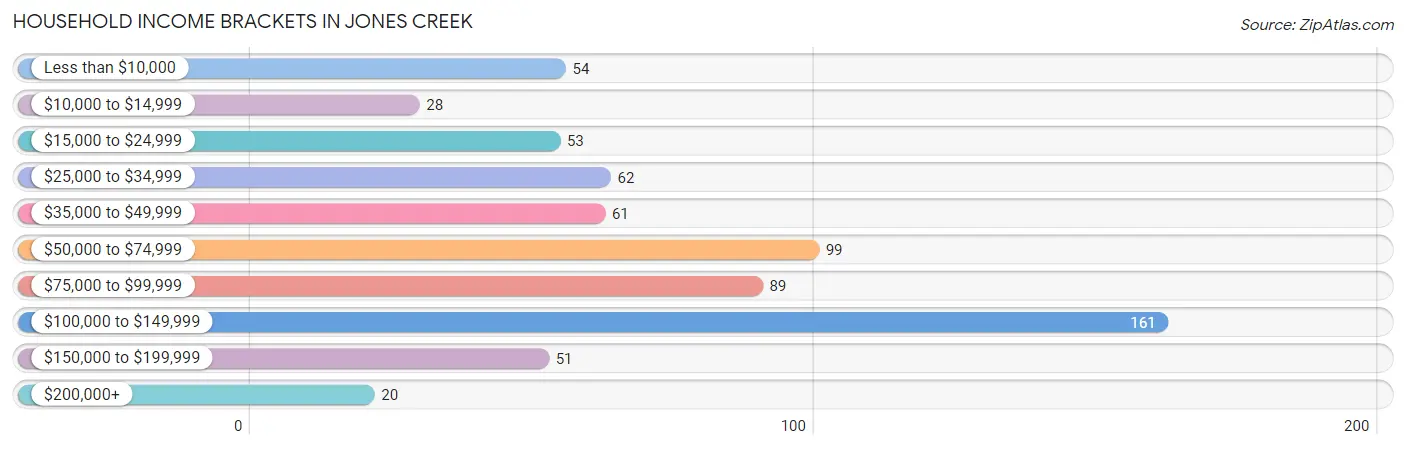
Household Income Brackets in Jones Creek
With 161 households falling in the category, the $100,000 to $149,999 income range is the most frequent in Jones Creek, accounting for 23.7% of all households. In contrast, only 20 households (2.9%) fall into the $200,000+ income bracket, making it the least populous group.
| Income Bracket | # Households | % Households |
| Less than $10,000 | 54 | 8.0% |
| $10,000 to $14,999 | 28 | 4.1% |
| $15,000 to $24,999 | 53 | 7.8% |
| $25,000 to $34,999 | 62 | 9.1% |
| $35,000 to $49,999 | 61 | 9.0% |
| $50,000 to $74,999 | 99 | 14.6% |
| $75,000 to $99,999 | 89 | 13.1% |
| $100,000 to $149,999 | 161 | 23.7% |
| $150,000 to $199,999 | 51 | 7.5% |
| $200,000+ | 20 | 2.9% |
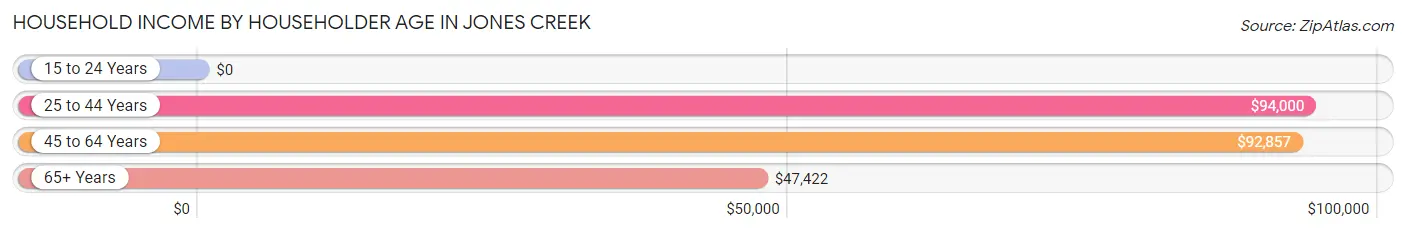
Household Income by Householder Age in Jones Creek
The median household income in Jones Creek is $71,136, with the highest median household income of $94,000 found in the 25 to 44 years age bracket for the primary householder. A total of 278 households (41.0%) fall into this category. Meanwhile, the 15 to 24 years age bracket for the primary householder has the lowest median household income of $0, with 5 households (0.7%) in this group.
| Income Bracket | # Households | Median Income |
| 15 to 24 Years | 5 (0.7%) | $0 |
| 25 to 44 Years | 278 (41.0%) | $94,000 |
| 45 to 64 Years | 190 (28.0%) | $92,857 |
| 65+ Years | 205 (30.2%) | $47,422 |
| Total | 678 (100.0%) | $71,136 |
Poverty in Jones Creek
Income Below Poverty by Sex and Age in Jones Creek
With 20.6% poverty level for males and 20.0% for females among the residents of Jones Creek, 6 to 11 year old males and 6 to 11 year old females are the most vulnerable to poverty, with 25 males (65.8%) and 43 females (43.0%) in their respective age groups living below the poverty level.
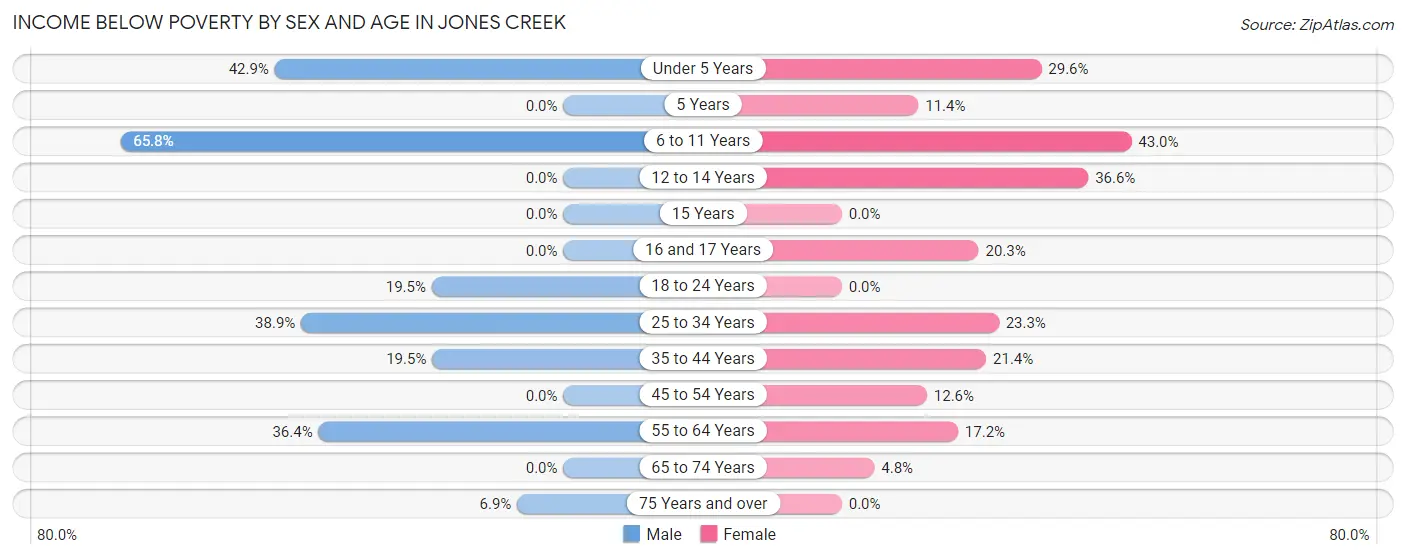
| Age Bracket | Male | Female |
| Under 5 Years | 27 (42.9%) | 8 (29.6%) |
| 5 Years | 0 (0.0%) | 5 (11.4%) |
| 6 to 11 Years | 25 (65.8%) | 43 (43.0%) |
| 12 to 14 Years | 0 (0.0%) | 30 (36.6%) |
| 15 Years | 0 (0.0%) | 0 (0.0%) |
| 16 and 17 Years | 0 (0.0%) | 13 (20.3%) |
| 18 to 24 Years | 17 (19.5%) | 0 (0.0%) |
| 25 to 34 Years | 58 (38.9%) | 48 (23.3%) |
| 35 to 44 Years | 22 (19.5%) | 15 (21.4%) |
| 45 to 54 Years | 0 (0.0%) | 12 (12.6%) |
| 55 to 64 Years | 32 (36.4%) | 25 (17.2%) |
| 65 to 74 Years | 0 (0.0%) | 3 (4.8%) |
| 75 Years and over | 7 (6.9%) | 0 (0.0%) |
| Total | 188 (20.6%) | 202 (20.0%) |
Income Above Poverty by Sex and Age in Jones Creek
According to the poverty statistics in Jones Creek, males aged 12 to 14 years and females aged 18 to 24 years are the age groups that are most secure financially, with 100.0% of males and 100.0% of females in these age groups living above the poverty line.
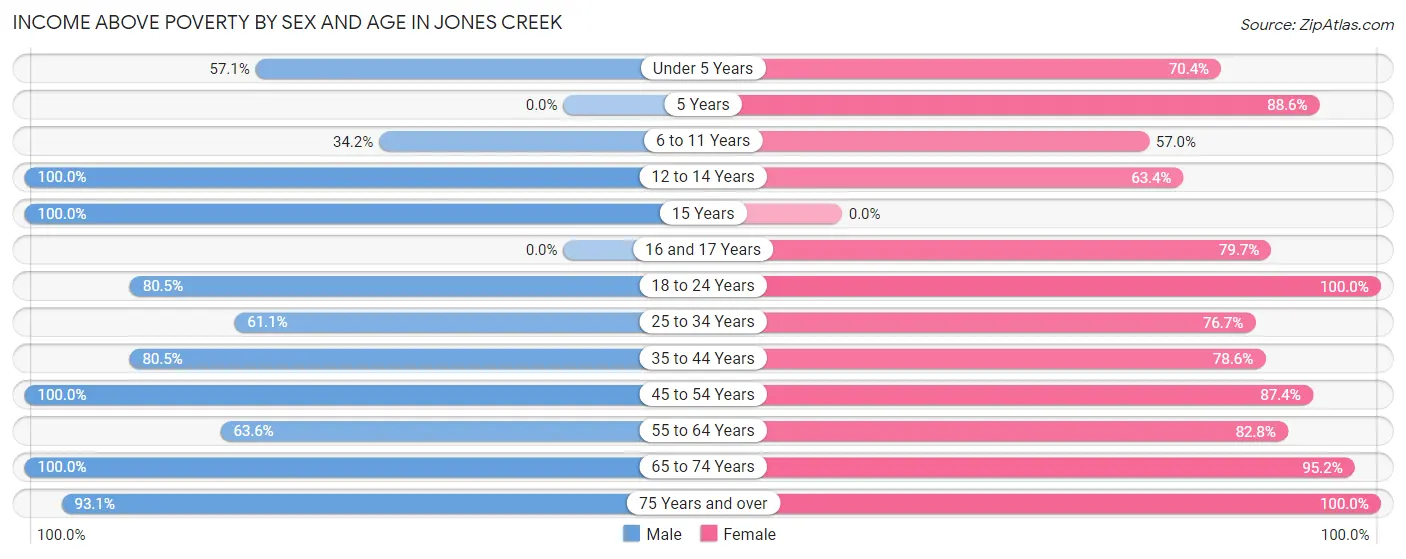
| Age Bracket | Male | Female |
| Under 5 Years | 36 (57.1%) | 19 (70.4%) |
| 5 Years | 0 (0.0%) | 39 (88.6%) |
| 6 to 11 Years | 13 (34.2%) | 57 (57.0%) |
| 12 to 14 Years | 58 (100.0%) | 52 (63.4%) |
| 15 Years | 18 (100.0%) | 0 (0.0%) |
| 16 and 17 Years | 0 (0.0%) | 51 (79.7%) |
| 18 to 24 Years | 70 (80.5%) | 38 (100.0%) |
| 25 to 34 Years | 91 (61.1%) | 158 (76.7%) |
| 35 to 44 Years | 91 (80.5%) | 55 (78.6%) |
| 45 to 54 Years | 99 (100.0%) | 83 (87.4%) |
| 55 to 64 Years | 56 (63.6%) | 120 (82.8%) |
| 65 to 74 Years | 96 (100.0%) | 59 (95.2%) |
| 75 Years and over | 95 (93.1%) | 77 (100.0%) |
| Total | 723 (79.4%) | 808 (80.0%) |
Income Below Poverty Among Married-Couple Families in Jones Creek
The poverty statistics for married-couple families in Jones Creek show that 10.2% or 46 of the total 452 families live below the poverty line. Families with 3 or 4 children have the highest poverty rate of 13.1%, comprising of 8 families. On the other hand, families with no children have the lowest poverty rate of 9.5%, which includes 25 families.
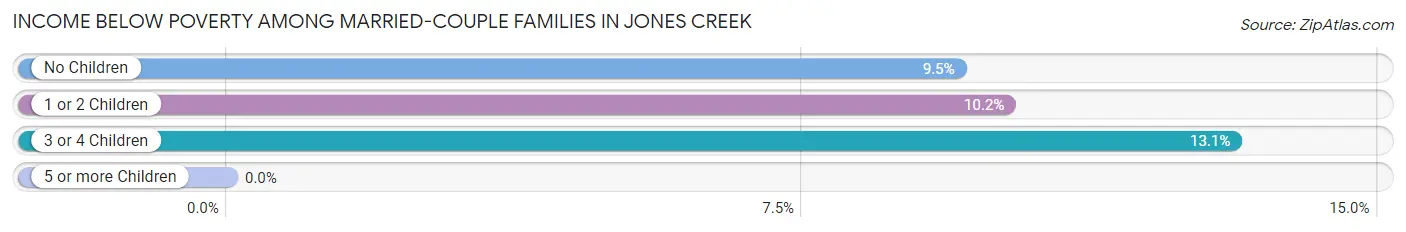
| Children | Above Poverty | Below Poverty |
| No Children | 238 (90.5%) | 25 (9.5%) |
| 1 or 2 Children | 115 (89.8%) | 13 (10.2%) |
| 3 or 4 Children | 53 (86.9%) | 8 (13.1%) |
| 5 or more Children | 0 (0.0%) | 0 (0.0%) |
| Total | 406 (89.8%) | 46 (10.2%) |
Income Below Poverty Among Single-Parent Households in Jones Creek
According to the poverty data in Jones Creek, 16.7% or 3 single-father households and 69.4% or 50 single-mother households are living below the poverty line. Among single-father households, those with no children have the highest poverty rate, with 3 households (33.3%) experiencing poverty. Likewise, among single-mother households, those with 3 or 4 children have the highest poverty rate, with 22 households (100.0%) falling below the poverty line.
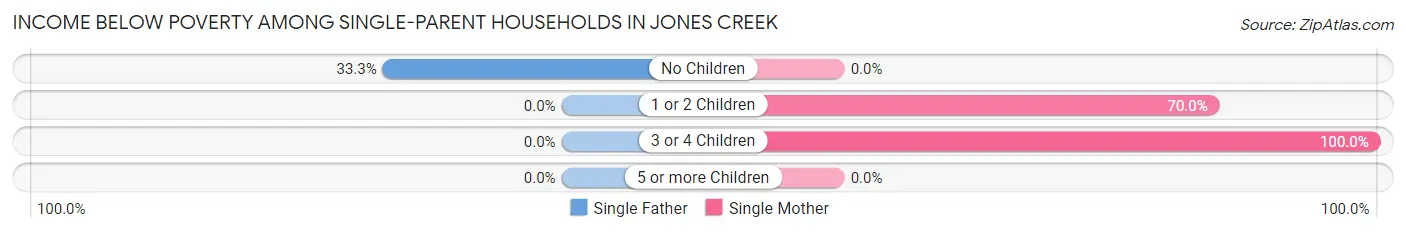
| Children | Single Father | Single Mother |
| No Children | 3 (33.3%) | 0 (0.0%) |
| 1 or 2 Children | 0 (0.0%) | 28 (70.0%) |
| 3 or 4 Children | 0 (0.0%) | 22 (100.0%) |
| 5 or more Children | 0 (0.0%) | 0 (0.0%) |
| Total | 3 (16.7%) | 50 (69.4%) |
Income Below Poverty Among Married-Couple vs Single-Parent Households in Jones Creek
The poverty data for Jones Creek shows that 46 of the married-couple family households (10.2%) and 53 of the single-parent households (58.9%) are living below the poverty level. Within the married-couple family households, those with 3 or 4 children have the highest poverty rate, with 8 households (13.1%) falling below the poverty line. Among the single-parent households, those with 3 or 4 children have the highest poverty rate, with 22 household (100.0%) living below poverty.
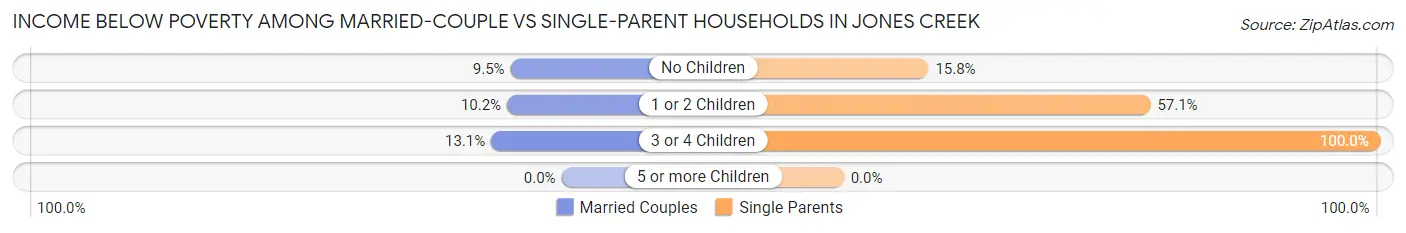
| Children | Married-Couple Families | Single-Parent Households |
| No Children | 25 (9.5%) | 3 (15.8%) |
| 1 or 2 Children | 13 (10.2%) | 28 (57.1%) |
| 3 or 4 Children | 8 (13.1%) | 22 (100.0%) |
| 5 or more Children | 0 (0.0%) | 0 (0.0%) |
| Total | 46 (10.2%) | 53 (58.9%) |
Race in Jones Creek
The most populous races in Jones Creek are White / Caucasian (1,423 | 73.5%), Hispanic or Latino (687 | 35.5%), and Two or more Races (376 | 19.4%).
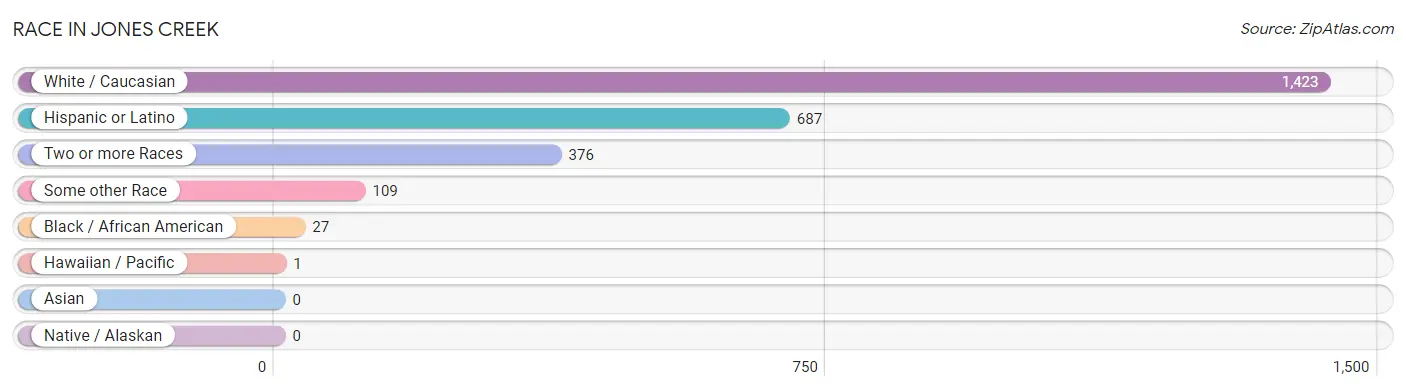
| Race | # Population | % Population |
| Asian | 0 | 0.0% |
| Black / African American | 27 | 1.4% |
| Hawaiian / Pacific | 1 | 0.1% |
| Hispanic or Latino | 687 | 35.5% |
| Native / Alaskan | 0 | 0.0% |
| White / Caucasian | 1,423 | 73.5% |
| Two or more Races | 376 | 19.4% |
| Some other Race | 109 | 5.6% |
| Total | 1,936 | 100.0% |
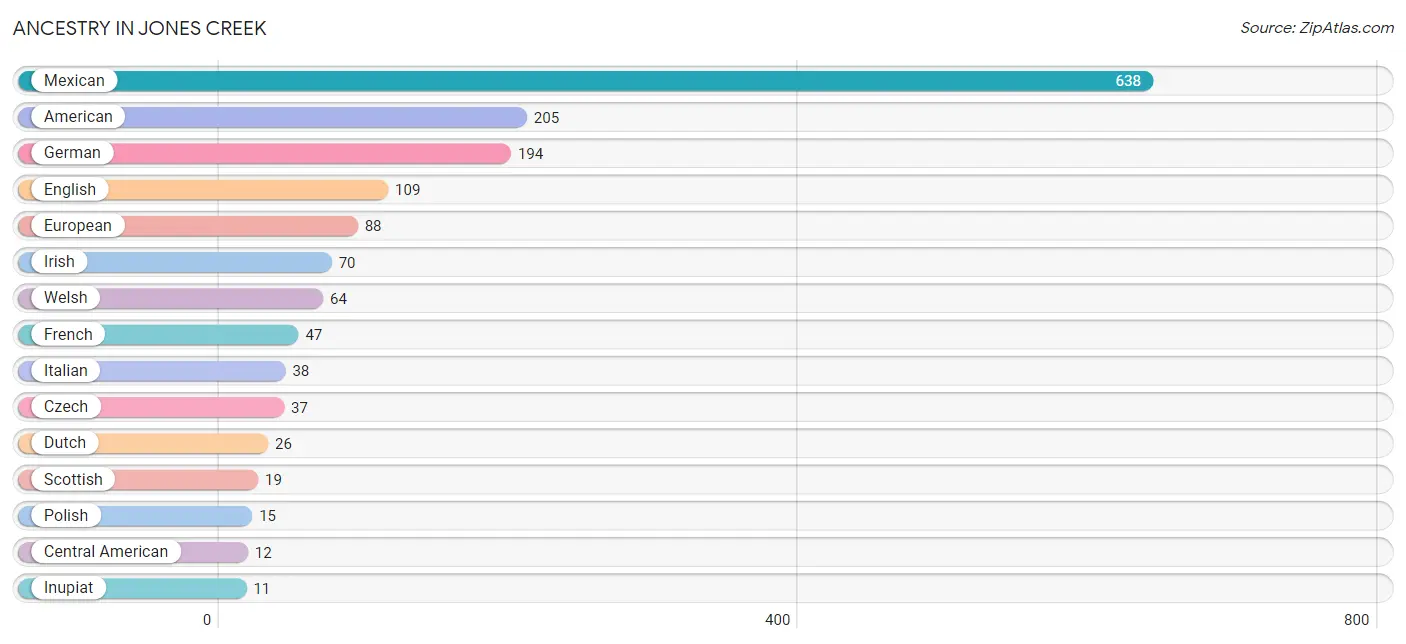
Ancestry in Jones Creek
The most populous ancestries reported in Jones Creek are Mexican (638 | 33.0%), American (205 | 10.6%), German (194 | 10.0%), English (109 | 5.6%), and European (88 | 4.5%), together accounting for 63.7% of all Jones Creek residents.
| Ancestry | # Population | % Population |
| American | 205 | 10.6% |
| British | 3 | 0.2% |
| Central American | 12 | 0.6% |
| Cherokee | 1 | 0.1% |
| Croatian | 8 | 0.4% |
| Czech | 37 | 1.9% |
| Czechoslovakian | 3 | 0.2% |
| Danish | 3 | 0.2% |
| Dominican | 7 | 0.4% |
| Dutch | 26 | 1.3% |
| English | 109 | 5.6% |
| European | 88 | 4.5% |
| Finnish | 9 | 0.5% |
| French | 47 | 2.4% |
| German | 194 | 10.0% |
| Greek | 3 | 0.2% |
| Guatemalan | 4 | 0.2% |
| Honduran | 1 | 0.1% |
| Inupiat | 11 | 0.6% |
| Irish | 70 | 3.6% |
| Italian | 38 | 2.0% |
| Mexican | 638 | 33.0% |
| Norwegian | 3 | 0.2% |
| Polish | 15 | 0.8% |
| Salvadoran | 7 | 0.4% |
| Scottish | 19 | 1.0% |
| Spaniard | 7 | 0.4% |
| Welsh | 64 | 3.3% | View All 28 Rows |
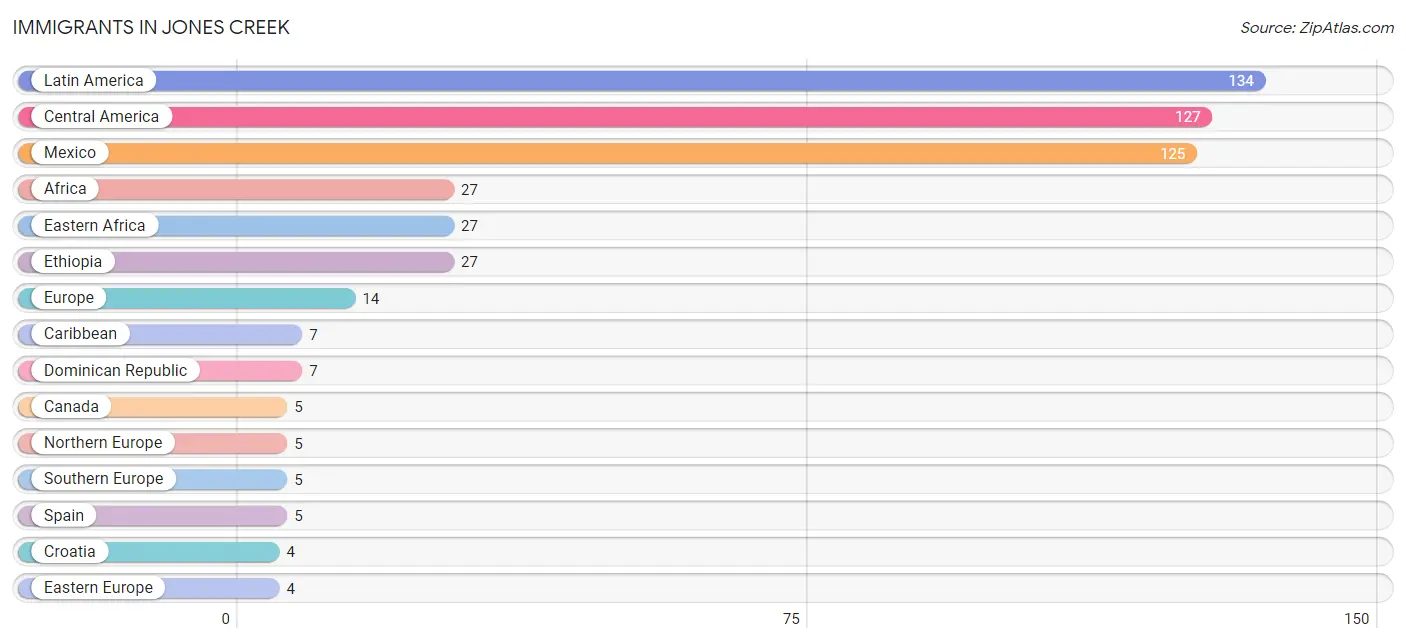
Immigrants in Jones Creek
The most numerous immigrant groups reported in Jones Creek came from Latin America (134 | 6.9%), Central America (127 | 6.6%), Mexico (125 | 6.5%), Africa (27 | 1.4%), and Eastern Africa (27 | 1.4%), together accounting for 22.7% of all Jones Creek residents.
| Immigration Origin | # Population | % Population |
| Africa | 27 | 1.4% |
| Canada | 5 | 0.3% |
| Caribbean | 7 | 0.4% |
| Central America | 127 | 6.6% |
| Croatia | 4 | 0.2% |
| Dominican Republic | 7 | 0.4% |
| Eastern Africa | 27 | 1.4% |
| Eastern Europe | 4 | 0.2% |
| Ethiopia | 27 | 1.4% |
| Europe | 14 | 0.7% |
| Guatemala | 1 | 0.1% |
| Honduras | 1 | 0.1% |
| Latin America | 134 | 6.9% |
| Mexico | 125 | 6.5% |
| Northern Europe | 5 | 0.3% |
| Southern Europe | 5 | 0.3% |
| Spain | 5 | 0.3% | View All 17 Rows |
Sex and Age in Jones Creek
Sex and Age in Jones Creek
The most populous age groups in Jones Creek are 25 to 29 Years (90 | 9.8%) for men and 5 to 9 Years (126 | 12.4%) for women.
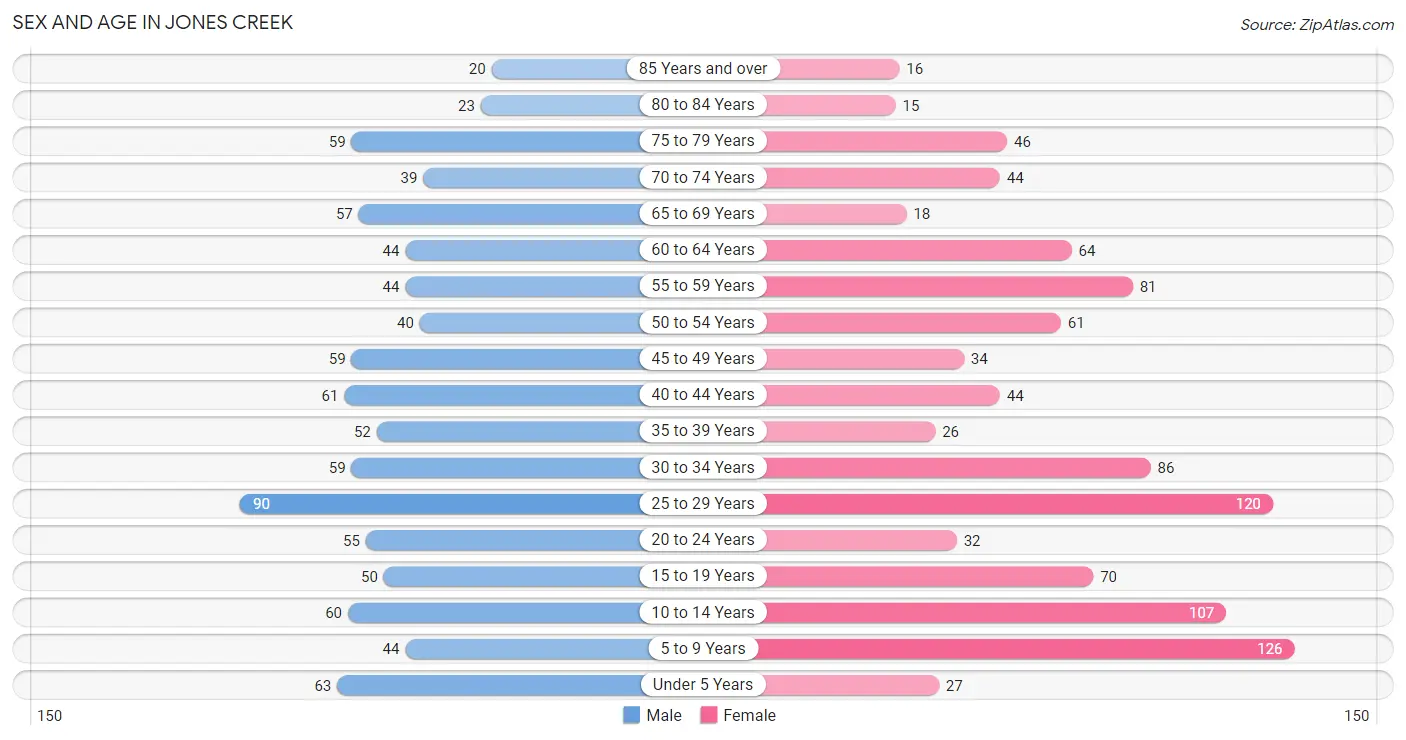
| Age Bracket | Male | Female |
| Under 5 Years | 63 (6.9%) | 27 (2.6%) |
| 5 to 9 Years | 44 (4.8%) | 126 (12.4%) |
| 10 to 14 Years | 60 (6.5%) | 107 (10.5%) |
| 15 to 19 Years | 50 (5.4%) | 70 (6.9%) |
| 20 to 24 Years | 55 (6.0%) | 32 (3.2%) |
| 25 to 29 Years | 90 (9.8%) | 120 (11.8%) |
| 30 to 34 Years | 59 (6.4%) | 86 (8.5%) |
| 35 to 39 Years | 52 (5.7%) | 26 (2.6%) |
| 40 to 44 Years | 61 (6.6%) | 44 (4.3%) |
| 45 to 49 Years | 59 (6.4%) | 34 (3.3%) |
| 50 to 54 Years | 40 (4.3%) | 61 (6.0%) |
| 55 to 59 Years | 44 (4.8%) | 81 (8.0%) |
| 60 to 64 Years | 44 (4.8%) | 64 (6.3%) |
| 65 to 69 Years | 57 (6.2%) | 18 (1.8%) |
| 70 to 74 Years | 39 (4.2%) | 44 (4.3%) |
| 75 to 79 Years | 59 (6.4%) | 46 (4.5%) |
| 80 to 84 Years | 23 (2.5%) | 15 (1.5%) |
| 85 Years and over | 20 (2.2%) | 16 (1.6%) |
| Total | 919 (100.0%) | 1,017 (100.0%) |
Families and Households in Jones Creek
Median Family Size in Jones Creek
The median family size in Jones Creek is 3.21 persons per family, with single male/father families (18 | 3.3%) accounting for the largest median family size of 3.78 persons per family. On the other hand, married-couple families (452 | 83.4%) represent the smallest median family size with 3.14 persons per family.
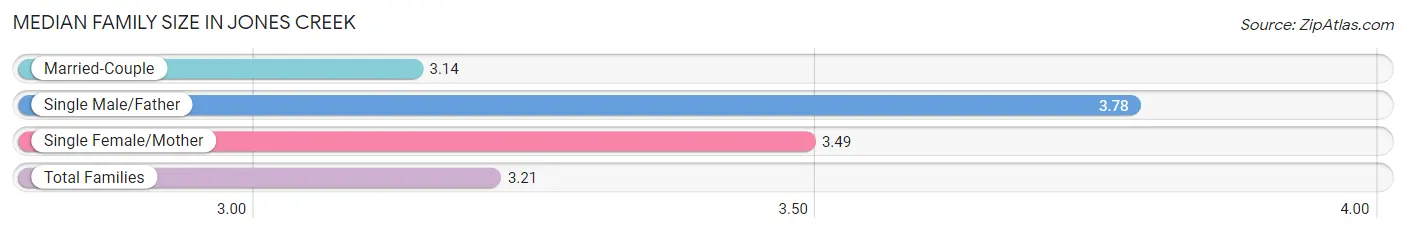
| Family Type | # Families | Family Size |
| Married-Couple | 452 (83.4%) | 3.14 |
| Single Male/Father | 18 (3.3%) | 3.78 |
| Single Female/Mother | 72 (13.3%) | 3.49 |
| Total Families | 542 (100.0%) | 3.21 |
Median Household Size in Jones Creek
The median household size in Jones Creek is 2.86 persons per household, with single male/father households (18 | 2.6%) accounting for the largest median household size of 4 persons per household. non-family households (136 | 20.1%) represent the smallest median household size with 1.29 persons per household.
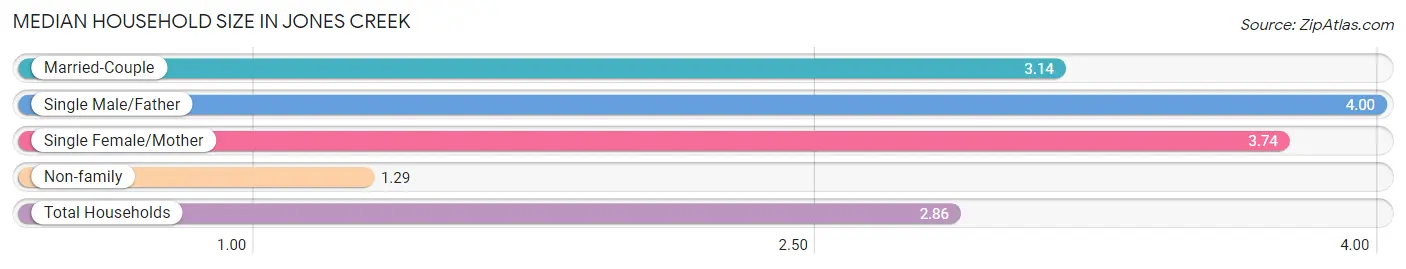
| Household Type | # Households | Household Size |
| Married-Couple | 452 (66.7%) | 3.14 |
| Single Male/Father | 18 (2.6%) | 4.00 |
| Single Female/Mother | 72 (10.6%) | 3.74 |
| Non-family | 136 (20.1%) | 1.29 |
| Total Households | 678 (100.0%) | 2.86 |
Household Size by Marriage Status in Jones Creek
Out of a total of 678 households in Jones Creek, 542 (79.9%) are family households, while 136 (20.1%) are nonfamily households. The most numerous type of family households are 2-person households, comprising 219, and the most common type of nonfamily households are 1-person households, comprising 111.
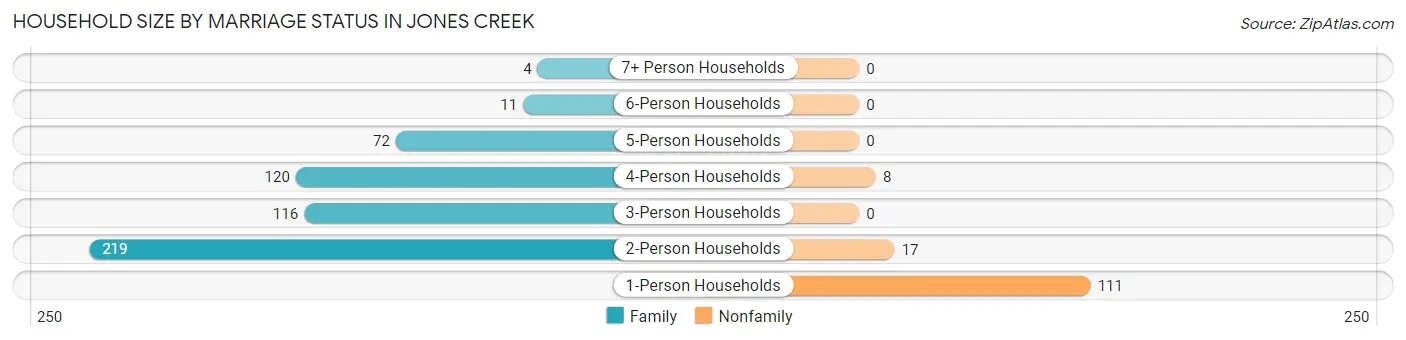
| Household Size | Family Households | Nonfamily Households |
| 1-Person Households | - | 111 (16.4%) |
| 2-Person Households | 219 (32.3%) | 17 (2.5%) |
| 3-Person Households | 116 (17.1%) | 0 (0.0%) |
| 4-Person Households | 120 (17.7%) | 8 (1.2%) |
| 5-Person Households | 72 (10.6%) | 0 (0.0%) |
| 6-Person Households | 11 (1.6%) | 0 (0.0%) |
| 7+ Person Households | 4 (0.6%) | 0 (0.0%) |
| Total | 542 (79.9%) | 136 (20.1%) |
Female Fertility in Jones Creek
Fertility by Age in Jones Creek
Average fertility rate in Jones Creek is 143.0 births per 1,000 women. Women in the age bracket of 20 to 34 years have the highest fertility rate with 248.0 births per 1,000 women. Women in the age bracket of 20 to 34 years acount for 100.0% of all women with births.
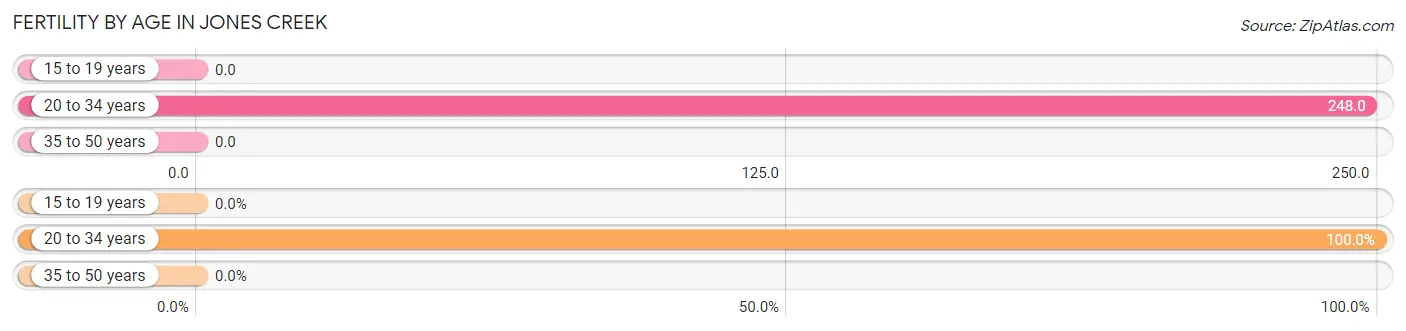
| Age Bracket | Women with Births | Births / 1,000 Women |
| 15 to 19 years | 0 (0.0%) | 0.0 |
| 20 to 34 years | 59 (100.0%) | 248.0 |
| 35 to 50 years | 0 (0.0%) | 0.0 |
| Total | 59 (100.0%) | 143.0 |
Fertility by Age by Marriage Status in Jones Creek
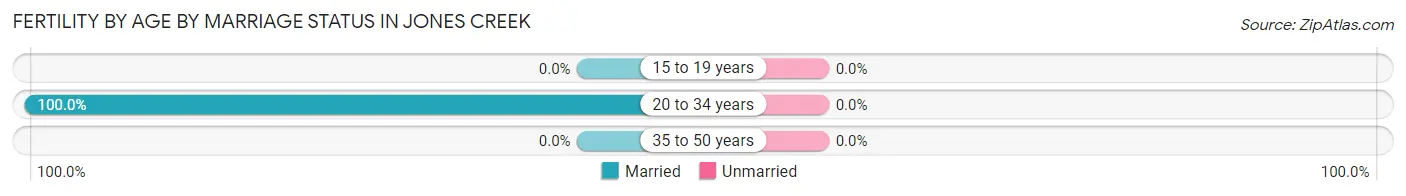
| Age Bracket | Married | Unmarried |
| 15 to 19 years | 0 (0.0%) | 0 (0.0%) |
| 20 to 34 years | 59 (100.0%) | 0 (0.0%) |
| 35 to 50 years | 0 (0.0%) | 0 (0.0%) |
| Total | 59 (100.0%) | 0 (0.0%) |
Fertility by Education in Jones Creek
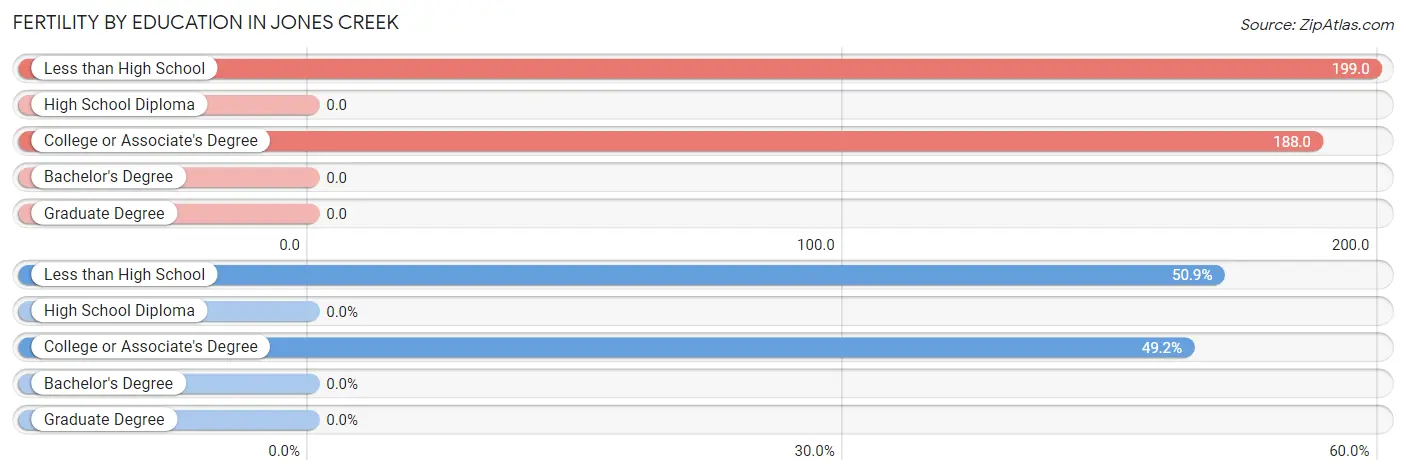
| Educational Attainment | Women with Births | Births / 1,000 Women |
| Less than High School | 30 (50.8%) | 199.0 |
| High School Diploma | 0 (0.0%) | 0.0 |
| College or Associate's Degree | 29 (49.1%) | 188.0 |
| Bachelor's Degree | 0 (0.0%) | 0.0 |
| Graduate Degree | 0 (0.0%) | 0.0 |
| Total | 59 (100.0%) | 143.0 |
Fertility by Education by Marriage Status in Jones Creek
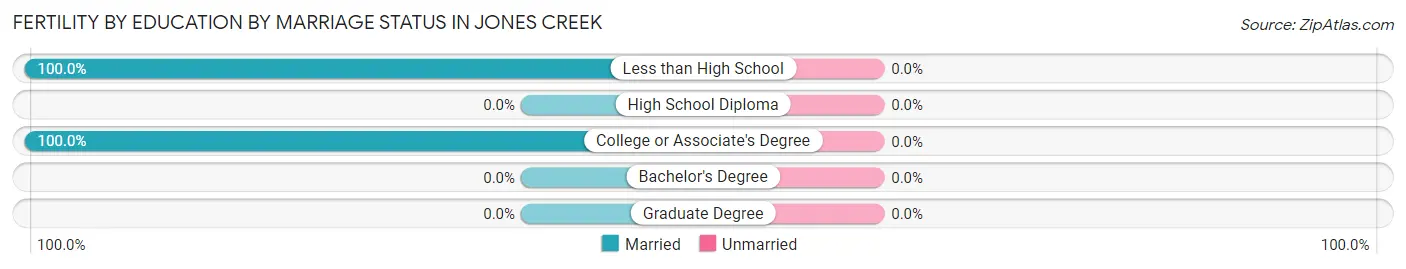
| Educational Attainment | Married | Unmarried |
| Less than High School | 30 (100.0%) | 0 (0.0%) |
| High School Diploma | 0 (0.0%) | 0 (0.0%) |
| College or Associate's Degree | 29 (100.0%) | 0 (0.0%) |
| Bachelor's Degree | 0 (0.0%) | 0 (0.0%) |
| Graduate Degree | 0 (0.0%) | 0 (0.0%) |
| Total | 59 (100.0%) | 0 (0.0%) |
Employment Characteristics in Jones Creek
Employment by Class of Employer in Jones Creek
Among the 740 employed individuals in Jones Creek, private company employees (497 | 67.2%), local government employees (96 | 13.0%), and self-employed (not incorporated) (63 | 8.5%) make up the most common classes of employment.
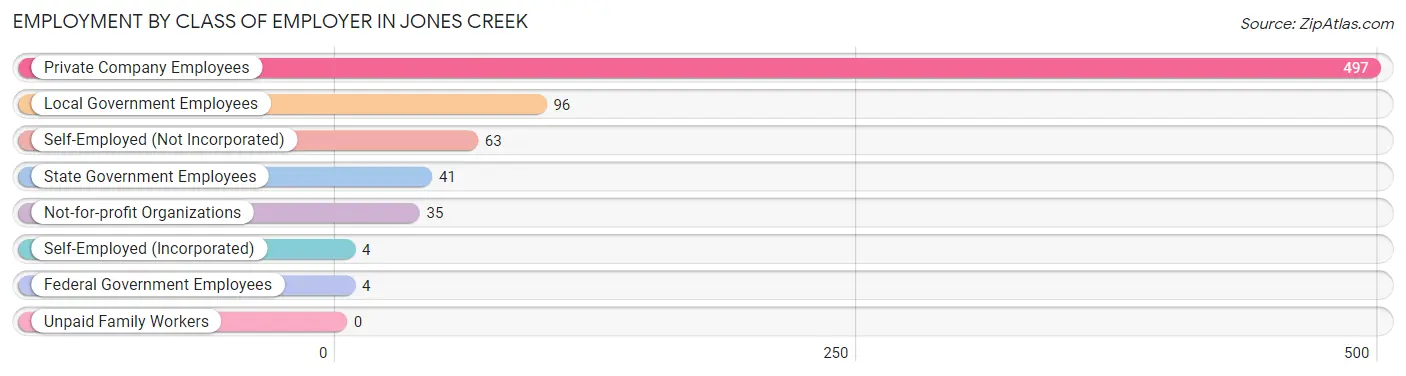
| Employer Class | # Employees | % Employees |
| Private Company Employees | 497 | 67.2% |
| Self-Employed (Incorporated) | 4 | 0.5% |
| Self-Employed (Not Incorporated) | 63 | 8.5% |
| Not-for-profit Organizations | 35 | 4.7% |
| Local Government Employees | 96 | 13.0% |
| State Government Employees | 41 | 5.5% |
| Federal Government Employees | 4 | 0.5% |
| Unpaid Family Workers | 0 | 0.0% |
| Total | 740 | 100.0% |
Employment Status by Age in Jones Creek
According to the labor force statistics for Jones Creek, out of the total population over 16 years of age (1,491), 52.8% or 787 individuals are in the labor force, with 4.2% or 33 of them unemployed. The age group with the highest labor force participation rate is 25 to 29 years, with 87.1% or 183 individuals in the labor force. Within the labor force, the 45 to 54 years age range has the highest percentage of unemployed individuals, with 10.2% or 17 of them being unemployed.
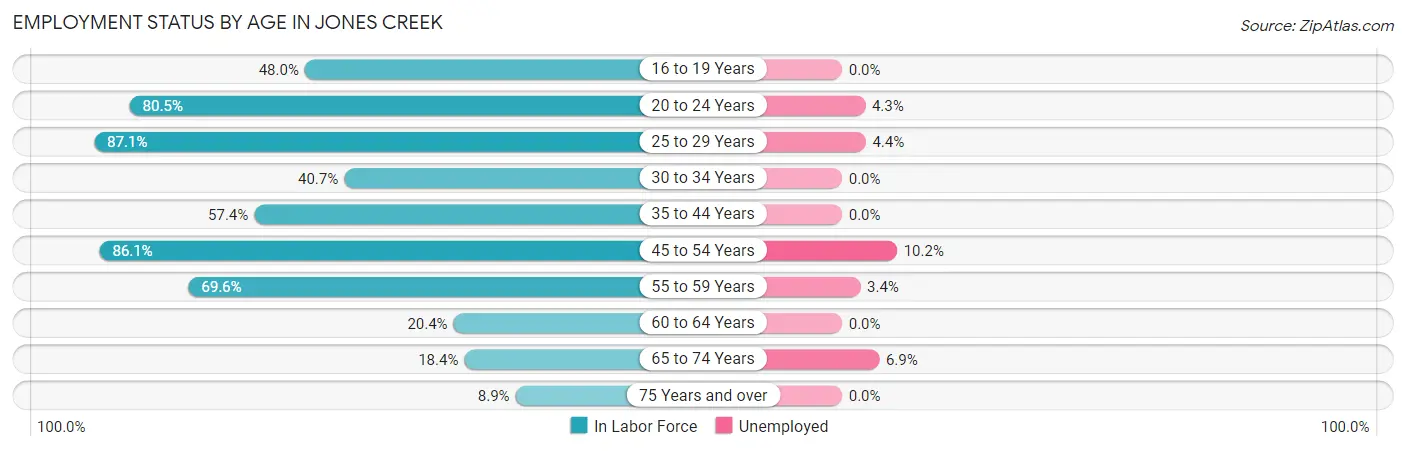
| Age Bracket | In Labor Force | Unemployed |
| 16 to 19 Years | 49 (48.0%) | 0 (0.0%) |
| 20 to 24 Years | 70 (80.5%) | 3 (4.3%) |
| 25 to 29 Years | 183 (87.1%) | 8 (4.4%) |
| 30 to 34 Years | 59 (40.7%) | 0 (0.0%) |
| 35 to 44 Years | 105 (57.4%) | 0 (0.0%) |
| 45 to 54 Years | 167 (86.1%) | 17 (10.2%) |
| 55 to 59 Years | 87 (69.6%) | 3 (3.4%) |
| 60 to 64 Years | 22 (20.4%) | 0 (0.0%) |
| 65 to 74 Years | 29 (18.4%) | 2 (6.9%) |
| 75 Years and over | 16 (8.9%) | 0 (0.0%) |
| Total | 787 (52.8%) | 33 (4.2%) |
Employment Status by Educational Attainment in Jones Creek
According to labor force statistics for Jones Creek, 64.6% of individuals (623) out of the total population between 25 and 64 years of age (965) are in the labor force, with 4.5% or 28 of them being unemployed. The group with the highest labor force participation rate are those with the educational attainment of less than high school, with 65.7% or 155 individuals in the labor force. Within the labor force, individuals with less than high school education have the highest percentage of unemployment, with 9.7% or 15 of them being unemployed.
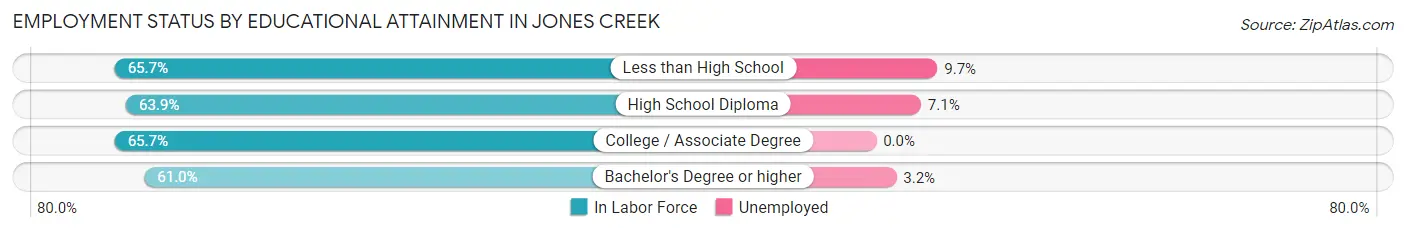
| Educational Attainment | In Labor Force | Unemployed |
| Less than High School | 155 (65.7%) | 23 (9.7%) |
| High School Diploma | 140 (63.9%) | 16 (7.1%) |
| College / Associate Degree | 234 (65.7%) | 0 (0.0%) |
| Bachelor's Degree or higher | 94 (61.0%) | 5 (3.2%) |
| Total | 623 (64.6%) | 43 (4.5%) |
Employment Occupations by Sex in Jones Creek
Management, Business, Science and Arts Occupations
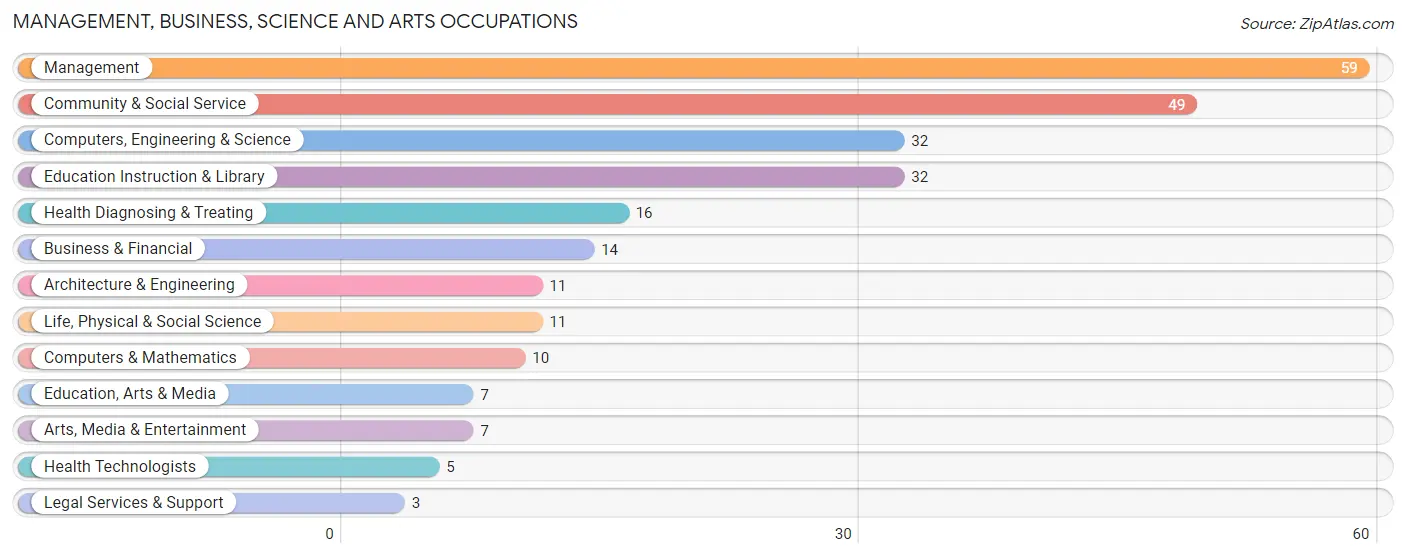
The most common Management, Business, Science and Arts occupations in Jones Creek are Management (59 | 7.8%), Community & Social Service (49 | 6.5%), Computers, Engineering & Science (32 | 4.2%), Education Instruction & Library (32 | 4.2%), and Health Diagnosing & Treating (16 | 2.1%).
Management, Business, Science and Arts Occupations by Sex
Within the Management, Business, Science and Arts occupations in Jones Creek, the most male-oriented occupations are Computers, Engineering & Science (100.0%), Computers & Mathematics (100.0%), and Architecture & Engineering (100.0%), while the most female-oriented occupations are Business & Financial (100.0%), Education, Arts & Media (100.0%), and Legal Services & Support (100.0%).
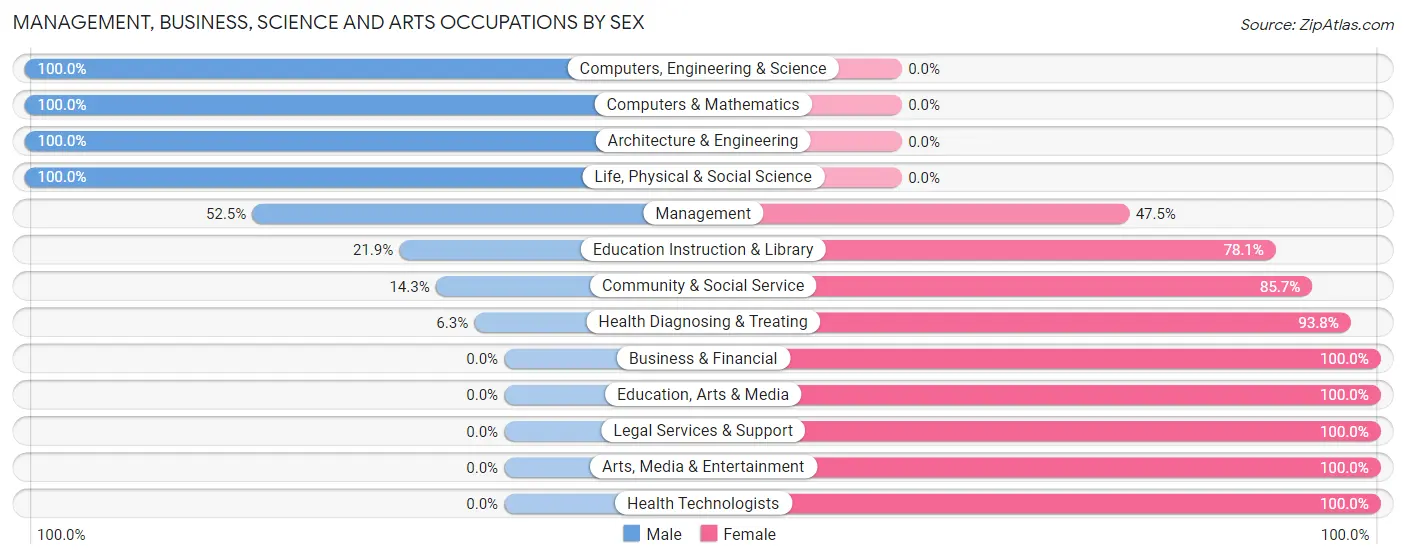
| Occupation | Male | Female |
| Management | 31 (52.5%) | 28 (47.5%) |
| Business & Financial | 0 (0.0%) | 14 (100.0%) |
| Computers, Engineering & Science | 32 (100.0%) | 0 (0.0%) |
| Computers & Mathematics | 10 (100.0%) | 0 (0.0%) |
| Architecture & Engineering | 11 (100.0%) | 0 (0.0%) |
| Life, Physical & Social Science | 11 (100.0%) | 0 (0.0%) |
| Community & Social Service | 7 (14.3%) | 42 (85.7%) |
| Education, Arts & Media | 0 (0.0%) | 7 (100.0%) |
| Legal Services & Support | 0 (0.0%) | 3 (100.0%) |
| Education Instruction & Library | 7 (21.9%) | 25 (78.1%) |
| Arts, Media & Entertainment | 0 (0.0%) | 7 (100.0%) |
| Health Diagnosing & Treating | 1 (6.2%) | 15 (93.8%) |
| Health Technologists | 0 (0.0%) | 5 (100.0%) |
| Total (Category) | 71 (41.8%) | 99 (58.2%) |
| Total (Overall) | 417 (55.3%) | 337 (44.7%) |
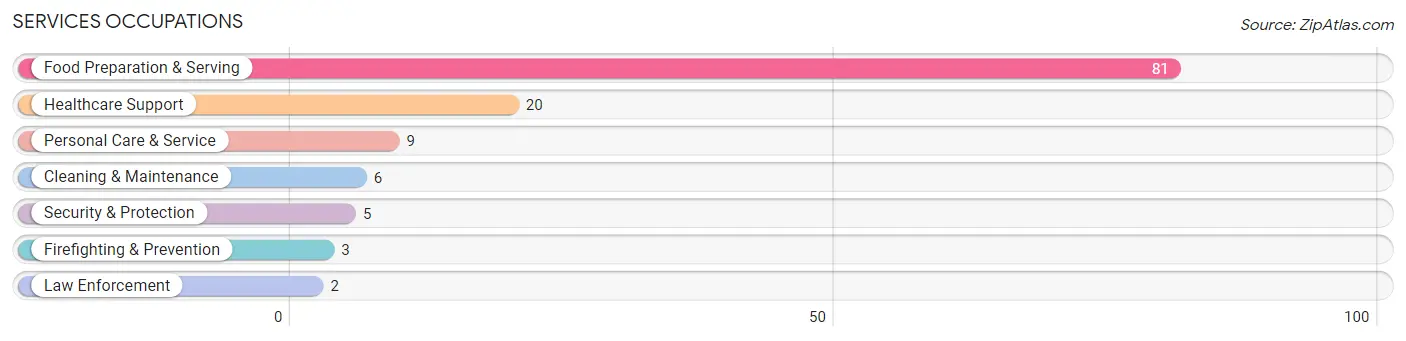
Services Occupations
The most common Services occupations in Jones Creek are Food Preparation & Serving (81 | 10.7%), Healthcare Support (20 | 2.6%), Personal Care & Service (9 | 1.2%), Cleaning & Maintenance (6 | 0.8%), and Security & Protection (5 | 0.7%).
Services Occupations by Sex
Within the Services occupations in Jones Creek, the most male-oriented occupations are Firefighting & Prevention (100.0%), Security & Protection (60.0%), and Cleaning & Maintenance (50.0%), while the most female-oriented occupations are Healthcare Support (100.0%), Law Enforcement (100.0%), and Food Preparation & Serving (75.3%).
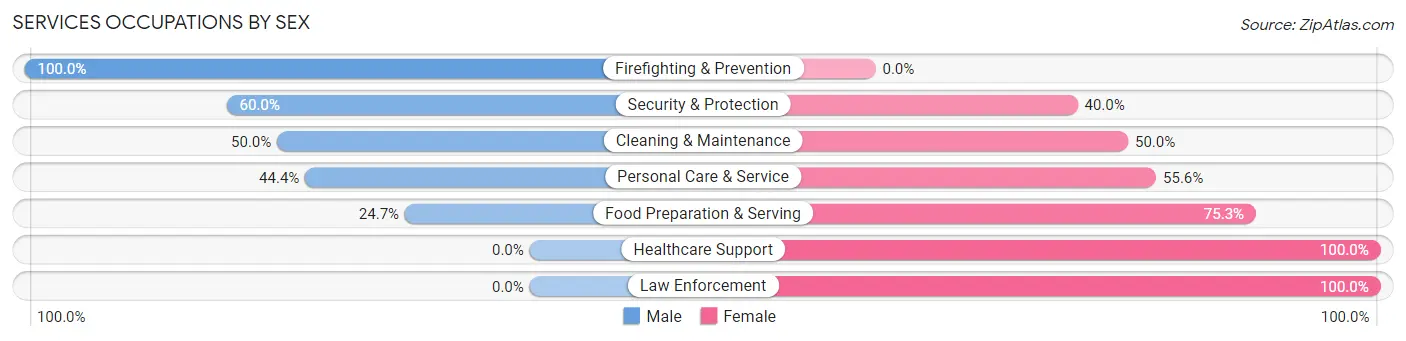
| Occupation | Male | Female |
| Healthcare Support | 0 (0.0%) | 20 (100.0%) |
| Security & Protection | 3 (60.0%) | 2 (40.0%) |
| Firefighting & Prevention | 3 (100.0%) | 0 (0.0%) |
| Law Enforcement | 0 (0.0%) | 2 (100.0%) |
| Food Preparation & Serving | 20 (24.7%) | 61 (75.3%) |
| Cleaning & Maintenance | 3 (50.0%) | 3 (50.0%) |
| Personal Care & Service | 4 (44.4%) | 5 (55.6%) |
| Total (Category) | 30 (24.8%) | 91 (75.2%) |
| Total (Overall) | 417 (55.3%) | 337 (44.7%) |
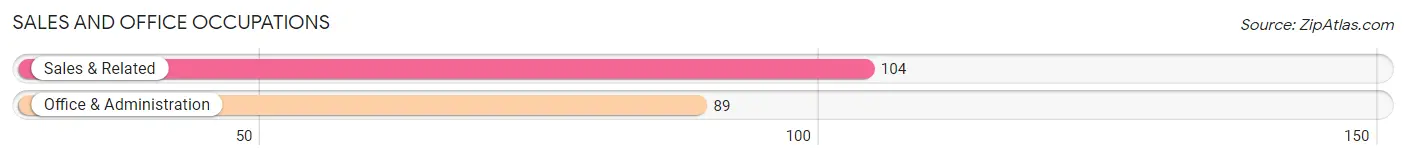
Sales and Office Occupations
The most common Sales and Office occupations in Jones Creek are Sales & Related (104 | 13.8%), and Office & Administration (89 | 11.8%).
Sales and Office Occupations by Sex
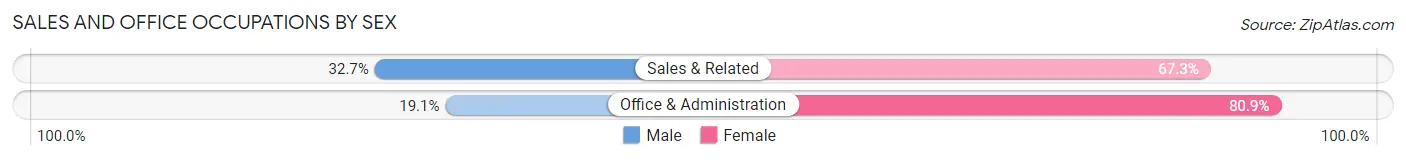
| Occupation | Male | Female |
| Sales & Related | 34 (32.7%) | 70 (67.3%) |
| Office & Administration | 17 (19.1%) | 72 (80.9%) |
| Total (Category) | 51 (26.4%) | 142 (73.6%) |
| Total (Overall) | 417 (55.3%) | 337 (44.7%) |
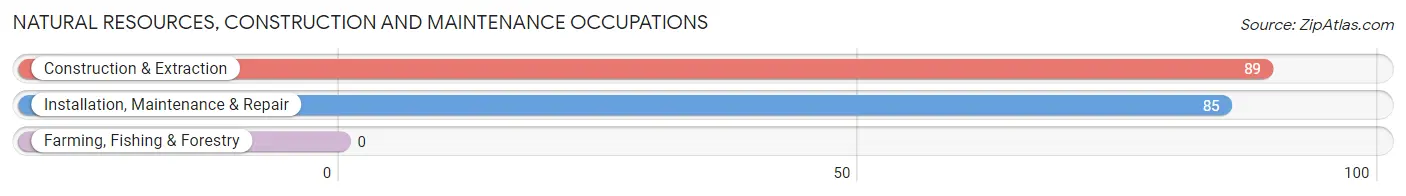
Natural Resources, Construction and Maintenance Occupations
The most common Natural Resources, Construction and Maintenance occupations in Jones Creek are Construction & Extraction (89 | 11.8%), and Installation, Maintenance & Repair (85 | 11.3%).
Natural Resources, Construction and Maintenance Occupations by Sex
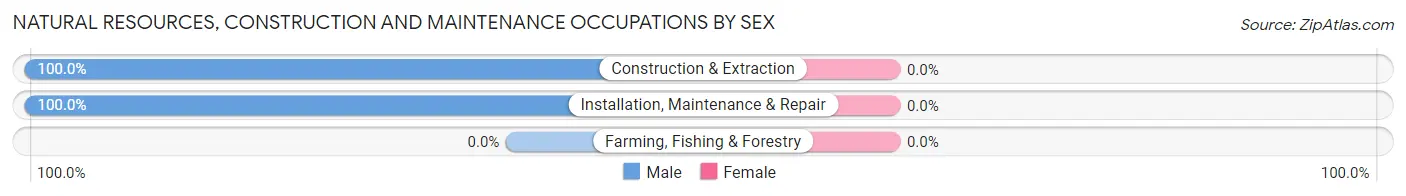
| Occupation | Male | Female |
| Farming, Fishing & Forestry | 0 (0.0%) | 0 (0.0%) |
| Construction & Extraction | 89 (100.0%) | 0 (0.0%) |
| Installation, Maintenance & Repair | 85 (100.0%) | 0 (0.0%) |
| Total (Category) | 174 (100.0%) | 0 (0.0%) |
| Total (Overall) | 417 (55.3%) | 337 (44.7%) |
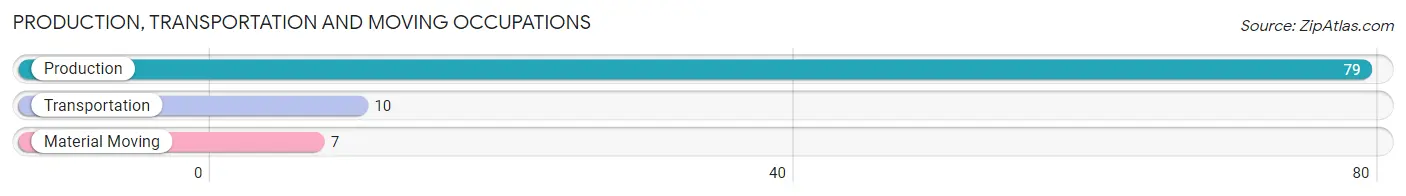
Production, Transportation and Moving Occupations
The most common Production, Transportation and Moving occupations in Jones Creek are Production (79 | 10.5%), Transportation (10 | 1.3%), and Material Moving (7 | 0.9%).
Production, Transportation and Moving Occupations by Sex
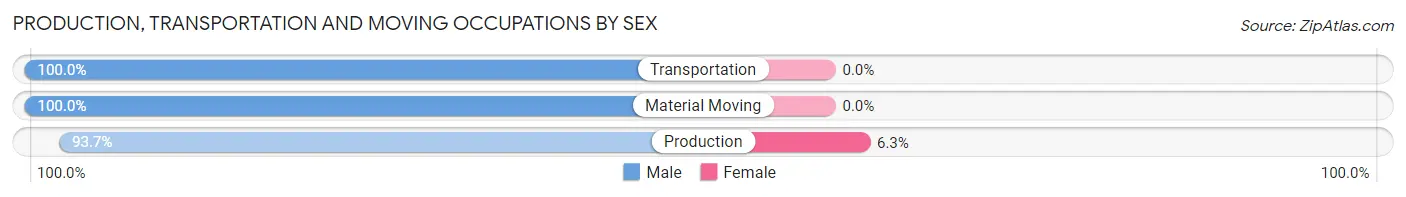
| Occupation | Male | Female |
| Production | 74 (93.7%) | 5 (6.3%) |
| Transportation | 10 (100.0%) | 0 (0.0%) |
| Material Moving | 7 (100.0%) | 0 (0.0%) |
| Total (Category) | 91 (94.8%) | 5 (5.2%) |
| Total (Overall) | 417 (55.3%) | 337 (44.7%) |
Employment Industries by Sex in Jones Creek
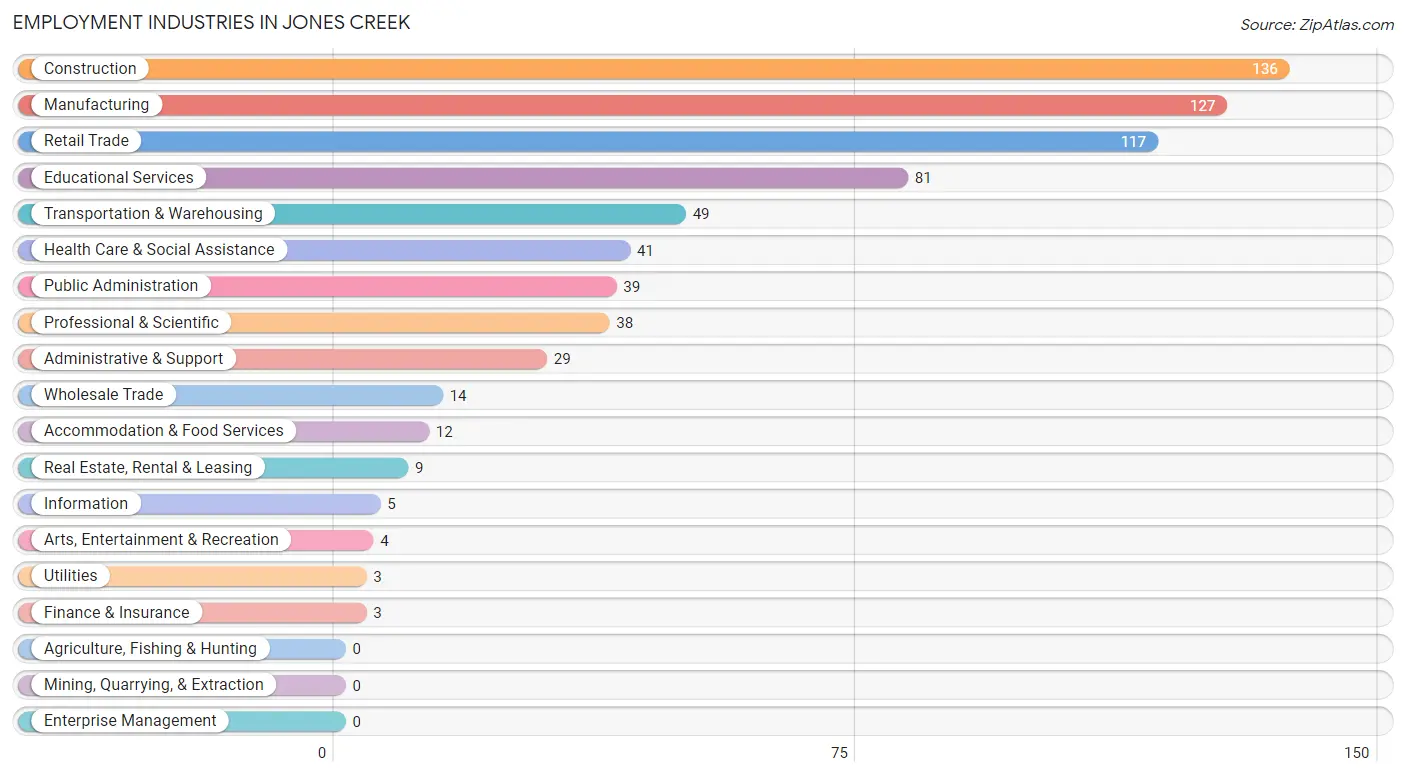
Employment Industries in Jones Creek
The major employment industries in Jones Creek include Construction (136 | 18.0%), Manufacturing (127 | 16.8%), Retail Trade (117 | 15.5%), Educational Services (81 | 10.7%), and Transportation & Warehousing (49 | 6.5%).
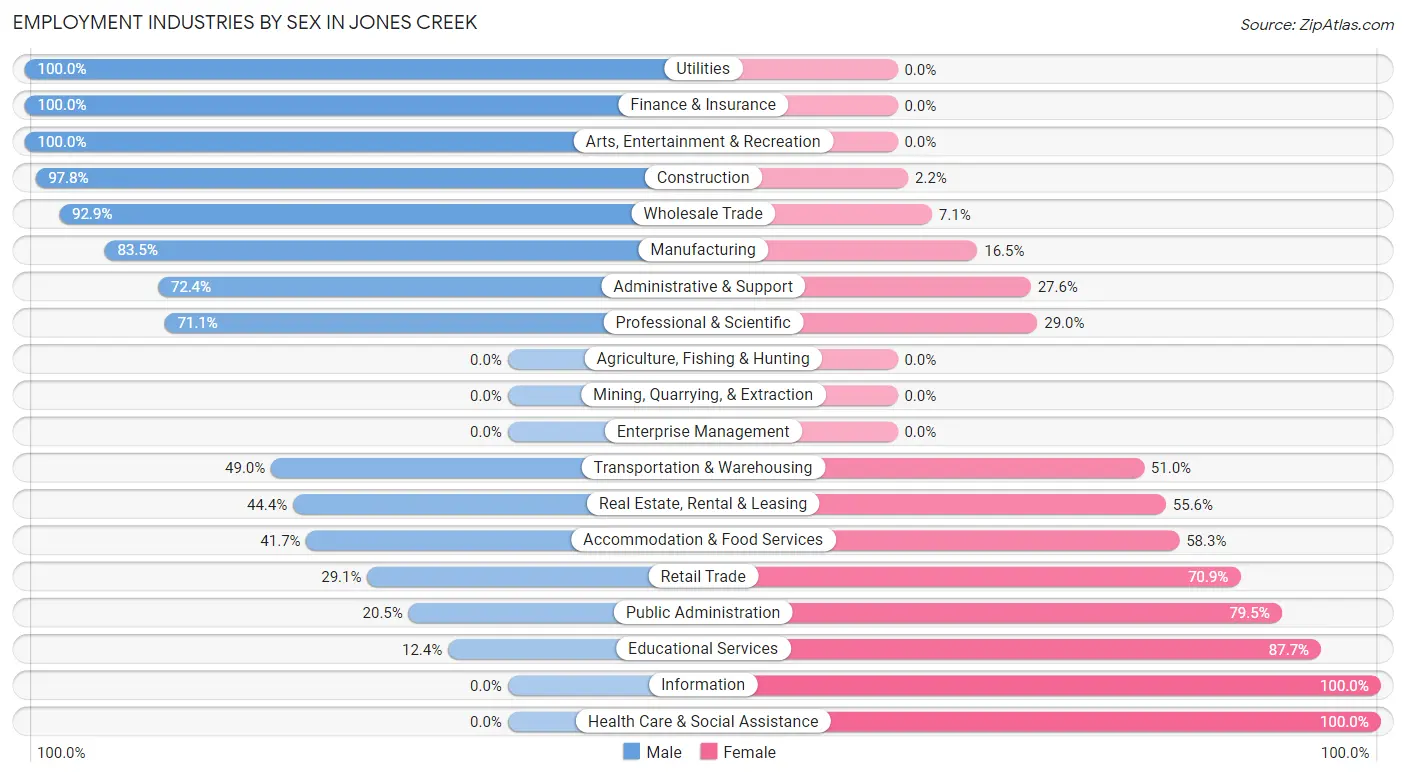
Employment Industries by Sex in Jones Creek
The Jones Creek industries that see more men than women are Utilities (100.0%), Finance & Insurance (100.0%), and Arts, Entertainment & Recreation (100.0%), whereas the industries that tend to have a higher number of women are Information (100.0%), Health Care & Social Assistance (100.0%), and Educational Services (87.6%).
| Industry | Male | Female |
| Agriculture, Fishing & Hunting | 0 (0.0%) | 0 (0.0%) |
| Mining, Quarrying, & Extraction | 0 (0.0%) | 0 (0.0%) |
| Construction | 133 (97.8%) | 3 (2.2%) |
| Manufacturing | 106 (83.5%) | 21 (16.5%) |
| Wholesale Trade | 13 (92.9%) | 1 (7.1%) |
| Retail Trade | 34 (29.1%) | 83 (70.9%) |
| Transportation & Warehousing | 24 (49.0%) | 25 (51.0%) |
| Utilities | 3 (100.0%) | 0 (0.0%) |
| Information | 0 (0.0%) | 5 (100.0%) |
| Finance & Insurance | 3 (100.0%) | 0 (0.0%) |
| Real Estate, Rental & Leasing | 4 (44.4%) | 5 (55.6%) |
| Professional & Scientific | 27 (71.1%) | 11 (28.9%) |
| Enterprise Management | 0 (0.0%) | 0 (0.0%) |
| Administrative & Support | 21 (72.4%) | 8 (27.6%) |
| Educational Services | 10 (12.3%) | 71 (87.6%) |
| Health Care & Social Assistance | 0 (0.0%) | 41 (100.0%) |
| Arts, Entertainment & Recreation | 4 (100.0%) | 0 (0.0%) |
| Accommodation & Food Services | 5 (41.7%) | 7 (58.3%) |
| Public Administration | 8 (20.5%) | 31 (79.5%) |
| Total | 417 (55.3%) | 337 (44.7%) |
Education in Jones Creek
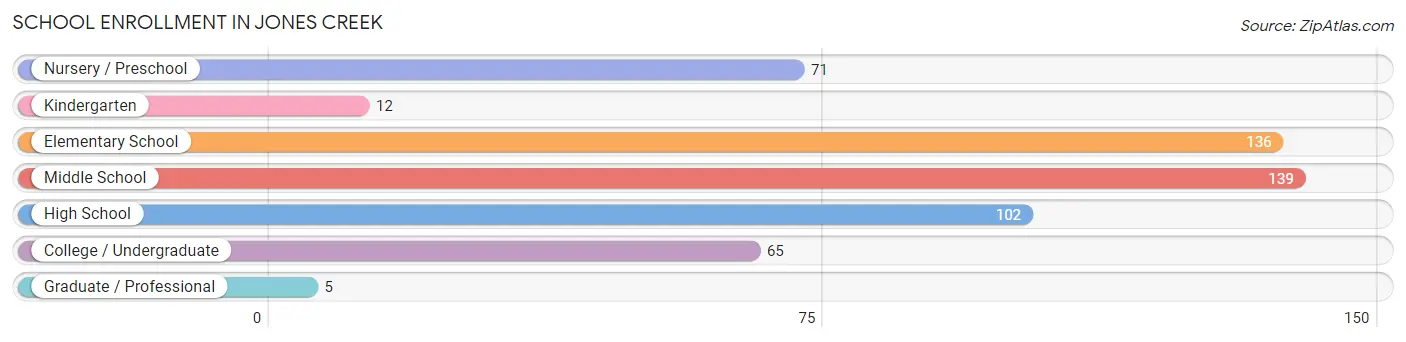
School Enrollment in Jones Creek
The most common levels of schooling among the 530 students in Jones Creek are middle school (139 | 26.2%), elementary school (136 | 25.7%), and high school (102 | 19.3%).
| School Level | # Students | % Students |
| Nursery / Preschool | 71 | 13.4% |
| Kindergarten | 12 | 2.3% |
| Elementary School | 136 | 25.7% |
| Middle School | 139 | 26.2% |
| High School | 102 | 19.3% |
| College / Undergraduate | 65 | 12.3% |
| Graduate / Professional | 5 | 0.9% |
| Total | 530 | 100.0% |
School Enrollment by Age by Funding Source in Jones Creek
Out of a total of 530 students who are enrolled in schools in Jones Creek, 69 (13.0%) attend a private institution, while the remaining 461 (87.0%) are enrolled in public schools. The age group of 20 to 24 year olds has the highest likelihood of being enrolled in private schools, with 7 (33.3% in the age bracket) enrolled. Conversely, the age group of 18 to 19 year olds has the lowest likelihood of being enrolled in a private school, with 8 (100.0% in the age bracket) attending a public institution.
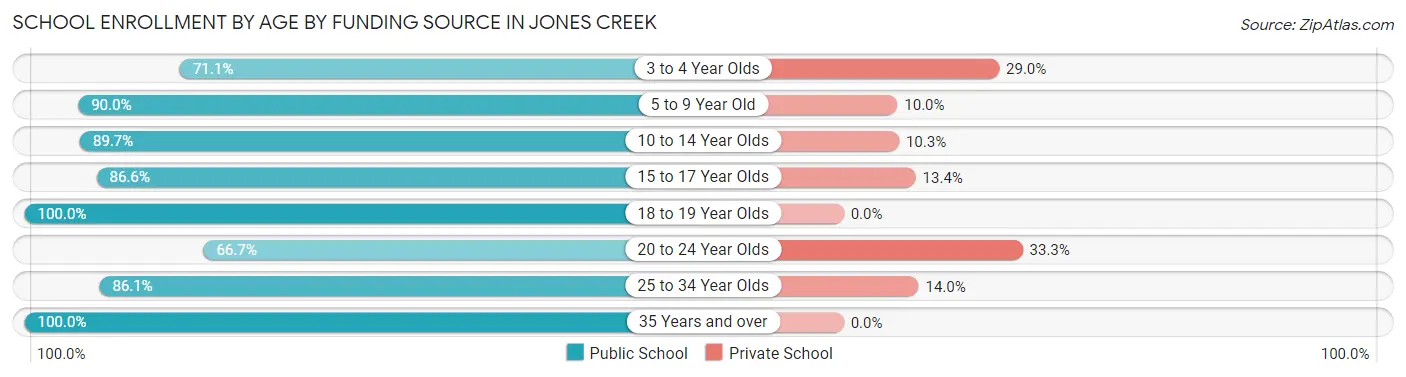
| Age Bracket | Public School | Private School |
| 3 to 4 Year Olds | 27 (71.1%) | 11 (28.9%) |
| 5 to 9 Year Old | 153 (90.0%) | 17 (10.0%) |
| 10 to 14 Year Olds | 148 (89.7%) | 17 (10.3%) |
| 15 to 17 Year Olds | 71 (86.6%) | 11 (13.4%) |
| 18 to 19 Year Olds | 8 (100.0%) | 0 (0.0%) |
| 20 to 24 Year Olds | 14 (66.7%) | 7 (33.3%) |
| 25 to 34 Year Olds | 37 (86.1%) | 6 (14.0%) |
| 35 Years and over | 3 (100.0%) | 0 (0.0%) |
| Total | 461 (87.0%) | 69 (13.0%) |
Educational Attainment by Field of Study in Jones Creek
Business (58 | 27.8%), education (48 | 23.0%), arts & humanities (25 | 12.0%), science & technology (23 | 11.0%), and bio, nature & agricultural (21 | 10.1%) are the most common fields of study among 209 individuals in Jones Creek who have obtained a bachelor's degree or higher.
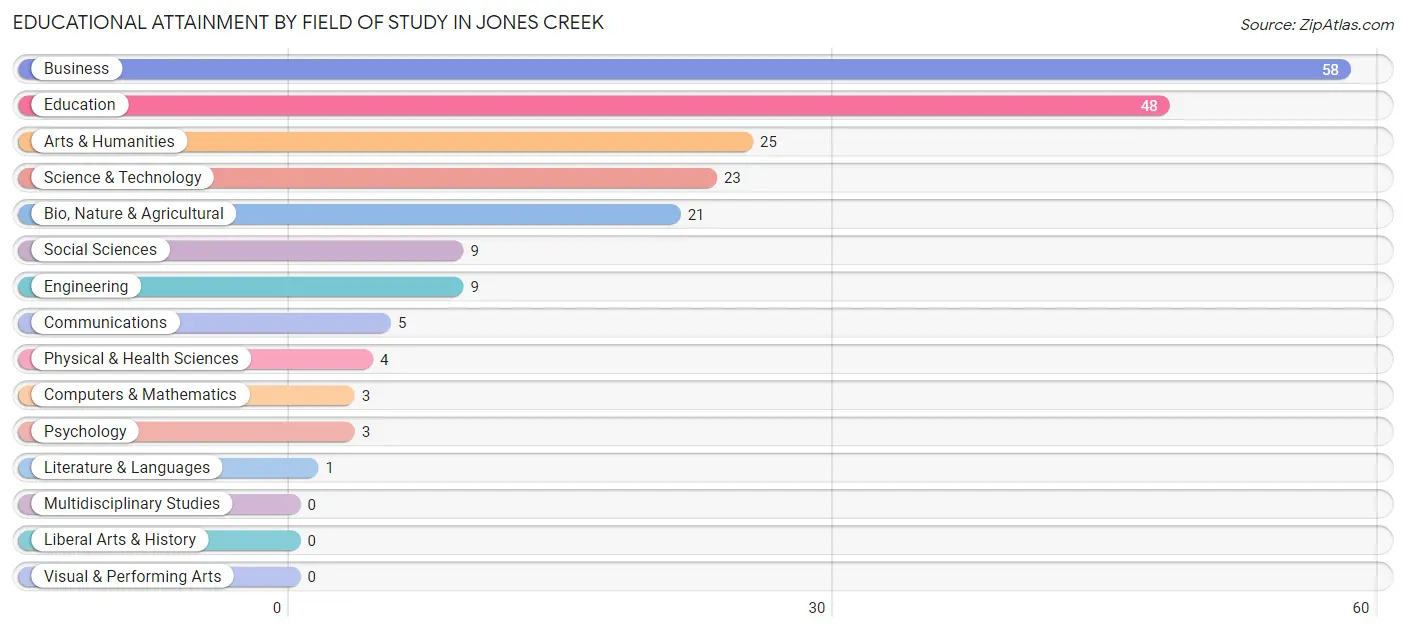
| Field of Study | # Graduates | % Graduates |
| Computers & Mathematics | 3 | 1.4% |
| Bio, Nature & Agricultural | 21 | 10.1% |
| Physical & Health Sciences | 4 | 1.9% |
| Psychology | 3 | 1.4% |
| Social Sciences | 9 | 4.3% |
| Engineering | 9 | 4.3% |
| Multidisciplinary Studies | 0 | 0.0% |
| Science & Technology | 23 | 11.0% |
| Business | 58 | 27.8% |
| Education | 48 | 23.0% |
| Literature & Languages | 1 | 0.5% |
| Liberal Arts & History | 0 | 0.0% |
| Visual & Performing Arts | 0 | 0.0% |
| Communications | 5 | 2.4% |
| Arts & Humanities | 25 | 12.0% |
| Total | 209 | 100.0% |
Transportation & Commute in Jones Creek
Vehicle Availability by Sex in Jones Creek
The most prevalent vehicle ownership categories in Jones Creek are males with 3 vehicles (165, accounting for 39.6%) and females with 3 vehicles (119, making up 51.1%).
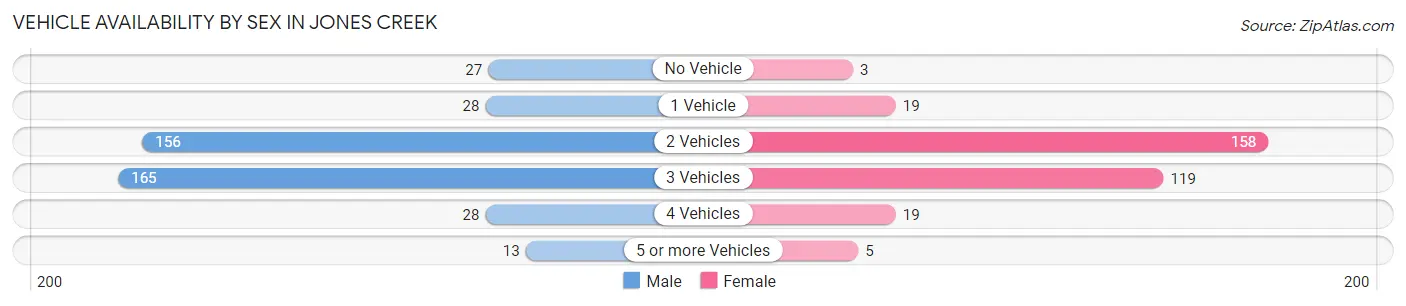
| Vehicles Available | Male | Female |
| No Vehicle | 27 (6.5%) | 3 (0.9%) |
| 1 Vehicle | 28 (6.7%) | 19 (5.9%) |
| 2 Vehicles | 156 (37.4%) | 158 (48.9%) |
| 3 Vehicles | 165 (39.6%) | 119 (36.8%) |
| 4 Vehicles | 28 (6.7%) | 19 (5.9%) |
| 5 or more Vehicles | 13 (3.1%) | 5 (1.5%) |
| Total | 417 (100.0%) | 323 (100.0%) |
Commute Time in Jones Creek
The most frequently occuring commute durations in Jones Creek are 15 to 19 minutes (207 commuters, 30.8%), 20 to 24 minutes (125 commuters, 18.6%), and 25 to 29 minutes (94 commuters, 14.0%).
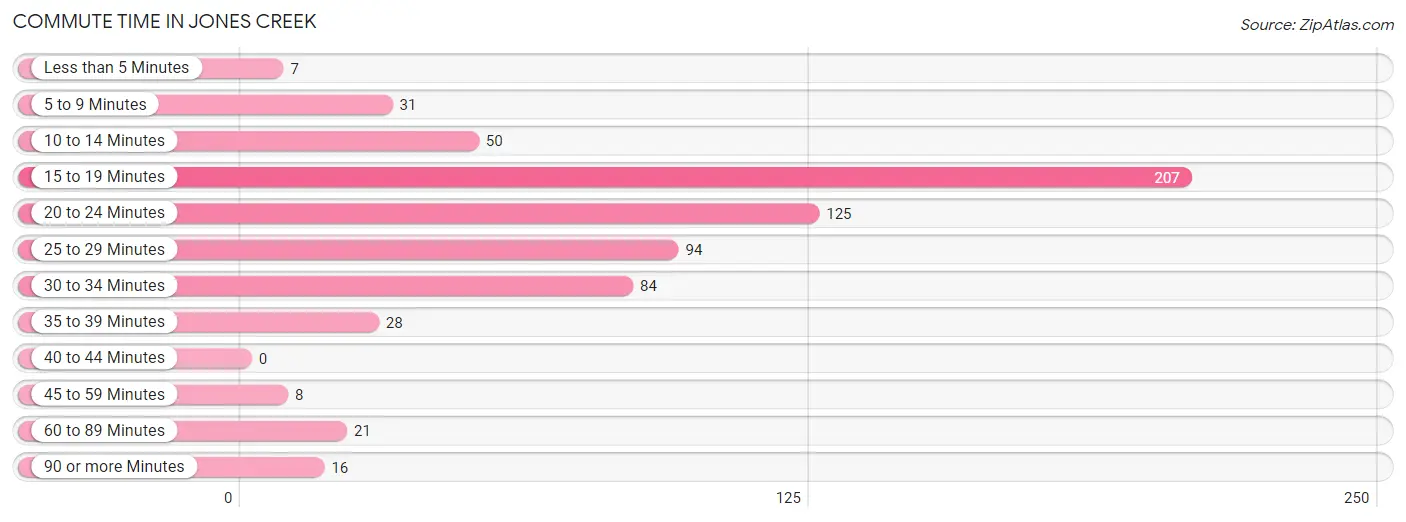
| Commute Time | # Commuters | % Commuters |
| Less than 5 Minutes | 7 | 1.0% |
| 5 to 9 Minutes | 31 | 4.6% |
| 10 to 14 Minutes | 50 | 7.4% |
| 15 to 19 Minutes | 207 | 30.8% |
| 20 to 24 Minutes | 125 | 18.6% |
| 25 to 29 Minutes | 94 | 14.0% |
| 30 to 34 Minutes | 84 | 12.5% |
| 35 to 39 Minutes | 28 | 4.2% |
| 40 to 44 Minutes | 0 | 0.0% |
| 45 to 59 Minutes | 8 | 1.2% |
| 60 to 89 Minutes | 21 | 3.1% |
| 90 or more Minutes | 16 | 2.4% |
Commute Time by Sex in Jones Creek
The most common commute times in Jones Creek are 15 to 19 minutes (85 commuters, 22.1%) for males and 15 to 19 minutes (122 commuters, 42.7%) for females.
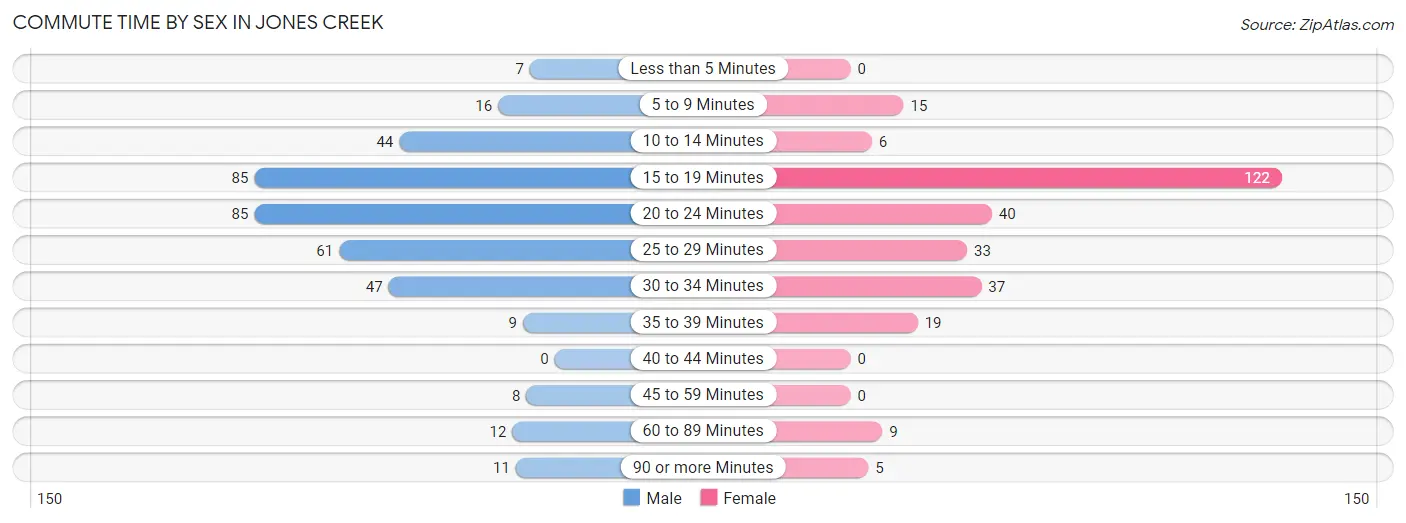
| Commute Time | Male | Female |
| Less than 5 Minutes | 7 (1.8%) | 0 (0.0%) |
| 5 to 9 Minutes | 16 (4.2%) | 15 (5.2%) |
| 10 to 14 Minutes | 44 (11.4%) | 6 (2.1%) |
| 15 to 19 Minutes | 85 (22.1%) | 122 (42.7%) |
| 20 to 24 Minutes | 85 (22.1%) | 40 (14.0%) |
| 25 to 29 Minutes | 61 (15.8%) | 33 (11.5%) |
| 30 to 34 Minutes | 47 (12.2%) | 37 (12.9%) |
| 35 to 39 Minutes | 9 (2.3%) | 19 (6.6%) |
| 40 to 44 Minutes | 0 (0.0%) | 0 (0.0%) |
| 45 to 59 Minutes | 8 (2.1%) | 0 (0.0%) |
| 60 to 89 Minutes | 12 (3.1%) | 9 (3.2%) |
| 90 or more Minutes | 11 (2.9%) | 5 (1.8%) |
Time of Departure to Work by Sex in Jones Creek
The most frequent times of departure to work in Jones Creek are 6:00 AM to 6:29 AM (111, 28.8%) for males and 7:00 AM to 7:29 AM (96, 33.6%) for females.
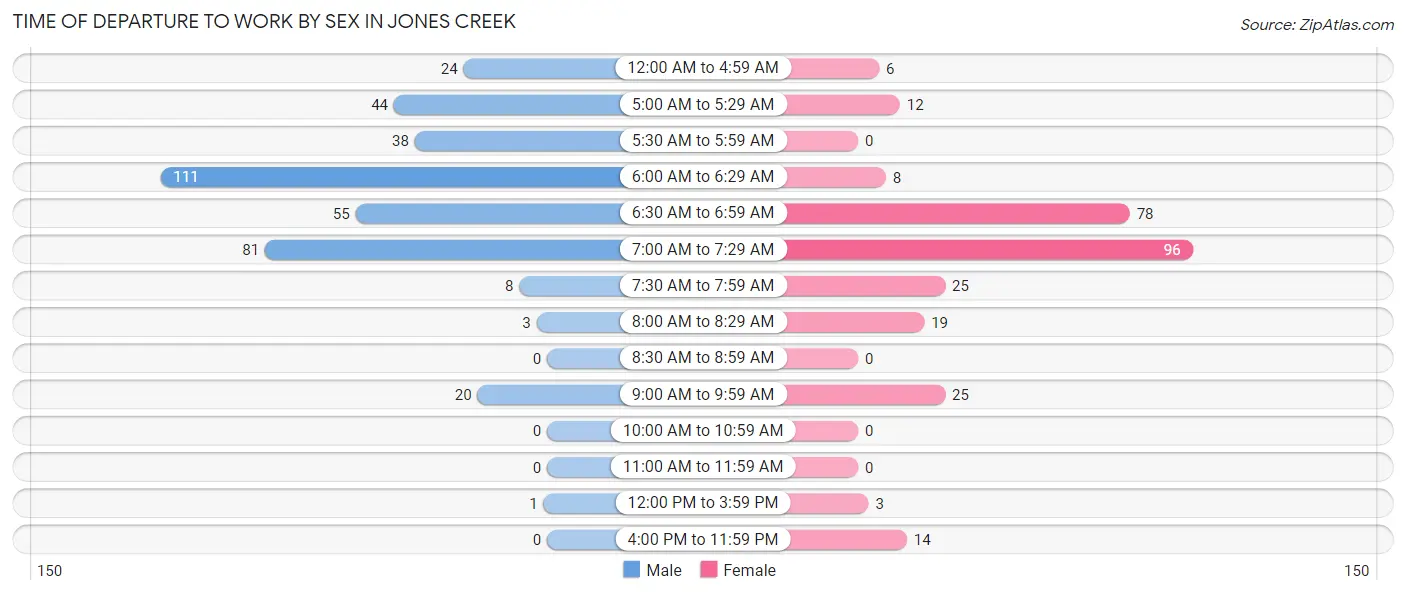
| Time of Departure | Male | Female |
| 12:00 AM to 4:59 AM | 24 (6.2%) | 6 (2.1%) |
| 5:00 AM to 5:29 AM | 44 (11.4%) | 12 (4.2%) |
| 5:30 AM to 5:59 AM | 38 (9.9%) | 0 (0.0%) |
| 6:00 AM to 6:29 AM | 111 (28.8%) | 8 (2.8%) |
| 6:30 AM to 6:59 AM | 55 (14.3%) | 78 (27.3%) |
| 7:00 AM to 7:29 AM | 81 (21.0%) | 96 (33.6%) |
| 7:30 AM to 7:59 AM | 8 (2.1%) | 25 (8.7%) |
| 8:00 AM to 8:29 AM | 3 (0.8%) | 19 (6.6%) |
| 8:30 AM to 8:59 AM | 0 (0.0%) | 0 (0.0%) |
| 9:00 AM to 9:59 AM | 20 (5.2%) | 25 (8.7%) |
| 10:00 AM to 10:59 AM | 0 (0.0%) | 0 (0.0%) |
| 11:00 AM to 11:59 AM | 0 (0.0%) | 0 (0.0%) |
| 12:00 PM to 3:59 PM | 1 (0.3%) | 3 (1.1%) |
| 4:00 PM to 11:59 PM | 0 (0.0%) | 14 (4.9%) |
| Total | 385 (100.0%) | 286 (100.0%) |
Housing Occupancy in Jones Creek
Occupancy by Ownership in Jones Creek
Of the total 678 dwellings in Jones Creek, owner-occupied units account for 647 (95.4%), while renter-occupied units make up 31 (4.6%).
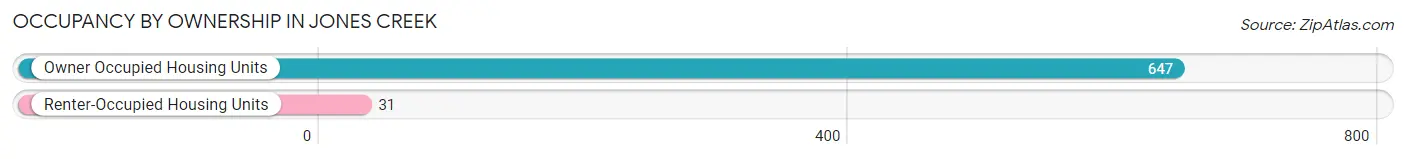
| Occupancy | # Housing Units | % Housing Units |
| Owner Occupied Housing Units | 647 | 95.4% |
| Renter-Occupied Housing Units | 31 | 4.6% |
| Total Occupied Housing Units | 678 | 100.0% |
Occupancy by Household Size in Jones Creek
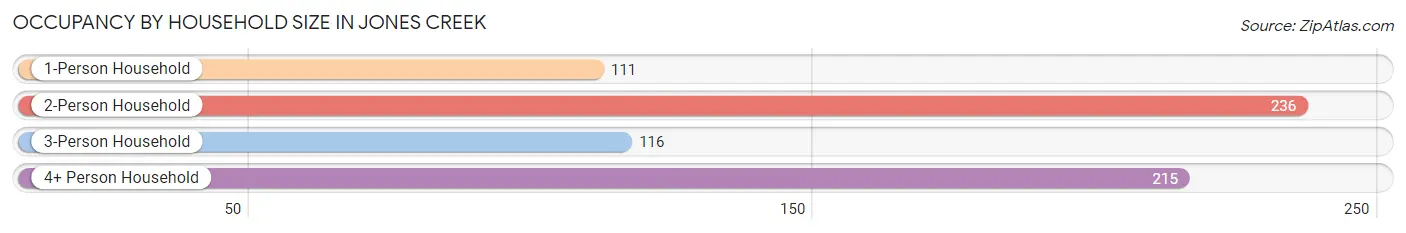
| Household Size | # Housing Units | % Housing Units |
| 1-Person Household | 111 | 16.4% |
| 2-Person Household | 236 | 34.8% |
| 3-Person Household | 116 | 17.1% |
| 4+ Person Household | 215 | 31.7% |
| Total Housing Units | 678 | 100.0% |
Occupancy by Ownership by Household Size in Jones Creek
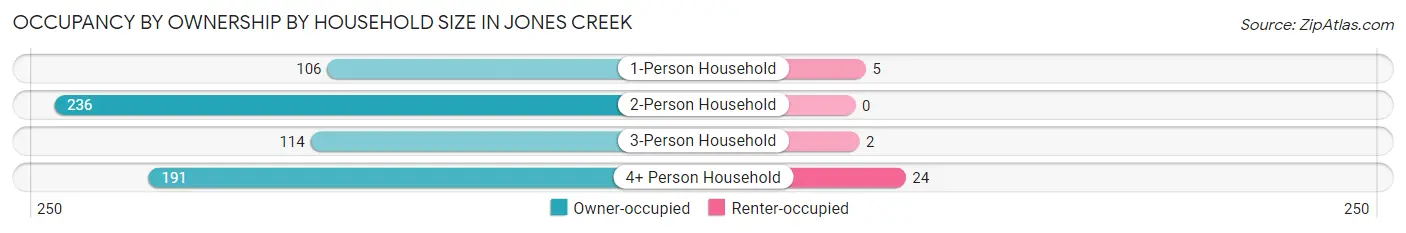
| Household Size | Owner-occupied | Renter-occupied |
| 1-Person Household | 106 (95.5%) | 5 (4.5%) |
| 2-Person Household | 236 (100.0%) | 0 (0.0%) |
| 3-Person Household | 114 (98.3%) | 2 (1.7%) |
| 4+ Person Household | 191 (88.8%) | 24 (11.2%) |
| Total Housing Units | 647 (95.4%) | 31 (4.6%) |
Occupancy by Educational Attainment in Jones Creek
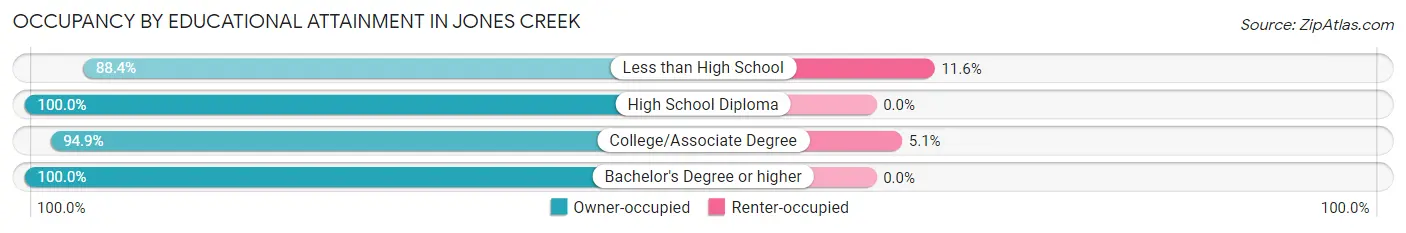
| Household Size | Owner-occupied | Renter-occupied |
| Less than High School | 130 (88.4%) | 17 (11.6%) |
| High School Diploma | 133 (100.0%) | 0 (0.0%) |
| College/Associate Degree | 261 (94.9%) | 14 (5.1%) |
| Bachelor's Degree or higher | 123 (100.0%) | 0 (0.0%) |
Occupancy by Age of Householder in Jones Creek
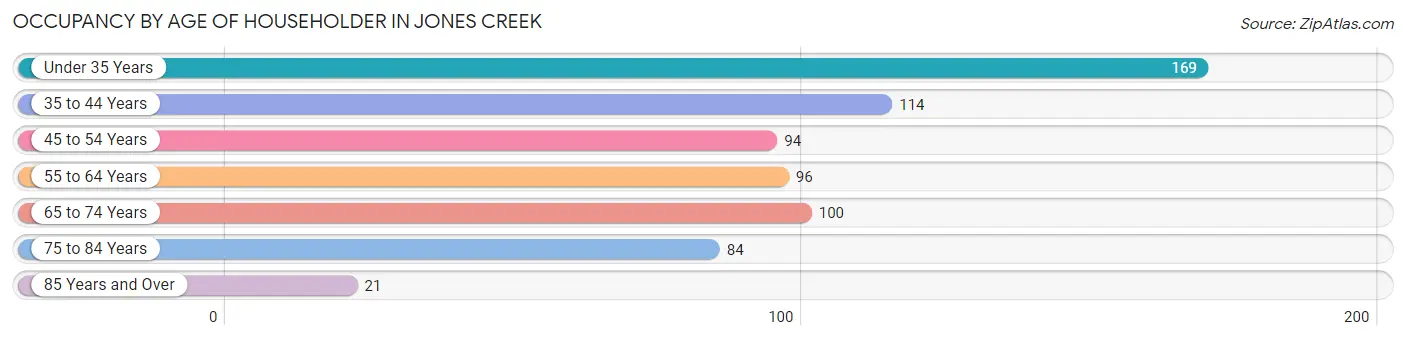
| Age Bracket | # Households | % Households |
| Under 35 Years | 169 | 24.9% |
| 35 to 44 Years | 114 | 16.8% |
| 45 to 54 Years | 94 | 13.9% |
| 55 to 64 Years | 96 | 14.2% |
| 65 to 74 Years | 100 | 14.7% |
| 75 to 84 Years | 84 | 12.4% |
| 85 Years and Over | 21 | 3.1% |
| Total | 678 | 100.0% |
Housing Finances in Jones Creek
Median Income by Occupancy in Jones Creek
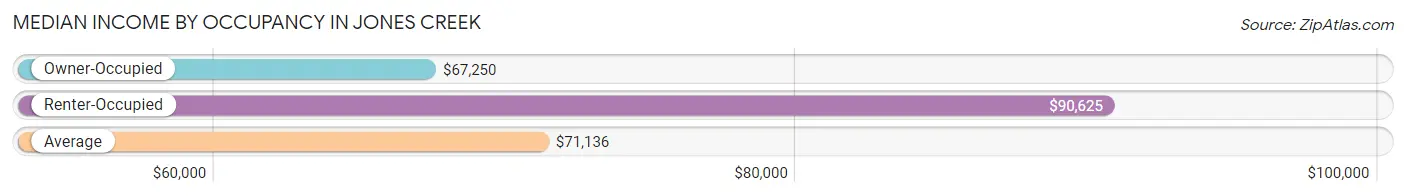
| Occupancy Type | # Households | Median Income |
| Owner-Occupied | 647 (95.4%) | $67,250 |
| Renter-Occupied | 31 (4.6%) | $90,625 |
| Average | 678 (100.0%) | $71,136 |
Occupancy by Householder Income Bracket in Jones Creek
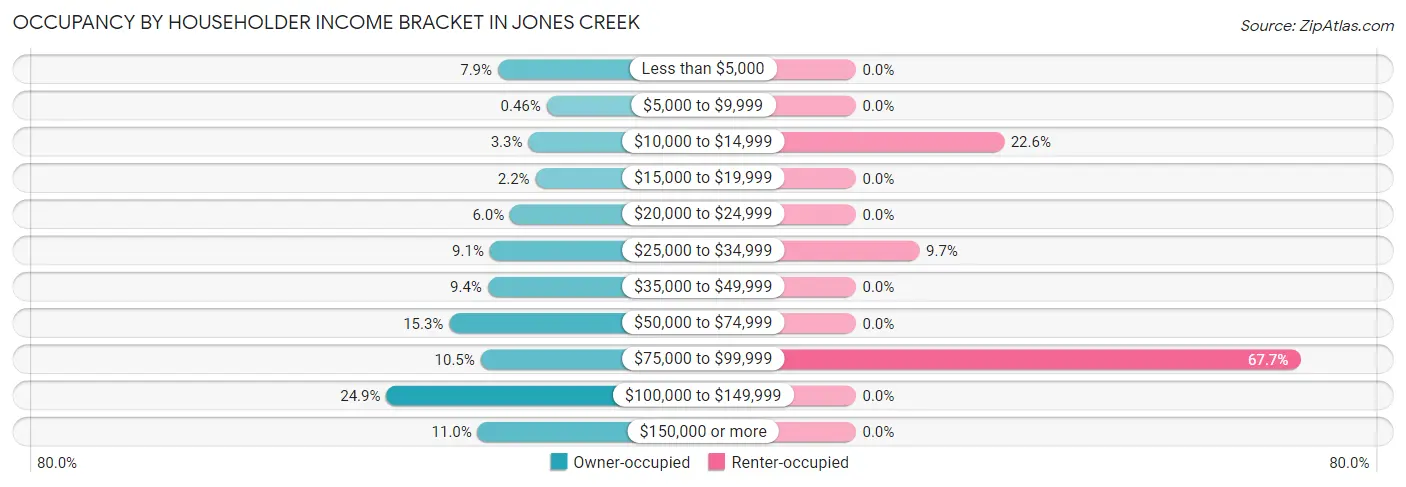
| Income Bracket | Owner-occupied | Renter-occupied |
| Less than $5,000 | 51 (7.9%) | 0 (0.0%) |
| $5,000 to $9,999 | 3 (0.5%) | 0 (0.0%) |
| $10,000 to $14,999 | 21 (3.3%) | 7 (22.6%) |
| $15,000 to $19,999 | 14 (2.2%) | 0 (0.0%) |
| $20,000 to $24,999 | 39 (6.0%) | 0 (0.0%) |
| $25,000 to $34,999 | 59 (9.1%) | 3 (9.7%) |
| $35,000 to $49,999 | 61 (9.4%) | 0 (0.0%) |
| $50,000 to $74,999 | 99 (15.3%) | 0 (0.0%) |
| $75,000 to $99,999 | 68 (10.5%) | 21 (67.7%) |
| $100,000 to $149,999 | 161 (24.9%) | 0 (0.0%) |
| $150,000 or more | 71 (11.0%) | 0 (0.0%) |
| Total | 647 (100.0%) | 31 (100.0%) |
Monthly Housing Cost Tiers in Jones Creek
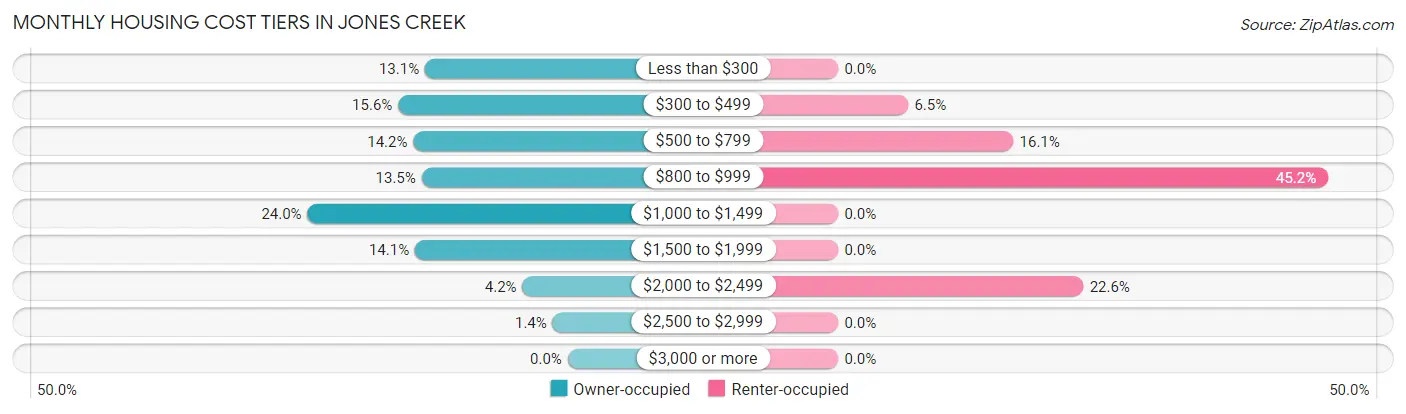
| Monthly Cost | Owner-occupied | Renter-occupied |
| Less than $300 | 85 (13.1%) | 0 (0.0%) |
| $300 to $499 | 101 (15.6%) | 2 (6.5%) |
| $500 to $799 | 92 (14.2%) | 5 (16.1%) |
| $800 to $999 | 87 (13.5%) | 14 (45.2%) |
| $1,000 to $1,499 | 155 (24.0%) | 0 (0.0%) |
| $1,500 to $1,999 | 91 (14.1%) | 0 (0.0%) |
| $2,000 to $2,499 | 27 (4.2%) | 7 (22.6%) |
| $2,500 to $2,999 | 9 (1.4%) | 0 (0.0%) |
| $3,000 or more | 0 (0.0%) | 0 (0.0%) |
| Total | 647 (100.0%) | 31 (100.0%) |
Physical Housing Characteristics in Jones Creek
Housing Structures in Jones Creek
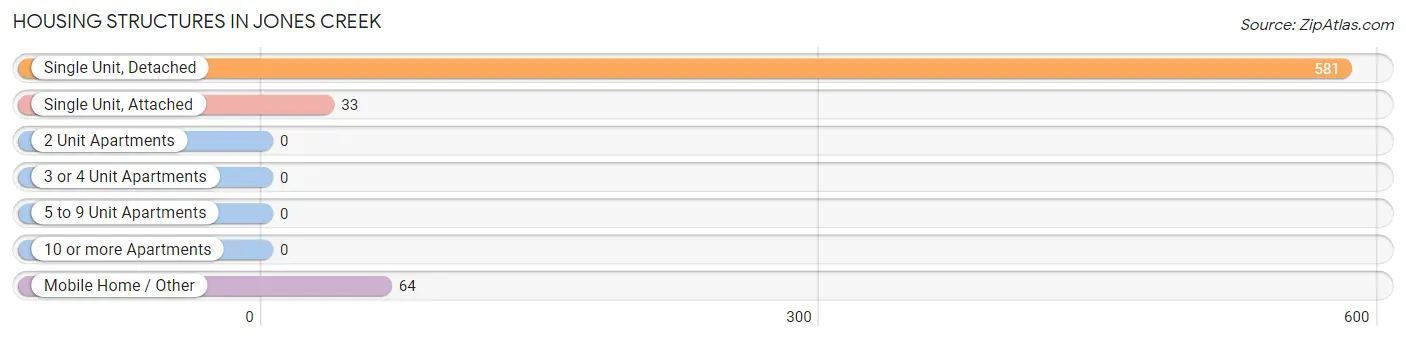
| Structure Type | # Housing Units | % Housing Units |
| Single Unit, Detached | 581 | 85.7% |
| Single Unit, Attached | 33 | 4.9% |
| 2 Unit Apartments | 0 | 0.0% |
| 3 or 4 Unit Apartments | 0 | 0.0% |
| 5 to 9 Unit Apartments | 0 | 0.0% |
| 10 or more Apartments | 0 | 0.0% |
| Mobile Home / Other | 64 | 9.4% |
| Total | 678 | 100.0% |
Housing Structures by Occupancy in Jones Creek
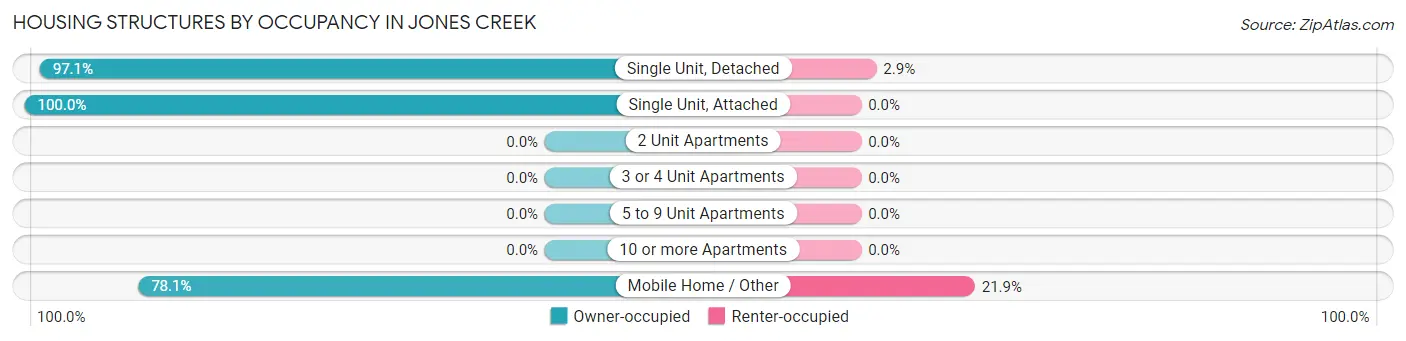
| Structure Type | Owner-occupied | Renter-occupied |
| Single Unit, Detached | 564 (97.1%) | 17 (2.9%) |
| Single Unit, Attached | 33 (100.0%) | 0 (0.0%) |
| 2 Unit Apartments | 0 (0.0%) | 0 (0.0%) |
| 3 or 4 Unit Apartments | 0 (0.0%) | 0 (0.0%) |
| 5 to 9 Unit Apartments | 0 (0.0%) | 0 (0.0%) |
| 10 or more Apartments | 0 (0.0%) | 0 (0.0%) |
| Mobile Home / Other | 50 (78.1%) | 14 (21.9%) |
| Total | 647 (95.4%) | 31 (4.6%) |
Housing Structures by Number of Rooms in Jones Creek
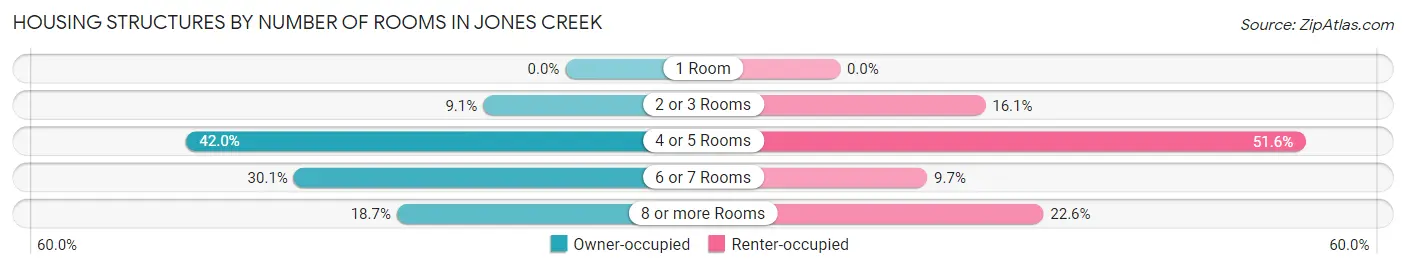
| Number of Rooms | Owner-occupied | Renter-occupied |
| 1 Room | 0 (0.0%) | 0 (0.0%) |
| 2 or 3 Rooms | 59 (9.1%) | 5 (16.1%) |
| 4 or 5 Rooms | 272 (42.0%) | 16 (51.6%) |
| 6 or 7 Rooms | 195 (30.1%) | 3 (9.7%) |
| 8 or more Rooms | 121 (18.7%) | 7 (22.6%) |
| Total | 647 (100.0%) | 31 (100.0%) |
Housing Structure by Heating Type in Jones Creek
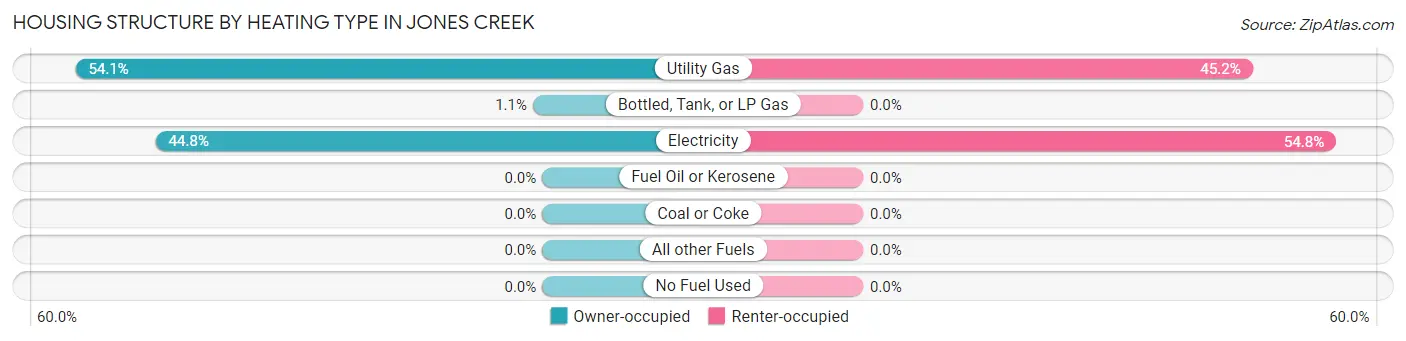
| Heating Type | Owner-occupied | Renter-occupied |
| Utility Gas | 350 (54.1%) | 14 (45.2%) |
| Bottled, Tank, or LP Gas | 7 (1.1%) | 0 (0.0%) |
| Electricity | 290 (44.8%) | 17 (54.8%) |
| Fuel Oil or Kerosene | 0 (0.0%) | 0 (0.0%) |
| Coal or Coke | 0 (0.0%) | 0 (0.0%) |
| All other Fuels | 0 (0.0%) | 0 (0.0%) |
| No Fuel Used | 0 (0.0%) | 0 (0.0%) |
| Total | 647 (100.0%) | 31 (100.0%) |
Household Vehicle Usage in Jones Creek
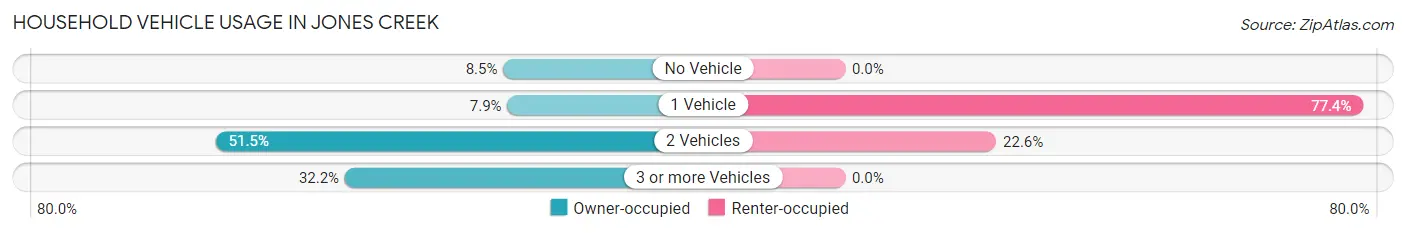
| Vehicles per Household | Owner-occupied | Renter-occupied |
| No Vehicle | 55 (8.5%) | 0 (0.0%) |
| 1 Vehicle | 51 (7.9%) | 24 (77.4%) |
| 2 Vehicles | 333 (51.5%) | 7 (22.6%) |
| 3 or more Vehicles | 208 (32.2%) | 0 (0.0%) |
| Total | 647 (100.0%) | 31 (100.0%) |
Real Estate & Mortgages in Jones Creek
Real Estate and Mortgage Overview in Jones Creek
| Characteristic | Without Mortgage | With Mortgage |
| Housing Units | 337 | 310 |
| Median Property Value | $140,900 | $163,900 |
| Median Household Income | $51,550 | $34 |
| Monthly Housing Costs | $476 | $0 |
| Real Estate Taxes | $1,536 | $0 |
Property Value by Mortgage Status in Jones Creek
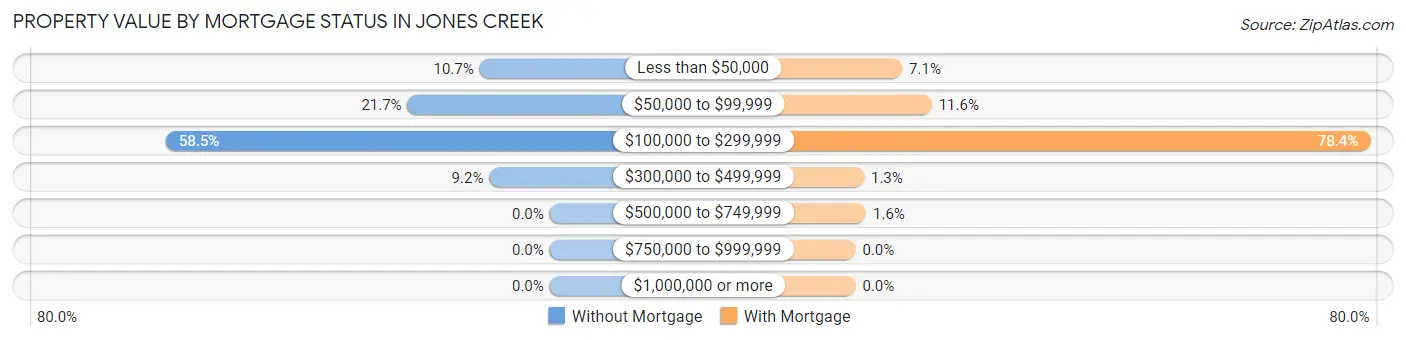
| Property Value | Without Mortgage | With Mortgage |
| Less than $50,000 | 36 (10.7%) | 22 (7.1%) |
| $50,000 to $99,999 | 73 (21.7%) | 36 (11.6%) |
| $100,000 to $299,999 | 197 (58.5%) | 243 (78.4%) |
| $300,000 to $499,999 | 31 (9.2%) | 4 (1.3%) |
| $500,000 to $749,999 | 0 (0.0%) | 5 (1.6%) |
| $750,000 to $999,999 | 0 (0.0%) | 0 (0.0%) |
| $1,000,000 or more | 0 (0.0%) | 0 (0.0%) |
| Total | 337 (100.0%) | 310 (100.0%) |
Household Income by Mortgage Status in Jones Creek
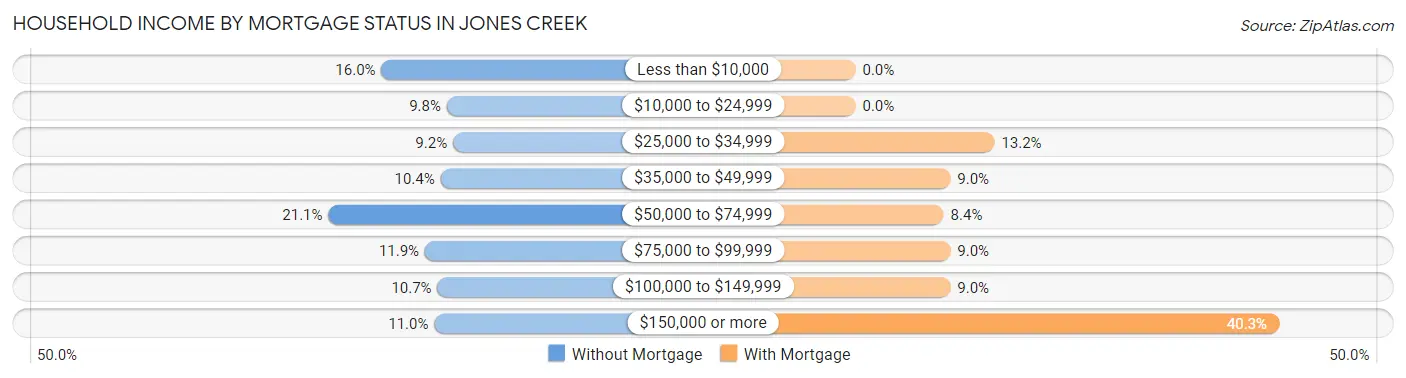
| Household Income | Without Mortgage | With Mortgage |
| Less than $10,000 | 54 (16.0%) | 0 (0.0%) |
| $10,000 to $24,999 | 33 (9.8%) | 0 (0.0%) |
| $25,000 to $34,999 | 31 (9.2%) | 41 (13.2%) |
| $35,000 to $49,999 | 35 (10.4%) | 28 (9.0%) |
| $50,000 to $74,999 | 71 (21.1%) | 26 (8.4%) |
| $75,000 to $99,999 | 40 (11.9%) | 28 (9.0%) |
| $100,000 to $149,999 | 36 (10.7%) | 28 (9.0%) |
| $150,000 or more | 37 (11.0%) | 125 (40.3%) |
| Total | 337 (100.0%) | 310 (100.0%) |
Property Value to Household Income Ratio in Jones Creek
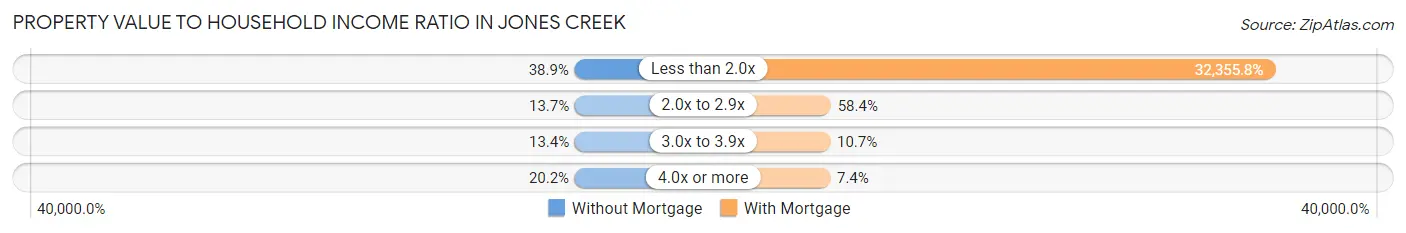
| Value-to-Income Ratio | Without Mortgage | With Mortgage |
| Less than 2.0x | 131 (38.9%) | 100,303 (32,355.8%) |
| 2.0x to 2.9x | 46 (13.7%) | 181 (58.4%) |
| 3.0x to 3.9x | 45 (13.4%) | 33 (10.6%) |
| 4.0x or more | 68 (20.2%) | 23 (7.4%) |
| Total | 337 (100.0%) | 310 (100.0%) |
Real Estate Taxes by Mortgage Status in Jones Creek
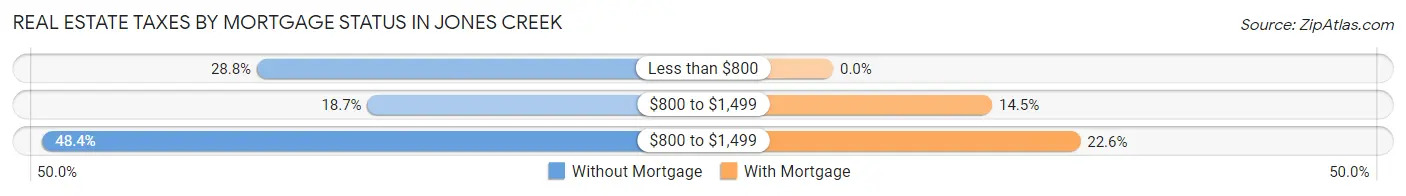
| Property Taxes | Without Mortgage | With Mortgage |
| Less than $800 | 97 (28.8%) | 0 (0.0%) |
| $800 to $1,499 | 63 (18.7%) | 45 (14.5%) |
| $800 to $1,499 | 163 (48.4%) | 70 (22.6%) |
| Total | 337 (100.0%) | 310 (100.0%) |
Health & Disability in Jones Creek
Health Insurance Coverage by Age in Jones Creek
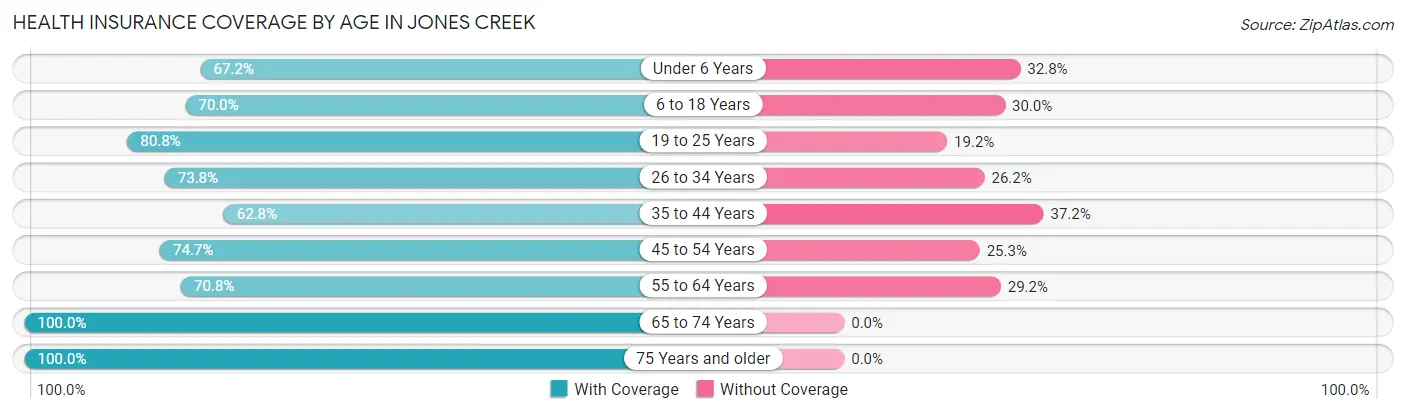
| Age Bracket | With Coverage | Without Coverage |
| Under 6 Years | 90 (67.2%) | 44 (32.8%) |
| 6 to 18 Years | 285 (70.0%) | 122 (30.0%) |
| 19 to 25 Years | 118 (80.8%) | 28 (19.2%) |
| 26 to 34 Years | 223 (73.8%) | 79 (26.2%) |
| 35 to 44 Years | 115 (62.8%) | 68 (37.2%) |
| 45 to 54 Years | 145 (74.7%) | 49 (25.3%) |
| 55 to 64 Years | 165 (70.8%) | 68 (29.2%) |
| 65 to 74 Years | 158 (100.0%) | 0 (0.0%) |
| 75 Years and older | 179 (100.0%) | 0 (0.0%) |
| Total | 1,478 (76.3%) | 458 (23.7%) |
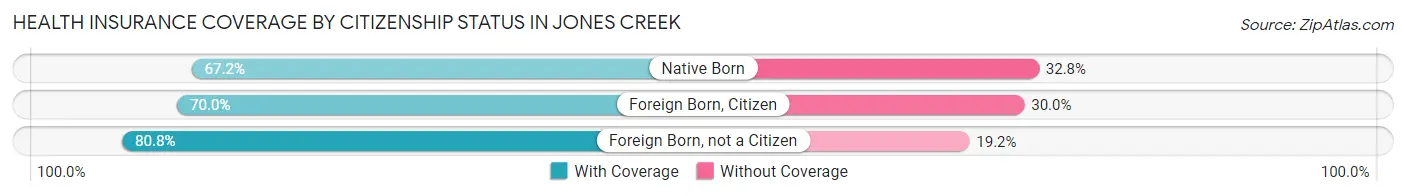
Health Insurance Coverage by Citizenship Status in Jones Creek
| Citizenship Status | With Coverage | Without Coverage |
| Native Born | 90 (67.2%) | 44 (32.8%) |
| Foreign Born, Citizen | 285 (70.0%) | 122 (30.0%) |
| Foreign Born, not a Citizen | 118 (80.8%) | 28 (19.2%) |
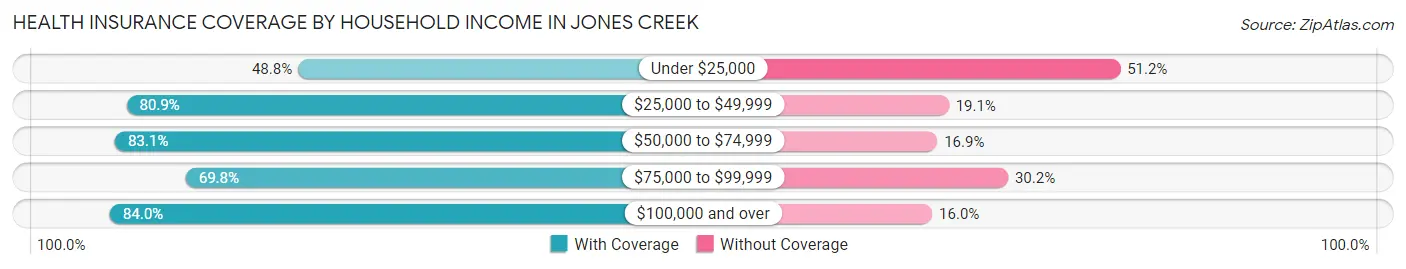
Health Insurance Coverage by Household Income in Jones Creek
| Household Income | With Coverage | Without Coverage |
| Under $25,000 | 140 (48.8%) | 147 (51.2%) |
| $25,000 to $49,999 | 267 (80.9%) | 63 (19.1%) |
| $50,000 to $74,999 | 201 (83.1%) | 41 (16.9%) |
| $75,000 to $99,999 | 171 (69.8%) | 74 (30.2%) |
| $100,000 and over | 699 (84.0%) | 133 (16.0%) |
Public vs Private Health Insurance Coverage by Age in Jones Creek
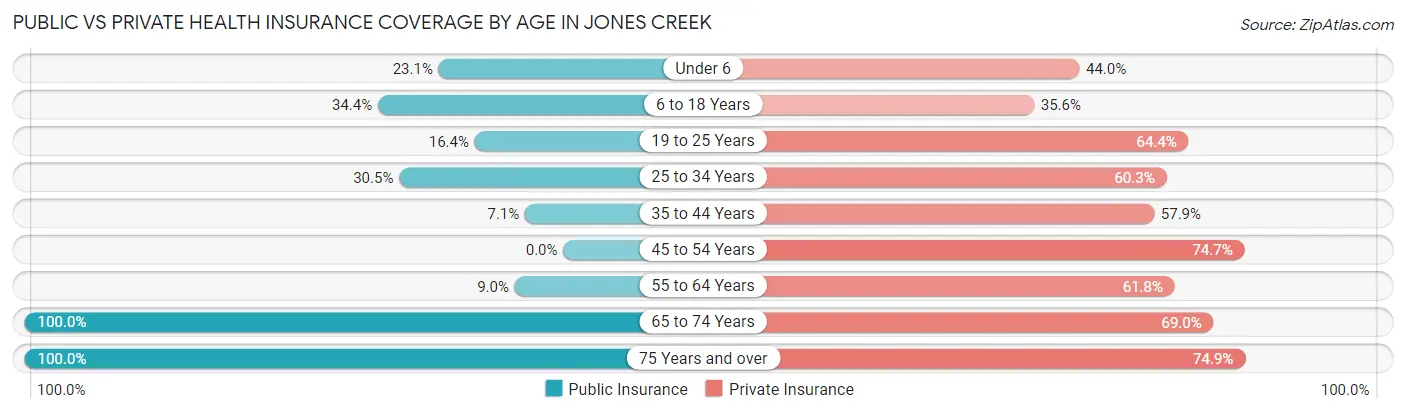
| Age Bracket | Public Insurance | Private Insurance |
| Under 6 | 31 (23.1%) | 59 (44.0%) |
| 6 to 18 Years | 140 (34.4%) | 145 (35.6%) |
| 19 to 25 Years | 24 (16.4%) | 94 (64.4%) |
| 25 to 34 Years | 92 (30.5%) | 182 (60.3%) |
| 35 to 44 Years | 13 (7.1%) | 106 (57.9%) |
| 45 to 54 Years | 0 (0.0%) | 145 (74.7%) |
| 55 to 64 Years | 21 (9.0%) | 144 (61.8%) |
| 65 to 74 Years | 158 (100.0%) | 109 (69.0%) |
| 75 Years and over | 179 (100.0%) | 134 (74.9%) |
| Total | 658 (34.0%) | 1,118 (57.8%) |
Disability Status by Sex by Age in Jones Creek
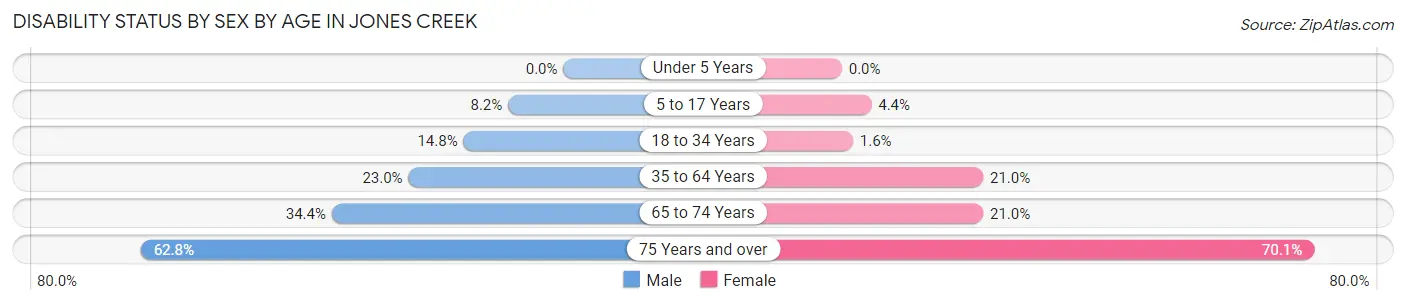
| Age Bracket | Male | Female |
| Under 5 Years | 0 (0.0%) | 0 (0.0%) |
| 5 to 17 Years | 10 (8.2%) | 13 (4.4%) |
| 18 to 34 Years | 35 (14.8%) | 4 (1.6%) |
| 35 to 64 Years | 69 (23.0%) | 65 (21.0%) |
| 65 to 74 Years | 33 (34.4%) | 13 (21.0%) |
| 75 Years and over | 64 (62.7%) | 54 (70.1%) |
Disability Class by Sex by Age in Jones Creek
Disability Class: Hearing Difficulty
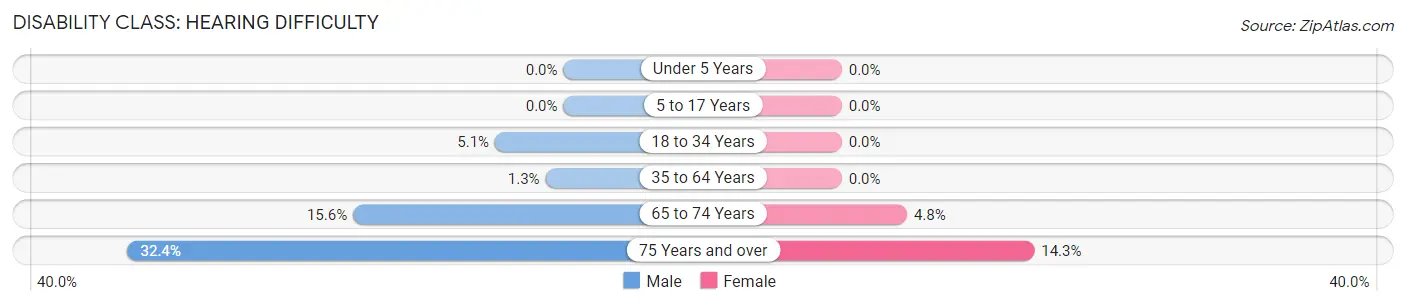
| Age Bracket | Male | Female |
| Under 5 Years | 0 (0.0%) | 0 (0.0%) |
| 5 to 17 Years | 0 (0.0%) | 0 (0.0%) |
| 18 to 34 Years | 12 (5.1%) | 0 (0.0%) |
| 35 to 64 Years | 4 (1.3%) | 0 (0.0%) |
| 65 to 74 Years | 15 (15.6%) | 3 (4.8%) |
| 75 Years and over | 33 (32.4%) | 11 (14.3%) |
Disability Class: Vision Difficulty
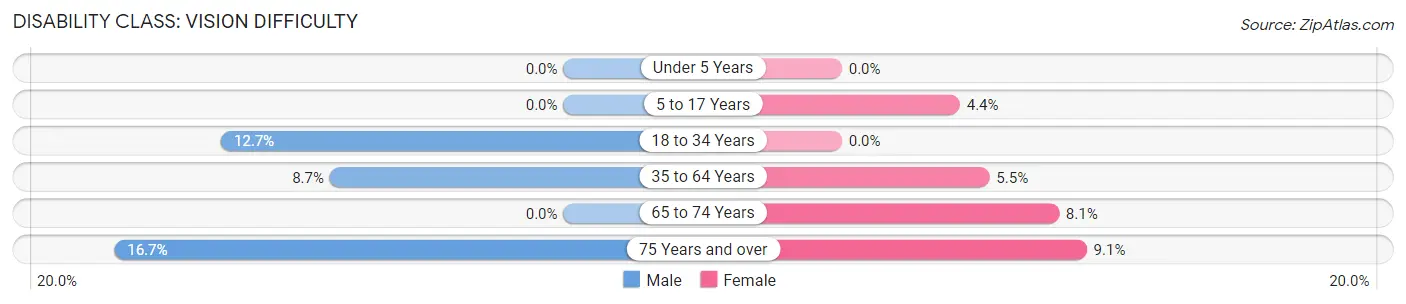
| Age Bracket | Male | Female |
| Under 5 Years | 0 (0.0%) | 0 (0.0%) |
| 5 to 17 Years | 0 (0.0%) | 13 (4.4%) |
| 18 to 34 Years | 30 (12.7%) | 0 (0.0%) |
| 35 to 64 Years | 26 (8.7%) | 17 (5.5%) |
| 65 to 74 Years | 0 (0.0%) | 5 (8.1%) |
| 75 Years and over | 17 (16.7%) | 7 (9.1%) |
Disability Class: Cognitive Difficulty
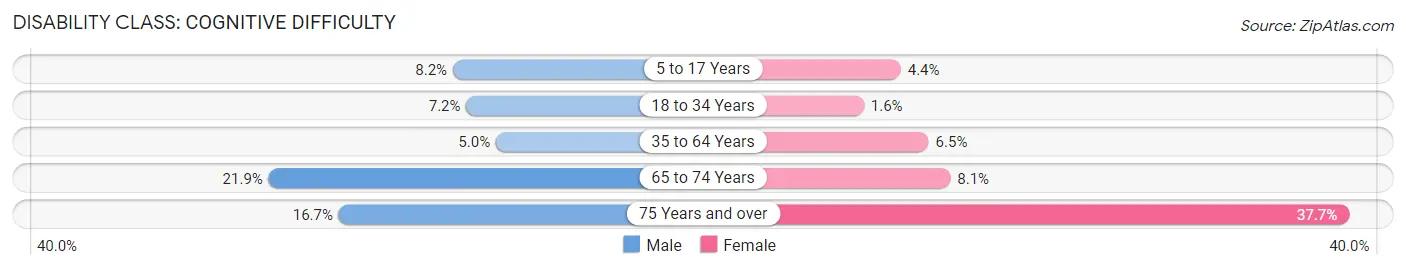
| Age Bracket | Male | Female |
| 5 to 17 Years | 10 (8.2%) | 13 (4.4%) |
| 18 to 34 Years | 17 (7.2%) | 4 (1.6%) |
| 35 to 64 Years | 15 (5.0%) | 20 (6.5%) |
| 65 to 74 Years | 21 (21.9%) | 5 (8.1%) |
| 75 Years and over | 17 (16.7%) | 29 (37.7%) |
Disability Class: Ambulatory Difficulty
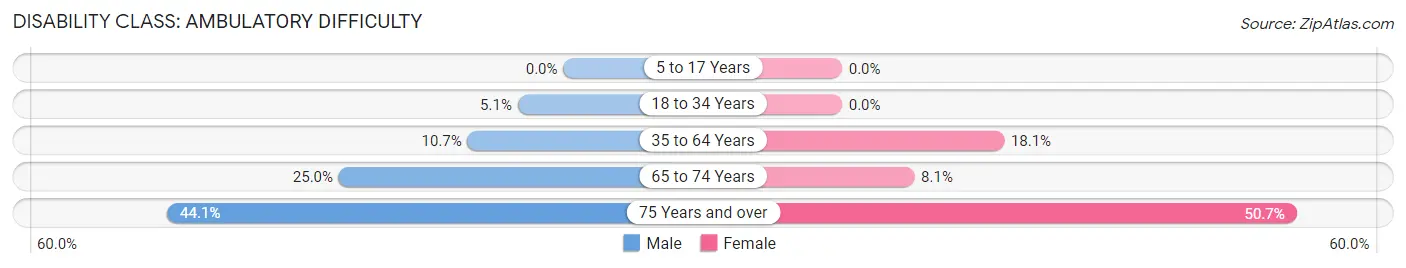
| Age Bracket | Male | Female |
| 5 to 17 Years | 0 (0.0%) | 0 (0.0%) |
| 18 to 34 Years | 12 (5.1%) | 0 (0.0%) |
| 35 to 64 Years | 32 (10.7%) | 56 (18.1%) |
| 65 to 74 Years | 24 (25.0%) | 5 (8.1%) |
| 75 Years and over | 45 (44.1%) | 39 (50.6%) |
Disability Class: Self-Care Difficulty
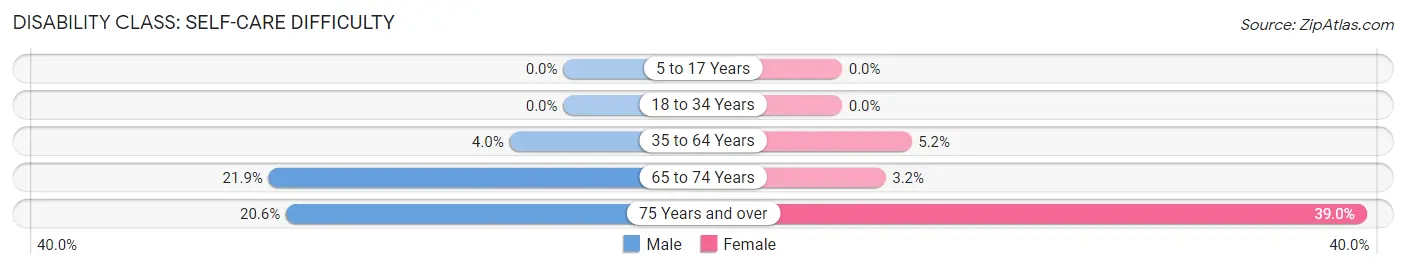
| Age Bracket | Male | Female |
| 5 to 17 Years | 0 (0.0%) | 0 (0.0%) |
| 18 to 34 Years | 0 (0.0%) | 0 (0.0%) |
| 35 to 64 Years | 12 (4.0%) | 16 (5.2%) |
| 65 to 74 Years | 21 (21.9%) | 2 (3.2%) |
| 75 Years and over | 21 (20.6%) | 30 (39.0%) |
Technology Access in Jones Creek
Computing Device Access in Jones Creek
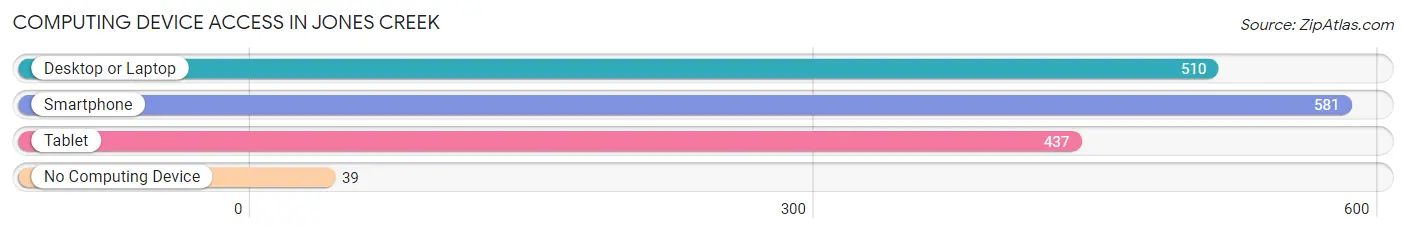
| Device Type | # Households | % Households |
| Desktop or Laptop | 510 | 75.2% |
| Smartphone | 581 | 85.7% |
| Tablet | 437 | 64.4% |
| No Computing Device | 39 | 5.8% |
| Total | 678 | 100.0% |
Internet Access in Jones Creek
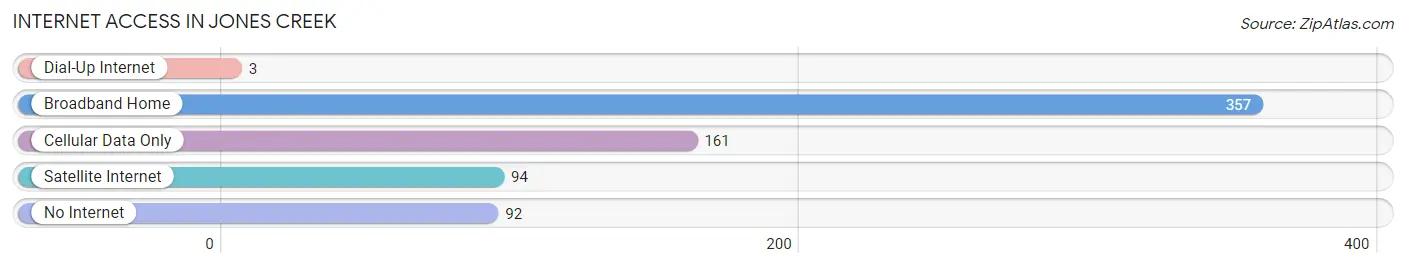
| Internet Type | # Households | % Households |
| Dial-Up Internet | 3 | 0.4% |
| Broadband Home | 357 | 52.6% |
| Cellular Data Only | 161 | 23.7% |
| Satellite Internet | 94 | 13.9% |
| No Internet | 92 | 13.6% |
| Total | 678 | 100.0% |
Jones Creek Summary
Introduction
Jones Creek is a small unincorporated community located in Brazoria County, Texas. It is situated about 25 miles south of Houston and is part of the Houston–The Woodlands–Sugar Land metropolitan area. The community is named after the nearby Jones Creek, which flows through the area. The population of Jones Creek was estimated to be 1,845 in 2019.
History
The area that is now Jones Creek was first settled in the early 1800s by a group of settlers from the United States. The settlers were attracted to the area due to its fertile soil and abundant wildlife. The first post office in the area was established in 1854 and the community was officially named Jones Creek in 1856.
The area was primarily an agricultural community until the early 1900s when the oil industry began to take off in the region. The discovery of oil in the area led to an influx of people and businesses, and the population of Jones Creek began to grow rapidly.
In the 1950s, the community began to experience a decline in population as people moved away to larger cities. However, the population began to stabilize in the late 1970s and has remained relatively steady since then.
Geography
Jones Creek is located in Brazoria County, Texas, about 25 miles south of Houston. The community is situated on the banks of Jones Creek, which flows through the area. The terrain in the area is mostly flat with some rolling hills. The climate in the area is humid subtropical, with hot summers and mild winters.
Economy
The economy of Jones Creek is primarily based on agriculture and oil production. The area is home to several large farms that produce a variety of crops, including cotton, corn, and soybeans. The oil industry is also a major contributor to the local economy, with several oil and gas companies operating in the area.
In addition to agriculture and oil production, Jones Creek is home to several small businesses, including restaurants, convenience stores, and auto repair shops. The community also has a few small manufacturing companies that produce a variety of products, including furniture and clothing.
Demographics
The population of Jones Creek was estimated to be 1,845 in 2019. The racial makeup of the community is predominantly white (83.3%), followed by Hispanic or Latino (10.2%), African American (3.7%), and Asian (2.8%). The median household income in the area is $50,945, and the median home value is $133,400.
Conclusion
Jones Creek is a small unincorporated community located in Brazoria County, Texas. It is situated about 25 miles south of Houston and is part of the Houston–The Woodlands–Sugar Land metropolitan area. The population of Jones Creek was estimated to be 1,845 in 2019. The economy of Jones Creek is primarily based on agriculture and oil production, and the racial makeup of the community is predominantly white. The median household income in the area is $50,945, and the median home value is $133,400.
Common Questions
What is Per Capita Income in Jones Creek?
Per Capita income in Jones Creek is $27,554.
What is the Median Family Income in Jones Creek?
Median Family Income in Jones Creek is $85,625.
What is the Median Household income in Jones Creek?
Median Household Income in Jones Creek is $71,136.
What is Income or Wage Gap in Jones Creek?
Income or Wage Gap in Jones Creek is 51.2%.
Women in Jones Creek earn 48.8 cents for every dollar earned by a man.
What is Inequality or Gini Index in Jones Creek?
Inequality or Gini Index in Jones Creek is 0.40.
What is the Total Population of Jones Creek?
Total Population of Jones Creek is 1,936.
What is the Total Male Population of Jones Creek?
Total Male Population of Jones Creek is 919.
What is the Total Female Population of Jones Creek?
Total Female Population of Jones Creek is 1,017.
What is the Ratio of Males per 100 Females in Jones Creek?
There are 90.36 Males per 100 Females in Jones Creek.
What is the Ratio of Females per 100 Males in Jones Creek?
There are 110.66 Females per 100 Males in Jones Creek.
What is the Median Population Age in Jones Creek?
Median Population Age in Jones Creek is 34.7 Years.
What is the Average Family Size in Jones Creek
Average Family Size in Jones Creek is 3.2 People.
What is the Average Household Size in Jones Creek
Average Household Size in Jones Creek is 2.9 People.
How Large is the Labor Force in Jones Creek?
There are 787 People in the Labor Forcein in Jones Creek.
What is the Percentage of People in the Labor Force in Jones Creek?
52.8% of People are in the Labor Force in Jones Creek.
What is the Unemployment Rate in Jones Creek?
Unemployment Rate in Jones Creek is 4.2%.