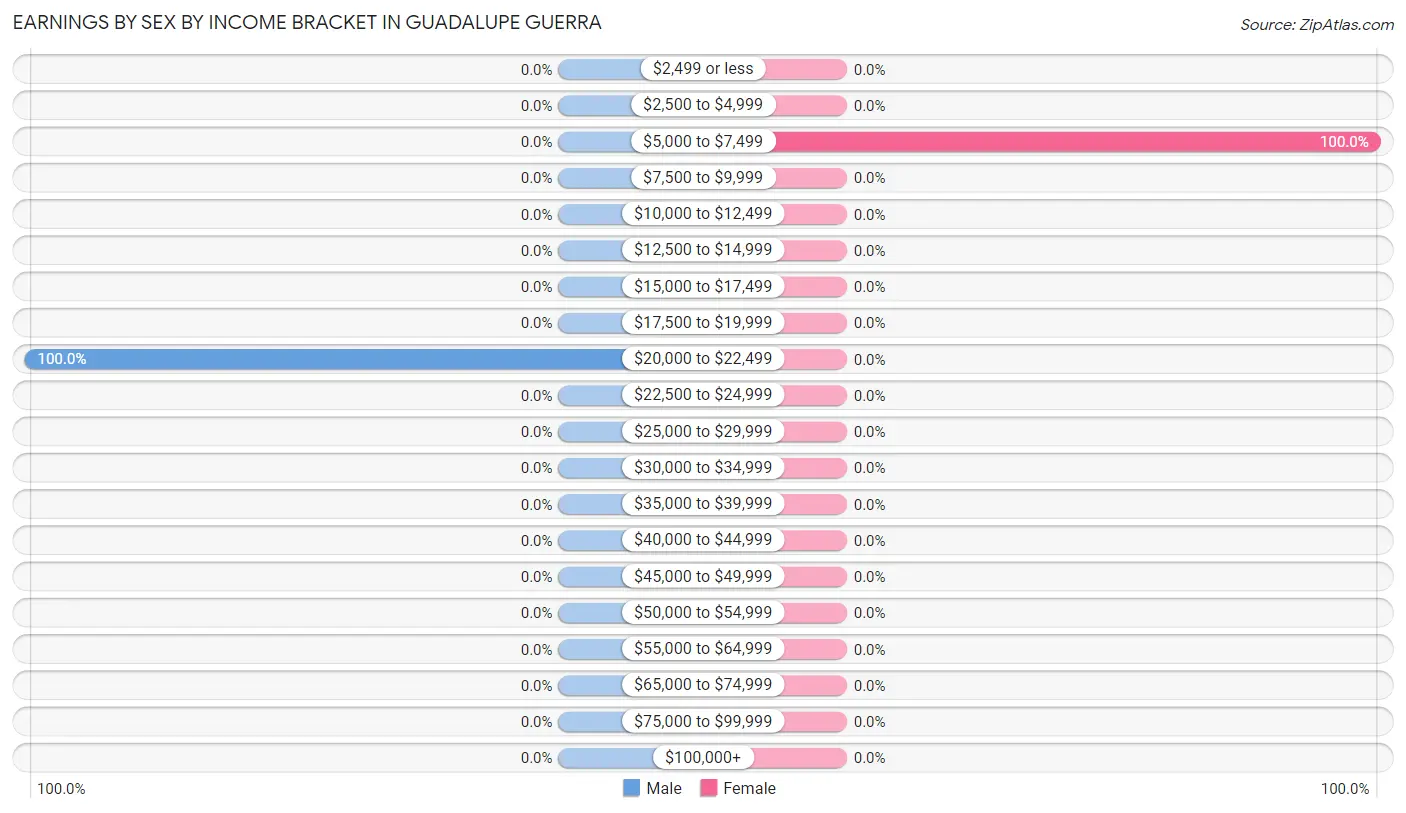
Earnings by Sex by Income Bracket in Guadalupe Guerra
The most common earnings brackets in Guadalupe Guerra are $20,000 to $22,499 for men (16 | 100.0%) and $5,000 to $7,499 for women (17 | 100.0%).
Income
Male
Female
$2,499 or less
0 (0.0%)
0 (0.0%)
$2,500 to $4,999
0 (0.0%)
0 (0.0%)
$5,000 to $7,499
0 (0.0%)
17 (100.0%)
$7,500 to $9,999
0 (0.0%)
0 (0.0%)
$10,000 to $12,499
0 (0.0%)
0 (0.0%)
$12,500 to $14,999
0 (0.0%)
0 (0.0%)
$15,000 to $17,499
0 (0.0%)
0 (0.0%)
$17,500 to $19,999
0 (0.0%)
0 (0.0%)
$20,000 to $22,499
16 (100.0%)
0 (0.0%)
$22,500 to $24,999
0 (0.0%)
0 (0.0%)
$25,000 to $29,999
0 (0.0%)
0 (0.0%)
$30,000 to $34,999
0 (0.0%)
0 (0.0%)
$35,000 to $39,999
0 (0.0%)
0 (0.0%)
$40,000 to $44,999
0 (0.0%)
0 (0.0%)
$45,000 to $49,999
0 (0.0%)
0 (0.0%)
$50,000 to $54,999
0 (0.0%)
0 (0.0%)
$55,000 to $64,999
0 (0.0%)
0 (0.0%)
$65,000 to $74,999
0 (0.0%)
0 (0.0%)
$75,000 to $99,999
0 (0.0%)
0 (0.0%)
$100,000+
0 (0.0%)
0 (0.0%)
Total
16 (100.0%)
17 (100.0%)
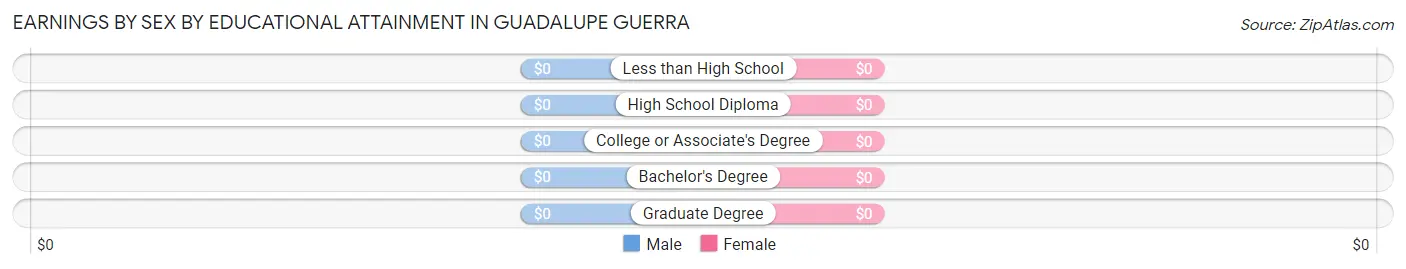
Earnings by Sex by Educational Attainment in Guadalupe Guerra
Educational Attainment
Male Income
Female Income
Less than High School
-
-
High School Diploma
-
-
College or Associate's Degree
-
-
Bachelor's Degree
-
-
Graduate Degree
-
-
Total
-
-
Family Income in Guadalupe Guerra
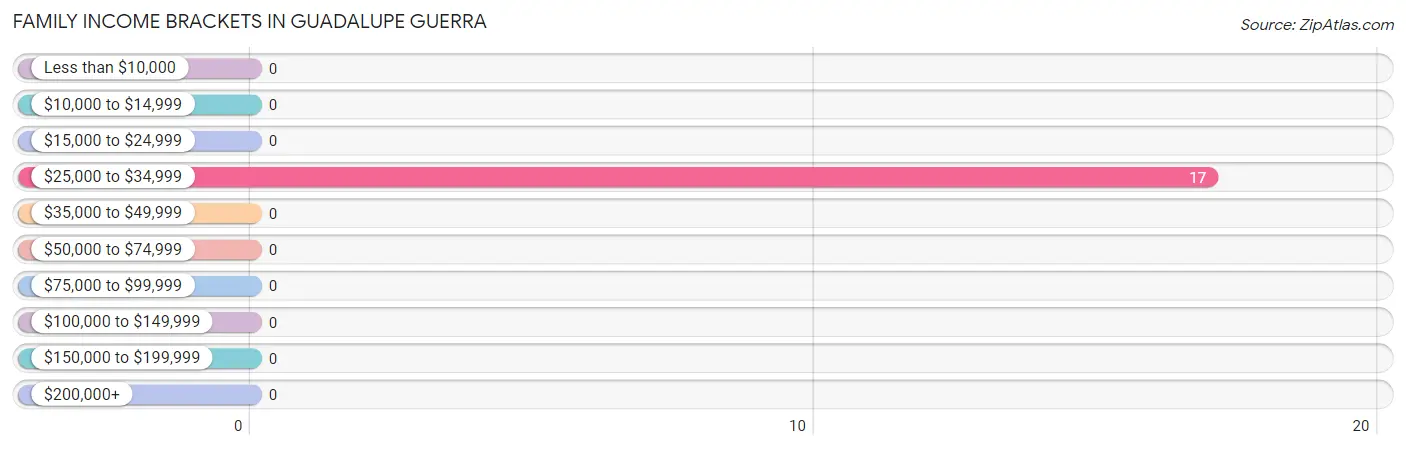
Family Income Brackets in Guadalupe Guerra
According to the Guadalupe Guerra family income data, there are 17 families falling into the $25,000 to $34,999 income range, which is the most common income bracket and makes up 100.0% of all families.
Income Bracket
# Families
% Families
Less than $10,000
0
0.0%
$10,000 to $14,999
0
0.0%
$15,000 to $24,999
0
0.0%
$25,000 to $34,999
17
100.0%
$35,000 to $49,999
0
0.0%
$50,000 to $74,999
0
0.0%
$75,000 to $99,999
0
0.0%
$100,000 to $149,999
0
0.0%
$150,000 to $199,999
0
0.0%
$200,000+
0
0.0%
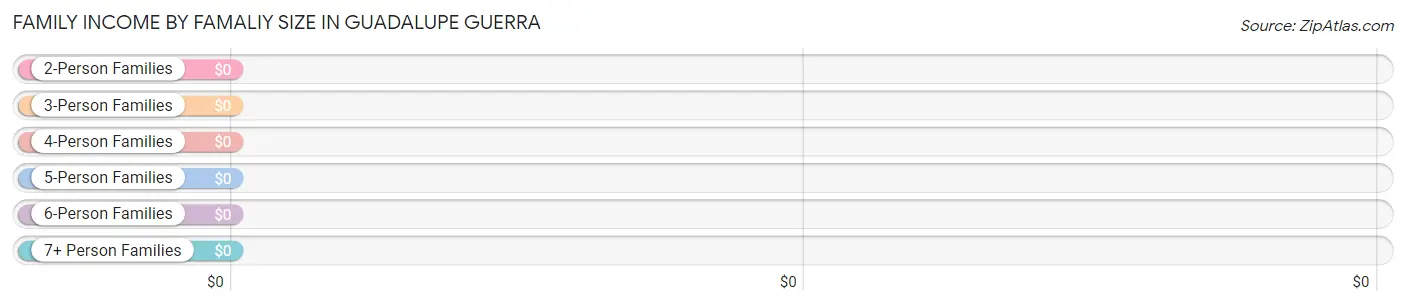
Family Income by Famaliy Size in Guadalupe Guerra
Income Bracket
# Families
Median Income
2-Person Families
0 (0.0%)
$0
3-Person Families
17 (100.0%)
$0
4-Person Families
0 (0.0%)
$0
5-Person Families
0 (0.0%)
$0
6-Person Families
0 (0.0%)
$0
7+ Person Families
0 (0.0%)
$0
Total
17 (100.0%)
$0
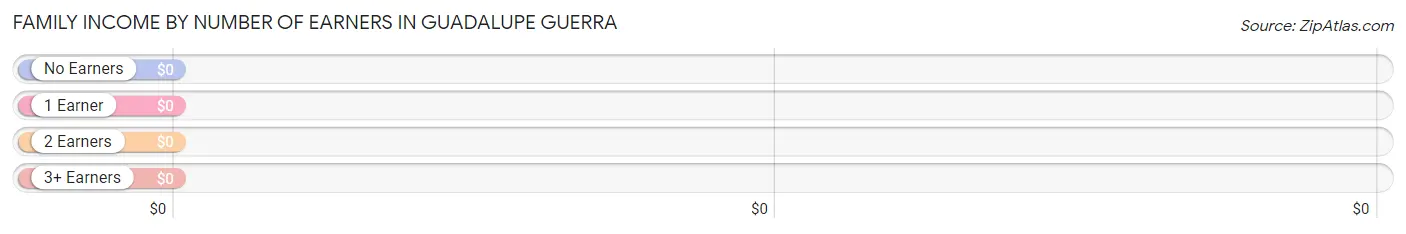
Family Income by Number of Earners in Guadalupe Guerra
Number of Earners
# Families
Median Income
No Earners
0 (0.0%)
$0
1 Earner
0 (0.0%)
$0
2 Earners
17 (100.0%)
$0
3+ Earners
0 (0.0%)
$0
Total
17 (100.0%)
$0
Household Income in Guadalupe Guerra
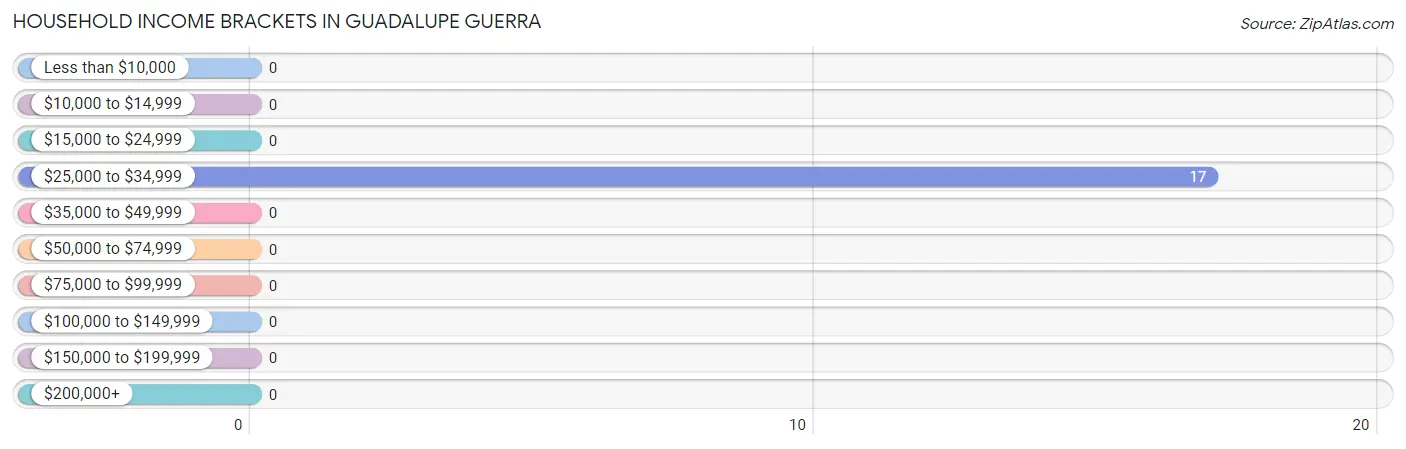
Household Income Brackets in Guadalupe Guerra
With 17 households falling in the category, the $25,000 to $34,999 income range is the most frequent in Guadalupe Guerra, accounting for 100.0% of all households.
Income Bracket
# Households
% Households
Less than $10,000
0
0.0%
$10,000 to $14,999
0
0.0%
$15,000 to $24,999
0
0.0%
$25,000 to $34,999
17
100.0%
$35,000 to $49,999
0
0.0%
$50,000 to $74,999
0
0.0%
$75,000 to $99,999
0
0.0%
$100,000 to $149,999
0
0.0%
$150,000 to $199,999
0
0.0%
$200,000+
0
0.0%
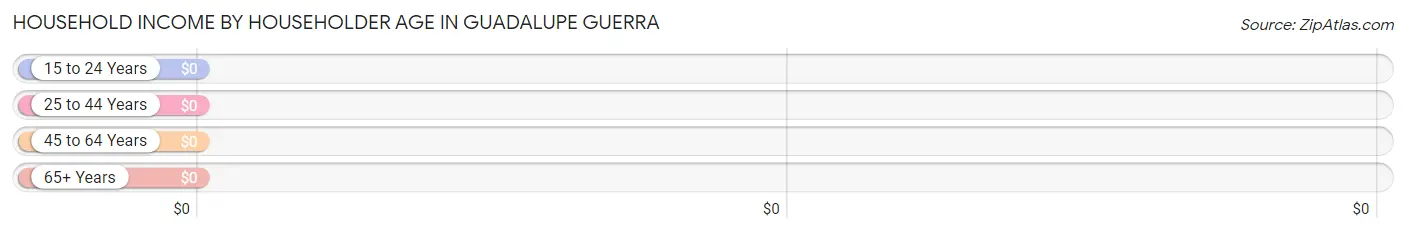
Household Income by Householder Age in Guadalupe Guerra
Income Bracket
# Households
Median Income
15 to 24 Years
0 (0.0%)
$0
25 to 44 Years
17 (100.0%)
$0
45 to 64 Years
0 (0.0%)
$0
65+ Years
0 (0.0%)
$0
Total
17 (100.0%)
$0
Poverty in Guadalupe Guerra
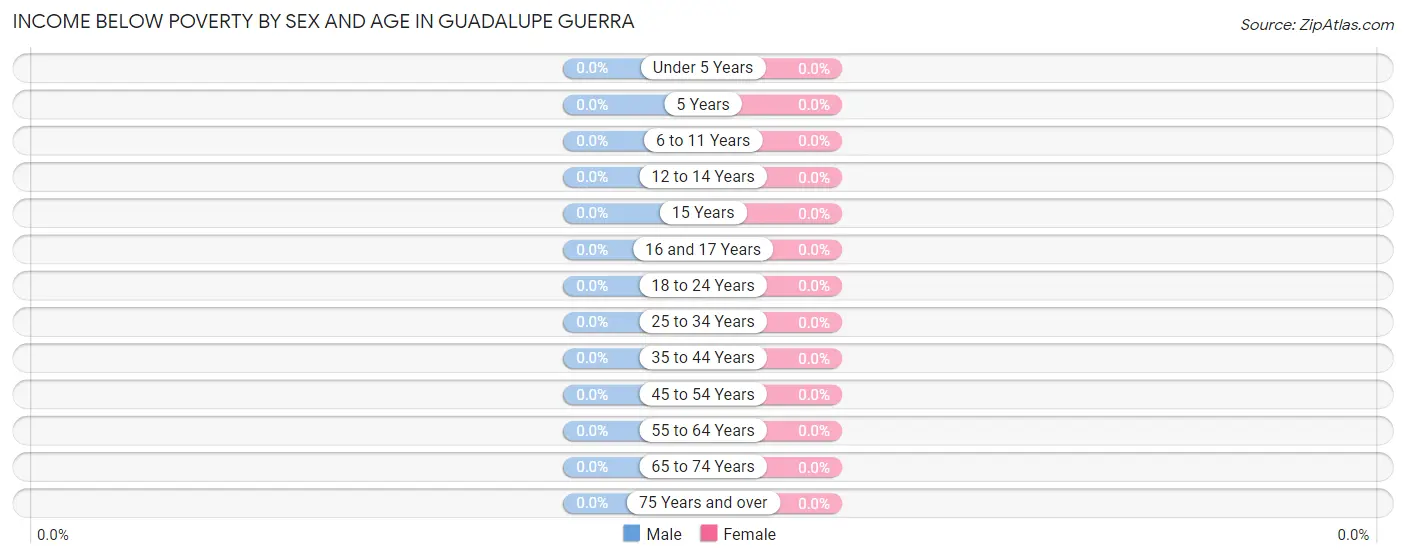
Income Below Poverty by Sex and Age in Guadalupe Guerra
Age Bracket
Male
Female
Under 5 Years
0 (0.0%)
0 (0.0%)
5 Years
0 (0.0%)
0 (0.0%)
6 to 11 Years
0 (0.0%)
0 (0.0%)
12 to 14 Years
0 (0.0%)
0 (0.0%)
15 Years
0 (0.0%)
0 (0.0%)
16 and 17 Years
0 (0.0%)
0 (0.0%)
18 to 24 Years
0 (0.0%)
0 (0.0%)
25 to 34 Years
0 (0.0%)
0 (0.0%)
35 to 44 Years
0 (0.0%)
0 (0.0%)
45 to 54 Years
0 (0.0%)
0 (0.0%)
55 to 64 Years
0 (0.0%)
0 (0.0%)
65 to 74 Years
0 (0.0%)
0 (0.0%)
75 Years and over
0 (0.0%)
0 (0.0%)
Total
0 (0.0%)
0 (0.0%)
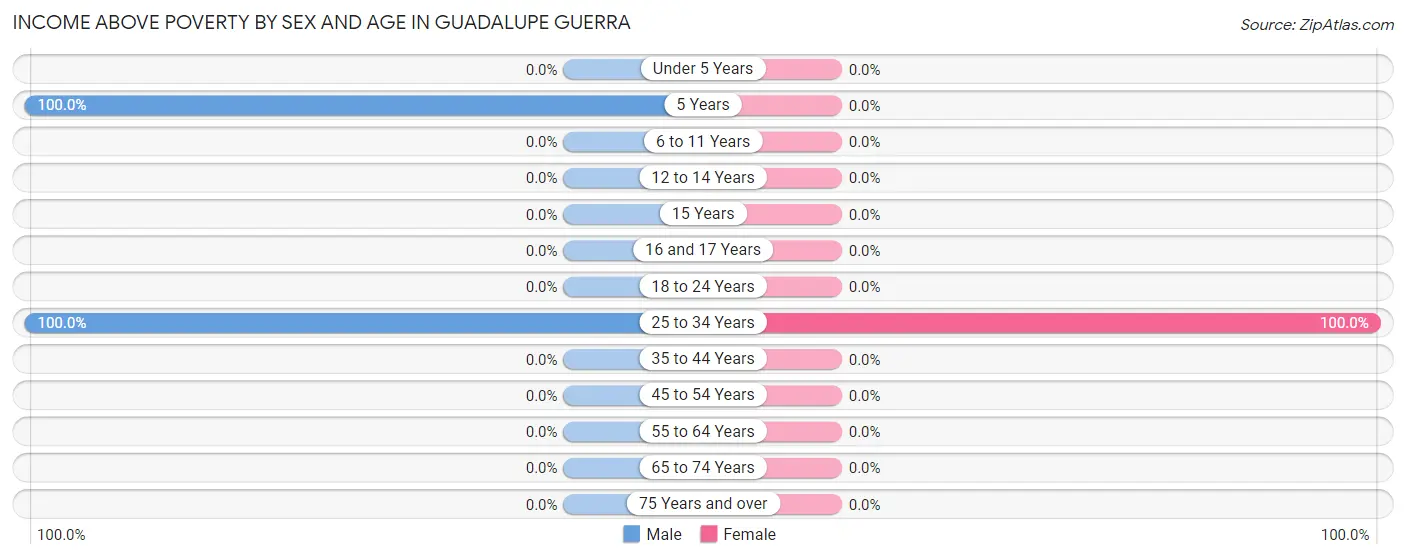
Income Above Poverty by Sex and Age in Guadalupe Guerra
According to the poverty statistics in Guadalupe Guerra, males aged 5 years and females aged 25 to 34 years are the age groups that are most secure financially, with 100.0% of males and 100.0% of females in these age groups living above the poverty line.
Age Bracket
Male
Female
Under 5 Years
0 (0.0%)
0 (0.0%)
5 Years
22 (100.0%)
0 (0.0%)
6 to 11 Years
0 (0.0%)
0 (0.0%)
12 to 14 Years
0 (0.0%)
0 (0.0%)
15 Years
0 (0.0%)
0 (0.0%)
16 and 17 Years
0 (0.0%)
0 (0.0%)
18 to 24 Years
0 (0.0%)
0 (0.0%)
25 to 34 Years
16 (100.0%)
17 (100.0%)
35 to 44 Years
0 (0.0%)
0 (0.0%)
45 to 54 Years
0 (0.0%)
0 (0.0%)
55 to 64 Years
0 (0.0%)
0 (0.0%)
65 to 74 Years
0 (0.0%)
0 (0.0%)
75 Years and over
0 (0.0%)
0 (0.0%)
Total
38 (100.0%)
17 (100.0%)
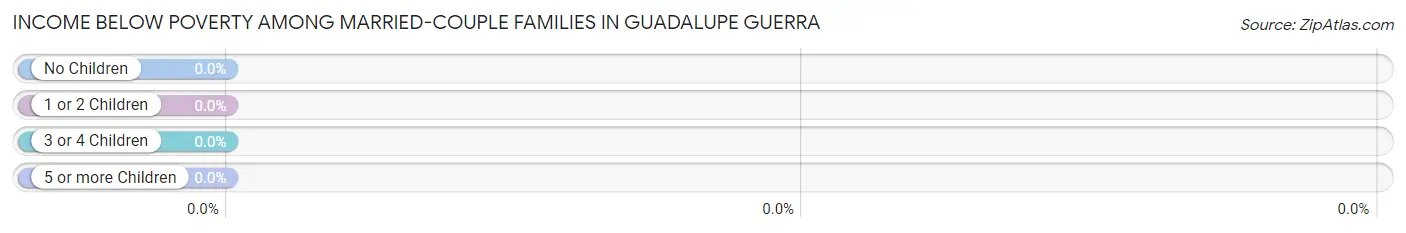
Income Below Poverty Among Married-Couple Families in Guadalupe Guerra
Children
Above Poverty
Below Poverty
No Children
0 (0.0%)
0 (0.0%)
1 or 2 Children
17 (100.0%)
0 (0.0%)
3 or 4 Children
0 (0.0%)
0 (0.0%)
5 or more Children
0 (0.0%)
0 (0.0%)
Total
17 (100.0%)
0 (0.0%)
Income Below Poverty Among Single-Parent Households in Guadalupe Guerra
Children
Single Father
Single Mother
No Children
0 (0.0%)
0 (0.0%)
1 or 2 Children
0 (0.0%)
0 (0.0%)
3 or 4 Children
0 (0.0%)
0 (0.0%)
5 or more Children
0 (0.0%)
0 (0.0%)
Total
0 (0.0%)
0 (0.0%)
Income Below Poverty Among Married-Couple vs Single-Parent Households in Guadalupe Guerra
Children
Married-Couple Families
Single-Parent Households
No Children
0 (0.0%)
0 (0.0%)
1 or 2 Children
0 (0.0%)
0 (0.0%)
3 or 4 Children
0 (0.0%)
0 (0.0%)
5 or more Children
0 (0.0%)
0 (0.0%)
Total
0 (0.0%)
0 (0.0%)
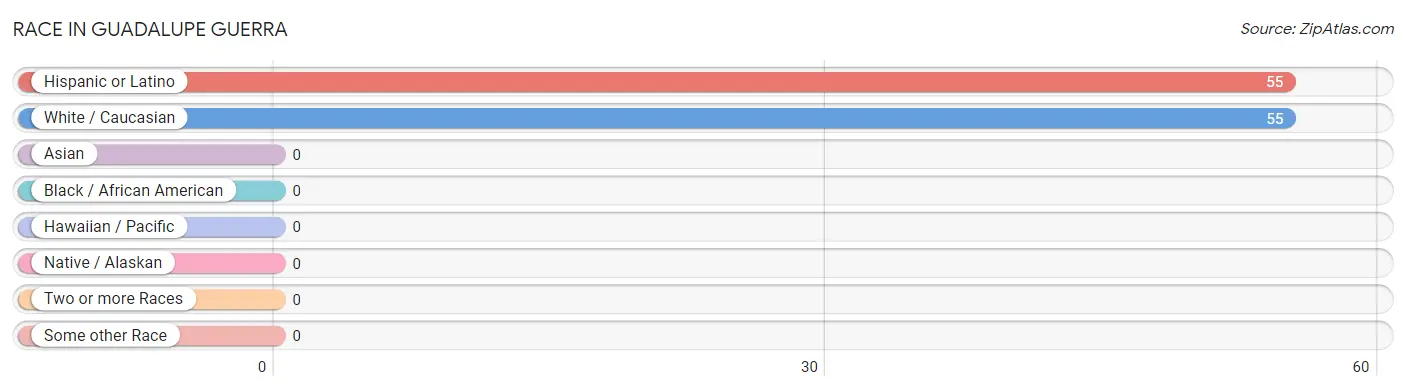
Race in Guadalupe Guerra
The most populous races in Guadalupe Guerra are Hispanic or Latino (55 | 100.0%), and White / Caucasian (55 | 100.0%).
Race
# Population
% Population
Asian
0
0.0%
Black / African American
0
0.0%
Hawaiian / Pacific
0
0.0%
Hispanic or Latino
55
100.0%
Native / Alaskan
0
0.0%
White / Caucasian
55
100.0%
Two or more Races
0
0.0%
Some other Race
0
0.0%
Total
55
100.0%
Ancestry in Guadalupe Guerra
The most populous ancestries reported in Guadalupe Guerra are , and Mexican (55 | 100.0%), together accounting for 100.0% of all Guadalupe Guerra residents.
Ancestry
# Population
% Population
Mexican
55
100.0%
View All 1 Rows
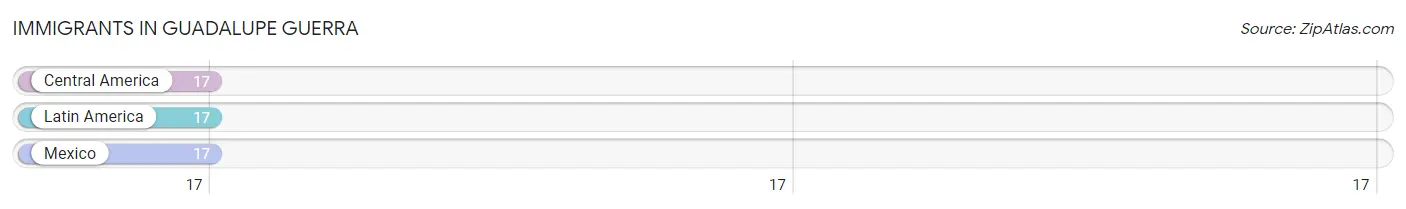
Immigrants in Guadalupe Guerra
The most numerous immigrant groups reported in Guadalupe Guerra came from Central America (17 | 30.9%), Latin America (17 | 30.9%), and Mexico (17 | 30.9%), together accounting for 92.7% of all Guadalupe Guerra residents.
Immigration Origin
# Population
% Population
Central America
17
30.9%
Latin America
17
30.9%
Mexico
17
30.9%
View All 3 Rows
Sex and Age in Guadalupe Guerra
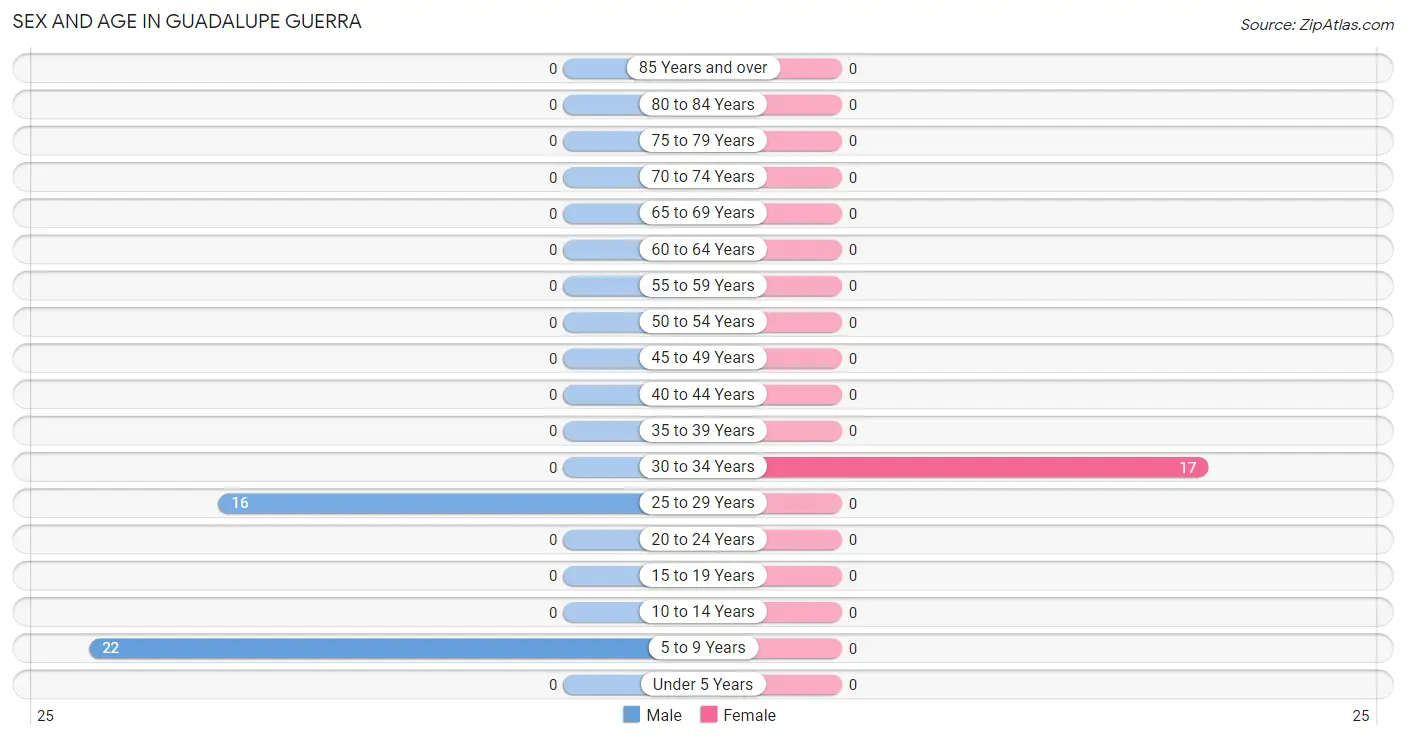
Sex and Age in Guadalupe Guerra
The most populous age groups in Guadalupe Guerra are 5 to 9 Years (22 | 57.9%) for men and 30 to 34 Years (17 | 100.0%) for women.
Age Bracket
Male
Female
Under 5 Years
0 (0.0%)
0 (0.0%)
5 to 9 Years
22 (57.9%)
0 (0.0%)
10 to 14 Years
0 (0.0%)
0 (0.0%)
15 to 19 Years
0 (0.0%)
0 (0.0%)
20 to 24 Years
0 (0.0%)
0 (0.0%)
25 to 29 Years
16 (42.1%)
0 (0.0%)
30 to 34 Years
0 (0.0%)
17 (100.0%)
35 to 39 Years
0 (0.0%)
0 (0.0%)
40 to 44 Years
0 (0.0%)
0 (0.0%)
45 to 49 Years
0 (0.0%)
0 (0.0%)
50 to 54 Years
0 (0.0%)
0 (0.0%)
55 to 59 Years
0 (0.0%)
0 (0.0%)
60 to 64 Years
0 (0.0%)
0 (0.0%)
65 to 69 Years
0 (0.0%)
0 (0.0%)
70 to 74 Years
0 (0.0%)
0 (0.0%)
75 to 79 Years
0 (0.0%)
0 (0.0%)
80 to 84 Years
0 (0.0%)
0 (0.0%)
85 Years and over
0 (0.0%)
0 (0.0%)
Total
38 (100.0%)
17 (100.0%)
Families and Households in Guadalupe Guerra
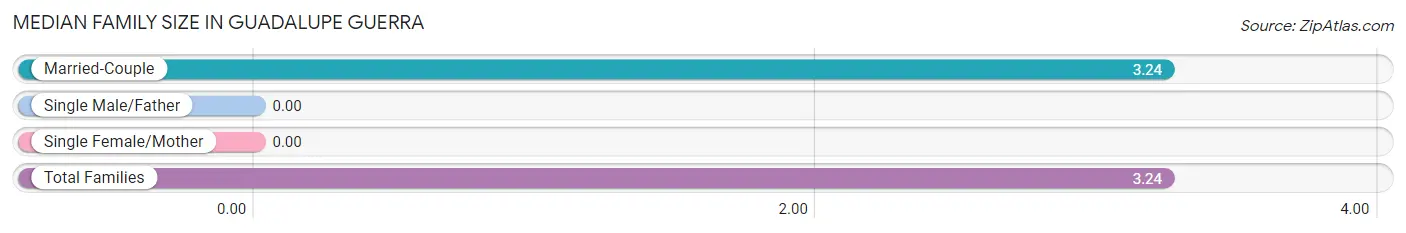
Median Family Size in Guadalupe Guerra
Family Type
# Families
Family Size
Married-Couple
17 (100.0%)
3.24
Single Male/Father
0 (0.0%)
-
Single Female/Mother
0 (0.0%)
-
Total Families
17 (100.0%)
3.24
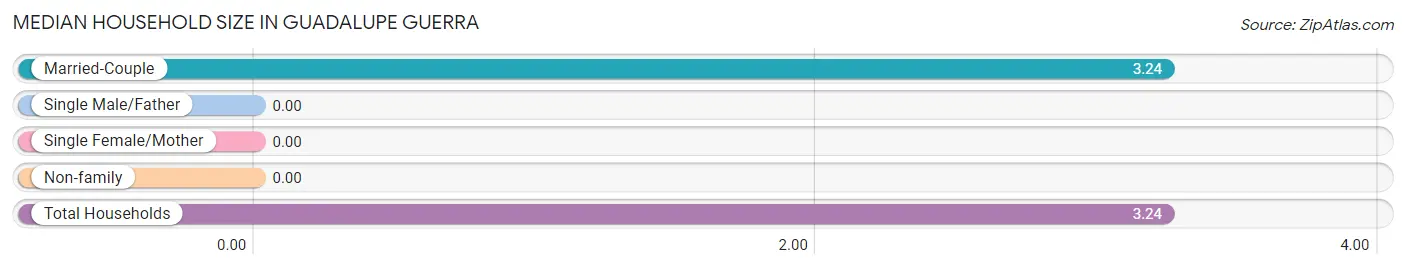
Median Household Size in Guadalupe Guerra
Household Type
# Households
Household Size
Married-Couple
17 (100.0%)
3.24
Single Male/Father
0 (0.0%)
-
Single Female/Mother
0 (0.0%)
-
Non-family
0 (0.0%)
-
Total Households
17 (100.0%)
3.24
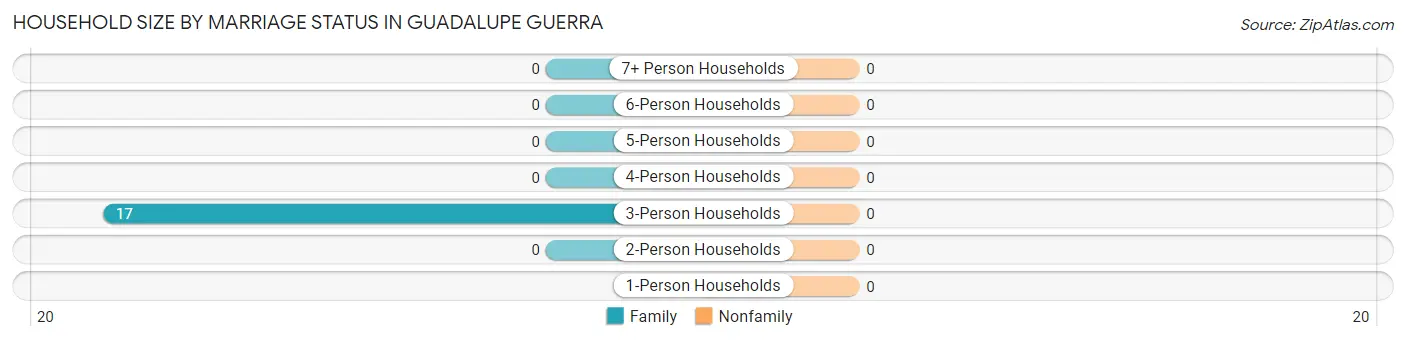
Household Size by Marriage Status in Guadalupe Guerra
Household Size
Family Households
Nonfamily Households
1-Person Households
-
0 (0.0%)
2-Person Households
0 (0.0%)
0 (0.0%)
3-Person Households
17 (100.0%)
0 (0.0%)
4-Person Households
0 (0.0%)
0 (0.0%)
5-Person Households
0 (0.0%)
0 (0.0%)
6-Person Households
0 (0.0%)
0 (0.0%)
7+ Person Households
0 (0.0%)
0 (0.0%)
Total
17 (100.0%)
0 (0.0%)
Female Fertility in Guadalupe Guerra
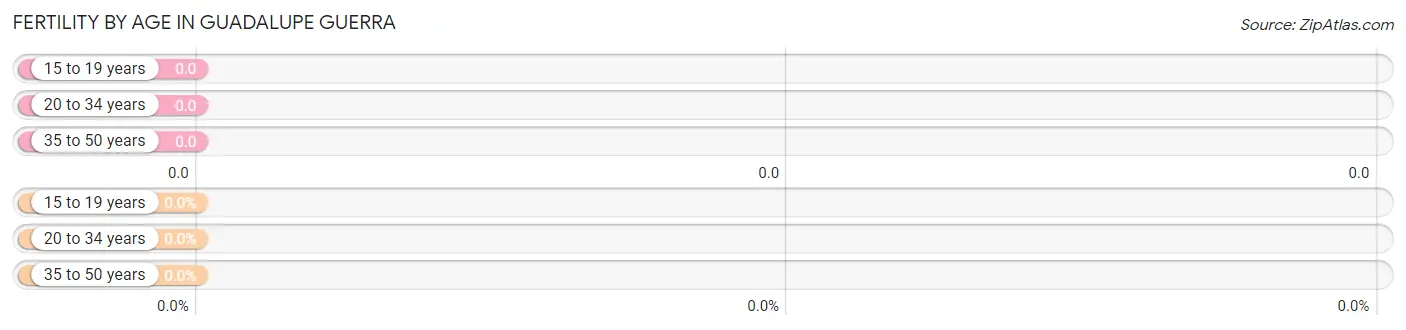
Fertility by Age in Guadalupe Guerra
Age Bracket
Women with Births
Births / 1,000 Women
15 to 19 years
0 (0.0%)
0.0
20 to 34 years
0 (0.0%)
0.0
35 to 50 years
0 (0.0%)
0.0
Total
0 (0.0%)
0.0
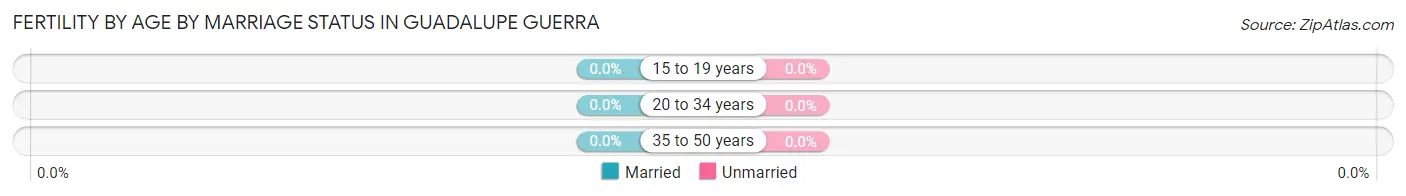
Fertility by Age by Marriage Status in Guadalupe Guerra
Age Bracket
Married
Unmarried
15 to 19 years
0 (0.0%)
0 (0.0%)
20 to 34 years
0 (0.0%)
0 (0.0%)
35 to 50 years
0 (0.0%)
0 (0.0%)
Total
0 (0.0%)
0 (0.0%)
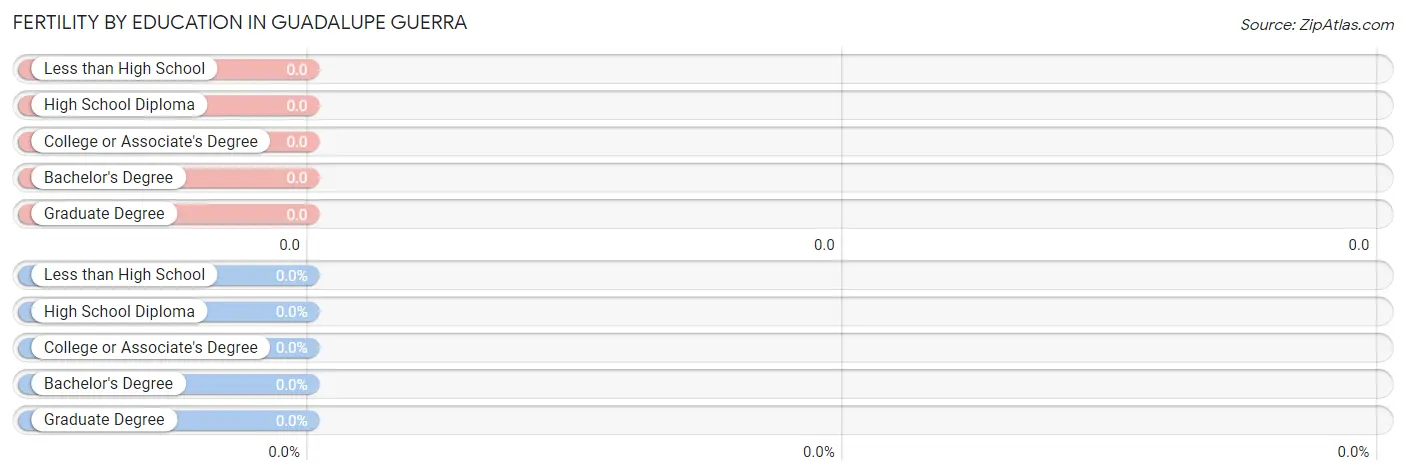
Fertility by Education in Guadalupe Guerra
Educational Attainment
Women with Births
Births / 1,000 Women
Less than High School
0 (0.0%)
0.0
High School Diploma
0 (0.0%)
0.0
College or Associate's Degree
0 (0.0%)
0.0
Bachelor's Degree
0 (0.0%)
0.0
Graduate Degree
0 (0.0%)
0.0
Total
0 (0.0%)
0.0
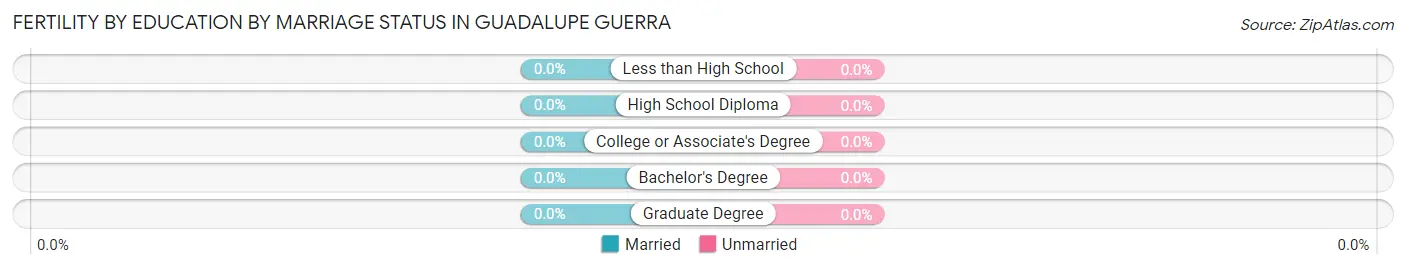
Fertility by Education by Marriage Status in Guadalupe Guerra
Educational Attainment
Married
Unmarried
Less than High School
0 (0.0%)
0 (0.0%)
High School Diploma
0 (0.0%)
0 (0.0%)
College or Associate's Degree
0 (0.0%)
0 (0.0%)
Bachelor's Degree
0 (0.0%)
0 (0.0%)
Graduate Degree
0 (0.0%)
0 (0.0%)
Total
0 (0.0%)
0 (0.0%)
Employment Characteristics in Guadalupe Guerra
Employment by Class of Employer in Guadalupe Guerra
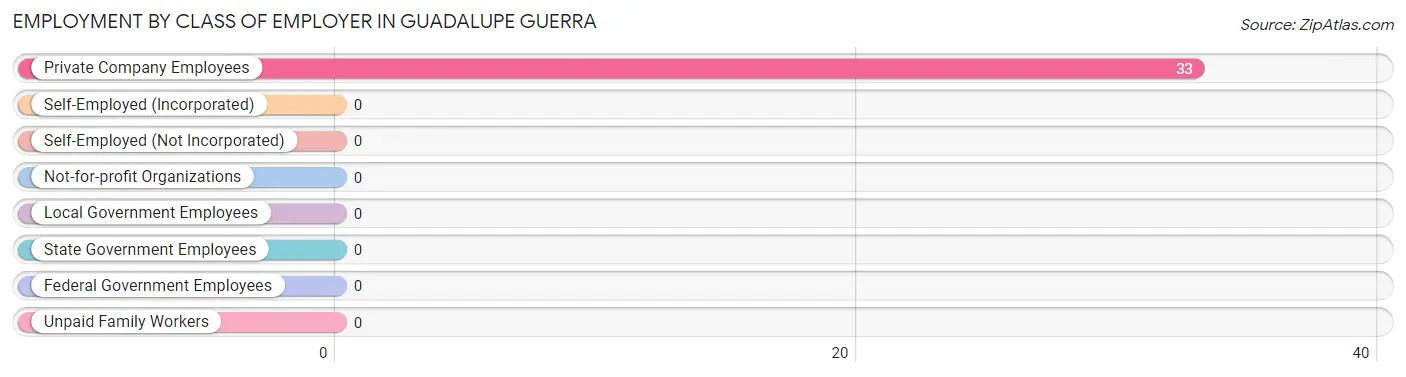
Among the 33 employed individuals in Guadalupe Guerra, , and private company employees (33 | 100.0%) make up the most common classes of employment.
Employer Class
# Employees
% Employees
Private Company Employees
33
100.0%
Self-Employed (Incorporated)
0
0.0%
Self-Employed (Not Incorporated)
0
0.0%
Not-for-profit Organizations
0
0.0%
Local Government Employees
0
0.0%
State Government Employees
0
0.0%
Federal Government Employees
0
0.0%
Unpaid Family Workers
0
0.0%
Total
33
100.0%
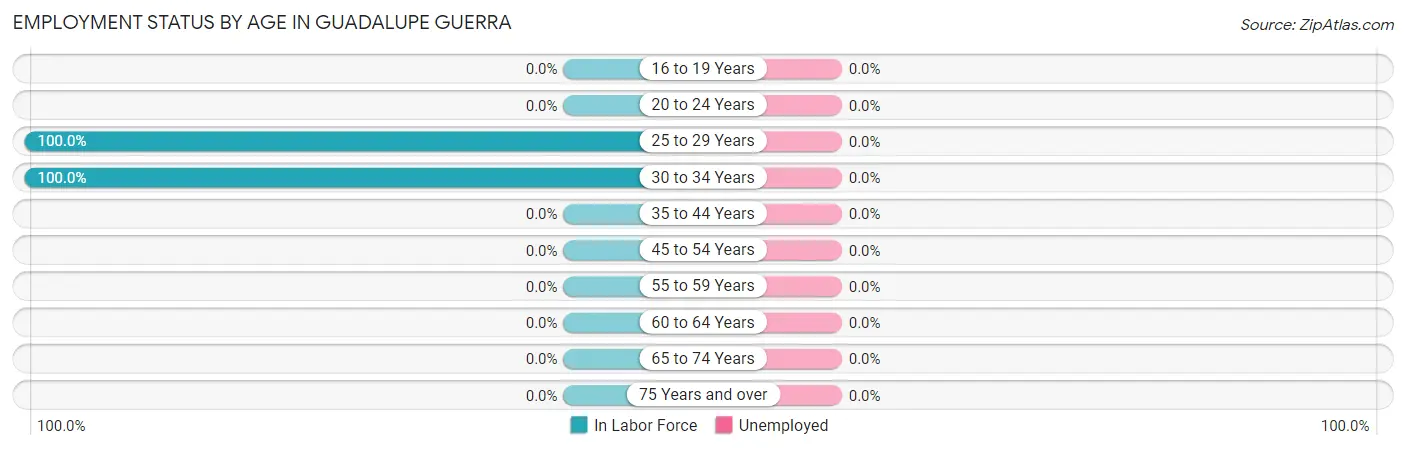
Employment Status by Age in Guadalupe Guerra
Age Bracket
In Labor Force
Unemployed
16 to 19 Years
0 (0.0%)
0 (0.0%)
20 to 24 Years
0 (0.0%)
0 (0.0%)
25 to 29 Years
16 (100.0%)
0 (0.0%)
30 to 34 Years
17 (100.0%)
0 (0.0%)
35 to 44 Years
0 (0.0%)
0 (0.0%)
45 to 54 Years
0 (0.0%)
0 (0.0%)
55 to 59 Years
0 (0.0%)
0 (0.0%)
60 to 64 Years
0 (0.0%)
0 (0.0%)
65 to 74 Years
0 (0.0%)
0 (0.0%)
75 Years and over
0 (0.0%)
0 (0.0%)
Total
33 (100.0%)
0 (0.0%)
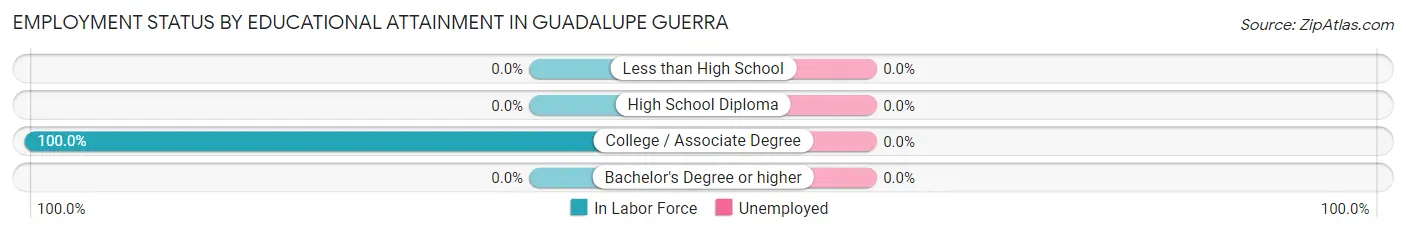
Employment Status by Educational Attainment in Guadalupe Guerra
Educational Attainment
In Labor Force
Unemployed
Less than High School
0 (0.0%)
0 (0.0%)
High School Diploma
0 (0.0%)
0 (0.0%)
College / Associate Degree
33 (100.0%)
0 (0.0%)
Bachelor's Degree or higher
0 (0.0%)
0 (0.0%)
Total
33 (100.0%)
0 (0.0%)
Employment Occupations by Sex in Guadalupe Guerra
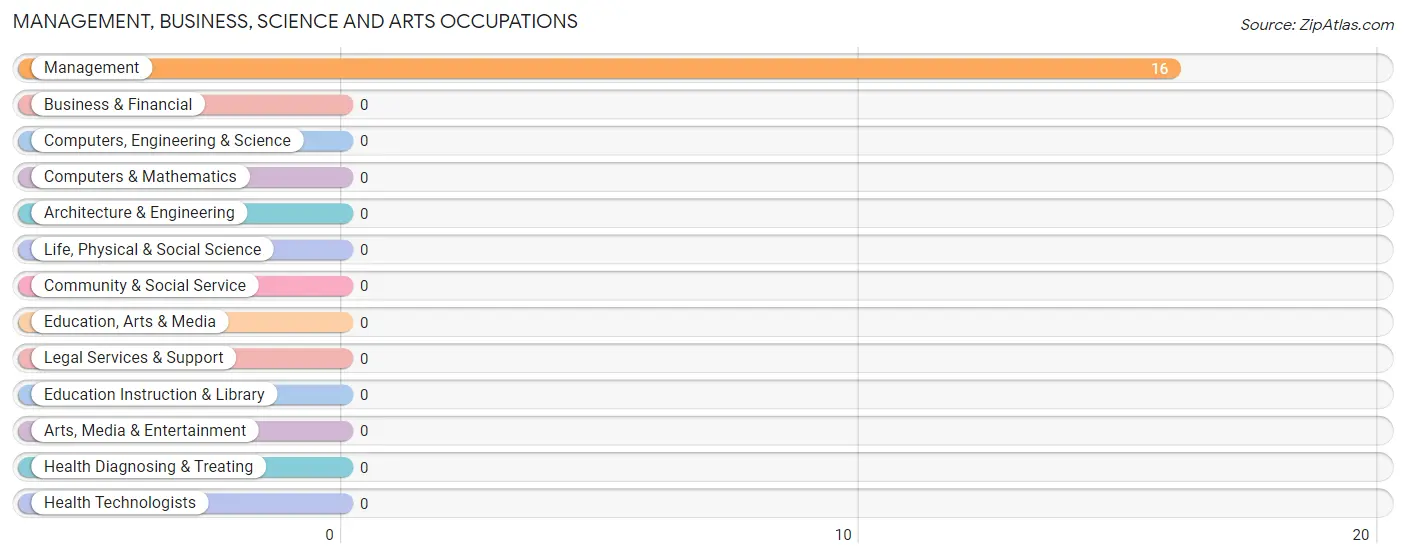
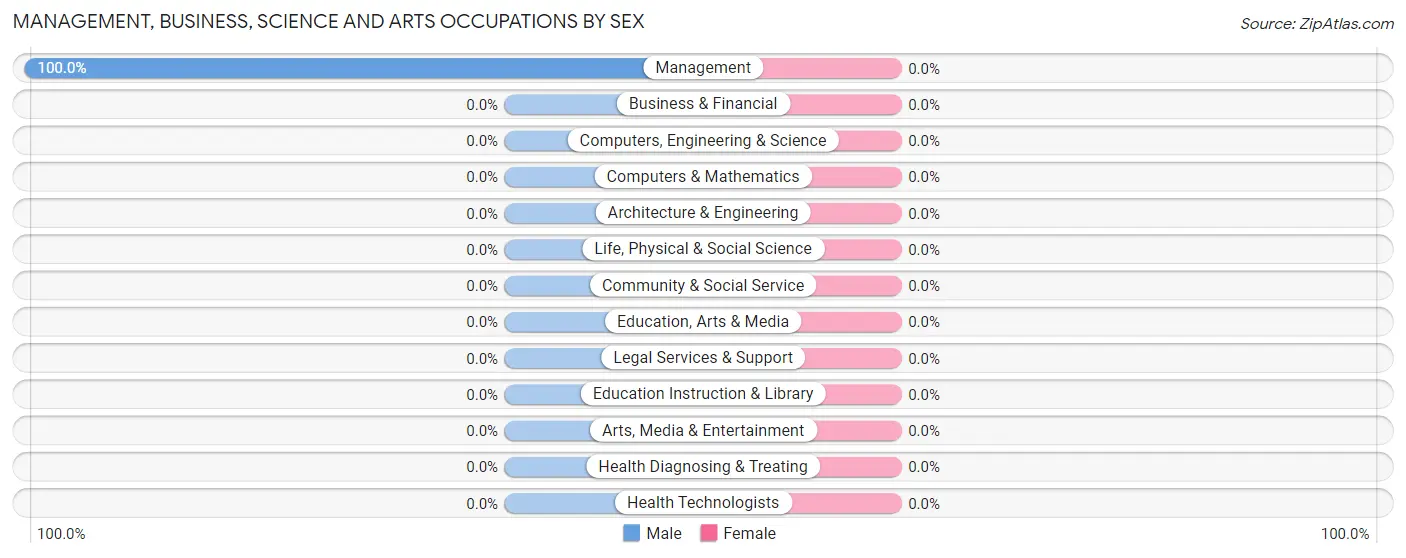
Management, Business, Science and Arts Occupations
The most common Management, Business, Science and Arts occupations in Guadalupe Guerra are , and Management (16 | 48.5%).
Management, Business, Science and Arts Occupations by Sex
Occupation
Male
Female
Management
16 (100.0%)
0 (0.0%)
Business & Financial
0 (0.0%)
0 (0.0%)
Computers, Engineering & Science
0 (0.0%)
0 (0.0%)
Computers & Mathematics
0 (0.0%)
0 (0.0%)
Architecture & Engineering
0 (0.0%)
0 (0.0%)
Life, Physical & Social Science
0 (0.0%)
0 (0.0%)
Community & Social Service
0 (0.0%)
0 (0.0%)
Education, Arts & Media
0 (0.0%)
0 (0.0%)
Legal Services & Support
0 (0.0%)
0 (0.0%)
Education Instruction & Library
0 (0.0%)
0 (0.0%)
Arts, Media & Entertainment
0 (0.0%)
0 (0.0%)
Health Diagnosing & Treating
0 (0.0%)
0 (0.0%)
Health Technologists
0 (0.0%)
0 (0.0%)
Total (Category)
16 (100.0%)
0 (0.0%)
Total (Overall)
16 (48.5%)
17 (51.5%)
Services Occupations
Services Occupations by Sex
Occupation
Male
Female
Healthcare Support
0 (0.0%)
0 (0.0%)
Security & Protection
0 (0.0%)
0 (0.0%)
Firefighting & Prevention
0 (0.0%)
0 (0.0%)
Law Enforcement
0 (0.0%)
0 (0.0%)
Food Preparation & Serving
0 (0.0%)
0 (0.0%)
Cleaning & Maintenance
0 (0.0%)
0 (0.0%)
Personal Care & Service
0 (0.0%)
0 (0.0%)
Total (Category)
0 (0.0%)
0 (0.0%)
Total (Overall)
16 (48.5%)
17 (51.5%)
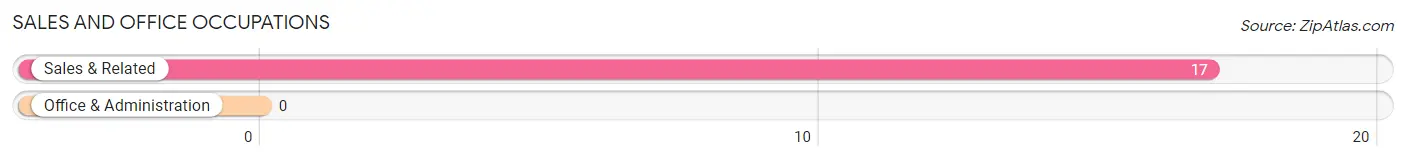
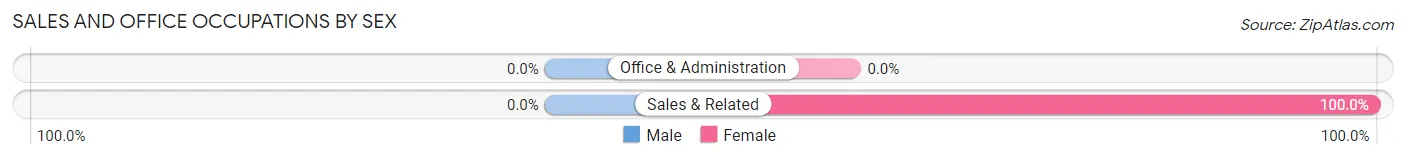
Sales and Office Occupations
The most common Sales and Office occupations in Guadalupe Guerra are , and Sales & Related (17 | 51.5%).
Sales and Office Occupations by Sex
Occupation
Male
Female
Sales & Related
0 (0.0%)
17 (100.0%)
Office & Administration
0 (0.0%)
0 (0.0%)
Total (Category)
0 (0.0%)
17 (100.0%)
Total (Overall)
16 (48.5%)
17 (51.5%)
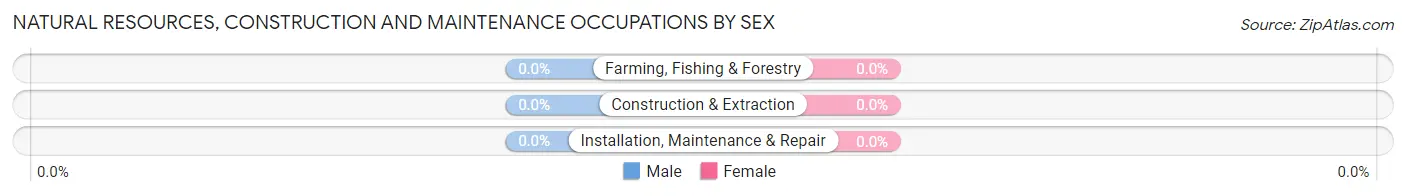
Natural Resources, Construction and Maintenance Occupations
Natural Resources, Construction and Maintenance Occupations by Sex
Occupation
Male
Female
Farming, Fishing & Forestry
0 (0.0%)
0 (0.0%)
Construction & Extraction
0 (0.0%)
0 (0.0%)
Installation, Maintenance & Repair
0 (0.0%)
0 (0.0%)
Total (Category)
0 (0.0%)
0 (0.0%)
Total (Overall)
16 (48.5%)
17 (51.5%)
Production, Transportation and Moving Occupations
Production, Transportation and Moving Occupations by Sex
Occupation
Male
Female
Production
0 (0.0%)
0 (0.0%)
Transportation
0 (0.0%)
0 (0.0%)
Material Moving
0 (0.0%)
0 (0.0%)
Total (Category)
0 (0.0%)
0 (0.0%)
Total (Overall)
16 (48.5%)
17 (51.5%)
Employment Industries by Sex in Guadalupe Guerra
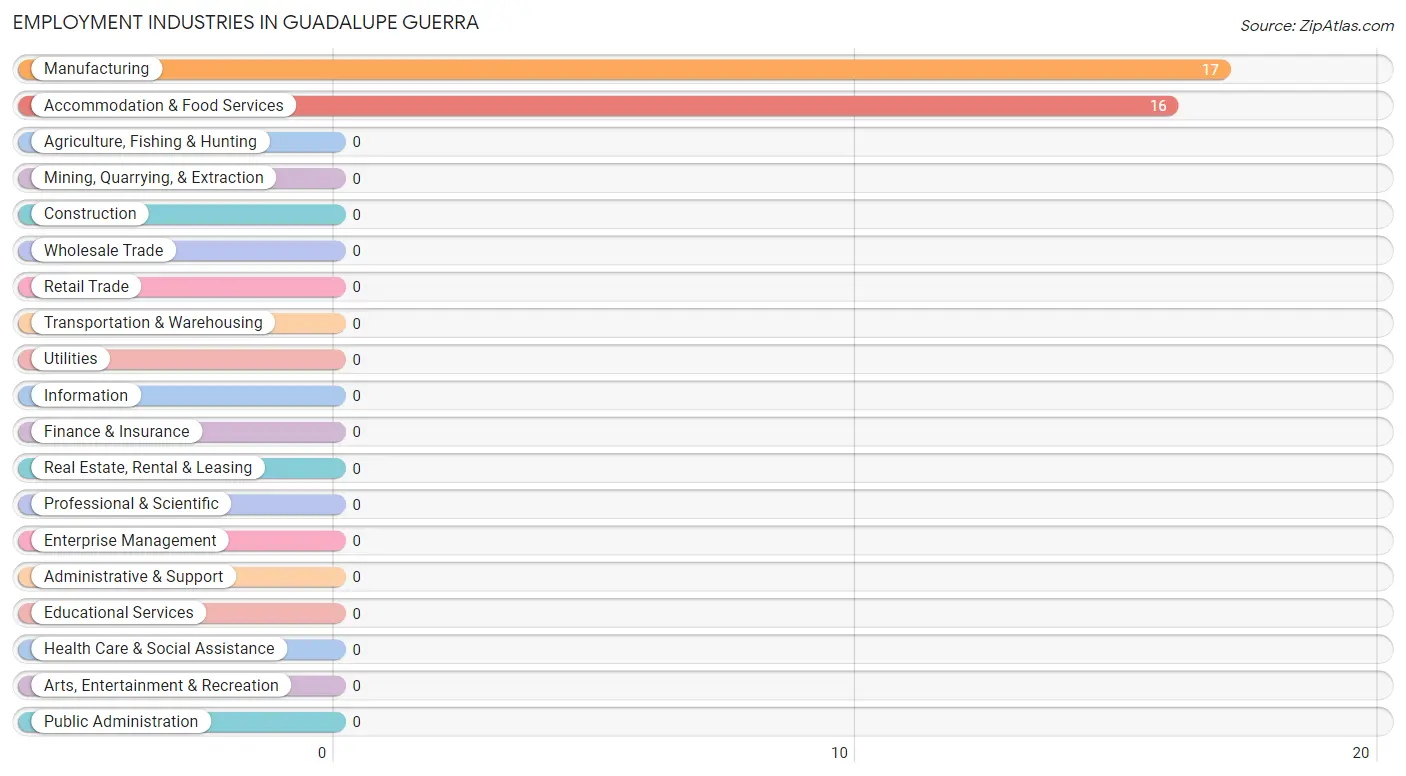
Employment Industries in Guadalupe Guerra
The major employment industries in Guadalupe Guerra include Manufacturing (17 | 51.5%), and Accommodation & Food Services (16 | 48.5%).
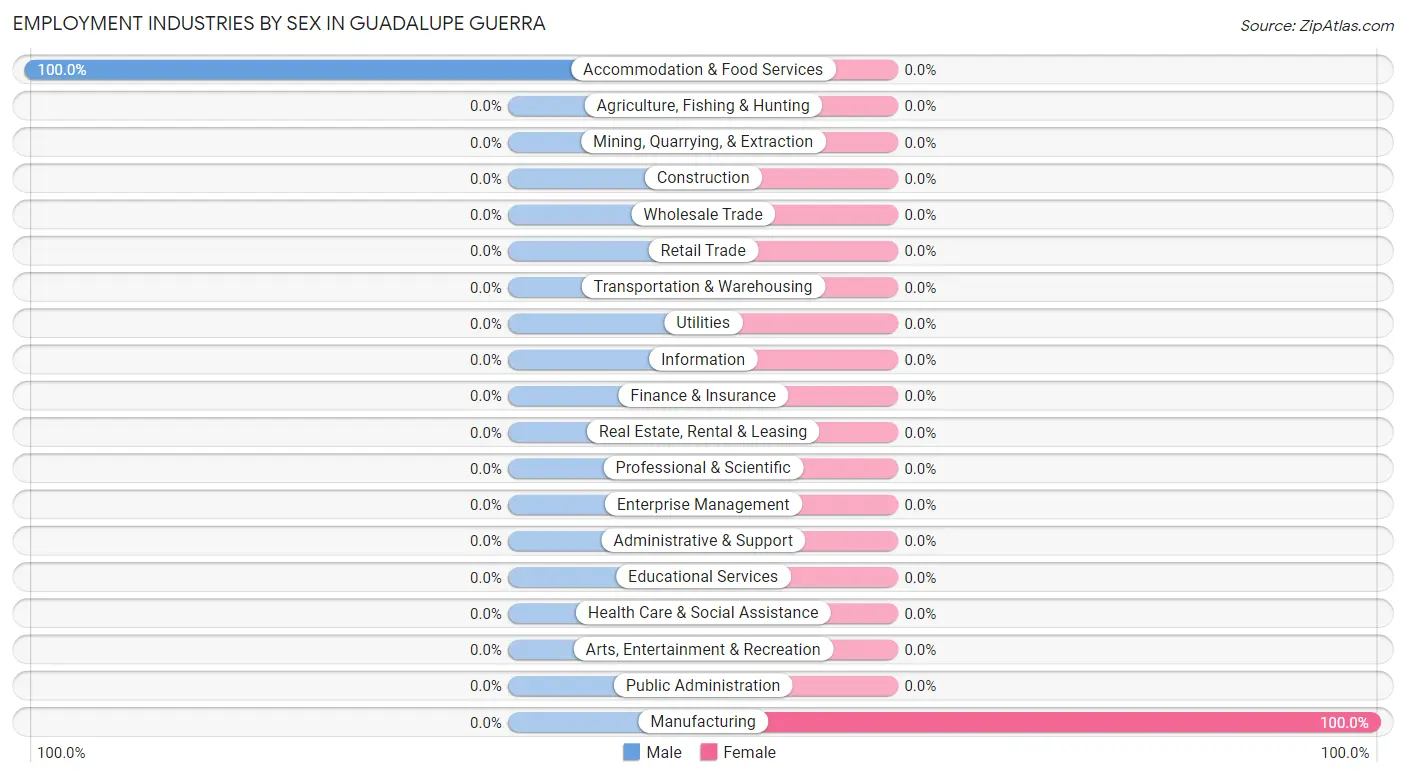
Employment Industries by Sex in Guadalupe Guerra
Industry
Male
Female
Agriculture, Fishing & Hunting
0 (0.0%)
0 (0.0%)
Mining, Quarrying, & Extraction
0 (0.0%)
0 (0.0%)
Construction
0 (0.0%)
0 (0.0%)
Manufacturing
0 (0.0%)
17 (100.0%)
Wholesale Trade
0 (0.0%)
0 (0.0%)
Retail Trade
0 (0.0%)
0 (0.0%)
Transportation & Warehousing
0 (0.0%)
0 (0.0%)
Utilities
0 (0.0%)
0 (0.0%)
Information
0 (0.0%)
0 (0.0%)
Finance & Insurance
0 (0.0%)
0 (0.0%)
Real Estate, Rental & Leasing
0 (0.0%)
0 (0.0%)
Professional & Scientific
0 (0.0%)
0 (0.0%)
Enterprise Management
0 (0.0%)
0 (0.0%)
Administrative & Support
0 (0.0%)
0 (0.0%)
Educational Services
0 (0.0%)
0 (0.0%)
Health Care & Social Assistance
0 (0.0%)
0 (0.0%)
Arts, Entertainment & Recreation
0 (0.0%)
0 (0.0%)
Accommodation & Food Services
16 (100.0%)
0 (0.0%)
Public Administration
0 (0.0%)
0 (0.0%)
Total
16 (48.5%)
17 (51.5%)
Education in Guadalupe Guerra
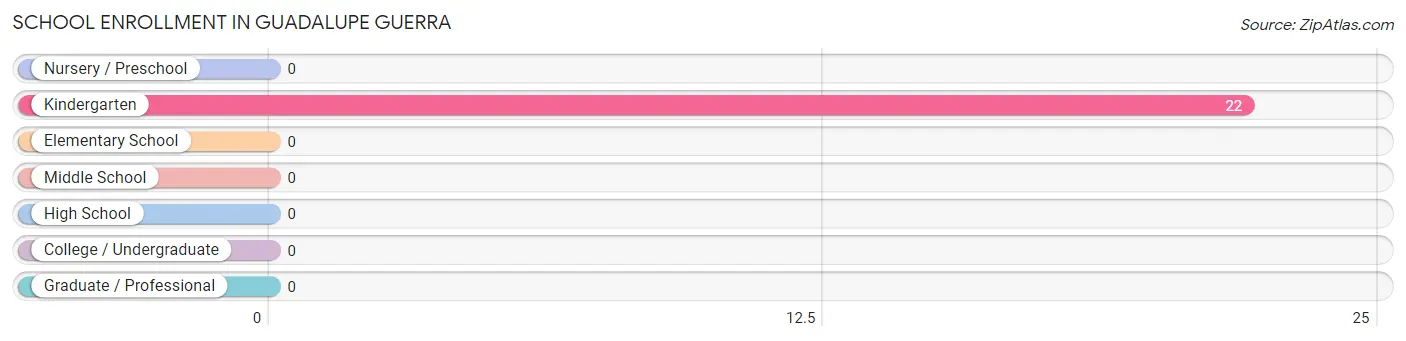
School Enrollment in Guadalupe Guerra
School Level
# Students
% Students
Nursery / Preschool
0
0.0%
Kindergarten
22
100.0%
Elementary School
0
0.0%
Middle School
0
0.0%
High School
0
0.0%
College / Undergraduate
0
0.0%
Graduate / Professional
0
0.0%
Total
22
100.0%
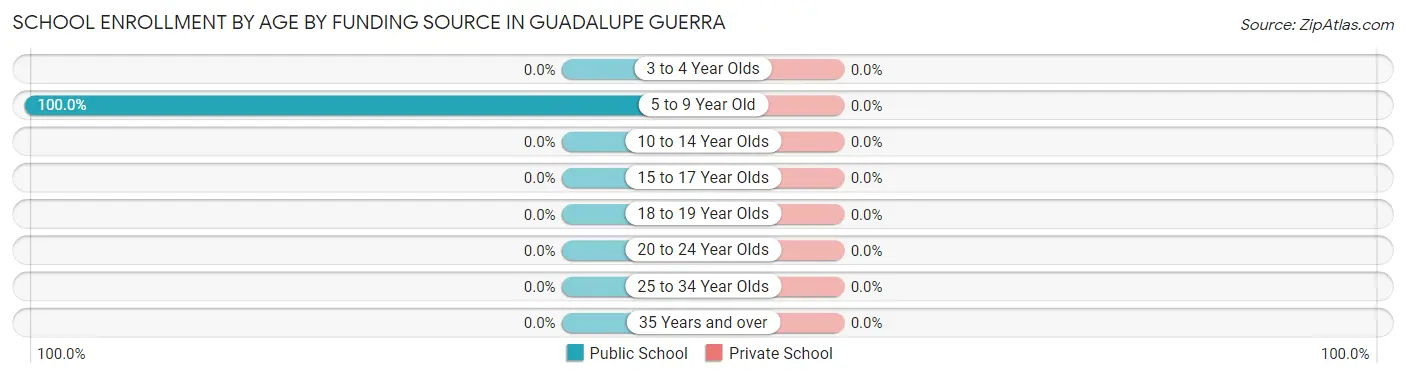
School Enrollment by Age by Funding Source in Guadalupe Guerra
Age Bracket
Public School
Private School
3 to 4 Year Olds
0 (0.0%)
0 (0.0%)
5 to 9 Year Old
22 (100.0%)
0 (0.0%)
10 to 14 Year Olds
0 (0.0%)
0 (0.0%)
15 to 17 Year Olds
0 (0.0%)
0 (0.0%)
18 to 19 Year Olds
0 (0.0%)
0 (0.0%)
20 to 24 Year Olds
0 (0.0%)
0 (0.0%)
25 to 34 Year Olds
0 (0.0%)
0 (0.0%)
35 Years and over
0 (0.0%)
0 (0.0%)
Total
22 (100.0%)
0 (0.0%)
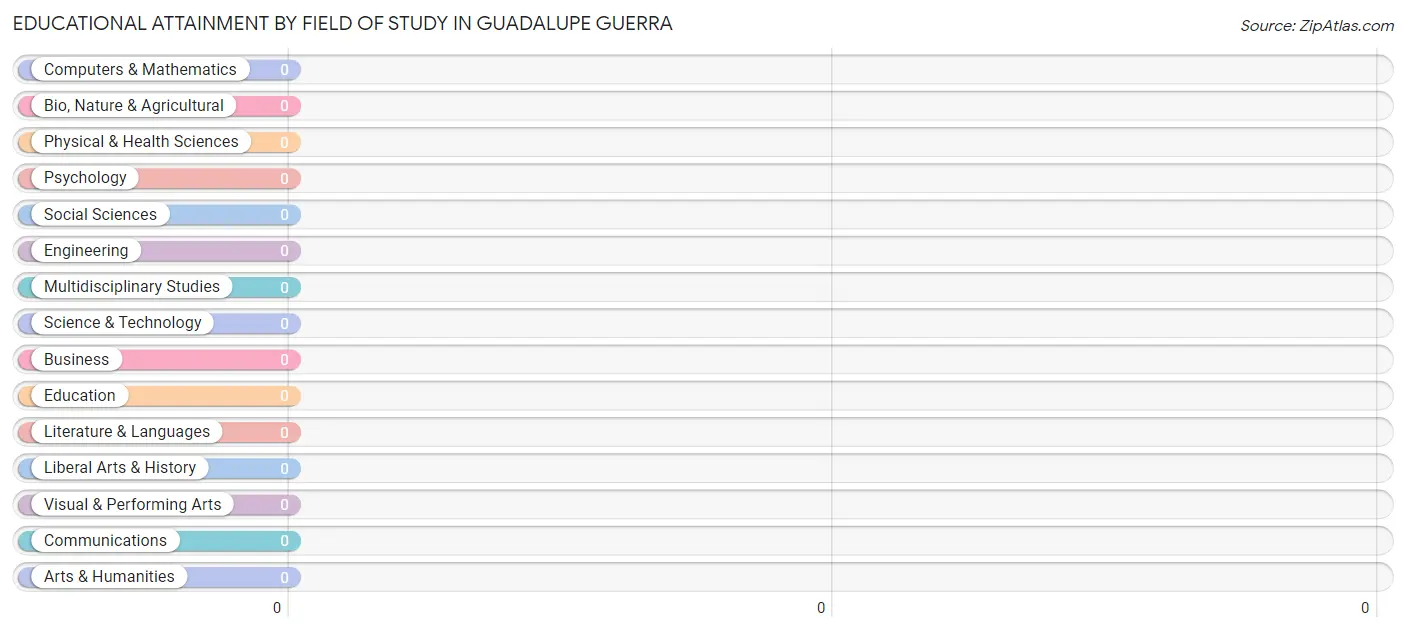
Educational Attainment by Field of Study in Guadalupe Guerra
Field of Study
# Graduates
% Graduates
Computers & Mathematics
0
0.0%
Bio, Nature & Agricultural
0
0.0%
Physical & Health Sciences
0
0.0%
Psychology
0
0.0%
Social Sciences
0
0.0%
Engineering
0
0.0%
Multidisciplinary Studies
0
0.0%
Science & Technology
0
0.0%
Business
0
0.0%
Education
0
0.0%
Literature & Languages
0
0.0%
Liberal Arts & History
0
0.0%
Visual & Performing Arts
0
0.0%
Communications
0
0.0%
Arts & Humanities
0
0.0%
Total
0
0.0%
Transportation & Commute in Guadalupe Guerra
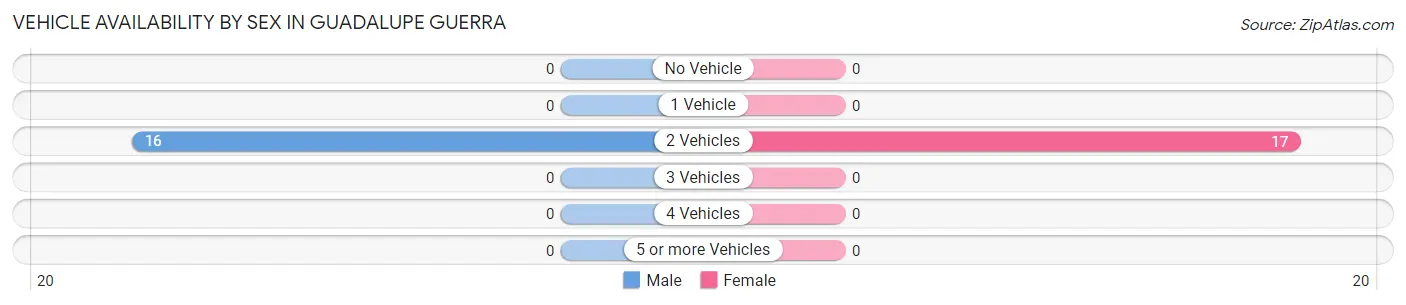
Vehicle Availability by Sex in Guadalupe Guerra
The most prevalent vehicle ownership categories in Guadalupe Guerra are males with 2 vehicles (16, accounting for 100.0%) and females with 2 vehicles (17, making up 94.1%).
Vehicles Available
Male
Female
No Vehicle
0 (0.0%)
0 (0.0%)
1 Vehicle
0 (0.0%)
0 (0.0%)
2 Vehicles
16 (100.0%)
17 (100.0%)
3 Vehicles
0 (0.0%)
0 (0.0%)
4 Vehicles
0 (0.0%)
0 (0.0%)
5 or more Vehicles
0 (0.0%)
0 (0.0%)
Total
16 (100.0%)
17 (100.0%)
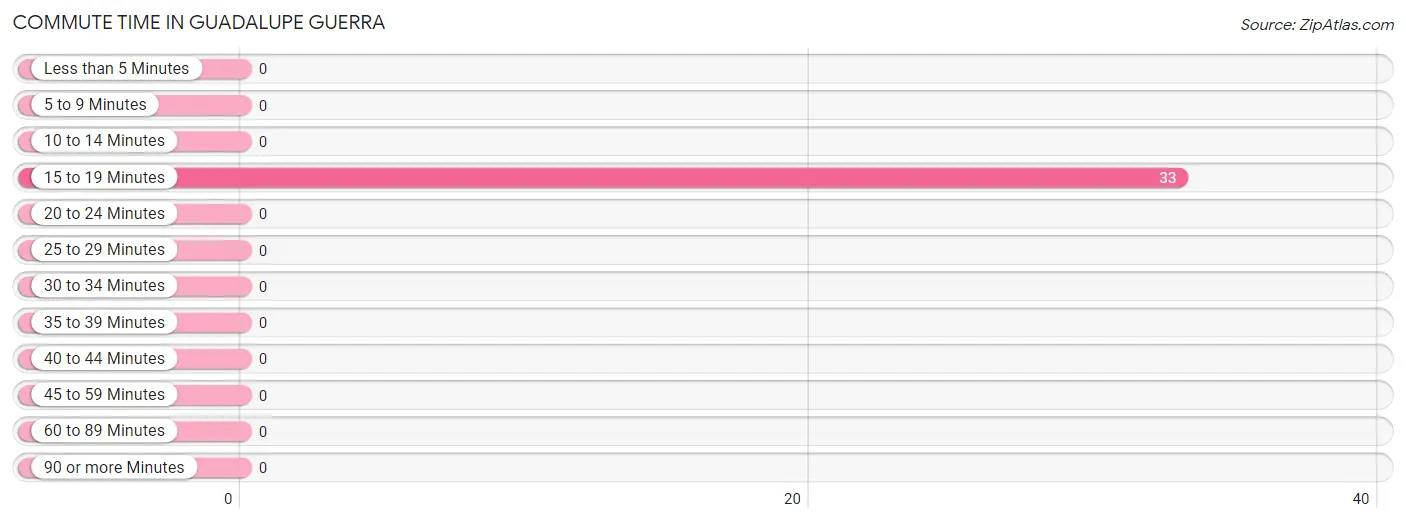
Commute Time in Guadalupe Guerra
The most frequently occuring commute durations in Guadalupe Guerra are 15 to 19 minutes (33 commuters, 100.0%), less than 5 minutes (0 commuters, 0.0%), and 5 to 9 minutes (0 commuters, 0.0%).
Commute Time
# Commuters
% Commuters
Less than 5 Minutes
0
0.0%
5 to 9 Minutes
0
0.0%
10 to 14 Minutes
0
0.0%
15 to 19 Minutes
33
100.0%
20 to 24 Minutes
0
0.0%
25 to 29 Minutes
0
0.0%
30 to 34 Minutes
0
0.0%
35 to 39 Minutes
0
0.0%
40 to 44 Minutes
0
0.0%
45 to 59 Minutes
0
0.0%
60 to 89 Minutes
0
0.0%
90 or more Minutes
0
0.0%
Commute Time by Sex in Guadalupe Guerra
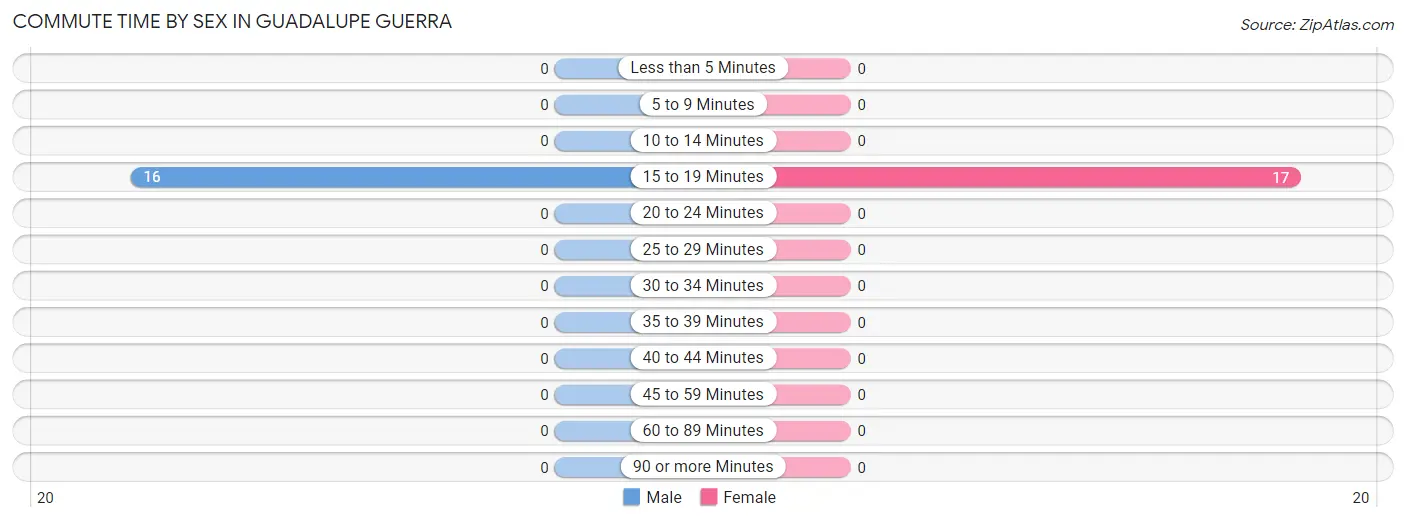
The most common commute times in Guadalupe Guerra are 15 to 19 minutes (16 commuters, 100.0%) for males and 15 to 19 minutes (17 commuters, 100.0%) for females.
Commute Time
Male
Female
Less than 5 Minutes
0 (0.0%)
0 (0.0%)
5 to 9 Minutes
0 (0.0%)
0 (0.0%)
10 to 14 Minutes
0 (0.0%)
0 (0.0%)
15 to 19 Minutes
16 (100.0%)
17 (100.0%)
20 to 24 Minutes
0 (0.0%)
0 (0.0%)
25 to 29 Minutes
0 (0.0%)
0 (0.0%)
30 to 34 Minutes
0 (0.0%)
0 (0.0%)
35 to 39 Minutes
0 (0.0%)
0 (0.0%)
40 to 44 Minutes
0 (0.0%)
0 (0.0%)
45 to 59 Minutes
0 (0.0%)
0 (0.0%)
60 to 89 Minutes
0 (0.0%)
0 (0.0%)
90 or more Minutes
0 (0.0%)
0 (0.0%)
Time of Departure to Work by Sex in Guadalupe Guerra
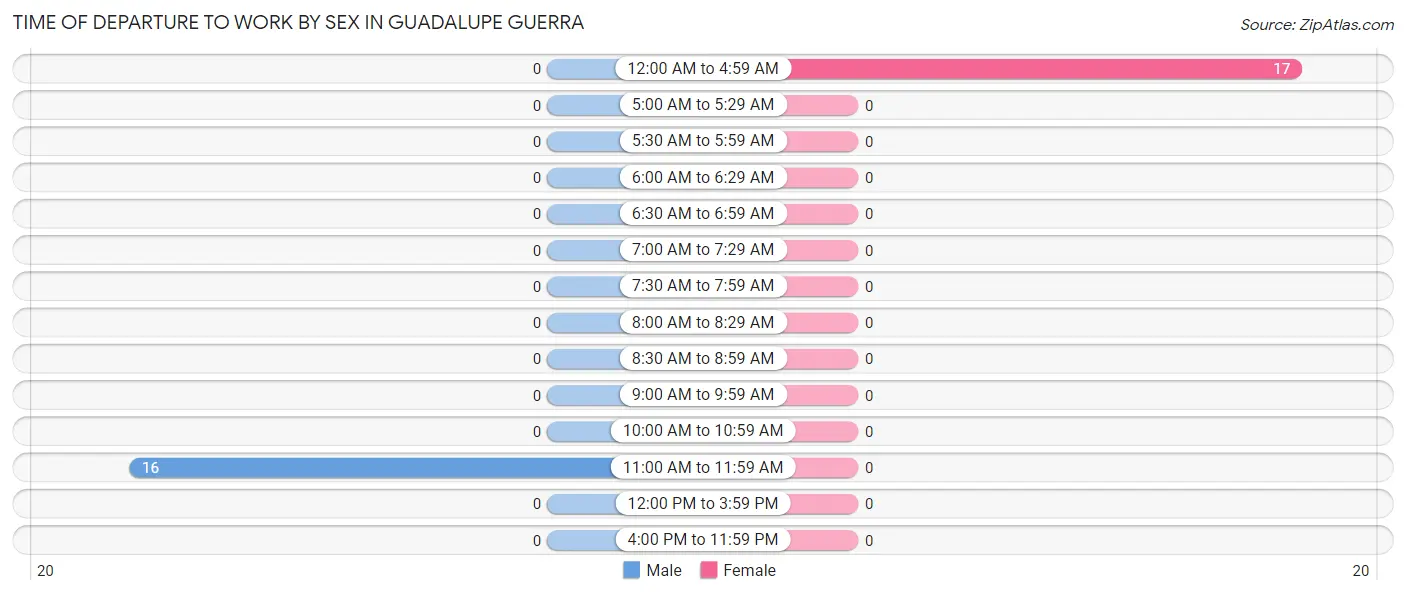
The most frequent times of departure to work in Guadalupe Guerra are 11:00 AM to 11:59 AM (16, 100.0%) for males and 12:00 AM to 4:59 AM (17, 100.0%) for females.
Time of Departure
Male
Female
12:00 AM to 4:59 AM
0 (0.0%)
17 (100.0%)
5:00 AM to 5:29 AM
0 (0.0%)
0 (0.0%)
5:30 AM to 5:59 AM
0 (0.0%)
0 (0.0%)
6:00 AM to 6:29 AM
0 (0.0%)
0 (0.0%)
6:30 AM to 6:59 AM
0 (0.0%)
0 (0.0%)
7:00 AM to 7:29 AM
0 (0.0%)
0 (0.0%)
7:30 AM to 7:59 AM
0 (0.0%)
0 (0.0%)
8:00 AM to 8:29 AM
0 (0.0%)
0 (0.0%)
8:30 AM to 8:59 AM
0 (0.0%)
0 (0.0%)
9:00 AM to 9:59 AM
0 (0.0%)
0 (0.0%)
10:00 AM to 10:59 AM
0 (0.0%)
0 (0.0%)
11:00 AM to 11:59 AM
16 (100.0%)
0 (0.0%)
12:00 PM to 3:59 PM
0 (0.0%)
0 (0.0%)
4:00 PM to 11:59 PM
0 (0.0%)
0 (0.0%)
Total
16 (100.0%)
17 (100.0%)
Housing Occupancy in Guadalupe Guerra
Occupancy by Ownership in Guadalupe Guerra
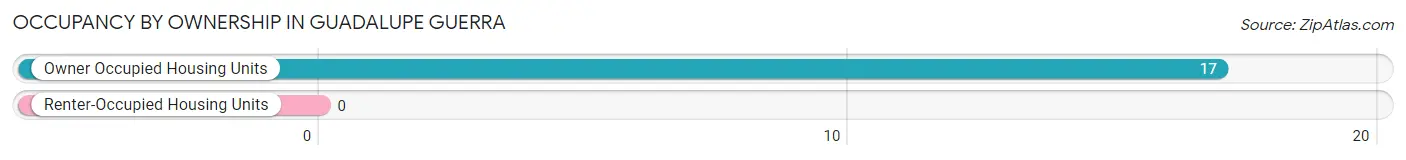
Of the total 17 dwellings in Guadalupe Guerra, owner-occupied units account for 17 (100.0%), while renter-occupied units make up 0 (0.0%).
Occupancy
# Housing Units
% Housing Units
Owner Occupied Housing Units
17
100.0%
Renter-Occupied Housing Units
0
0.0%
Total Occupied Housing Units
17
100.0%
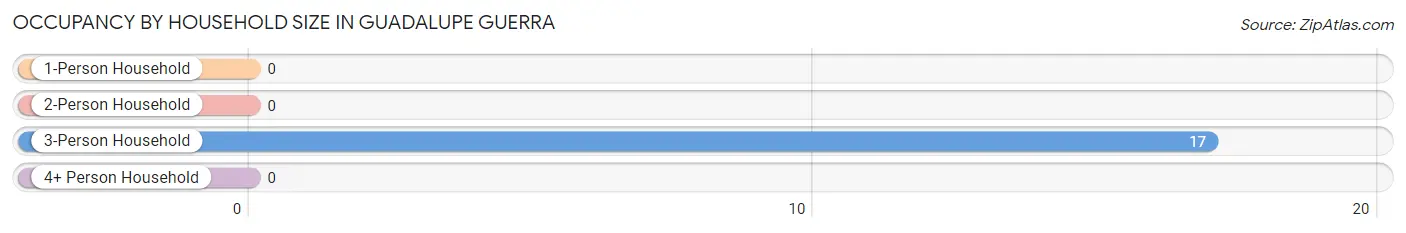
Occupancy by Household Size in Guadalupe Guerra
Household Size
# Housing Units
% Housing Units
1-Person Household
0
0.0%
2-Person Household
0
0.0%
3-Person Household
17
100.0%
4+ Person Household
0
0.0%
Total Housing Units
17
100.0%
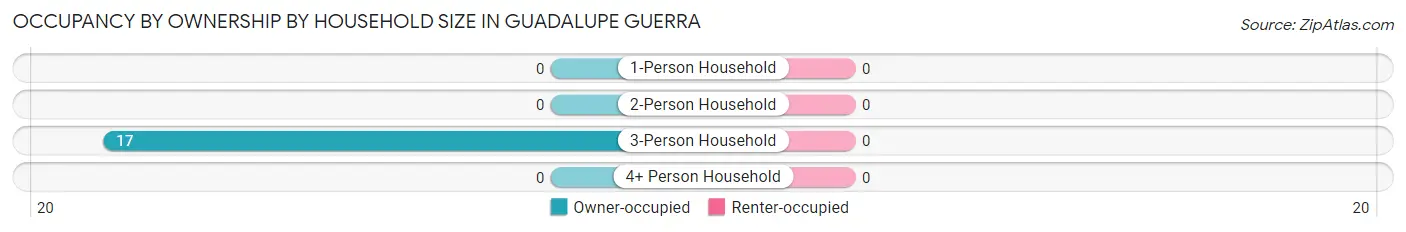
Occupancy by Ownership by Household Size in Guadalupe Guerra
Household Size
Owner-occupied
Renter-occupied
1-Person Household
0 (0.0%)
0 (0.0%)
2-Person Household
0 (0.0%)
0 (0.0%)
3-Person Household
17 (100.0%)
0 (0.0%)
4+ Person Household
0 (0.0%)
0 (0.0%)
Total Housing Units
17 (100.0%)
0 (0.0%)
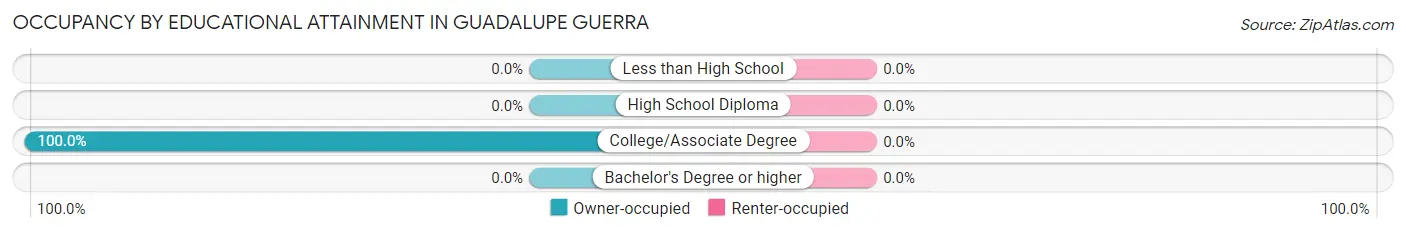
Occupancy by Educational Attainment in Guadalupe Guerra
Household Size
Owner-occupied
Renter-occupied
Less than High School
0 (0.0%)
0 (0.0%)
High School Diploma
0 (0.0%)
0 (0.0%)
College/Associate Degree
17 (100.0%)
0 (0.0%)
Bachelor's Degree or higher
0 (0.0%)
0 (0.0%)
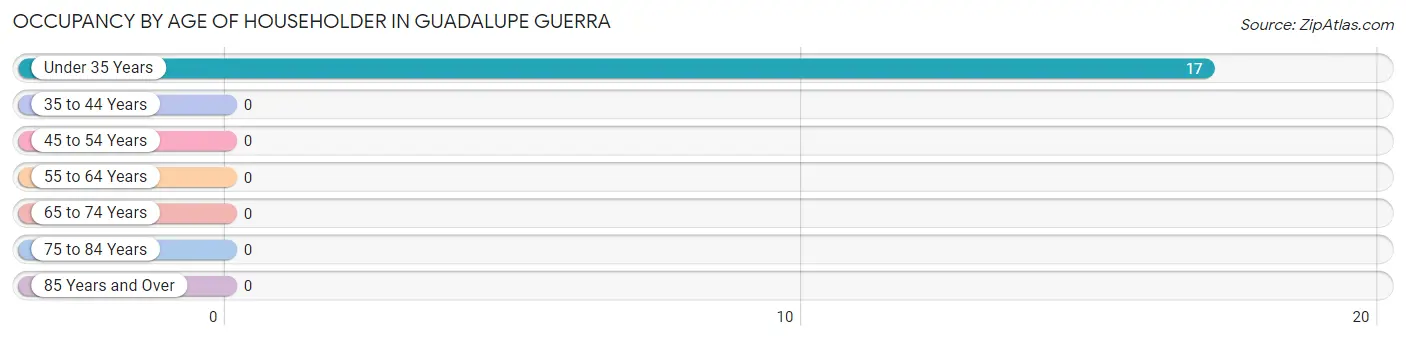
Occupancy by Age of Householder in Guadalupe Guerra
Age Bracket
# Households
% Households
Under 35 Years
17
100.0%
35 to 44 Years
0
0.0%
45 to 54 Years
0
0.0%
55 to 64 Years
0
0.0%
65 to 74 Years
0
0.0%
75 to 84 Years
0
0.0%
85 Years and Over
0
0.0%
Total
17
100.0%
Housing Finances in Guadalupe Guerra
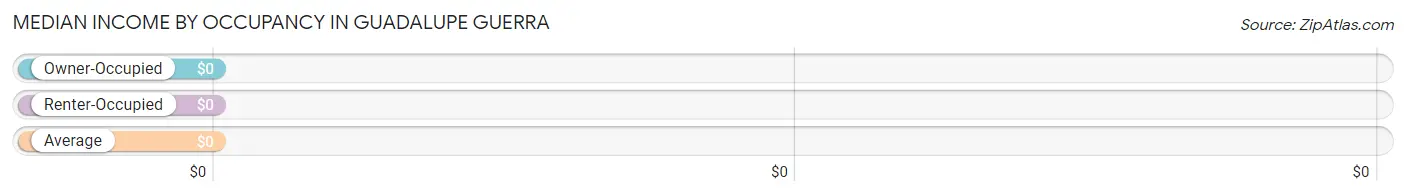
Median Income by Occupancy in Guadalupe Guerra
Occupancy Type
# Households
Median Income
Owner-Occupied
17 (100.0%)
$0
Renter-Occupied
0 (0.0%)
$0
Average
17 (100.0%)
$0
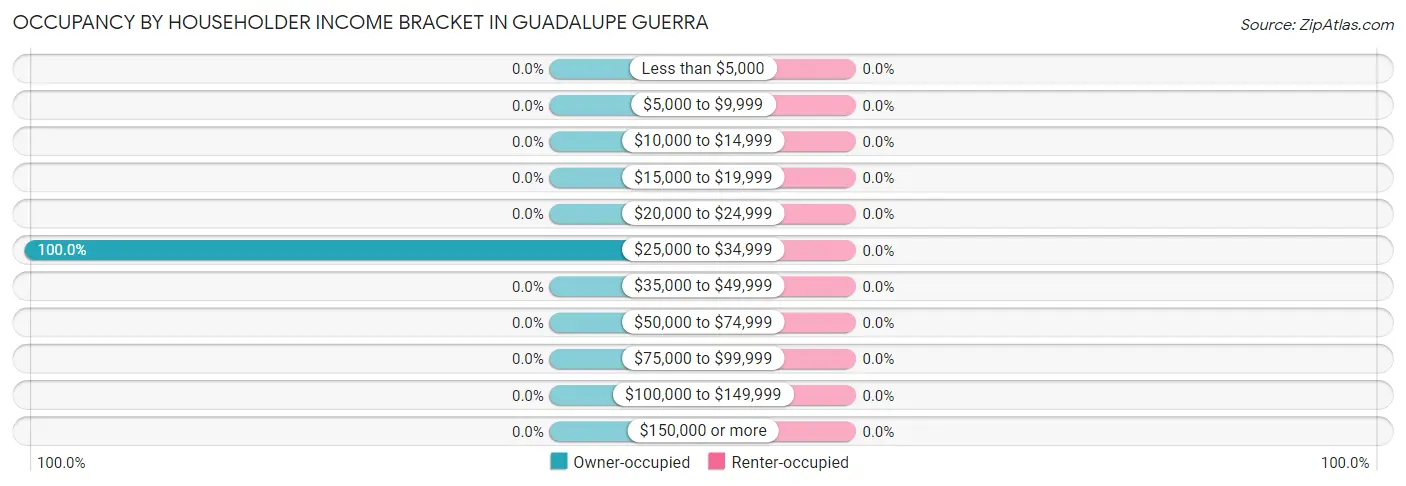
Occupancy by Householder Income Bracket in Guadalupe Guerra
Income Bracket
Owner-occupied
Renter-occupied
Less than $5,000
0 (0.0%)
0 (0.0%)
$5,000 to $9,999
0 (0.0%)
0 (0.0%)
$10,000 to $14,999
0 (0.0%)
0 (0.0%)
$15,000 to $19,999
0 (0.0%)
0 (0.0%)
$20,000 to $24,999
0 (0.0%)
0 (0.0%)
$25,000 to $34,999
17 (100.0%)
0 (0.0%)
$35,000 to $49,999
0 (0.0%)
0 (0.0%)
$50,000 to $74,999
0 (0.0%)
0 (0.0%)
$75,000 to $99,999
0 (0.0%)
0 (0.0%)
$100,000 to $149,999
0 (0.0%)
0 (0.0%)
$150,000 or more
0 (0.0%)
0 (0.0%)
Total
17 (100.0%)
0 (0.0%)
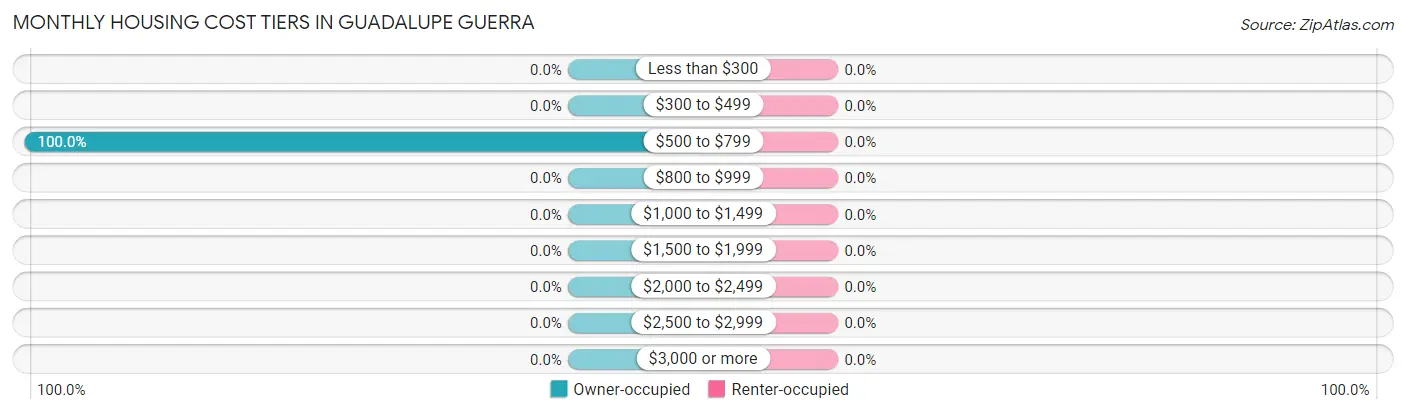
Monthly Housing Cost Tiers in Guadalupe Guerra
Monthly Cost
Owner-occupied
Renter-occupied
Less than $300
0 (0.0%)
0 (0.0%)
$300 to $499
0 (0.0%)
0 (0.0%)
$500 to $799
17 (100.0%)
0 (0.0%)
$800 to $999
0 (0.0%)
0 (0.0%)
$1,000 to $1,499
0 (0.0%)
0 (0.0%)
$1,500 to $1,999
0 (0.0%)
0 (0.0%)
$2,000 to $2,499
0 (0.0%)
0 (0.0%)
$2,500 to $2,999
0 (0.0%)
0 (0.0%)
$3,000 or more
0 (0.0%)
0 (0.0%)
Total
17 (100.0%)
0 (0.0%)
Physical Housing Characteristics in Guadalupe Guerra
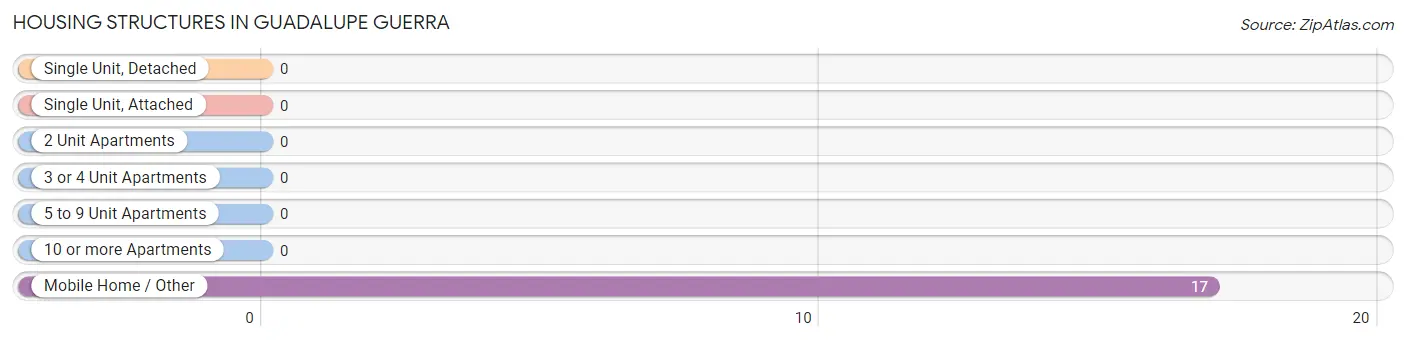
Housing Structures in Guadalupe Guerra
Structure Type
# Housing Units
% Housing Units
Single Unit, Detached
0
0.0%
Single Unit, Attached
0
0.0%
2 Unit Apartments
0
0.0%
3 or 4 Unit Apartments
0
0.0%
5 to 9 Unit Apartments
0
0.0%
10 or more Apartments
0
0.0%
Mobile Home / Other
17
100.0%
Total
17
100.0%
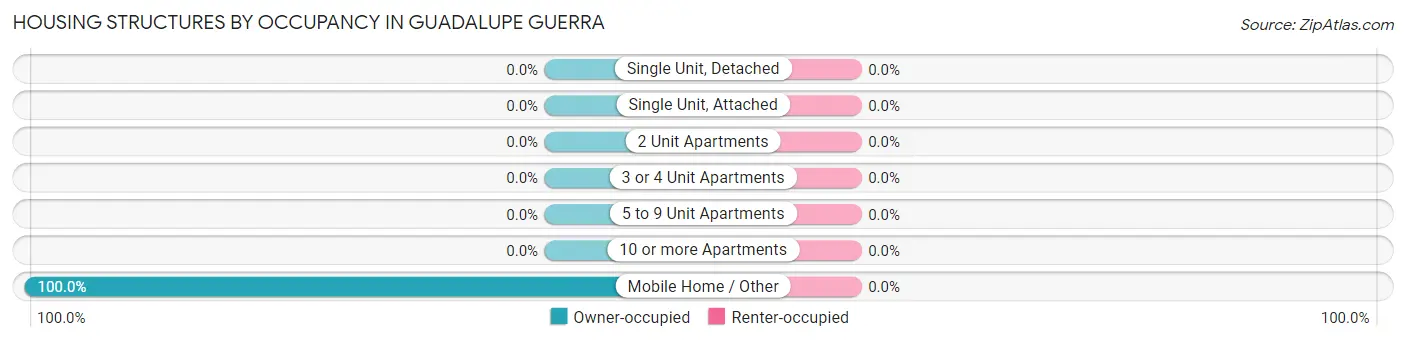
Housing Structures by Occupancy in Guadalupe Guerra
Structure Type
Owner-occupied
Renter-occupied
Single Unit, Detached
0 (0.0%)
0 (0.0%)
Single Unit, Attached
0 (0.0%)
0 (0.0%)
2 Unit Apartments
0 (0.0%)
0 (0.0%)
3 or 4 Unit Apartments
0 (0.0%)
0 (0.0%)
5 to 9 Unit Apartments
0 (0.0%)
0 (0.0%)
10 or more Apartments
0 (0.0%)
0 (0.0%)
Mobile Home / Other
17 (100.0%)
0 (0.0%)
Total
17 (100.0%)
0 (0.0%)
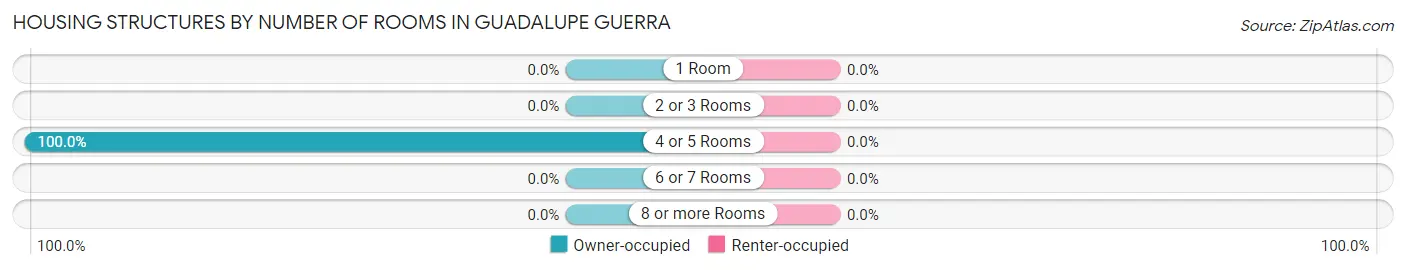
Housing Structures by Number of Rooms in Guadalupe Guerra
Number of Rooms
Owner-occupied
Renter-occupied
1 Room
0 (0.0%)
0 (0.0%)
2 or 3 Rooms
0 (0.0%)
0 (0.0%)
4 or 5 Rooms
17 (100.0%)
0 (0.0%)
6 or 7 Rooms
0 (0.0%)
0 (0.0%)
8 or more Rooms
0 (0.0%)
0 (0.0%)
Total
17 (100.0%)
0 (0.0%)
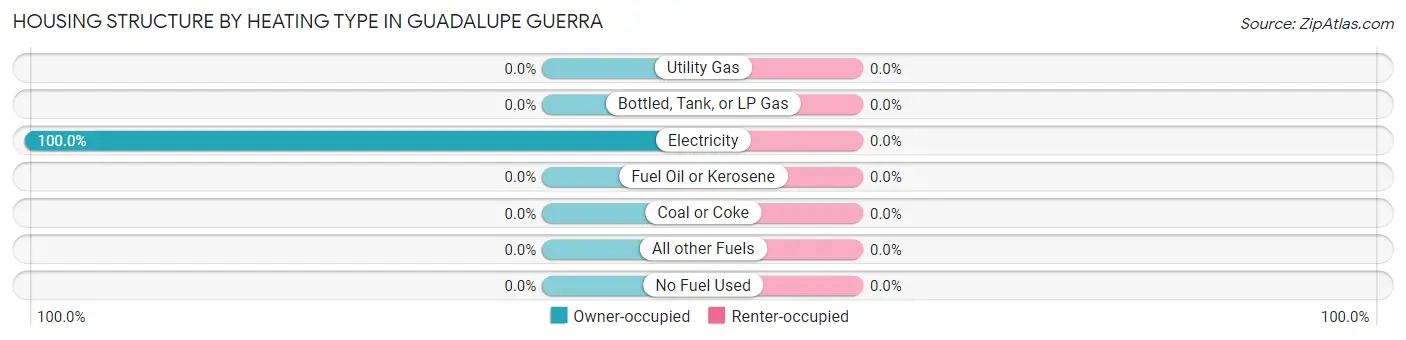
Housing Structure by Heating Type in Guadalupe Guerra
Heating Type
Owner-occupied
Renter-occupied
Utility Gas
0 (0.0%)
0 (0.0%)
Bottled, Tank, or LP Gas
0 (0.0%)
0 (0.0%)
Electricity
17 (100.0%)
0 (0.0%)
Fuel Oil or Kerosene
0 (0.0%)
0 (0.0%)
Coal or Coke
0 (0.0%)
0 (0.0%)
All other Fuels
0 (0.0%)
0 (0.0%)
No Fuel Used
0 (0.0%)
0 (0.0%)
Total
17 (100.0%)
0 (0.0%)
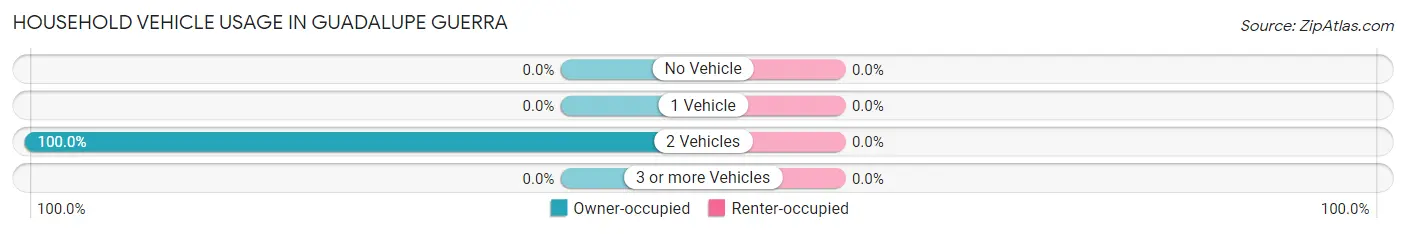
Household Vehicle Usage in Guadalupe Guerra
Vehicles per Household
Owner-occupied
Renter-occupied
No Vehicle
0 (0.0%)
0 (0.0%)
1 Vehicle
0 (0.0%)
0 (0.0%)
2 Vehicles
17 (100.0%)
0 (0.0%)
3 or more Vehicles
0 (0.0%)
0 (0.0%)
Total
17 (100.0%)
0 (0.0%)
Real Estate & Mortgages in Guadalupe Guerra
Real Estate and Mortgage Overview in Guadalupe Guerra
Characteristic
Without Mortgage
With Mortgage
Housing Units
0
17
Median Property Value
-
-
Median Household Income
-
-
Monthly Housing Costs
-
-
Real Estate Taxes
-
-
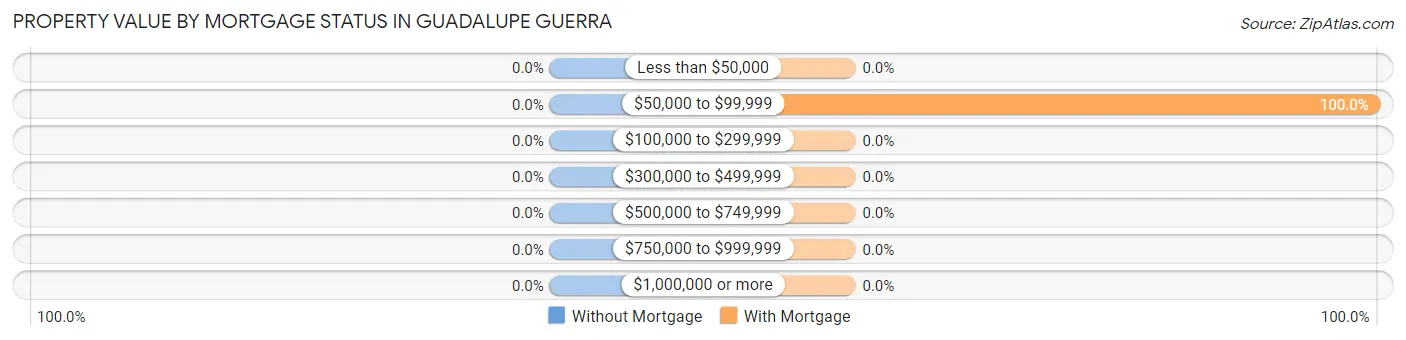
Property Value by Mortgage Status in Guadalupe Guerra
Property Value
Without Mortgage
With Mortgage
Less than $50,000
0 (0.0%)
0 (0.0%)
$50,000 to $99,999
0 (0.0%)
17 (100.0%)
$100,000 to $299,999
0 (0.0%)
0 (0.0%)
$300,000 to $499,999
0 (0.0%)
0 (0.0%)
$500,000 to $749,999
0 (0.0%)
0 (0.0%)
$750,000 to $999,999
0 (0.0%)
0 (0.0%)
$1,000,000 or more
0 (0.0%)
0 (0.0%)
Total
0 (0.0%)
17 (100.0%)
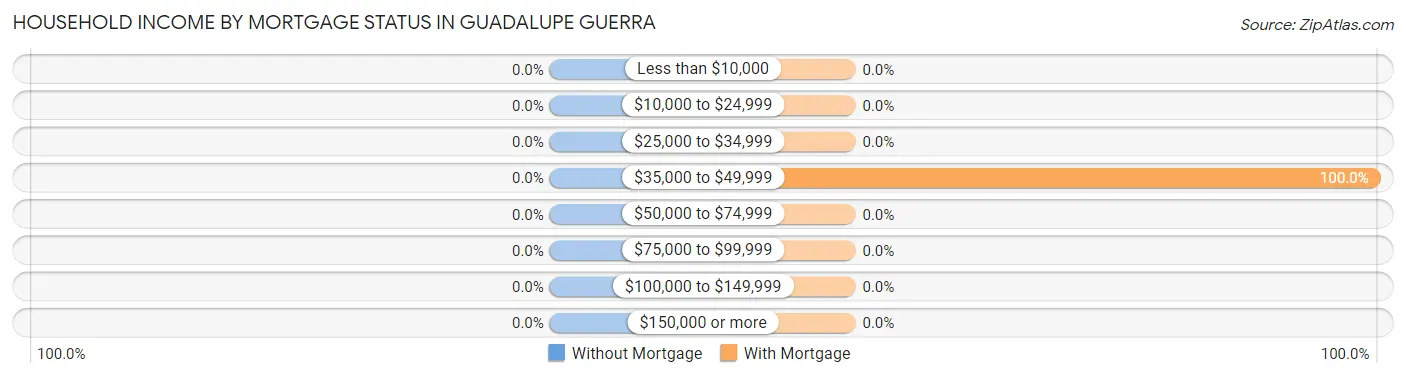
Household Income by Mortgage Status in Guadalupe Guerra
Household Income
Without Mortgage
With Mortgage
Less than $10,000
0 (0.0%)
0 (0.0%)
$10,000 to $24,999
0 (0.0%)
0 (0.0%)
$25,000 to $34,999
0 (0.0%)
0 (0.0%)
$35,000 to $49,999
0 (0.0%)
17 (100.0%)
$50,000 to $74,999
0 (0.0%)
0 (0.0%)
$75,000 to $99,999
0 (0.0%)
0 (0.0%)
$100,000 to $149,999
0 (0.0%)
0 (0.0%)
$150,000 or more
0 (0.0%)
0 (0.0%)
Total
0 (0.0%)
17 (100.0%)
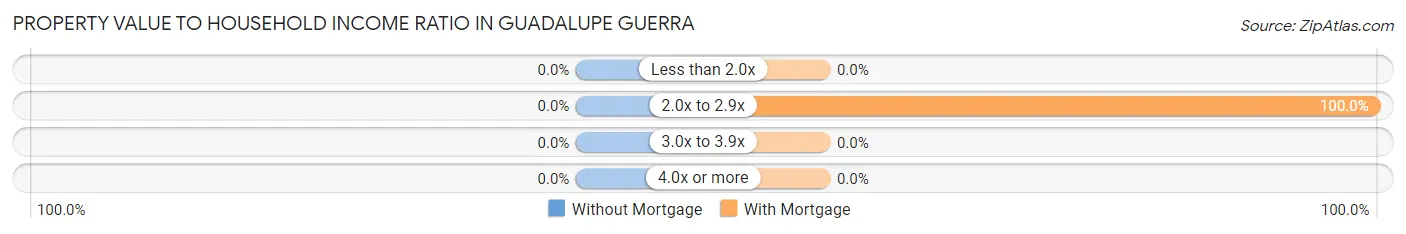
Property Value to Household Income Ratio in Guadalupe Guerra
Value-to-Income Ratio
Without Mortgage
With Mortgage
Less than 2.0x
0 (0.0%)
0 (0.0%)
2.0x to 2.9x
0 (0.0%)
17 (100.0%)
3.0x to 3.9x
0 (0.0%)
0 (0.0%)
4.0x or more
0 (0.0%)
0 (0.0%)
Total
0 (0.0%)
17 (100.0%)
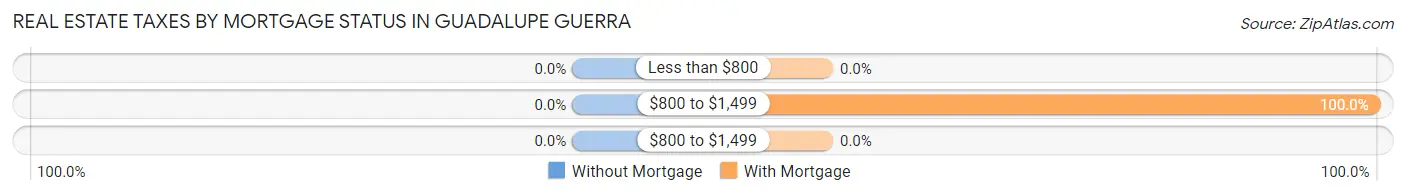
Real Estate Taxes by Mortgage Status in Guadalupe Guerra
Property Taxes
Without Mortgage
With Mortgage
Less than $800
0 (0.0%)
0 (0.0%)
$800 to $1,499
0 (0.0%)
17 (100.0%)
$800 to $1,499
0 (0.0%)
0 (0.0%)
Total
0 (0.0%)
17 (100.0%)
Health & Disability in Guadalupe Guerra
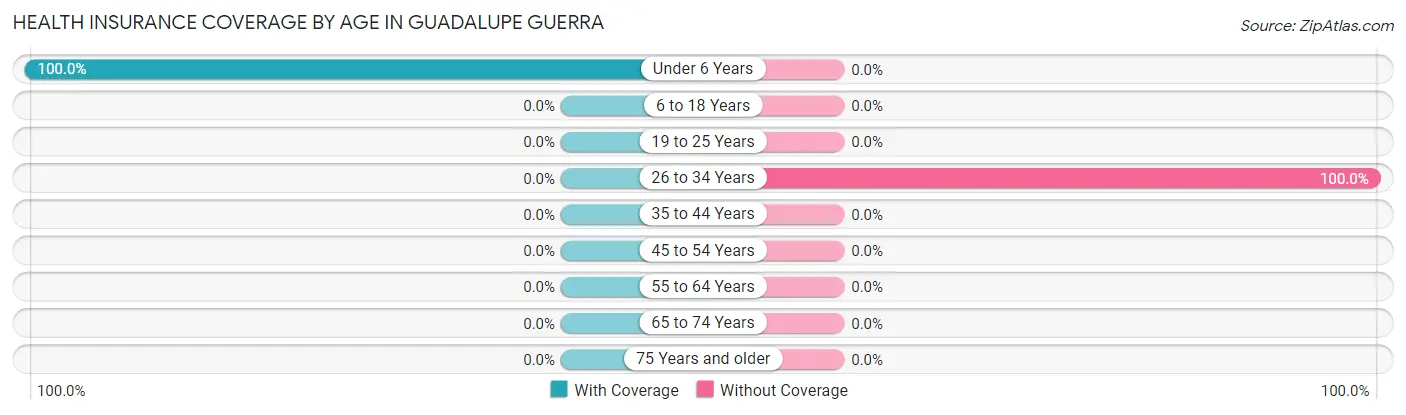
Health Insurance Coverage by Age in Guadalupe Guerra
Age Bracket
With Coverage
Without Coverage
Under 6 Years
22 (100.0%)
0 (0.0%)
6 to 18 Years
0 (0.0%)
0 (0.0%)
19 to 25 Years
0 (0.0%)
0 (0.0%)
26 to 34 Years
0 (0.0%)
33 (100.0%)
35 to 44 Years
0 (0.0%)
0 (0.0%)
45 to 54 Years
0 (0.0%)
0 (0.0%)
55 to 64 Years
0 (0.0%)
0 (0.0%)
65 to 74 Years
0 (0.0%)
0 (0.0%)
75 Years and older
0 (0.0%)
0 (0.0%)
Total
22 (40.0%)
33 (60.0%)
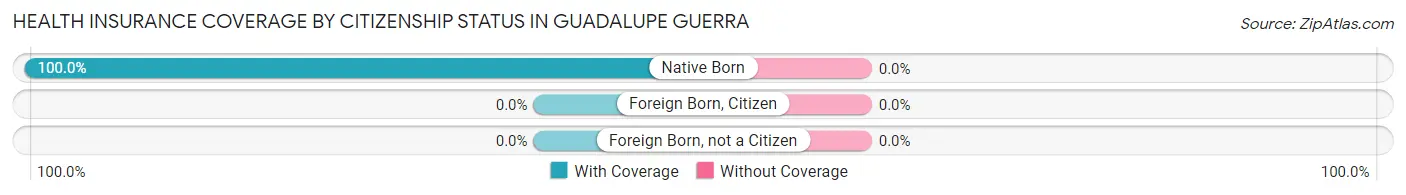
Health Insurance Coverage by Citizenship Status in Guadalupe Guerra
Citizenship Status
With Coverage
Without Coverage
Native Born
22 (100.0%)
0 (0.0%)
Foreign Born, Citizen
0 (0.0%)
0 (0.0%)
Foreign Born, not a Citizen
0 (0.0%)
0 (0.0%)
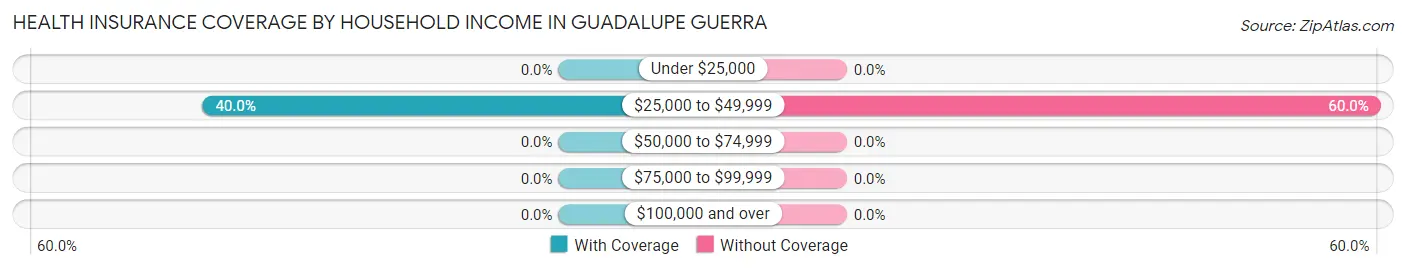
Health Insurance Coverage by Household Income in Guadalupe Guerra
Household Income
With Coverage
Without Coverage
Under $25,000
0 (0.0%)
0 (0.0%)
$25,000 to $49,999
22 (40.0%)
33 (60.0%)
$50,000 to $74,999
0 (0.0%)
0 (0.0%)
$75,000 to $99,999
0 (0.0%)
0 (0.0%)
$100,000 and over
0 (0.0%)
0 (0.0%)
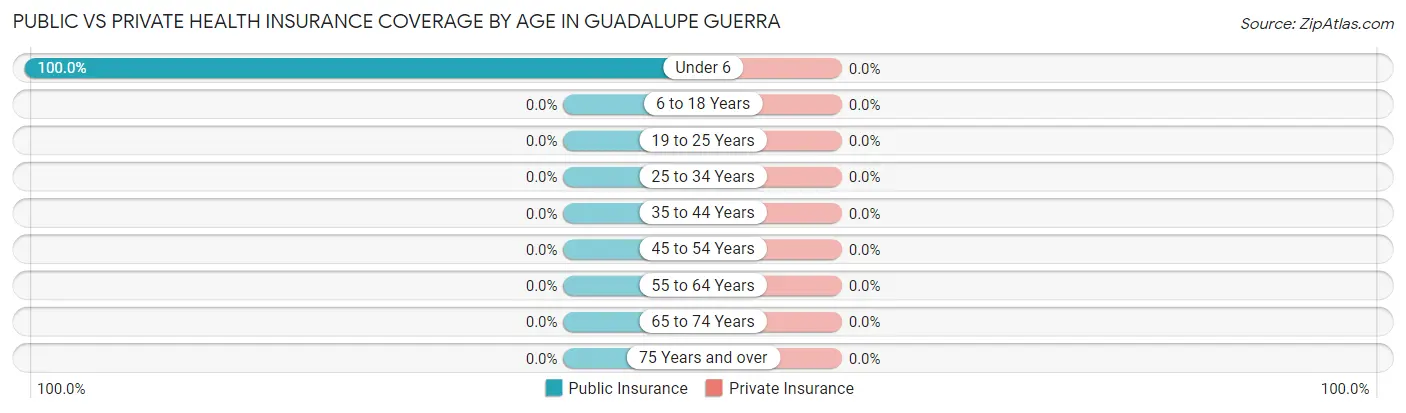
Public vs Private Health Insurance Coverage by Age in Guadalupe Guerra
Age Bracket
Public Insurance
Private Insurance
Under 6
22 (100.0%)
0 (0.0%)
6 to 18 Years
0 (0.0%)
0 (0.0%)
19 to 25 Years
0 (0.0%)
0 (0.0%)
25 to 34 Years
0 (0.0%)
0 (0.0%)
35 to 44 Years
0 (0.0%)
0 (0.0%)
45 to 54 Years
0 (0.0%)
0 (0.0%)
55 to 64 Years
0 (0.0%)
0 (0.0%)
65 to 74 Years
0 (0.0%)
0 (0.0%)
75 Years and over
0 (0.0%)
0 (0.0%)
Total
22 (40.0%)
0 (0.0%)
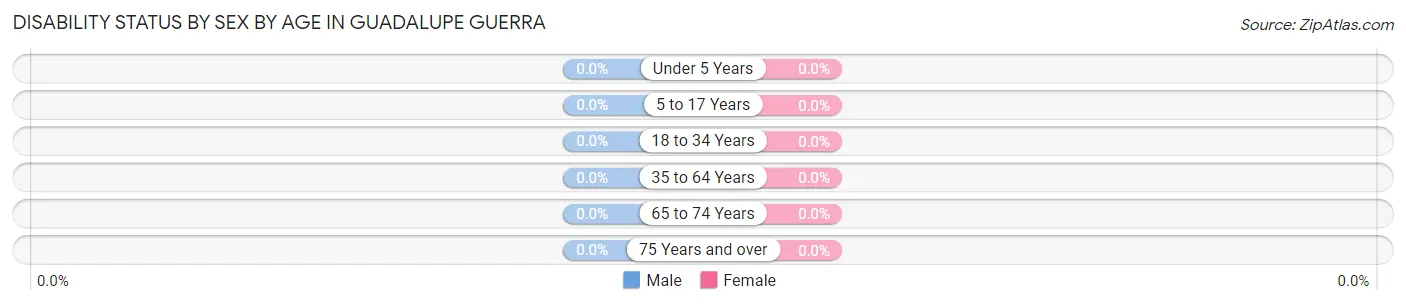
Disability Status by Sex by Age in Guadalupe Guerra
Age Bracket
Male
Female
Under 5 Years
0 (0.0%)
0 (0.0%)
5 to 17 Years
0 (0.0%)
0 (0.0%)
18 to 34 Years
0 (0.0%)
0 (0.0%)
35 to 64 Years
0 (0.0%)
0 (0.0%)
65 to 74 Years
0 (0.0%)
0 (0.0%)
75 Years and over
0 (0.0%)
0 (0.0%)
Disability Class by Sex by Age in Guadalupe Guerra
Disability Class: Hearing Difficulty
Age Bracket
Male
Female
Under 5 Years
0 (0.0%)
0 (0.0%)
5 to 17 Years
0 (0.0%)
0 (0.0%)
18 to 34 Years
0 (0.0%)
0 (0.0%)
35 to 64 Years
0 (0.0%)
0 (0.0%)
65 to 74 Years
0 (0.0%)
0 (0.0%)
75 Years and over
0 (0.0%)
0 (0.0%)
Disability Class: Vision Difficulty
Age Bracket
Male
Female
Under 5 Years
0 (0.0%)
0 (0.0%)
5 to 17 Years
0 (0.0%)
0 (0.0%)
18 to 34 Years
0 (0.0%)
0 (0.0%)
35 to 64 Years
0 (0.0%)
0 (0.0%)
65 to 74 Years
0 (0.0%)
0 (0.0%)
75 Years and over
0 (0.0%)
0 (0.0%)
Disability Class: Cognitive Difficulty
Age Bracket
Male
Female
5 to 17 Years
0 (0.0%)
0 (0.0%)
18 to 34 Years
0 (0.0%)
0 (0.0%)
35 to 64 Years
0 (0.0%)
0 (0.0%)
65 to 74 Years
0 (0.0%)
0 (0.0%)
75 Years and over
0 (0.0%)
0 (0.0%)
Disability Class: Ambulatory Difficulty
Age Bracket
Male
Female
5 to 17 Years
0 (0.0%)
0 (0.0%)
18 to 34 Years
0 (0.0%)
0 (0.0%)
35 to 64 Years
0 (0.0%)
0 (0.0%)
65 to 74 Years
0 (0.0%)
0 (0.0%)
75 Years and over
0 (0.0%)
0 (0.0%)
Disability Class: Self-Care Difficulty
Age Bracket
Male
Female
5 to 17 Years
0 (0.0%)
0 (0.0%)
18 to 34 Years
0 (0.0%)
0 (0.0%)
35 to 64 Years
0 (0.0%)
0 (0.0%)
65 to 74 Years
0 (0.0%)
0 (0.0%)
75 Years and over
0 (0.0%)
0 (0.0%)
Technology Access in Guadalupe Guerra
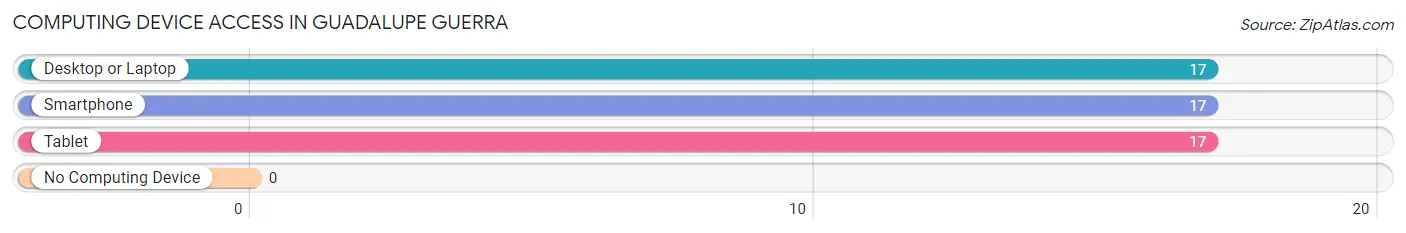
Computing Device Access in Guadalupe Guerra
Device Type
# Households
% Households
Desktop or Laptop
17
100.0%
Smartphone
17
100.0%
Tablet
17
100.0%
No Computing Device
0
0.0%
Total
17
100.0%
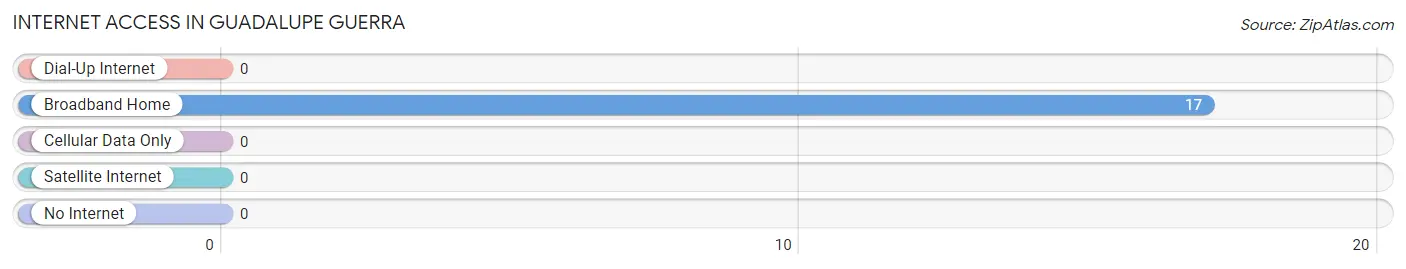
Internet Access in Guadalupe Guerra
Internet Type
# Households
% Households
Dial-Up Internet
0
0.0%
Broadband Home
17
100.0%
Cellular Data Only
0
0.0%
Satellite Internet
0
0.0%
No Internet
0
0.0%
Total
17
100.0%
Guadalupe Guerra Summary
Texas is a state located in the south-central region of the United States. It is the second largest state in the country, both in terms of population and land area. Texas is known for its diverse geography, ranging from the piney woods of East Texas to the desert of West Texas, and its rich history, which dates back to the early days of the Republic of Texas. Texas is also known for its vibrant economy, which is driven by its energy, technology, and agricultural industries. In addition, Texas has a diverse population, with a large Hispanic population and a growing number of immigrants from around the world.
Geography
Texas is located in the south-central region of the United States, bordered by Oklahoma to the north, Arkansas to the northeast, Louisiana to the east, and Mexico to the south. Texas is the second largest state in the country, with an area of 268,820 square miles. The state is divided into four distinct geographic regions: the Gulf Coastal Plains, the Great Plains, the Edwards Plateau, and the Basin and Range Province.
The Gulf Coastal Plains region is located along the Gulf of Mexico and is characterized by flat, marshy terrain. This region is home to the cities of Houston, Galveston, and Corpus Christi. The Great Plains region is located in the northern part of the state and is characterized by rolling hills and grasslands. This region is home to the cities of Dallas, Fort Worth, and Austin. The Edwards Plateau region is located in the central part of the state and is characterized by rugged hills and canyons. This region is home to the cities of San Antonio and El Paso. The Basin and Range Province is located in the western part of the state and is characterized by desert terrain. This region is home to the cities of Lubbock and Amarillo.
History
Texas has a long and rich history, dating back to the early days of the Republic of Texas. The area was first inhabited by Native American tribes, including the Apache, Comanche, and Caddo. In the 16th century, Spanish explorers arrived in the area, and in 1690, the Spanish established a mission in East Texas. In 1821, Mexico gained independence from Spain, and Texas became part of Mexico. In 1836, Texas declared its independence from Mexico and became the Republic of Texas. In 1845, Texas was annexed by the United States and became the 28th state.
During the Civil War, Texas was a Confederate state, and many battles were fought in the state. After the war, Texas experienced a period of economic growth, driven by the development of the oil and gas industry. In the 20th century, Texas became a major center of the technology industry, and the state’s economy continues to be driven by energy, technology, and agriculture.
Economy
Texas has a vibrant and diverse economy, which is driven by its energy, technology, and agricultural industries. The state is the largest producer of oil and natural gas in the United States, and it is also a major producer of wind energy. The technology industry is a major driver of the state’s economy, and Texas is home to many major technology companies, including Dell, Apple, and Microsoft. The state is also a major producer of agricultural products, including cotton, cattle, and wheat.
In addition, Texas is home to many major corporations, including ExxonMobil, AT&T, and American Airlines. The state is also home to many major universities, including the University of Texas at Austin, Texas A&M University, and the University of Houston.
Demographics
As of 2019, Texas had an estimated population of 29 million people. The state is racially and ethnically diverse, with a large Hispanic population and a growing number of immigrants from around the world. The largest racial group in the state is White, accounting for 43.5% of the population. The second largest racial group is Hispanic or Latino, accounting for 39.4% of the population. Other racial groups include African American (11.8%), Asian (3.8%), and Native American (0.7%).
In terms of religion, the largest religious group in the state is Christian, accounting for 75.2% of the population. Other religious groups include Jewish (2.2%), Muslim (1.3%), and Buddhist (0.5%).
Conclusion
Texas is a large and diverse state, with a rich history, diverse geography, vibrant economy, and diverse population. The state is home to many major industries, including energy, technology, and agriculture, and it is also home to many major corporations and universities. In addition, Texas has a large and diverse population, with a large Hispanic population and a growing number of immigrants from around the world.
Common Questions
What is the Total Population of Guadalupe Guerra?
Total Population of Guadalupe Guerra is 55.
What is the Total Male Population of Guadalupe Guerra?
Total Male Population of Guadalupe Guerra is 38.
What is the Total Female Population of Guadalupe Guerra?
Total Female Population of Guadalupe Guerra is 17.
What is the Ratio of Males per 100 Females in Guadalupe Guerra?
There are 223.53 Males per 100 Females in Guadalupe Guerra.
What is the Ratio of Females per 100 Males in Guadalupe Guerra?
There are 44.74 Females per 100 Males in Guadalupe Guerra.
What is the Median Population Age in Guadalupe Guerra?
Median Population Age in Guadalupe Guerra is 26.3 Years.
What is the Average Family Size in Guadalupe Guerra
Average Family Size in Guadalupe Guerra is 3.2 People.
What is the Average Household Size in Guadalupe Guerra
Average Household Size in Guadalupe Guerra is 3.2 People.
How Large is the Labor Force in Guadalupe Guerra?
There are 33 People in the Labor Forcein in Guadalupe Guerra.
What is the Percentage of People in the Labor Force in Guadalupe Guerra?
100.0% of People are in the Labor Force in Guadalupe Guerra.
Report Title
Report Link
HTML Copy & Paste Link
Social Media
Copy and paste the folowing code into any webpage where you would like this interactive chart to display