Ennis, TX Map & Demographics
Ennis Map
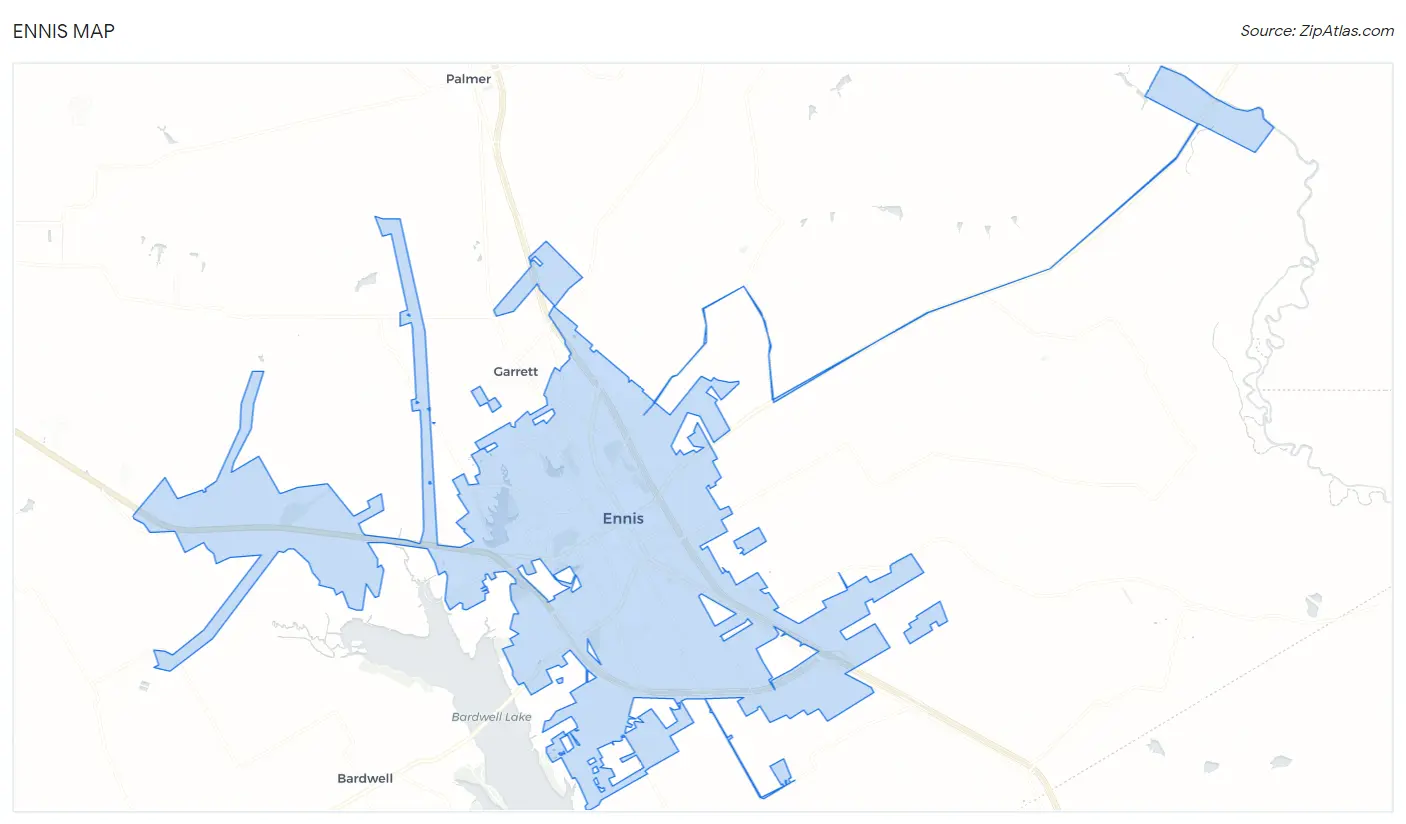
Ennis Overview
$31,278
PER CAPITA INCOME
$86,875
AVG FAMILY INCOME
$73,176
AVG HOUSEHOLD INCOME
27.8%
WAGE / INCOME GAP [ % ]
72.2¢/ $1
WAGE / INCOME GAP [ $ ]
$7,146
FAMILY INCOME DEFICIT
0.38
INEQUALITY / GINI INDEX
20,709
TOTAL POPULATION
10,357
MALE POPULATION
10,352
FEMALE POPULATION
100.05
MALES / 100 FEMALES
99.95
FEMALES / 100 MALES
33.7
MEDIAN AGE
3.3
AVG FAMILY SIZE
2.8
AVG HOUSEHOLD SIZE
11,493
LABOR FORCE [ PEOPLE ]
71.7%
PERCENT IN LABOR FORCE
3.1%
UNEMPLOYMENT RATE
Ennis Zip Codes
Income in Ennis
Income Overview in Ennis
Per Capita Income in Ennis is $31,278, while median incomes of families and households are $86,875 and $73,176 respectively.
| Characteristic | Number | Measure |
| Per Capita Income | 20,709 | $31,278 |
| Median Family Income | 5,551 | $86,875 |
| Mean Family Income | 5,551 | $95,109 |
| Median Household Income | 7,269 | $73,176 |
| Mean Household Income | 7,269 | $86,027 |
| Income Deficit | 5,551 | $7,146 |
| Wage / Income Gap (%) | 20,709 | 27.77% |
| Wage / Income Gap ($) | 20,709 | 72.23¢ per $1 |
| Gini / Inequality Index | 20,709 | 0.38 |
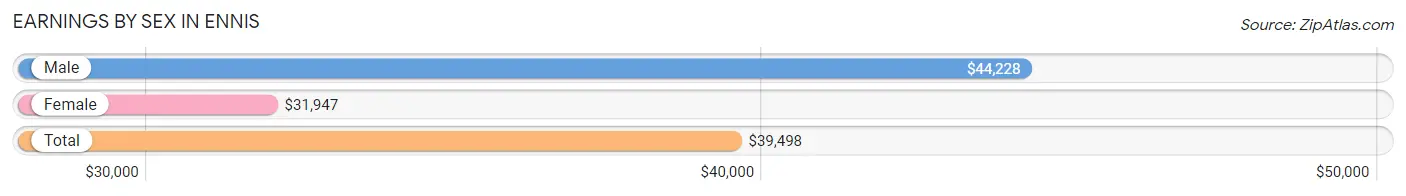
Earnings by Sex in Ennis
Average Earnings in Ennis are $39,498, $44,228 for men and $31,947 for women, a difference of 27.8%.
| Sex | Number | Average Earnings |
| Male | 6,197 (51.6%) | $44,228 |
| Female | 5,815 (48.4%) | $31,947 |
| Total | 12,012 (100.0%) | $39,498 |
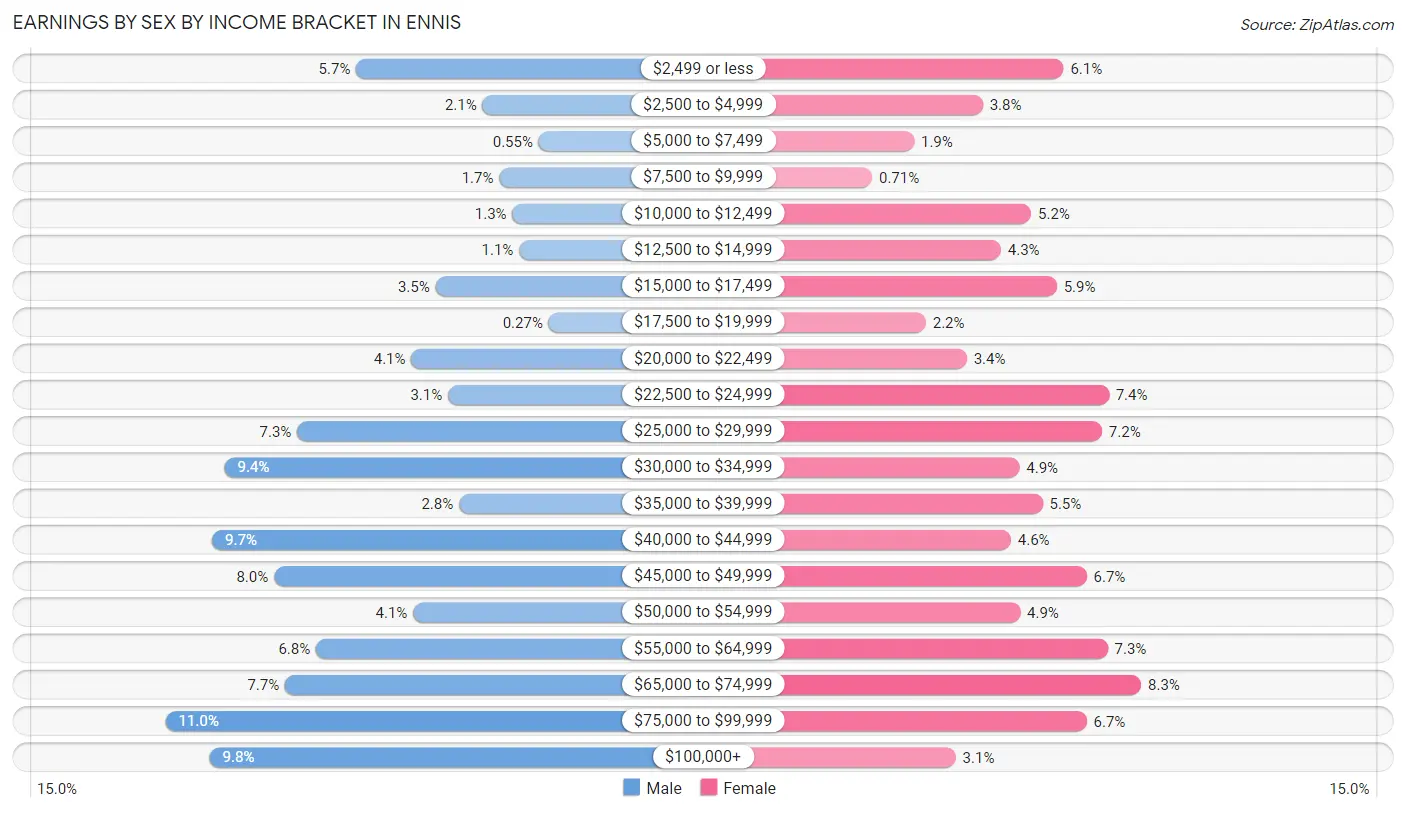
Earnings by Sex by Income Bracket in Ennis
The most common earnings brackets in Ennis are $75,000 to $99,999 for men (684 | 11.0%) and $65,000 to $74,999 for women (481 | 8.3%).
| Income | Male | Female |
| $2,499 or less | 352 (5.7%) | 354 (6.1%) |
| $2,500 to $4,999 | 132 (2.1%) | 222 (3.8%) |
| $5,000 to $7,499 | 34 (0.5%) | 110 (1.9%) |
| $7,500 to $9,999 | 103 (1.7%) | 41 (0.7%) |
| $10,000 to $12,499 | 80 (1.3%) | 301 (5.2%) |
| $12,500 to $14,999 | 68 (1.1%) | 252 (4.3%) |
| $15,000 to $17,499 | 214 (3.5%) | 343 (5.9%) |
| $17,500 to $19,999 | 17 (0.3%) | 129 (2.2%) |
| $20,000 to $22,499 | 256 (4.1%) | 196 (3.4%) |
| $22,500 to $24,999 | 192 (3.1%) | 428 (7.4%) |
| $25,000 to $29,999 | 455 (7.3%) | 417 (7.2%) |
| $30,000 to $34,999 | 581 (9.4%) | 282 (4.9%) |
| $35,000 to $39,999 | 173 (2.8%) | 320 (5.5%) |
| $40,000 to $44,999 | 603 (9.7%) | 268 (4.6%) |
| $45,000 to $49,999 | 495 (8.0%) | 392 (6.7%) |
| $50,000 to $54,999 | 253 (4.1%) | 283 (4.9%) |
| $55,000 to $64,999 | 422 (6.8%) | 426 (7.3%) |
| $65,000 to $74,999 | 476 (7.7%) | 481 (8.3%) |
| $75,000 to $99,999 | 684 (11.0%) | 392 (6.7%) |
| $100,000+ | 607 (9.8%) | 178 (3.1%) |
| Total | 6,197 (100.0%) | 5,815 (100.0%) |
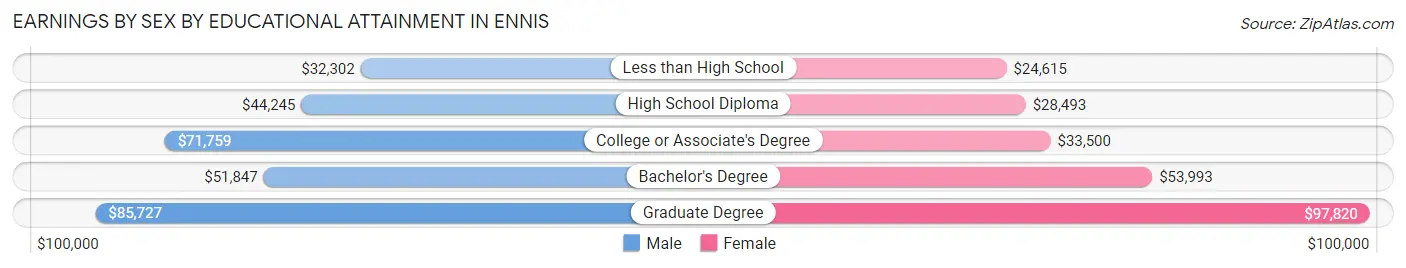
Earnings by Sex by Educational Attainment in Ennis
Average earnings in Ennis are $46,434 for men and $36,515 for women, a difference of 21.4%. Men with an educational attainment of graduate degree enjoy the highest average annual earnings of $85,727, while those with less than high school education earn the least with $32,302. Women with an educational attainment of graduate degree earn the most with the average annual earnings of $97,820, while those with less than high school education have the smallest earnings of $24,615.
| Educational Attainment | Male Income | Female Income |
| Less than High School | $32,302 | $24,615 |
| High School Diploma | $44,245 | $28,493 |
| College or Associate's Degree | $71,759 | $33,500 |
| Bachelor's Degree | $51,847 | $53,993 |
| Graduate Degree | $85,727 | $97,820 |
| Total | $46,434 | $36,515 |
Family Income in Ennis
Family Income Brackets in Ennis
According to the Ennis family income data, there are 1,649 families falling into the $100,000 to $149,999 income range, which is the most common income bracket and makes up 29.7% of all families. Conversely, the less than $10,000 income bracket is the least frequent group with only 44 families (0.8%) belonging to this category.
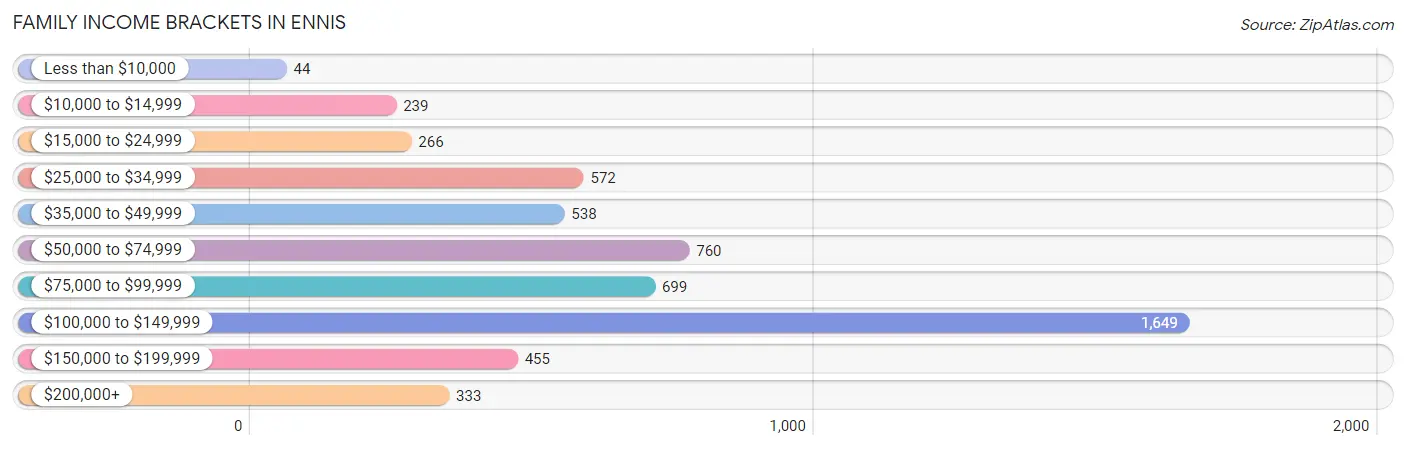
| Income Bracket | # Families | % Families |
| Less than $10,000 | 44 | 0.8% |
| $10,000 to $14,999 | 239 | 4.3% |
| $15,000 to $24,999 | 266 | 4.8% |
| $25,000 to $34,999 | 572 | 10.3% |
| $35,000 to $49,999 | 538 | 9.7% |
| $50,000 to $74,999 | 760 | 13.7% |
| $75,000 to $99,999 | 699 | 12.6% |
| $100,000 to $149,999 | 1,649 | 29.7% |
| $150,000 to $199,999 | 455 | 8.2% |
| $200,000+ | 333 | 6.0% |
Family Income by Famaliy Size in Ennis
4-person families (1,080 | 19.5%) account for the highest median family income in Ennis with $132,162 per family, while 2-person families (2,043 | 36.8%) have the highest median income of $34,930 per family member.
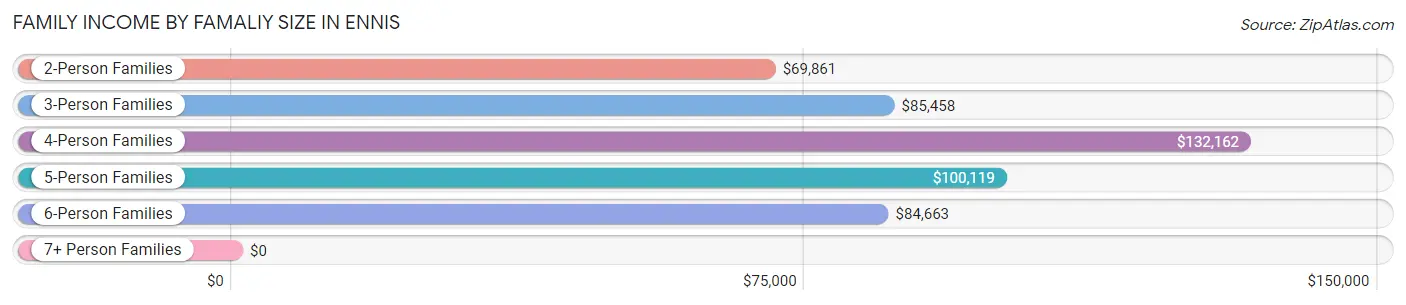
| Income Bracket | # Families | Median Income |
| 2-Person Families | 2,043 (36.8%) | $69,861 |
| 3-Person Families | 1,555 (28.0%) | $85,458 |
| 4-Person Families | 1,080 (19.5%) | $132,162 |
| 5-Person Families | 606 (10.9%) | $100,119 |
| 6-Person Families | 228 (4.1%) | $84,663 |
| 7+ Person Families | 39 (0.7%) | $0 |
| Total | 5,551 (100.0%) | $86,875 |
Family Income by Number of Earners in Ennis
The median family income in Ennis is $86,875, with families comprising 3+ earners (1,180) having the highest median family income of $140,988, while families with 1 earner (2,115) have the lowest median family income of $41,151, accounting for 21.3% and 38.1% of families, respectively.
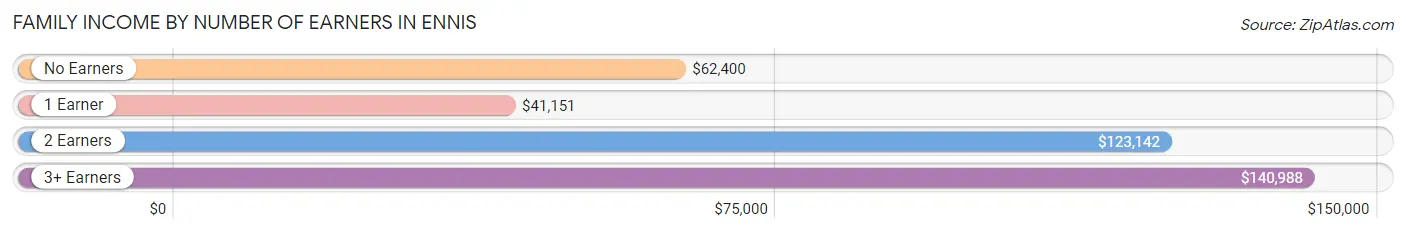
| Number of Earners | # Families | Median Income |
| No Earners | 304 (5.5%) | $62,400 |
| 1 Earner | 2,115 (38.1%) | $41,151 |
| 2 Earners | 1,952 (35.2%) | $123,142 |
| 3+ Earners | 1,180 (21.3%) | $140,988 |
| Total | 5,551 (100.0%) | $86,875 |
Household Income in Ennis
Household Income Brackets in Ennis
With 1,766 households falling in the category, the $100,000 to $149,999 income range is the most frequent in Ennis, accounting for 24.3% of all households. In contrast, only 94 households (1.3%) fall into the less than $10,000 income bracket, making it the least populous group.
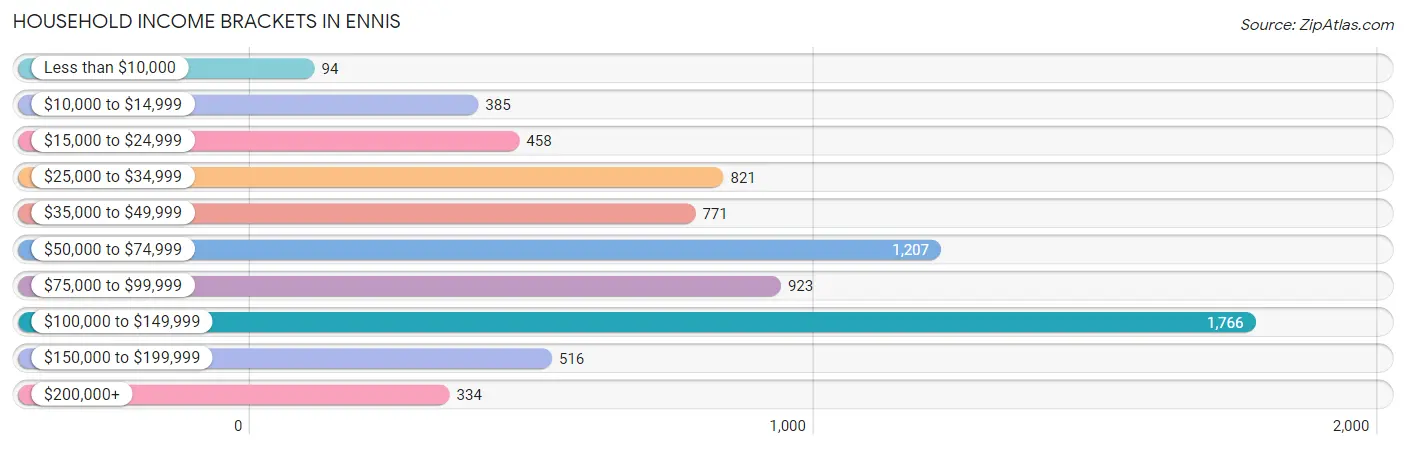
| Income Bracket | # Households | % Households |
| Less than $10,000 | 94 | 1.3% |
| $10,000 to $14,999 | 385 | 5.3% |
| $15,000 to $24,999 | 458 | 6.3% |
| $25,000 to $34,999 | 821 | 11.3% |
| $35,000 to $49,999 | 771 | 10.6% |
| $50,000 to $74,999 | 1,207 | 16.6% |
| $75,000 to $99,999 | 923 | 12.7% |
| $100,000 to $149,999 | 1,766 | 24.3% |
| $150,000 to $199,999 | 516 | 7.1% |
| $200,000+ | 334 | 4.6% |
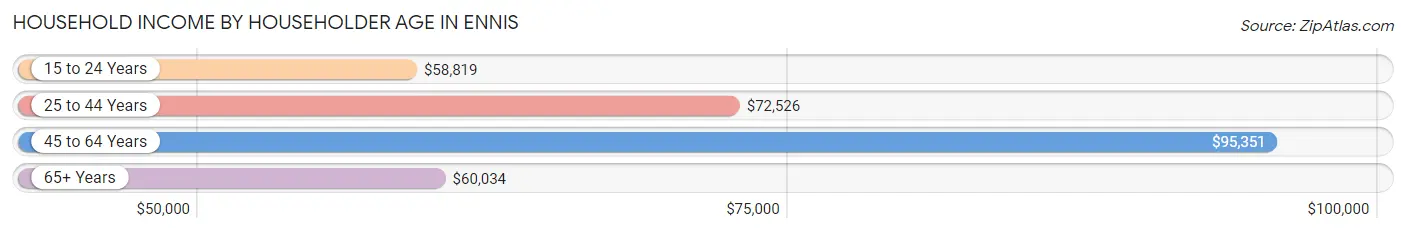
Household Income by Householder Age in Ennis
The median household income in Ennis is $73,176, with the highest median household income of $95,351 found in the 45 to 64 years age bracket for the primary householder. A total of 2,484 households (34.2%) fall into this category. Meanwhile, the 15 to 24 years age bracket for the primary householder has the lowest median household income of $58,819, with 242 households (3.3%) in this group.
| Income Bracket | # Households | Median Income |
| 15 to 24 Years | 242 (3.3%) | $58,819 |
| 25 to 44 Years | 3,046 (41.9%) | $72,526 |
| 45 to 64 Years | 2,484 (34.2%) | $95,351 |
| 65+ Years | 1,497 (20.6%) | $60,034 |
| Total | 7,269 (100.0%) | $73,176 |
Poverty in Ennis
Income Below Poverty by Sex and Age in Ennis
With 11.6% poverty level for males and 11.5% for females among the residents of Ennis, 5 year old males and 12 to 14 year old females are the most vulnerable to poverty, with 136 males (86.1%) and 127 females (26.4%) in their respective age groups living below the poverty level.
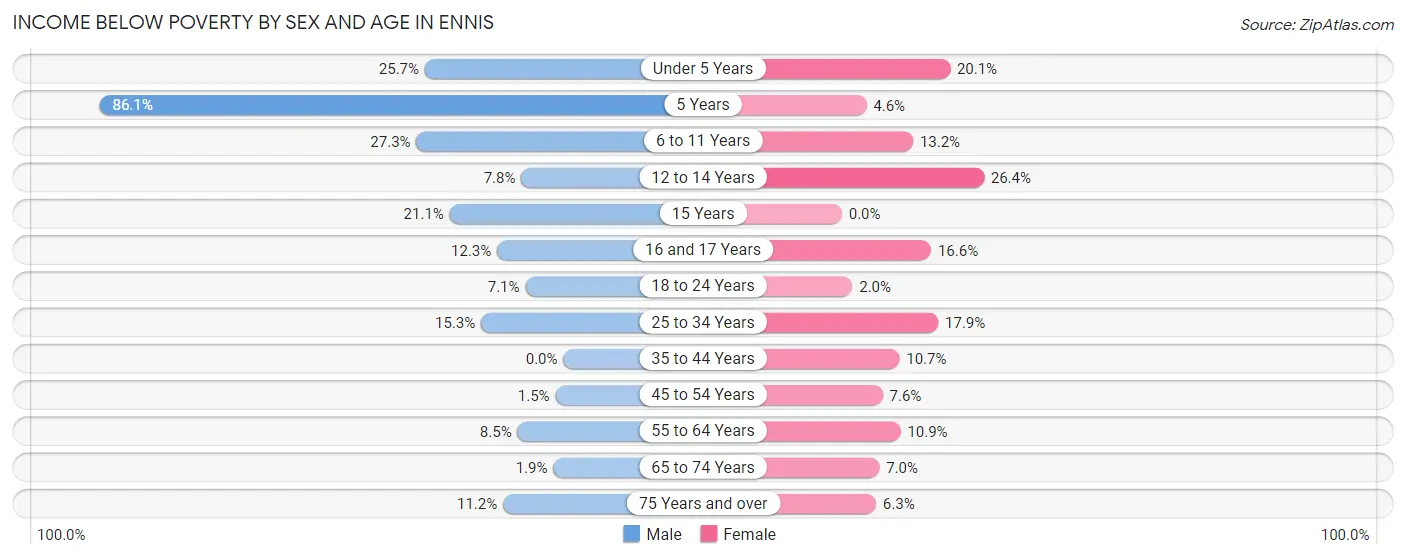
| Age Bracket | Male | Female |
| Under 5 Years | 180 (25.7%) | 113 (20.1%) |
| 5 Years | 136 (86.1%) | 5 (4.5%) |
| 6 to 11 Years | 255 (27.3%) | 88 (13.2%) |
| 12 to 14 Years | 43 (7.8%) | 127 (26.4%) |
| 15 Years | 73 (21.1%) | 0 (0.0%) |
| 16 and 17 Years | 47 (12.3%) | 24 (16.6%) |
| 18 to 24 Years | 97 (7.0%) | 20 (1.9%) |
| 25 to 34 Years | 214 (15.3%) | 314 (17.9%) |
| 35 to 44 Years | 0 (0.0%) | 148 (10.7%) |
| 45 to 54 Years | 14 (1.5%) | 90 (7.6%) |
| 55 to 64 Years | 101 (8.5%) | 150 (10.9%) |
| 65 to 74 Years | 14 (1.9%) | 55 (7.0%) |
| 75 Years and over | 16 (11.2%) | 36 (6.3%) |
| Total | 1,190 (11.6%) | 1,170 (11.5%) |
Income Above Poverty by Sex and Age in Ennis
According to the poverty statistics in Ennis, males aged 35 to 44 years and females aged 15 years are the age groups that are most secure financially, with 100.0% of males and 100.0% of females in these age groups living above the poverty line.
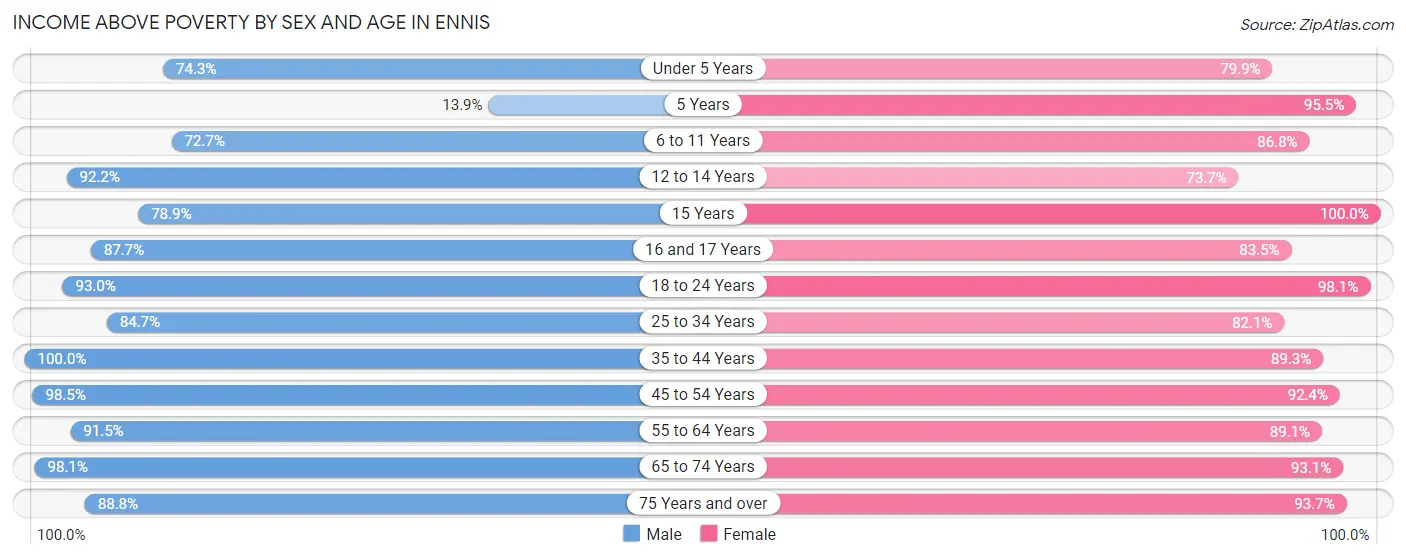
| Age Bracket | Male | Female |
| Under 5 Years | 520 (74.3%) | 450 (79.9%) |
| 5 Years | 22 (13.9%) | 105 (95.5%) |
| 6 to 11 Years | 680 (72.7%) | 578 (86.8%) |
| 12 to 14 Years | 508 (92.2%) | 355 (73.7%) |
| 15 Years | 273 (78.9%) | 134 (100.0%) |
| 16 and 17 Years | 335 (87.7%) | 121 (83.5%) |
| 18 to 24 Years | 1,278 (92.9%) | 1,004 (98.1%) |
| 25 to 34 Years | 1,188 (84.7%) | 1,442 (82.1%) |
| 35 to 44 Years | 1,368 (100.0%) | 1,239 (89.3%) |
| 45 to 54 Years | 936 (98.5%) | 1,099 (92.4%) |
| 55 to 64 Years | 1,086 (91.5%) | 1,228 (89.1%) |
| 65 to 74 Years | 733 (98.1%) | 736 (93.0%) |
| 75 Years and over | 127 (88.8%) | 533 (93.7%) |
| Total | 9,054 (88.4%) | 9,024 (88.5%) |
Income Below Poverty Among Married-Couple Families in Ennis
The poverty statistics for married-couple families in Ennis show that 5.7% or 213 of the total 3,756 families live below the poverty line. Families with 3 or 4 children have the highest poverty rate of 15.9%, comprising of 57 families. On the other hand, families with no children have the lowest poverty rate of 2.4%, which includes 51 families.
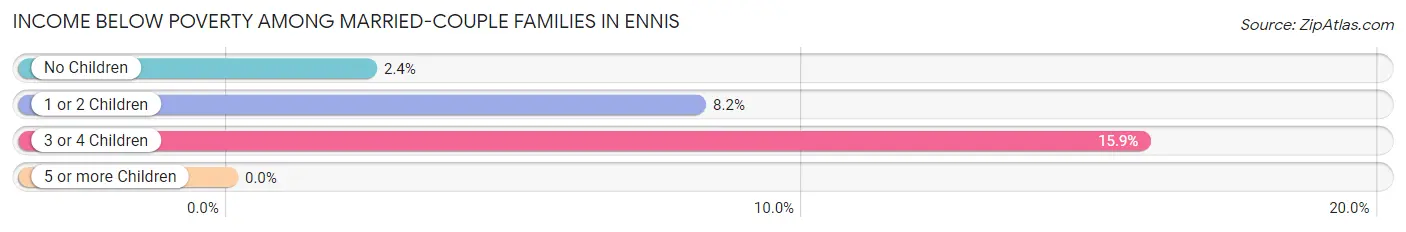
| Children | Above Poverty | Below Poverty |
| No Children | 2,058 (97.6%) | 51 (2.4%) |
| 1 or 2 Children | 1,183 (91.8%) | 105 (8.2%) |
| 3 or 4 Children | 302 (84.1%) | 57 (15.9%) |
| 5 or more Children | 0 (0.0%) | 0 (0.0%) |
| Total | 3,543 (94.3%) | 213 (5.7%) |
Income Below Poverty Among Single-Parent Households in Ennis
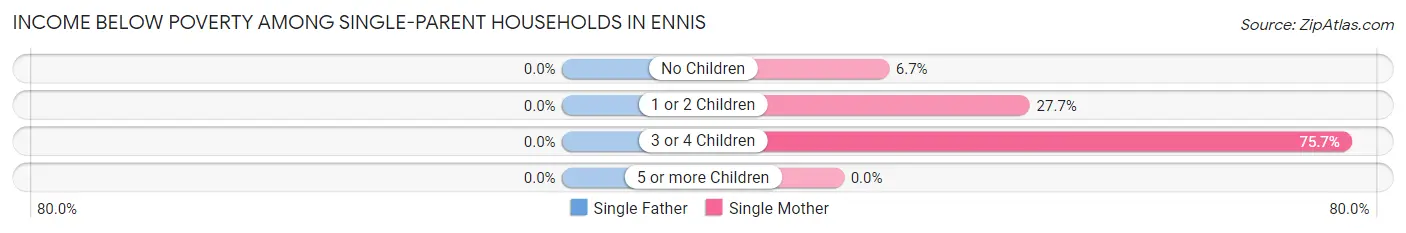
| Children | Single Father | Single Mother |
| No Children | 0 (0.0%) | 30 (6.7%) |
| 1 or 2 Children | 0 (0.0%) | 281 (27.7%) |
| 3 or 4 Children | 0 (0.0%) | 56 (75.7%) |
| 5 or more Children | 0 (0.0%) | 0 (0.0%) |
| Total | 0 (0.0%) | 367 (23.9%) |
Income Below Poverty Among Married-Couple vs Single-Parent Households in Ennis
The poverty data for Ennis shows that 213 of the married-couple family households (5.7%) and 367 of the single-parent households (20.4%) are living below the poverty level. Within the married-couple family households, those with 3 or 4 children have the highest poverty rate, with 57 households (15.9%) falling below the poverty line. Among the single-parent households, those with 3 or 4 children have the highest poverty rate, with 56 household (75.7%) living below poverty.
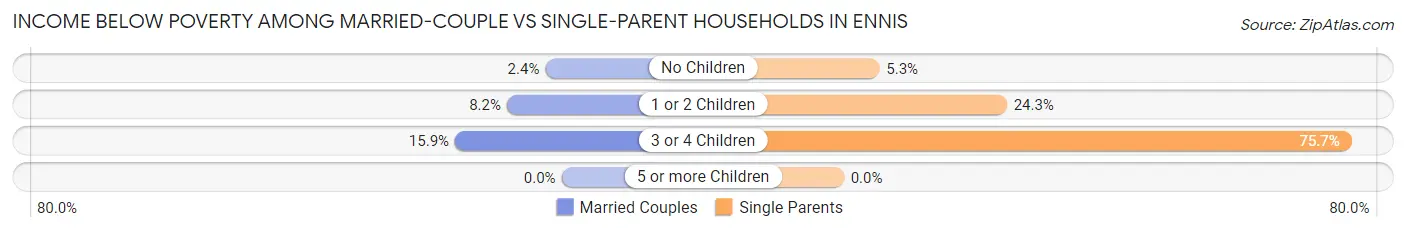
| Children | Married-Couple Families | Single-Parent Households |
| No Children | 51 (2.4%) | 30 (5.3%) |
| 1 or 2 Children | 105 (8.2%) | 281 (24.3%) |
| 3 or 4 Children | 57 (15.9%) | 56 (75.7%) |
| 5 or more Children | 0 (0.0%) | 0 (0.0%) |
| Total | 213 (5.7%) | 367 (20.4%) |
Race in Ennis
The most populous races in Ennis are White / Caucasian (13,634 | 65.8%), Hispanic or Latino (9,886 | 47.7%), and Two or more Races (2,694 | 13.0%).
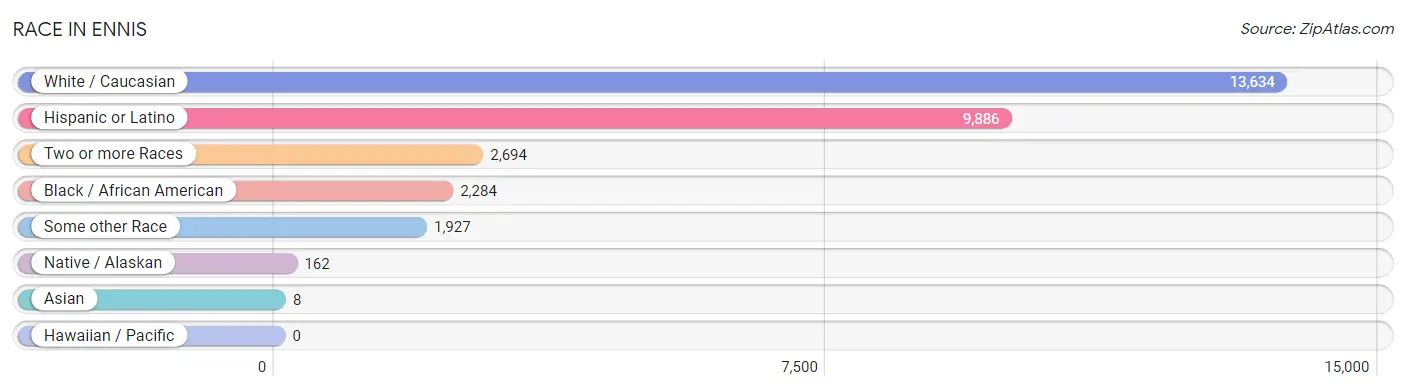
| Race | # Population | % Population |
| Asian | 8 | 0.0% |
| Black / African American | 2,284 | 11.0% |
| Hawaiian / Pacific | 0 | 0.0% |
| Hispanic or Latino | 9,886 | 47.7% |
| Native / Alaskan | 162 | 0.8% |
| White / Caucasian | 13,634 | 65.8% |
| Two or more Races | 2,694 | 13.0% |
| Some other Race | 1,927 | 9.3% |
| Total | 20,709 | 100.0% |
Ancestry in Ennis
The most populous ancestries reported in Ennis are Mexican (8,902 | 43.0%), German (1,403 | 6.8%), American (1,102 | 5.3%), English (1,059 | 5.1%), and Czech (822 | 4.0%), together accounting for 64.2% of all Ennis residents.
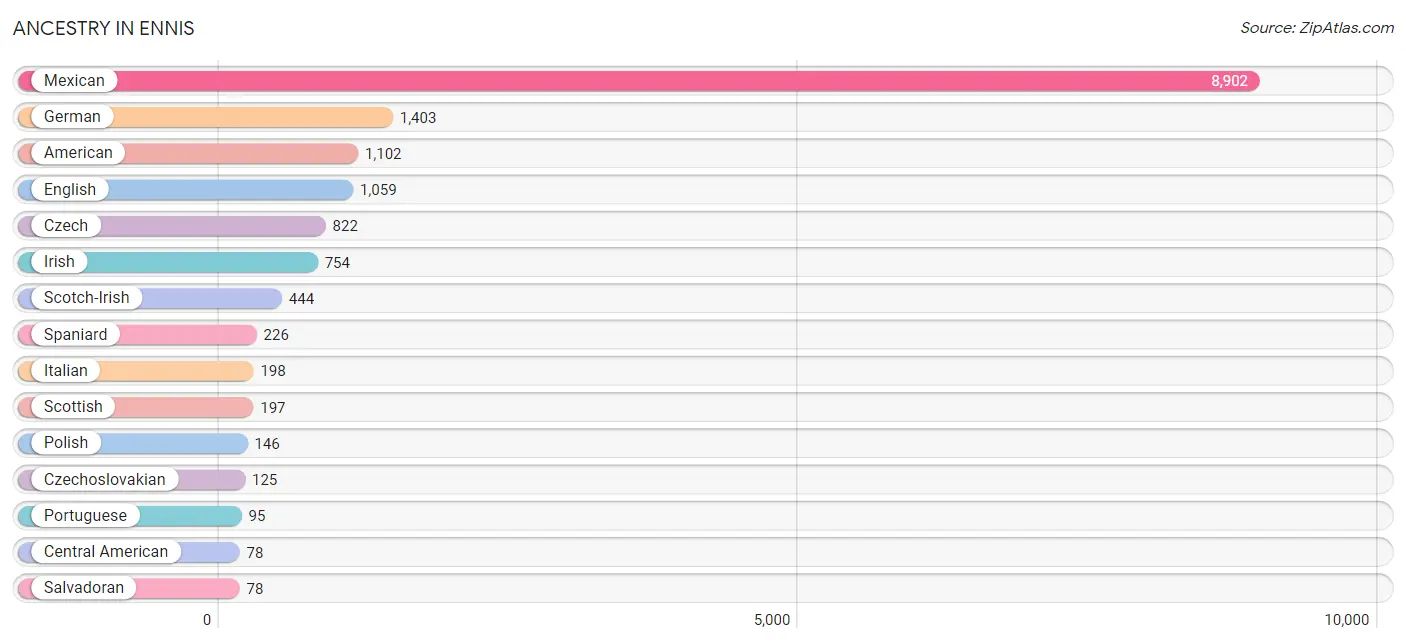
| Ancestry | # Population | % Population |
| American | 1,102 | 5.3% |
| Apache | 22 | 0.1% |
| Australian | 38 | 0.2% |
| Bhutanese | 70 | 0.3% |
| Blackfeet | 24 | 0.1% |
| Cajun | 4 | 0.0% |
| Central American | 78 | 0.4% |
| Cherokee | 36 | 0.2% |
| Chickasaw | 6 | 0.0% |
| Choctaw | 8 | 0.0% |
| Colombian | 2 | 0.0% |
| Croatian | 27 | 0.1% |
| Czech | 822 | 4.0% |
| Czechoslovakian | 125 | 0.6% |
| Danish | 10 | 0.1% |
| Dutch | 58 | 0.3% |
| Eastern European | 5 | 0.0% |
| English | 1,059 | 5.1% |
| European | 54 | 0.3% |
| French | 22 | 0.1% |
| German | 1,403 | 6.8% |
| Irish | 754 | 3.6% |
| Italian | 198 | 1.0% |
| Mexican | 8,902 | 43.0% |
| Mexican American Indian | 5 | 0.0% |
| Nigerian | 8 | 0.0% |
| Norwegian | 13 | 0.1% |
| Polish | 146 | 0.7% |
| Portuguese | 95 | 0.5% |
| Puerto Rican | 19 | 0.1% |
| Russian | 18 | 0.1% |
| Salvadoran | 78 | 0.4% |
| Samoan | 14 | 0.1% |
| Scandinavian | 39 | 0.2% |
| Scotch-Irish | 444 | 2.1% |
| Scottish | 197 | 0.9% |
| Slovak | 44 | 0.2% |
| South American | 52 | 0.3% |
| Spaniard | 226 | 1.1% |
| Spanish | 48 | 0.2% |
| Sri Lankan | 8 | 0.0% |
| Subsaharan African | 8 | 0.0% |
| Swedish | 55 | 0.3% |
| Swiss | 21 | 0.1% |
| Thai | 8 | 0.0% |
| Venezuelan | 50 | 0.2% |
| Welsh | 22 | 0.1% |
| West Indian | 31 | 0.2% | View All 48 Rows |
Immigrants in Ennis
The most numerous immigrant groups reported in Ennis came from Latin America (3,298 | 15.9%), Central America (3,091 | 14.9%), Mexico (3,077 | 14.9%), South America (147 | 0.7%), and Brazil (95 | 0.5%), together accounting for 46.9% of all Ennis residents.
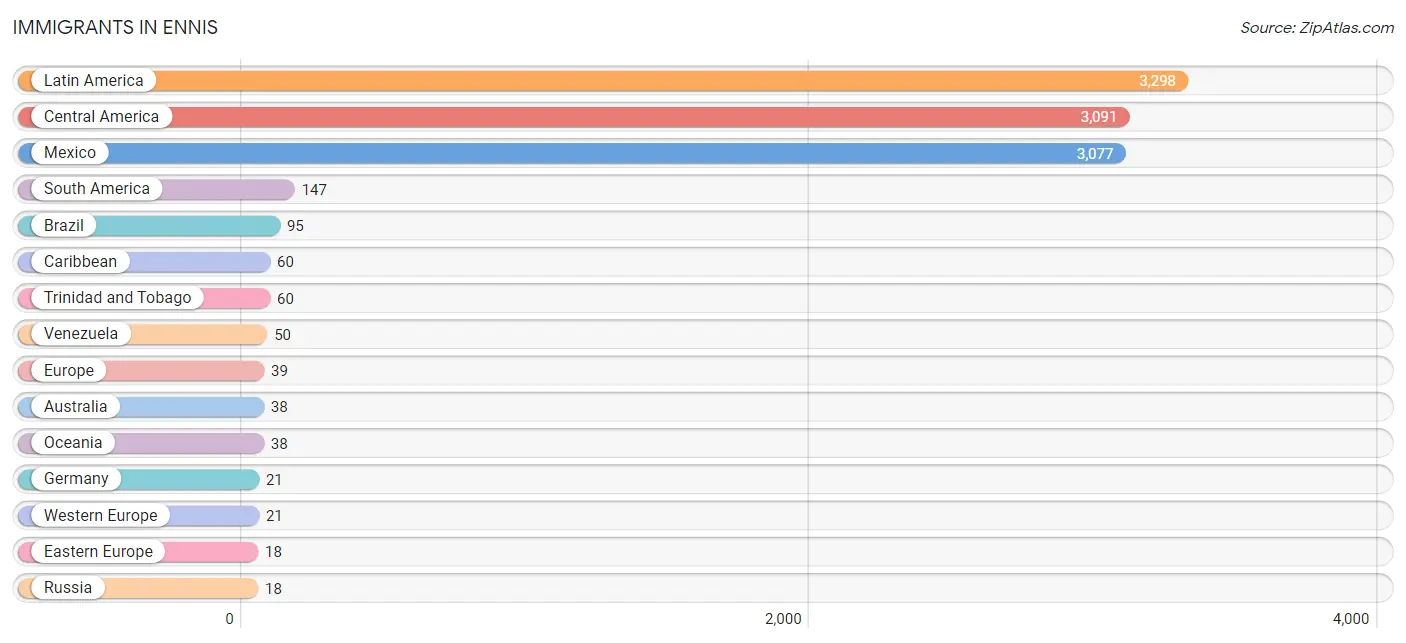
| Immigration Origin | # Population | % Population |
| Africa | 16 | 0.1% |
| Asia | 8 | 0.0% |
| Australia | 38 | 0.2% |
| Brazil | 95 | 0.5% |
| Canada | 9 | 0.0% |
| Caribbean | 60 | 0.3% |
| Central America | 3,091 | 14.9% |
| Colombia | 2 | 0.0% |
| Eastern Africa | 8 | 0.0% |
| Eastern Europe | 18 | 0.1% |
| El Salvador | 14 | 0.1% |
| Europe | 39 | 0.2% |
| Germany | 21 | 0.1% |
| Latin America | 3,298 | 15.9% |
| Mexico | 3,077 | 14.9% |
| Nigeria | 8 | 0.0% |
| Oceania | 38 | 0.2% |
| Russia | 18 | 0.1% |
| South America | 147 | 0.7% |
| South Eastern Asia | 8 | 0.0% |
| Trinidad and Tobago | 60 | 0.3% |
| Venezuela | 50 | 0.2% |
| Vietnam | 8 | 0.0% |
| Western Africa | 8 | 0.0% |
| Western Europe | 21 | 0.1% | View All 25 Rows |
Sex and Age in Ennis
Sex and Age in Ennis
The most populous age groups in Ennis are 20 to 24 Years (1,067 | 10.3%) for men and 30 to 34 Years (966 | 9.3%) for women.
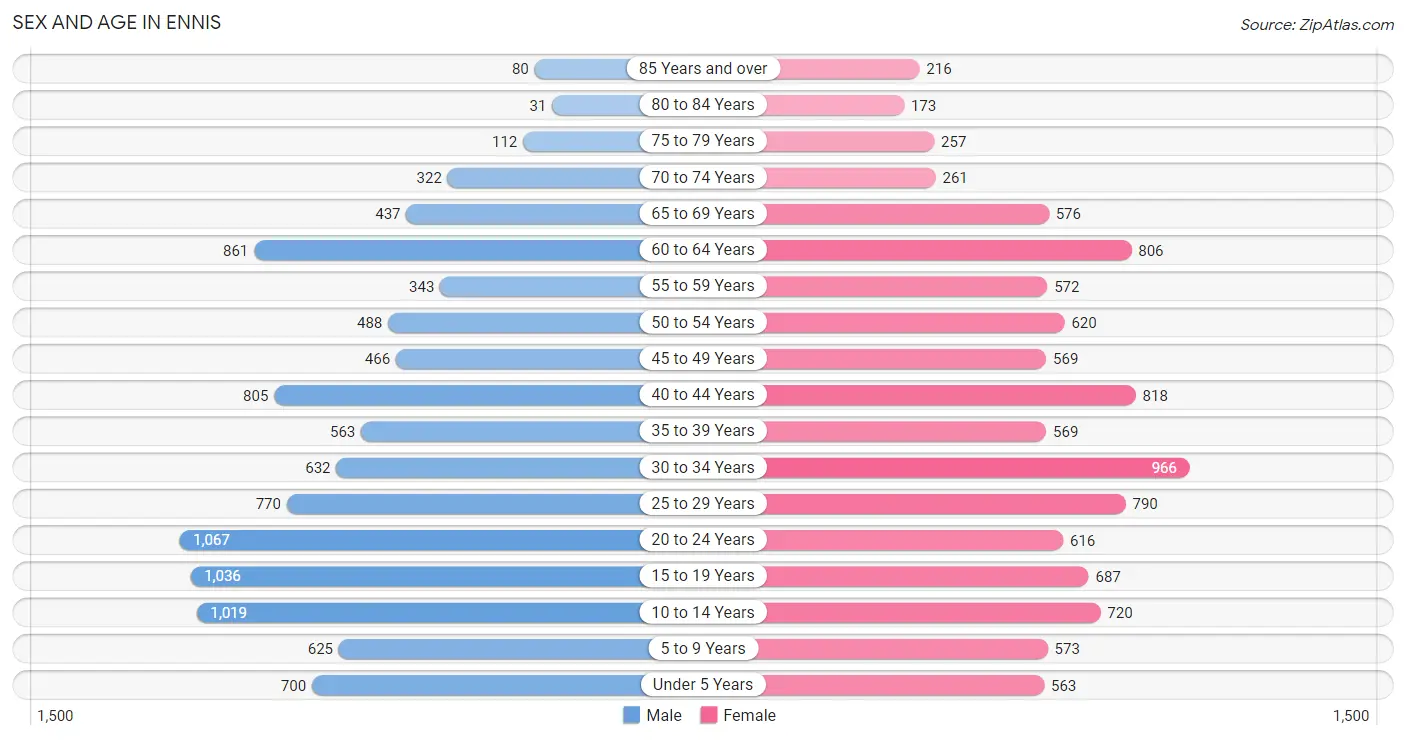
| Age Bracket | Male | Female |
| Under 5 Years | 700 (6.8%) | 563 (5.4%) |
| 5 to 9 Years | 625 (6.0%) | 573 (5.5%) |
| 10 to 14 Years | 1,019 (9.8%) | 720 (7.0%) |
| 15 to 19 Years | 1,036 (10.0%) | 687 (6.6%) |
| 20 to 24 Years | 1,067 (10.3%) | 616 (5.9%) |
| 25 to 29 Years | 770 (7.4%) | 790 (7.6%) |
| 30 to 34 Years | 632 (6.1%) | 966 (9.3%) |
| 35 to 39 Years | 563 (5.4%) | 569 (5.5%) |
| 40 to 44 Years | 805 (7.8%) | 818 (7.9%) |
| 45 to 49 Years | 466 (4.5%) | 569 (5.5%) |
| 50 to 54 Years | 488 (4.7%) | 620 (6.0%) |
| 55 to 59 Years | 343 (3.3%) | 572 (5.5%) |
| 60 to 64 Years | 861 (8.3%) | 806 (7.8%) |
| 65 to 69 Years | 437 (4.2%) | 576 (5.6%) |
| 70 to 74 Years | 322 (3.1%) | 261 (2.5%) |
| 75 to 79 Years | 112 (1.1%) | 257 (2.5%) |
| 80 to 84 Years | 31 (0.3%) | 173 (1.7%) |
| 85 Years and over | 80 (0.8%) | 216 (2.1%) |
| Total | 10,357 (100.0%) | 10,352 (100.0%) |
Families and Households in Ennis
Median Family Size in Ennis
The median family size in Ennis is 3.27 persons per family, with married-couple families (3,756 | 67.7%) accounting for the largest median family size of 3.41 persons per family. On the other hand, single female/mother families (1,534 | 27.6%) represent the smallest median family size with 2.98 persons per family.
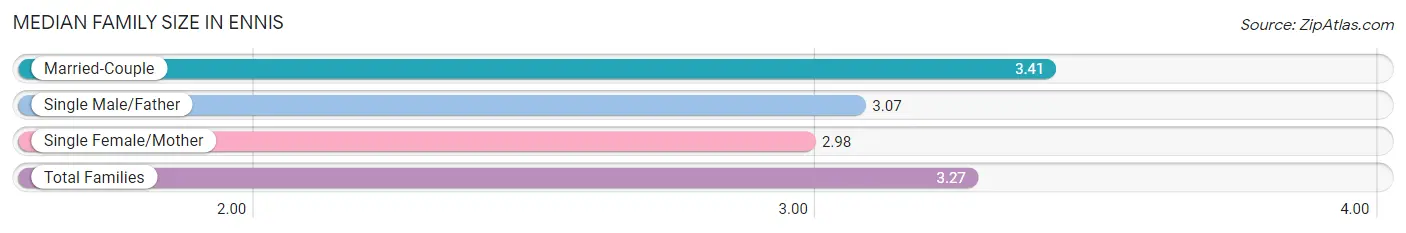
| Family Type | # Families | Family Size |
| Married-Couple | 3,756 (67.7%) | 3.41 |
| Single Male/Father | 261 (4.7%) | 3.07 |
| Single Female/Mother | 1,534 (27.6%) | 2.98 |
| Total Families | 5,551 (100.0%) | 3.27 |
Median Household Size in Ennis
The median household size in Ennis is 2.82 persons per household, with married-couple households (3,756 | 51.7%) accounting for the largest median household size of 3.43 persons per household. non-family households (1,718 | 23.6%) represent the smallest median household size with 1.17 persons per household.
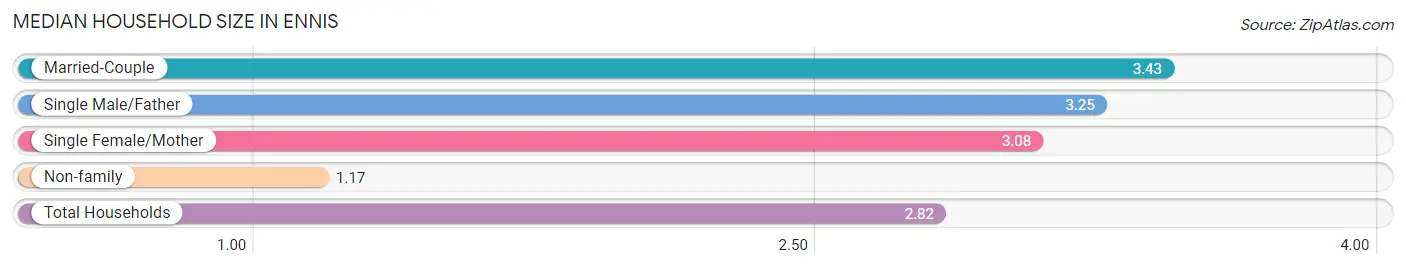
| Household Type | # Households | Household Size |
| Married-Couple | 3,756 (51.7%) | 3.43 |
| Single Male/Father | 261 (3.6%) | 3.25 |
| Single Female/Mother | 1,534 (21.1%) | 3.08 |
| Non-family | 1,718 (23.6%) | 1.17 |
| Total Households | 7,269 (100.0%) | 2.82 |
Household Size by Marriage Status in Ennis
Out of a total of 7,269 households in Ennis, 5,551 (76.4%) are family households, while 1,718 (23.6%) are nonfamily households. The most numerous type of family households are 2-person households, comprising 1,930, and the most common type of nonfamily households are 1-person households, comprising 1,462.
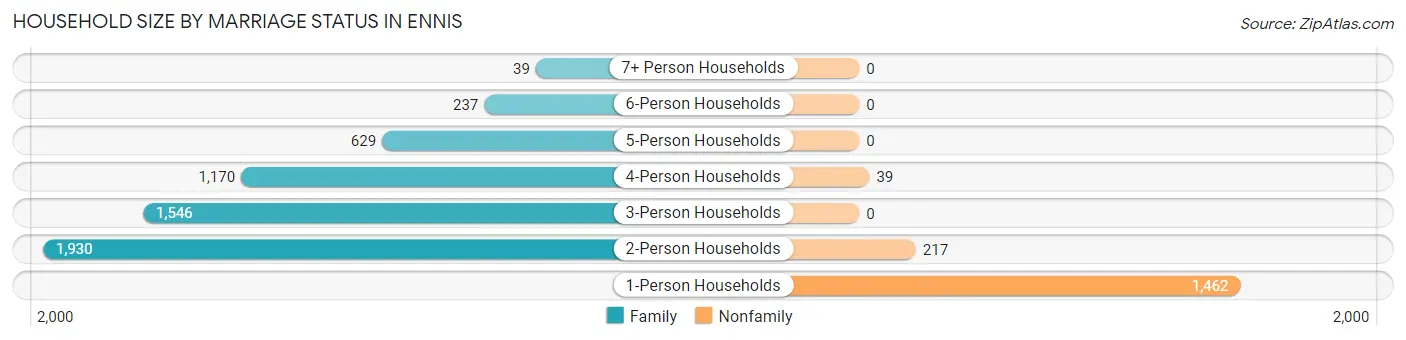
| Household Size | Family Households | Nonfamily Households |
| 1-Person Households | - | 1,462 (20.1%) |
| 2-Person Households | 1,930 (26.6%) | 217 (3.0%) |
| 3-Person Households | 1,546 (21.3%) | 0 (0.0%) |
| 4-Person Households | 1,170 (16.1%) | 39 (0.5%) |
| 5-Person Households | 629 (8.6%) | 0 (0.0%) |
| 6-Person Households | 237 (3.3%) | 0 (0.0%) |
| 7+ Person Households | 39 (0.5%) | 0 (0.0%) |
| Total | 5,551 (76.4%) | 1,718 (23.6%) |
Female Fertility in Ennis
Fertility by Age in Ennis
Average fertility rate in Ennis is 88.0 births per 1,000 women. Women in the age bracket of 20 to 34 years have the highest fertility rate with 164.0 births per 1,000 women. Women in the age bracket of 20 to 34 years acount for 87.4% of all women with births.
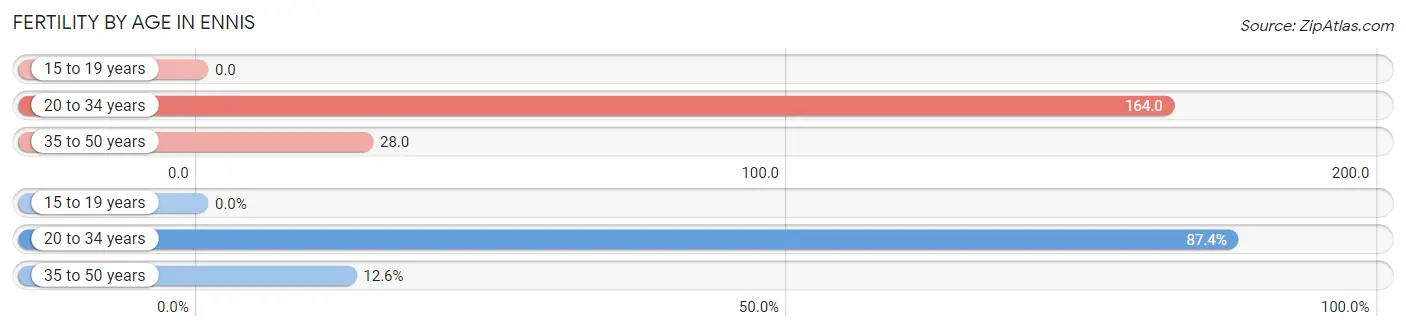
| Age Bracket | Women with Births | Births / 1,000 Women |
| 15 to 19 years | 0 (0.0%) | 0.0 |
| 20 to 34 years | 389 (87.4%) | 164.0 |
| 35 to 50 years | 56 (12.6%) | 28.0 |
| Total | 445 (100.0%) | 88.0 |
Fertility by Age by Marriage Status in Ennis
87.4% of women with births (445) in Ennis are married. The highest percentage of unmarried women with births falls into 20 to 34 years age bracket with 14.4% of them unmarried at the time of birth, while the lowest percentage of unmarried women with births belong to 35 to 50 years age bracket with 0.0% of them unmarried.
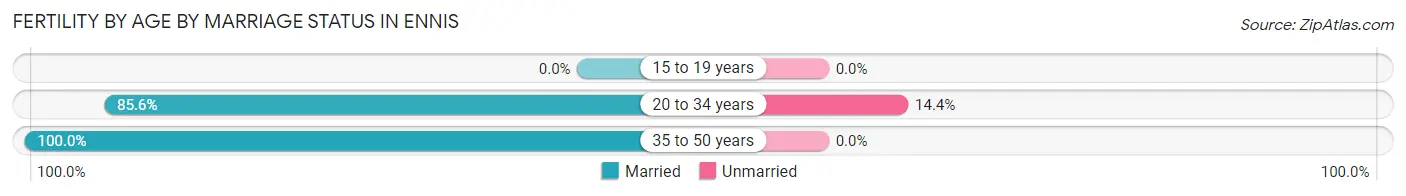
| Age Bracket | Married | Unmarried |
| 15 to 19 years | 0 (0.0%) | 0 (0.0%) |
| 20 to 34 years | 333 (85.6%) | 56 (14.4%) |
| 35 to 50 years | 56 (100.0%) | 0 (0.0%) |
| Total | 389 (87.4%) | 56 (12.6%) |
Fertility by Education in Ennis

| Educational Attainment | Women with Births | Births / 1,000 Women |
| Less than High School | 41 (9.2%) | 48.0 |
| High School Diploma | 147 (33.0%) | 110.0 |
| College or Associate's Degree | 24 (5.4%) | 16.0 |
| Bachelor's Degree | 233 (52.4%) | 207.0 |
| Graduate Degree | 0 (0.0%) | 0.0 |
| Total | 445 (100.0%) | 88.0 |
Fertility by Education by Marriage Status in Ennis
12.6% of women with births in Ennis are unmarried. Women with the educational attainment of less than high school are most likely to be married with 100.0% of them married at childbirth, while women with the educational attainment of college or associate's degree are least likely to be married with 29.2% of them unmarried at childbirth.
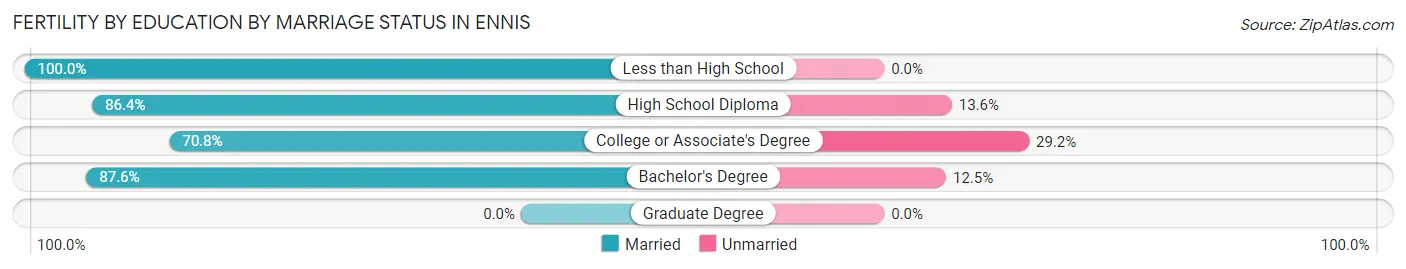
| Educational Attainment | Married | Unmarried |
| Less than High School | 41 (100.0%) | 0 (0.0%) |
| High School Diploma | 127 (86.4%) | 20 (13.6%) |
| College or Associate's Degree | 17 (70.8%) | 7 (29.2%) |
| Bachelor's Degree | 204 (87.5%) | 29 (12.4%) |
| Graduate Degree | 0 (0.0%) | 0 (0.0%) |
| Total | 389 (87.4%) | 56 (12.6%) |
Employment Characteristics in Ennis
Employment by Class of Employer in Ennis
Among the 10,714 employed individuals in Ennis, private company employees (7,463 | 69.7%), local government employees (1,018 | 9.5%), and self-employed (not incorporated) (812 | 7.6%) make up the most common classes of employment.
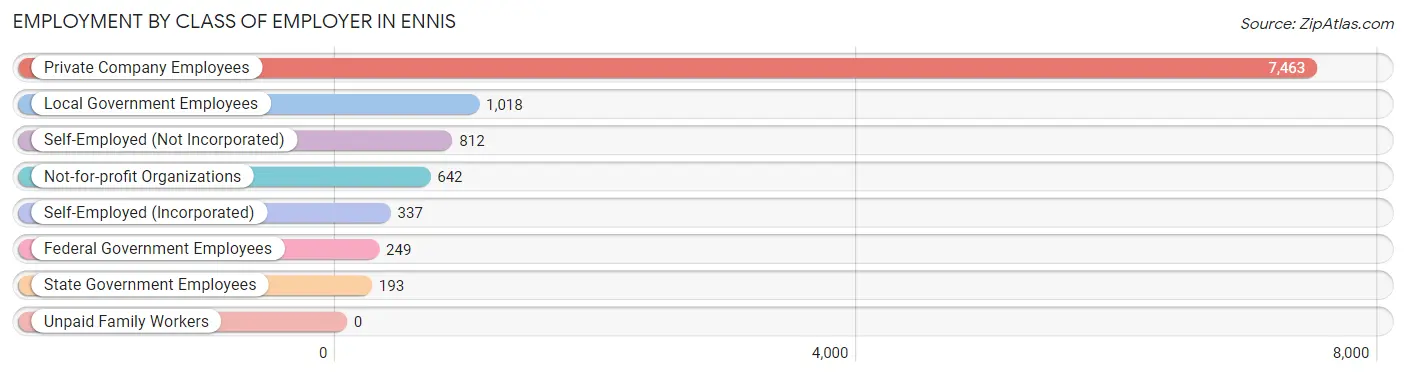
| Employer Class | # Employees | % Employees |
| Private Company Employees | 7,463 | 69.7% |
| Self-Employed (Incorporated) | 337 | 3.2% |
| Self-Employed (Not Incorporated) | 812 | 7.6% |
| Not-for-profit Organizations | 642 | 6.0% |
| Local Government Employees | 1,018 | 9.5% |
| State Government Employees | 193 | 1.8% |
| Federal Government Employees | 249 | 2.3% |
| Unpaid Family Workers | 0 | 0.0% |
| Total | 10,714 | 100.0% |
Employment Status by Age in Ennis
According to the labor force statistics for Ennis, out of the total population over 16 years of age (16,029), 71.7% or 11,493 individuals are in the labor force, with 3.1% or 356 of them unemployed. The age group with the highest labor force participation rate is 35 to 44 years, with 91.9% or 2,532 individuals in the labor force. Within the labor force, the 16 to 19 years age range has the highest percentage of unemployed individuals, with 11.8% or 84 of them being unemployed.
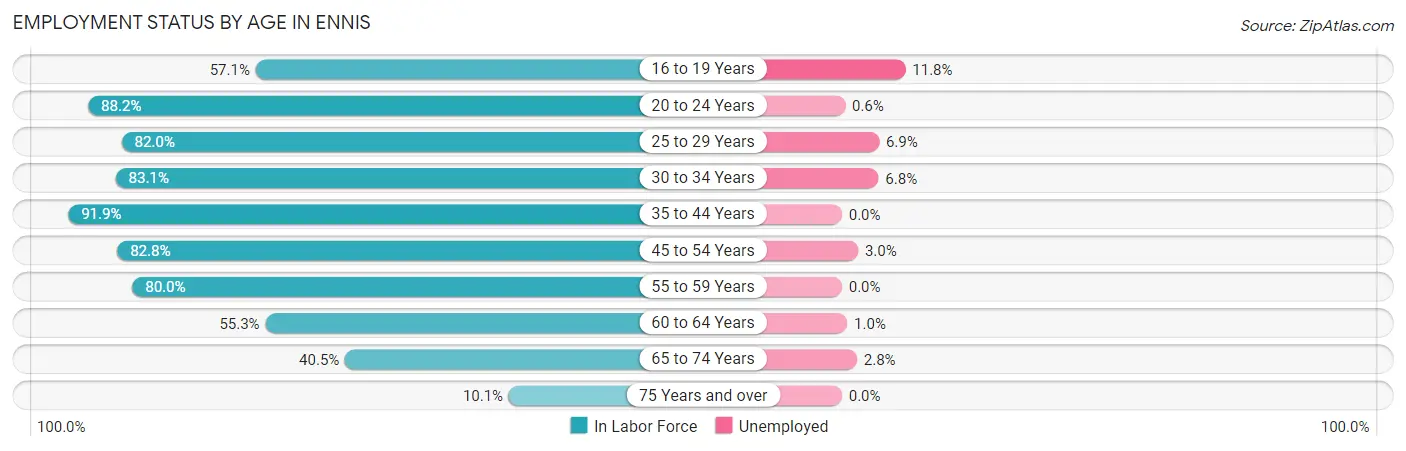
| Age Bracket | In Labor Force | Unemployed |
| 16 to 19 Years | 710 (57.1%) | 84 (11.8%) |
| 20 to 24 Years | 1,484 (88.2%) | 9 (0.6%) |
| 25 to 29 Years | 1,279 (82.0%) | 88 (6.9%) |
| 30 to 34 Years | 1,328 (83.1%) | 90 (6.8%) |
| 35 to 44 Years | 2,532 (91.9%) | 0 (0.0%) |
| 45 to 54 Years | 1,774 (82.8%) | 53 (3.0%) |
| 55 to 59 Years | 732 (80.0%) | 0 (0.0%) |
| 60 to 64 Years | 922 (55.3%) | 9 (1.0%) |
| 65 to 74 Years | 646 (40.5%) | 18 (2.8%) |
| 75 Years and over | 88 (10.1%) | 0 (0.0%) |
| Total | 11,493 (71.7%) | 356 (3.1%) |
Employment Status by Educational Attainment in Ennis
According to labor force statistics for Ennis, 80.5% of individuals (8,564) out of the total population between 25 and 64 years of age (10,638) are in the labor force, with 2.8% or 240 of them being unemployed. The group with the highest labor force participation rate are those with the educational attainment of bachelor's degree or higher, with 92.6% or 1,964 individuals in the labor force. Within the labor force, individuals with college / associate degree education have the highest percentage of unemployment, with 6.7% or 178 of them being unemployed.
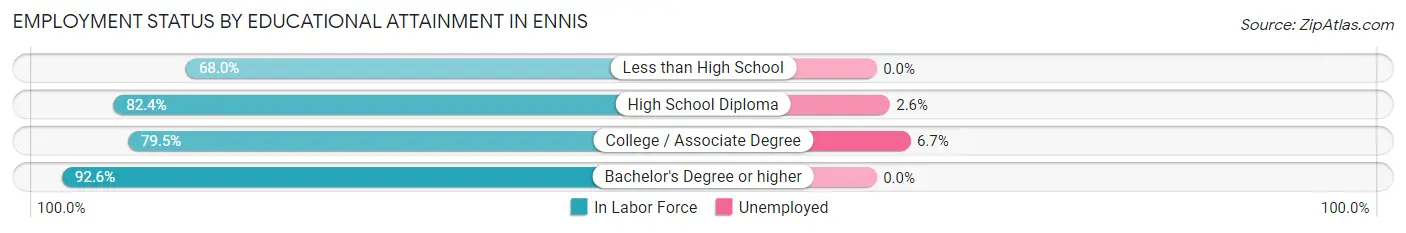
| Educational Attainment | In Labor Force | Unemployed |
| Less than High School | 1,501 (68.0%) | 0 (0.0%) |
| High School Diploma | 2,450 (82.4%) | 77 (2.6%) |
| College / Associate Degree | 2,653 (79.5%) | 224 (6.7%) |
| Bachelor's Degree or higher | 1,964 (92.6%) | 0 (0.0%) |
| Total | 8,564 (80.5%) | 298 (2.8%) |
Employment Occupations by Sex in Ennis
Management, Business, Science and Arts Occupations
The most common Management, Business, Science and Arts occupations in Ennis are Management (1,153 | 10.3%), Community & Social Service (679 | 6.1%), Health Diagnosing & Treating (548 | 4.9%), Education Instruction & Library (515 | 4.6%), and Health Technologists (413 | 3.7%).
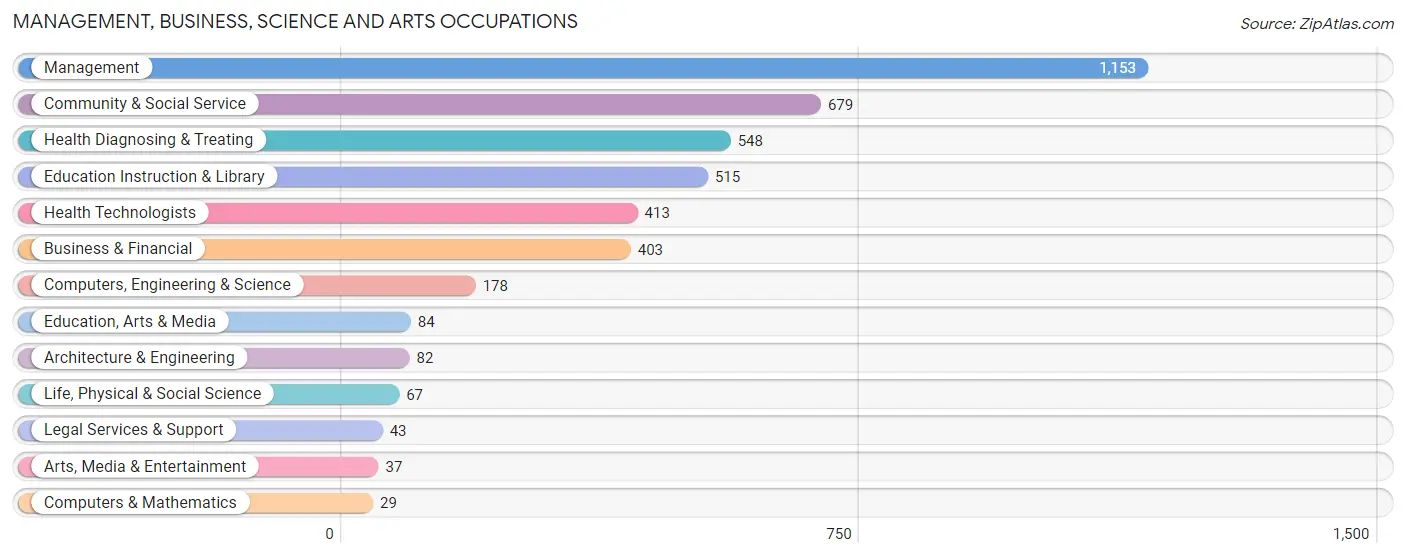
Management, Business, Science and Arts Occupations by Sex
Within the Management, Business, Science and Arts occupations in Ennis, the most male-oriented occupations are Architecture & Engineering (100.0%), Life, Physical & Social Science (100.0%), and Computers, Engineering & Science (86.5%), while the most female-oriented occupations are Health Diagnosing & Treating (85.6%), Computers & Mathematics (82.8%), and Education Instruction & Library (81.4%).
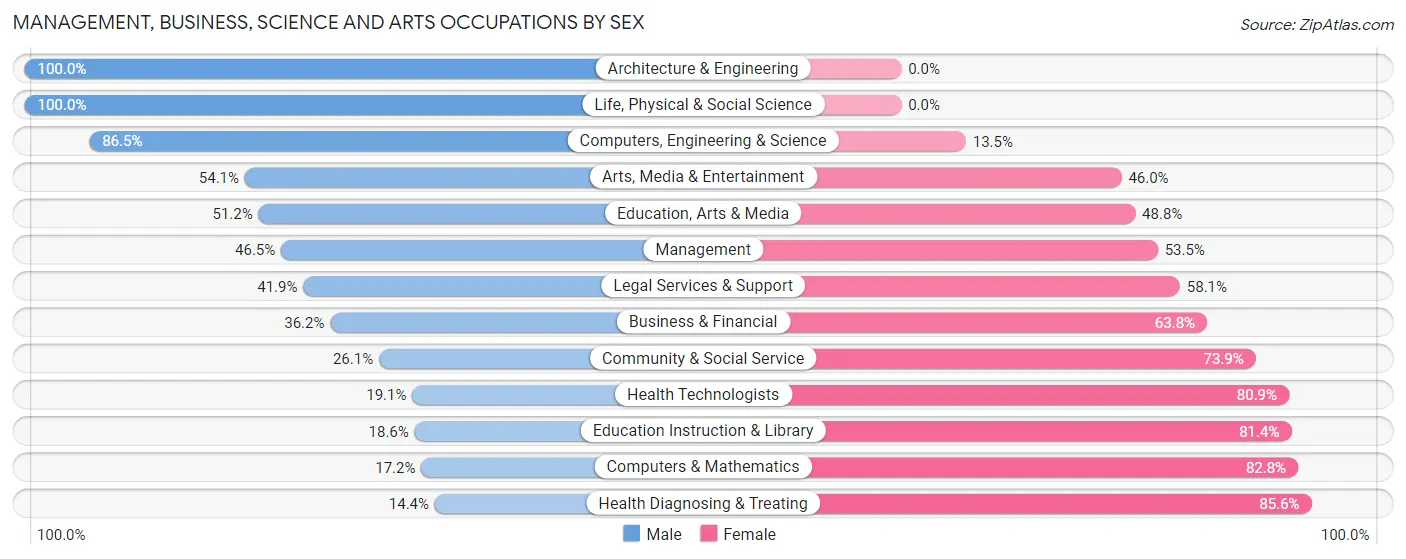
| Occupation | Male | Female |
| Management | 536 (46.5%) | 617 (53.5%) |
| Business & Financial | 146 (36.2%) | 257 (63.8%) |
| Computers, Engineering & Science | 154 (86.5%) | 24 (13.5%) |
| Computers & Mathematics | 5 (17.2%) | 24 (82.8%) |
| Architecture & Engineering | 82 (100.0%) | 0 (0.0%) |
| Life, Physical & Social Science | 67 (100.0%) | 0 (0.0%) |
| Community & Social Service | 177 (26.1%) | 502 (73.9%) |
| Education, Arts & Media | 43 (51.2%) | 41 (48.8%) |
| Legal Services & Support | 18 (41.9%) | 25 (58.1%) |
| Education Instruction & Library | 96 (18.6%) | 419 (81.4%) |
| Arts, Media & Entertainment | 20 (54.0%) | 17 (46.0%) |
| Health Diagnosing & Treating | 79 (14.4%) | 469 (85.6%) |
| Health Technologists | 79 (19.1%) | 334 (80.9%) |
| Total (Category) | 1,092 (36.9%) | 1,869 (63.1%) |
| Total (Overall) | 5,858 (52.6%) | 5,286 (47.4%) |
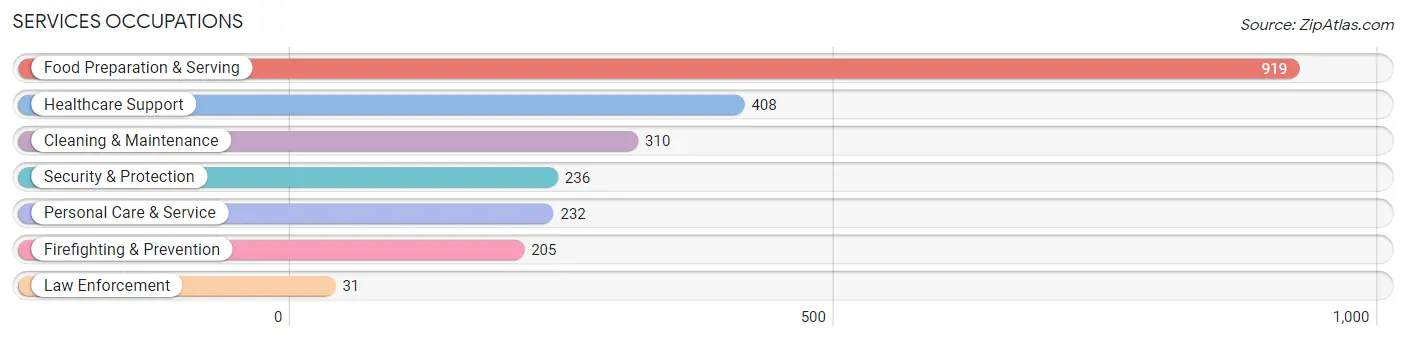
Services Occupations
The most common Services occupations in Ennis are Food Preparation & Serving (919 | 8.3%), Healthcare Support (408 | 3.7%), Cleaning & Maintenance (310 | 2.8%), Security & Protection (236 | 2.1%), and Personal Care & Service (232 | 2.1%).
Services Occupations by Sex
Within the Services occupations in Ennis, the most male-oriented occupations are Law Enforcement (100.0%), Security & Protection (86.9%), and Firefighting & Prevention (84.9%), while the most female-oriented occupations are Healthcare Support (100.0%), Personal Care & Service (95.7%), and Food Preparation & Serving (75.2%).
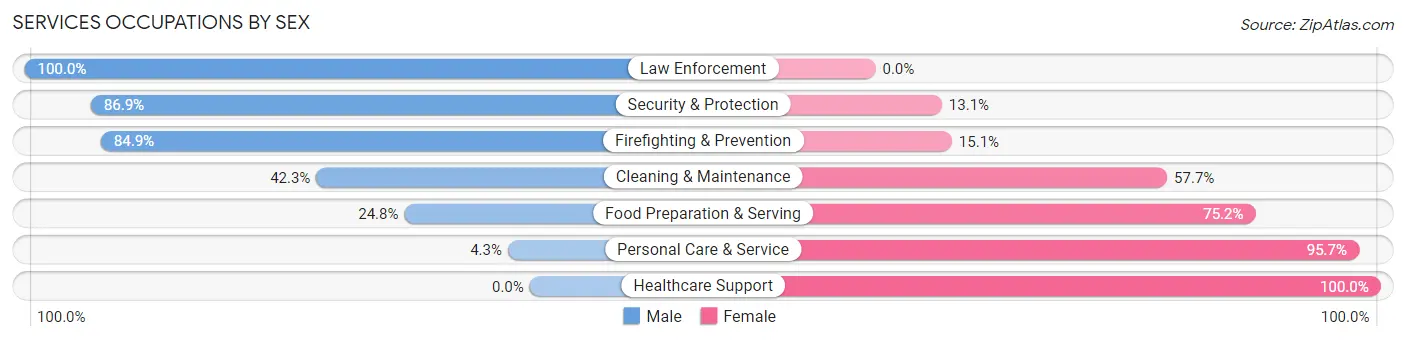
| Occupation | Male | Female |
| Healthcare Support | 0 (0.0%) | 408 (100.0%) |
| Security & Protection | 205 (86.9%) | 31 (13.1%) |
| Firefighting & Prevention | 174 (84.9%) | 31 (15.1%) |
| Law Enforcement | 31 (100.0%) | 0 (0.0%) |
| Food Preparation & Serving | 228 (24.8%) | 691 (75.2%) |
| Cleaning & Maintenance | 131 (42.3%) | 179 (57.7%) |
| Personal Care & Service | 10 (4.3%) | 222 (95.7%) |
| Total (Category) | 574 (27.3%) | 1,531 (72.7%) |
| Total (Overall) | 5,858 (52.6%) | 5,286 (47.4%) |
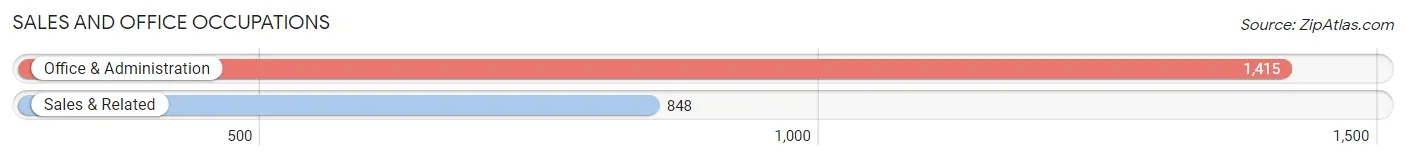
Sales and Office Occupations
The most common Sales and Office occupations in Ennis are Office & Administration (1,415 | 12.7%), and Sales & Related (848 | 7.6%).
Sales and Office Occupations by Sex
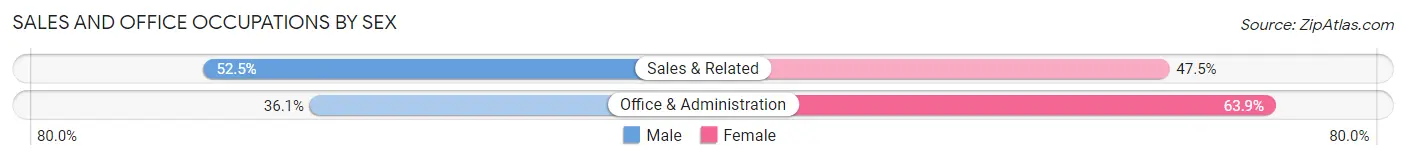
| Occupation | Male | Female |
| Sales & Related | 445 (52.5%) | 403 (47.5%) |
| Office & Administration | 511 (36.1%) | 904 (63.9%) |
| Total (Category) | 956 (42.2%) | 1,307 (57.8%) |
| Total (Overall) | 5,858 (52.6%) | 5,286 (47.4%) |
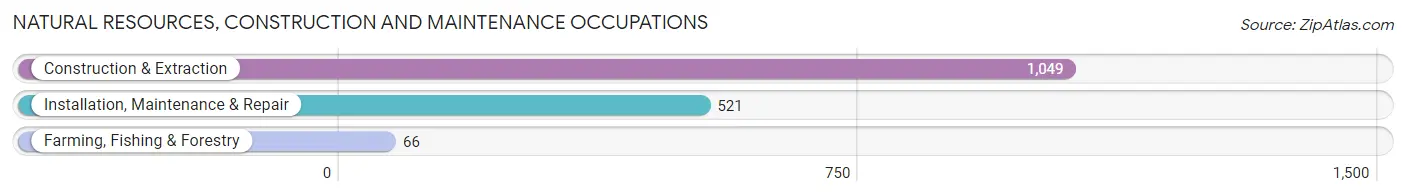
Natural Resources, Construction and Maintenance Occupations
The most common Natural Resources, Construction and Maintenance occupations in Ennis are Construction & Extraction (1,049 | 9.4%), Installation, Maintenance & Repair (521 | 4.7%), and Farming, Fishing & Forestry (66 | 0.6%).
Natural Resources, Construction and Maintenance Occupations by Sex
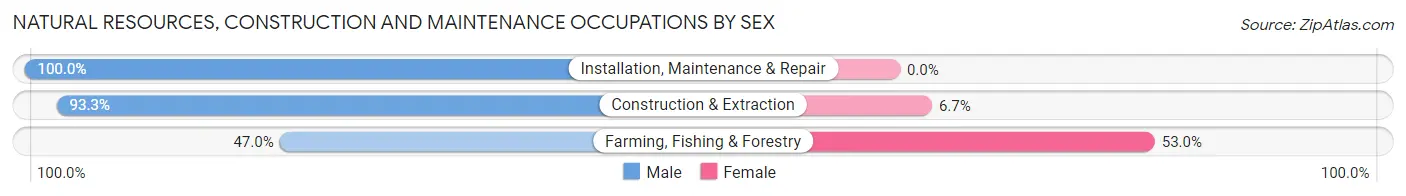
| Occupation | Male | Female |
| Farming, Fishing & Forestry | 31 (47.0%) | 35 (53.0%) |
| Construction & Extraction | 979 (93.3%) | 70 (6.7%) |
| Installation, Maintenance & Repair | 521 (100.0%) | 0 (0.0%) |
| Total (Category) | 1,531 (93.6%) | 105 (6.4%) |
| Total (Overall) | 5,858 (52.6%) | 5,286 (47.4%) |
Production, Transportation and Moving Occupations
The most common Production, Transportation and Moving occupations in Ennis are Production (1,069 | 9.6%), Transportation (588 | 5.3%), and Material Moving (522 | 4.7%).
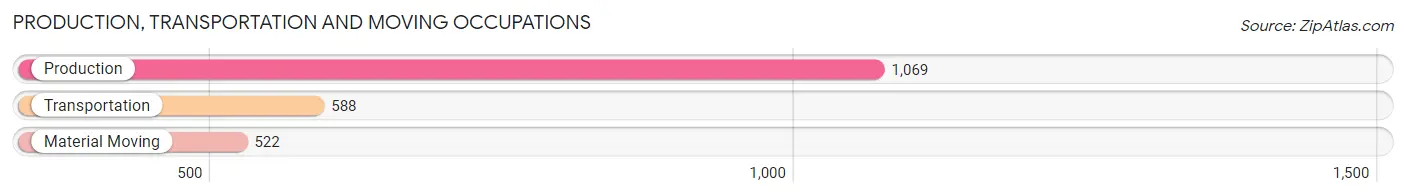
Production, Transportation and Moving Occupations by Sex
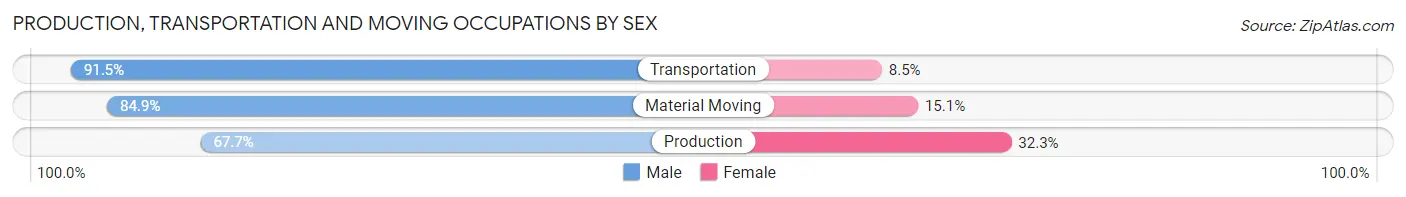
| Occupation | Male | Female |
| Production | 724 (67.7%) | 345 (32.3%) |
| Transportation | 538 (91.5%) | 50 (8.5%) |
| Material Moving | 443 (84.9%) | 79 (15.1%) |
| Total (Category) | 1,705 (78.2%) | 474 (21.7%) |
| Total (Overall) | 5,858 (52.6%) | 5,286 (47.4%) |
Employment Industries by Sex in Ennis
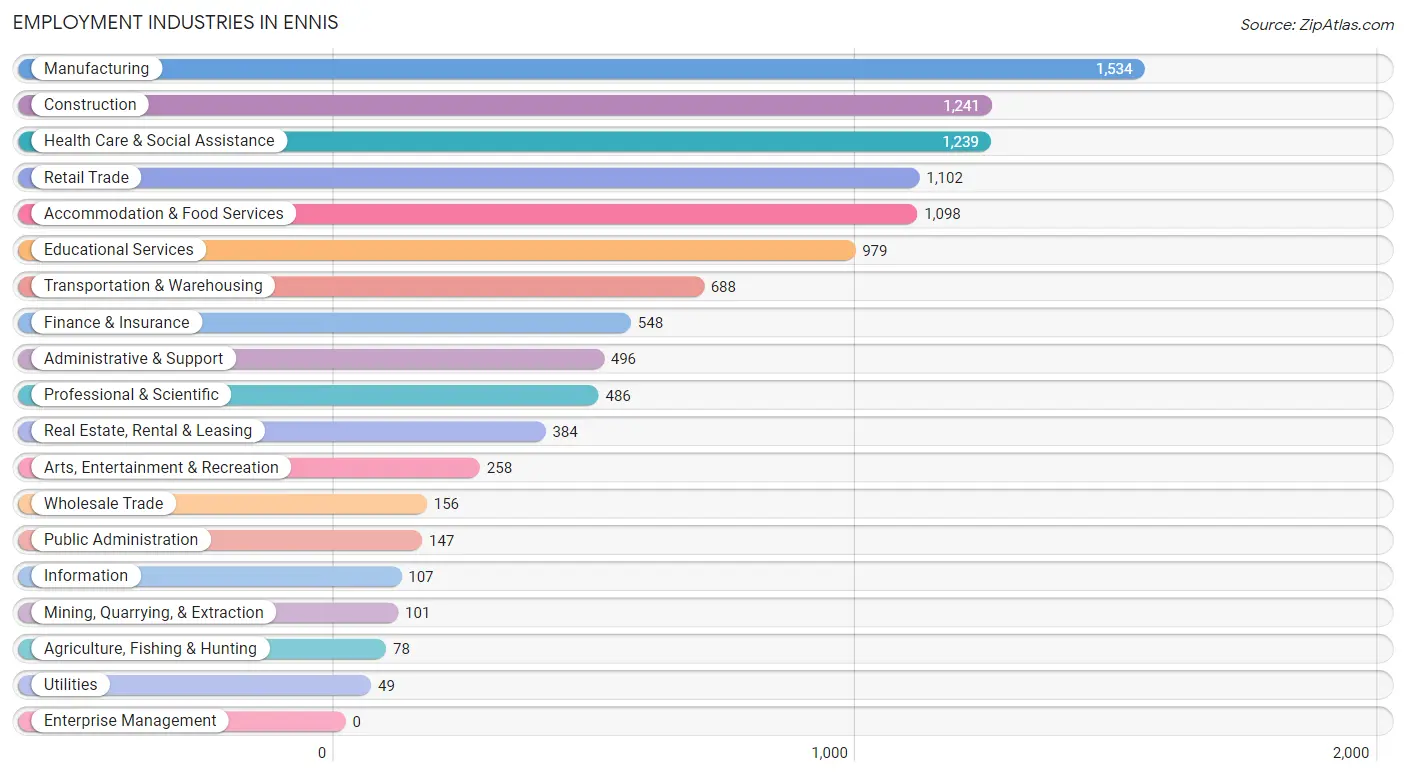
Employment Industries in Ennis
The major employment industries in Ennis include Manufacturing (1,534 | 13.8%), Construction (1,241 | 11.1%), Health Care & Social Assistance (1,239 | 11.1%), Retail Trade (1,102 | 9.9%), and Accommodation & Food Services (1,098 | 9.9%).
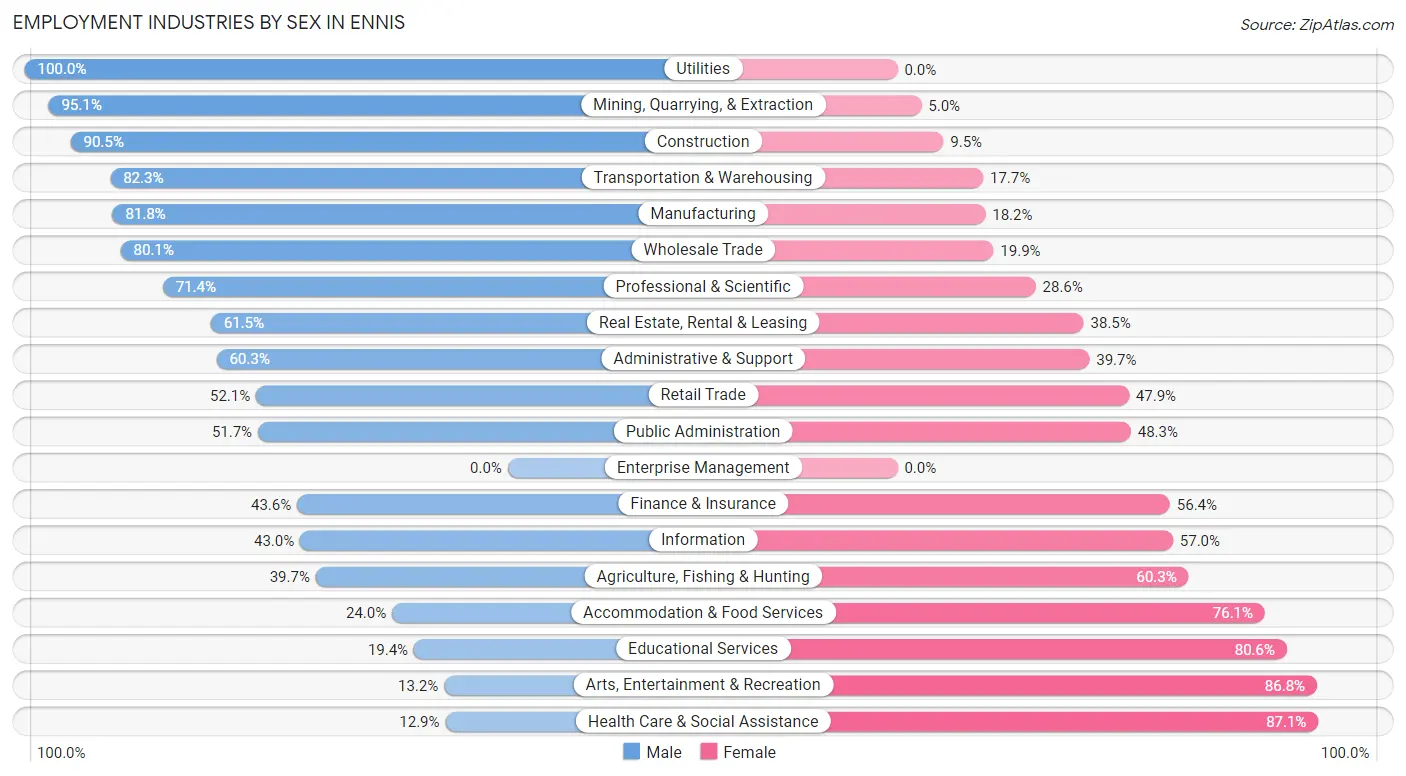
Employment Industries by Sex in Ennis
The Ennis industries that see more men than women are Utilities (100.0%), Mining, Quarrying, & Extraction (95.1%), and Construction (90.5%), whereas the industries that tend to have a higher number of women are Health Care & Social Assistance (87.1%), Arts, Entertainment & Recreation (86.8%), and Educational Services (80.6%).
| Industry | Male | Female |
| Agriculture, Fishing & Hunting | 31 (39.7%) | 47 (60.3%) |
| Mining, Quarrying, & Extraction | 96 (95.1%) | 5 (5.0%) |
| Construction | 1,123 (90.5%) | 118 (9.5%) |
| Manufacturing | 1,255 (81.8%) | 279 (18.2%) |
| Wholesale Trade | 125 (80.1%) | 31 (19.9%) |
| Retail Trade | 574 (52.1%) | 528 (47.9%) |
| Transportation & Warehousing | 566 (82.3%) | 122 (17.7%) |
| Utilities | 49 (100.0%) | 0 (0.0%) |
| Information | 46 (43.0%) | 61 (57.0%) |
| Finance & Insurance | 239 (43.6%) | 309 (56.4%) |
| Real Estate, Rental & Leasing | 236 (61.5%) | 148 (38.5%) |
| Professional & Scientific | 347 (71.4%) | 139 (28.6%) |
| Enterprise Management | 0 (0.0%) | 0 (0.0%) |
| Administrative & Support | 299 (60.3%) | 197 (39.7%) |
| Educational Services | 190 (19.4%) | 789 (80.6%) |
| Health Care & Social Assistance | 160 (12.9%) | 1,079 (87.1%) |
| Arts, Entertainment & Recreation | 34 (13.2%) | 224 (86.8%) |
| Accommodation & Food Services | 263 (23.9%) | 835 (76.0%) |
| Public Administration | 76 (51.7%) | 71 (48.3%) |
| Total | 5,858 (52.6%) | 5,286 (47.4%) |
Education in Ennis
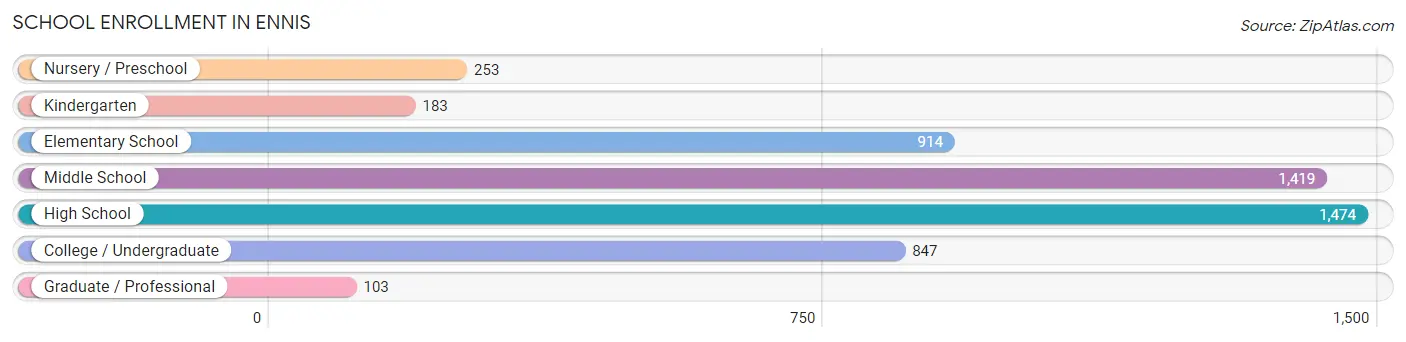
School Enrollment in Ennis
The most common levels of schooling among the 5,193 students in Ennis are high school (1,474 | 28.4%), middle school (1,419 | 27.3%), and elementary school (914 | 17.6%).
| School Level | # Students | % Students |
| Nursery / Preschool | 253 | 4.9% |
| Kindergarten | 183 | 3.5% |
| Elementary School | 914 | 17.6% |
| Middle School | 1,419 | 27.3% |
| High School | 1,474 | 28.4% |
| College / Undergraduate | 847 | 16.3% |
| Graduate / Professional | 103 | 2.0% |
| Total | 5,193 | 100.0% |
School Enrollment by Age by Funding Source in Ennis
Out of a total of 5,193 students who are enrolled in schools in Ennis, 182 (3.5%) attend a private institution, while the remaining 5,011 (96.5%) are enrolled in public schools. The age group of 3 to 4 year olds has the highest likelihood of being enrolled in private schools, with 86 (68.2% in the age bracket) enrolled. Conversely, the age group of 15 to 17 year olds has the lowest likelihood of being enrolled in a private school, with 908 (100.0% in the age bracket) attending a public institution.
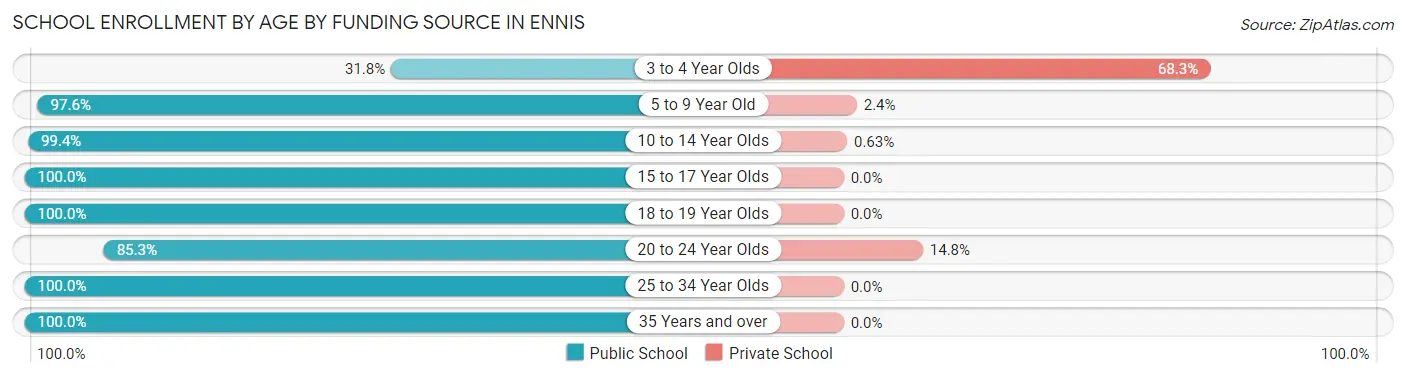
| Age Bracket | Public School | Private School |
| 3 to 4 Year Olds | 40 (31.8%) | 86 (68.2%) |
| 5 to 9 Year Old | 1,118 (97.6%) | 28 (2.4%) |
| 10 to 14 Year Olds | 1,728 (99.4%) | 11 (0.6%) |
| 15 to 17 Year Olds | 908 (100.0%) | 0 (0.0%) |
| 18 to 19 Year Olds | 440 (100.0%) | 0 (0.0%) |
| 20 to 24 Year Olds | 341 (85.3%) | 59 (14.7%) |
| 25 to 34 Year Olds | 243 (100.0%) | 0 (0.0%) |
| 35 Years and over | 191 (100.0%) | 0 (0.0%) |
| Total | 5,011 (96.5%) | 182 (3.5%) |
Educational Attainment by Field of Study in Ennis
Business (764 | 25.6%), education (495 | 16.6%), science & technology (324 | 10.9%), arts & humanities (307 | 10.3%), and communications (217 | 7.3%) are the most common fields of study among 2,981 individuals in Ennis who have obtained a bachelor's degree or higher.
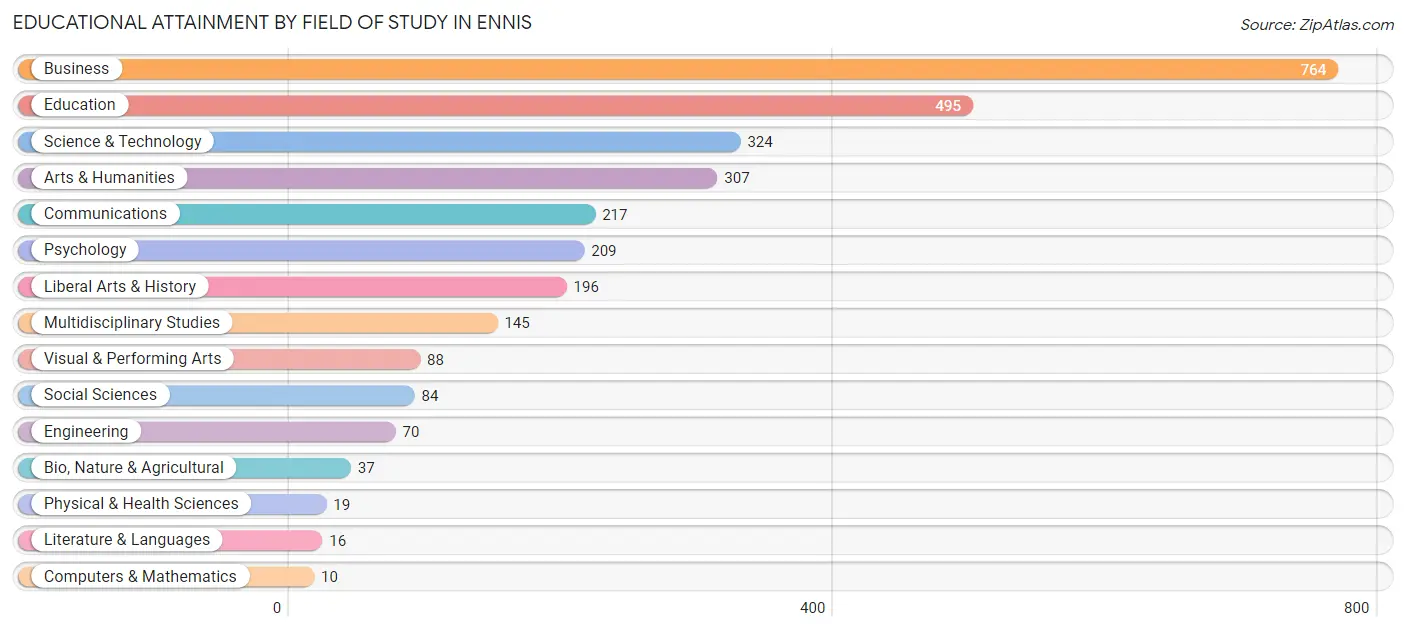
| Field of Study | # Graduates | % Graduates |
| Computers & Mathematics | 10 | 0.3% |
| Bio, Nature & Agricultural | 37 | 1.2% |
| Physical & Health Sciences | 19 | 0.6% |
| Psychology | 209 | 7.0% |
| Social Sciences | 84 | 2.8% |
| Engineering | 70 | 2.4% |
| Multidisciplinary Studies | 145 | 4.9% |
| Science & Technology | 324 | 10.9% |
| Business | 764 | 25.6% |
| Education | 495 | 16.6% |
| Literature & Languages | 16 | 0.5% |
| Liberal Arts & History | 196 | 6.6% |
| Visual & Performing Arts | 88 | 2.9% |
| Communications | 217 | 7.3% |
| Arts & Humanities | 307 | 10.3% |
| Total | 2,981 | 100.0% |
Transportation & Commute in Ennis
Vehicle Availability by Sex in Ennis
The most prevalent vehicle ownership categories in Ennis are males with 2 vehicles (2,544, accounting for 44.8%) and females with 2 vehicles (2,031, making up 50.5%).
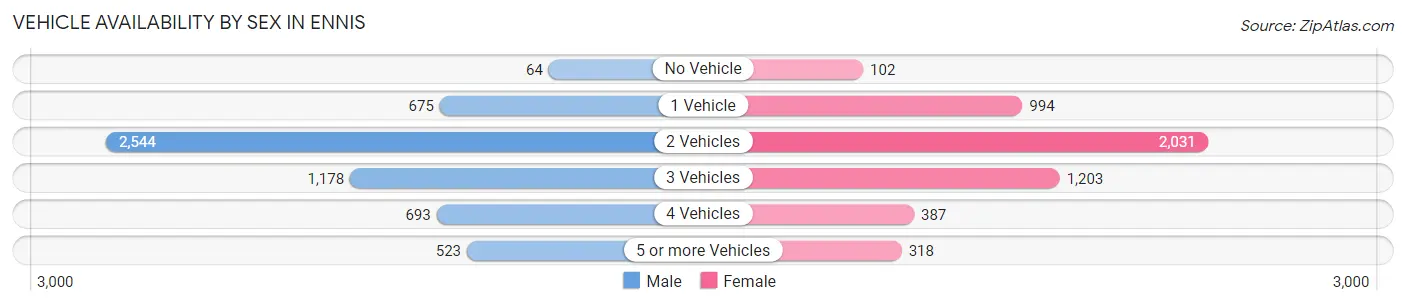
| Vehicles Available | Male | Female |
| No Vehicle | 64 (1.1%) | 102 (2.0%) |
| 1 Vehicle | 675 (11.9%) | 994 (19.7%) |
| 2 Vehicles | 2,544 (44.8%) | 2,031 (40.3%) |
| 3 Vehicles | 1,178 (20.7%) | 1,203 (23.9%) |
| 4 Vehicles | 693 (12.2%) | 387 (7.7%) |
| 5 or more Vehicles | 523 (9.2%) | 318 (6.3%) |
| Total | 5,677 (100.0%) | 5,035 (100.0%) |
Commute Time in Ennis
The most frequently occuring commute durations in Ennis are 5 to 9 minutes (1,711 commuters, 16.9%), 10 to 14 minutes (1,544 commuters, 15.3%), and 30 to 34 minutes (1,010 commuters, 10.0%).
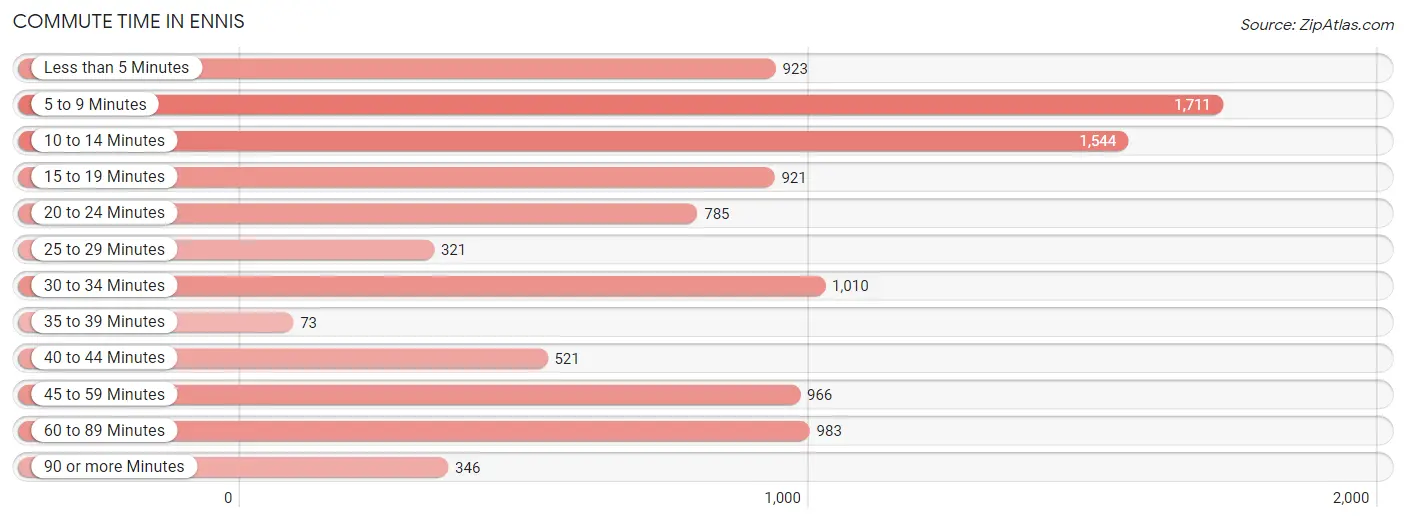
| Commute Time | # Commuters | % Commuters |
| Less than 5 Minutes | 923 | 9.1% |
| 5 to 9 Minutes | 1,711 | 16.9% |
| 10 to 14 Minutes | 1,544 | 15.3% |
| 15 to 19 Minutes | 921 | 9.1% |
| 20 to 24 Minutes | 785 | 7.8% |
| 25 to 29 Minutes | 321 | 3.2% |
| 30 to 34 Minutes | 1,010 | 10.0% |
| 35 to 39 Minutes | 73 | 0.7% |
| 40 to 44 Minutes | 521 | 5.2% |
| 45 to 59 Minutes | 966 | 9.6% |
| 60 to 89 Minutes | 983 | 9.7% |
| 90 or more Minutes | 346 | 3.4% |
Commute Time by Sex in Ennis
The most common commute times in Ennis are 10 to 14 minutes (691 commuters, 13.3%) for males and 5 to 9 minutes (1,022 commuters, 20.9%) for females.
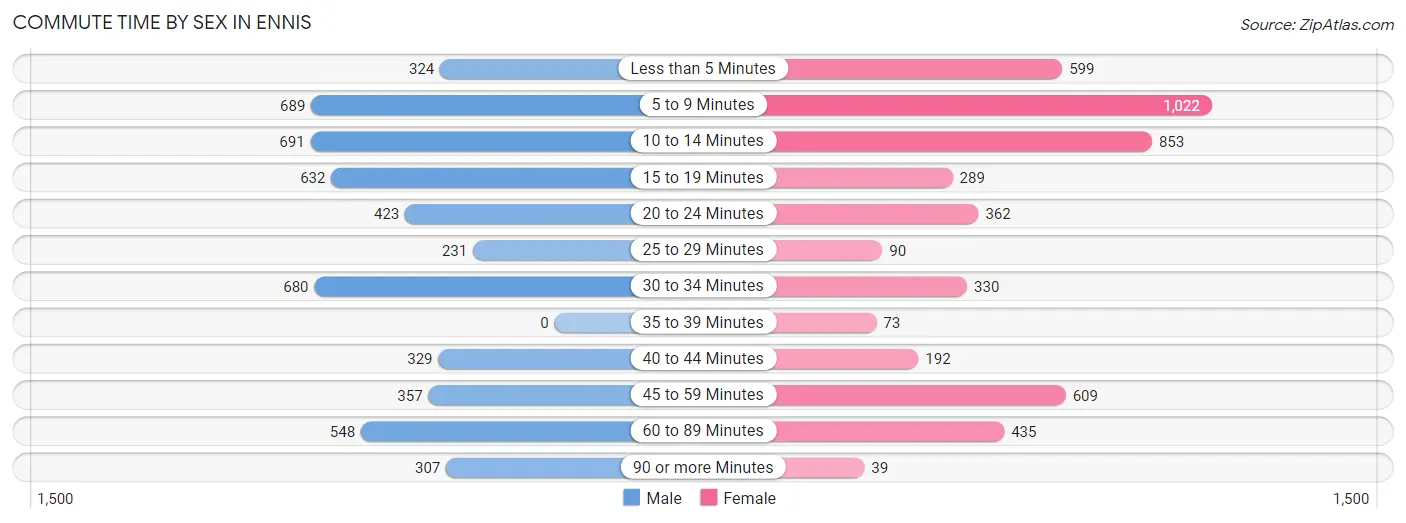
| Commute Time | Male | Female |
| Less than 5 Minutes | 324 (6.2%) | 599 (12.2%) |
| 5 to 9 Minutes | 689 (13.2%) | 1,022 (20.9%) |
| 10 to 14 Minutes | 691 (13.3%) | 853 (17.4%) |
| 15 to 19 Minutes | 632 (12.1%) | 289 (5.9%) |
| 20 to 24 Minutes | 423 (8.1%) | 362 (7.4%) |
| 25 to 29 Minutes | 231 (4.4%) | 90 (1.8%) |
| 30 to 34 Minutes | 680 (13.1%) | 330 (6.7%) |
| 35 to 39 Minutes | 0 (0.0%) | 73 (1.5%) |
| 40 to 44 Minutes | 329 (6.3%) | 192 (3.9%) |
| 45 to 59 Minutes | 357 (6.9%) | 609 (12.4%) |
| 60 to 89 Minutes | 548 (10.5%) | 435 (8.9%) |
| 90 or more Minutes | 307 (5.9%) | 39 (0.8%) |
Time of Departure to Work by Sex in Ennis
The most frequent times of departure to work in Ennis are 7:00 AM to 7:29 AM (1,087, 20.9%) for males and 7:00 AM to 7:29 AM (1,070, 21.9%) for females.
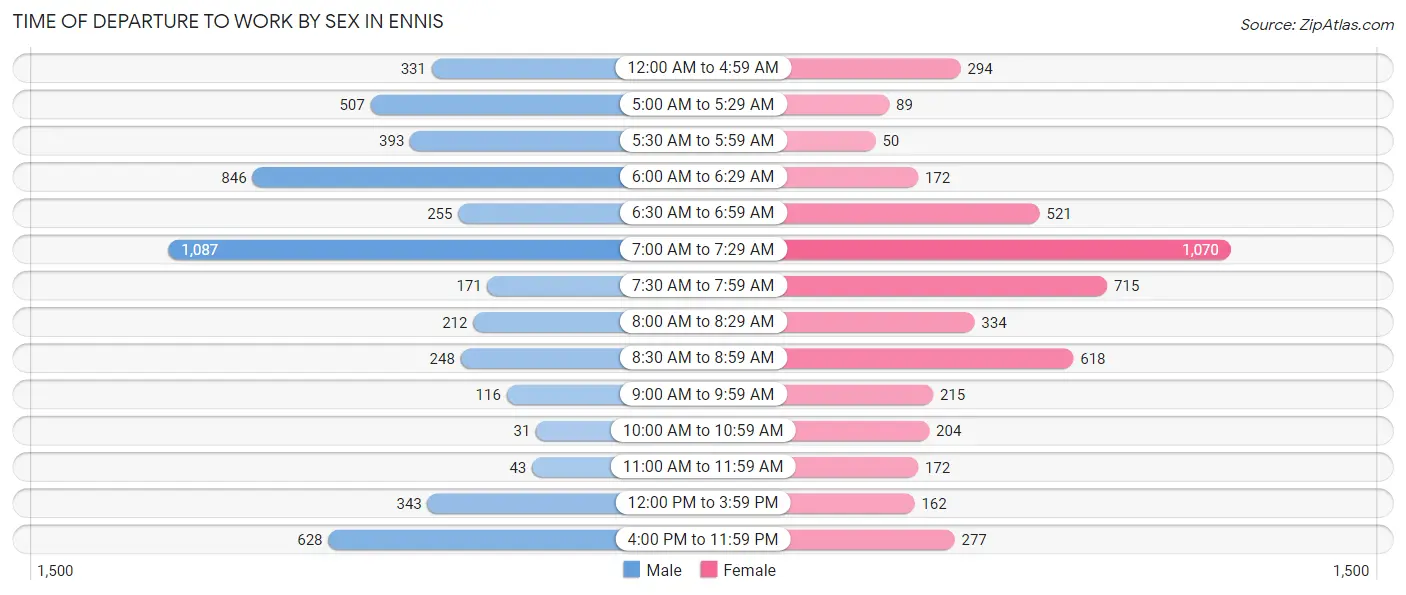
| Time of Departure | Male | Female |
| 12:00 AM to 4:59 AM | 331 (6.4%) | 294 (6.0%) |
| 5:00 AM to 5:29 AM | 507 (9.7%) | 89 (1.8%) |
| 5:30 AM to 5:59 AM | 393 (7.5%) | 50 (1.0%) |
| 6:00 AM to 6:29 AM | 846 (16.2%) | 172 (3.5%) |
| 6:30 AM to 6:59 AM | 255 (4.9%) | 521 (10.6%) |
| 7:00 AM to 7:29 AM | 1,087 (20.9%) | 1,070 (21.9%) |
| 7:30 AM to 7:59 AM | 171 (3.3%) | 715 (14.6%) |
| 8:00 AM to 8:29 AM | 212 (4.1%) | 334 (6.8%) |
| 8:30 AM to 8:59 AM | 248 (4.8%) | 618 (12.6%) |
| 9:00 AM to 9:59 AM | 116 (2.2%) | 215 (4.4%) |
| 10:00 AM to 10:59 AM | 31 (0.6%) | 204 (4.2%) |
| 11:00 AM to 11:59 AM | 43 (0.8%) | 172 (3.5%) |
| 12:00 PM to 3:59 PM | 343 (6.6%) | 162 (3.3%) |
| 4:00 PM to 11:59 PM | 628 (12.0%) | 277 (5.7%) |
| Total | 5,211 (100.0%) | 4,893 (100.0%) |
Housing Occupancy in Ennis
Occupancy by Ownership in Ennis
Of the total 7,269 dwellings in Ennis, owner-occupied units account for 4,617 (63.5%), while renter-occupied units make up 2,652 (36.5%).
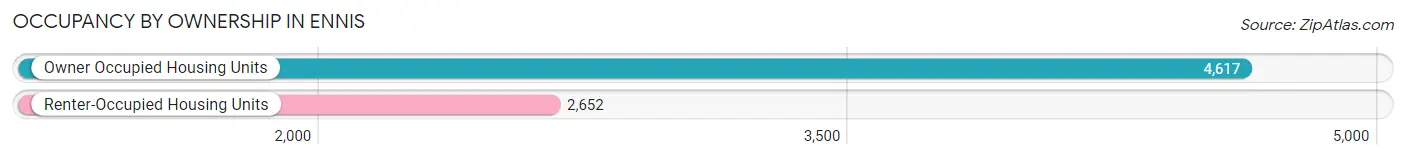
| Occupancy | # Housing Units | % Housing Units |
| Owner Occupied Housing Units | 4,617 | 63.5% |
| Renter-Occupied Housing Units | 2,652 | 36.5% |
| Total Occupied Housing Units | 7,269 | 100.0% |
Occupancy by Household Size in Ennis
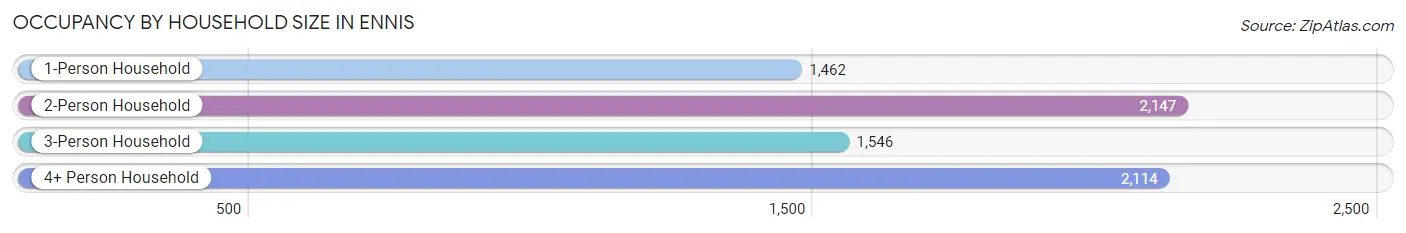
| Household Size | # Housing Units | % Housing Units |
| 1-Person Household | 1,462 | 20.1% |
| 2-Person Household | 2,147 | 29.5% |
| 3-Person Household | 1,546 | 21.3% |
| 4+ Person Household | 2,114 | 29.1% |
| Total Housing Units | 7,269 | 100.0% |
Occupancy by Ownership by Household Size in Ennis
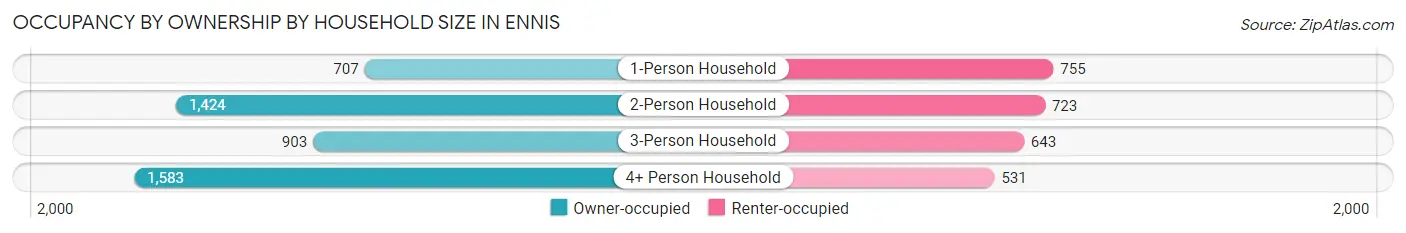
| Household Size | Owner-occupied | Renter-occupied |
| 1-Person Household | 707 (48.4%) | 755 (51.6%) |
| 2-Person Household | 1,424 (66.3%) | 723 (33.7%) |
| 3-Person Household | 903 (58.4%) | 643 (41.6%) |
| 4+ Person Household | 1,583 (74.9%) | 531 (25.1%) |
| Total Housing Units | 4,617 (63.5%) | 2,652 (36.5%) |
Occupancy by Educational Attainment in Ennis
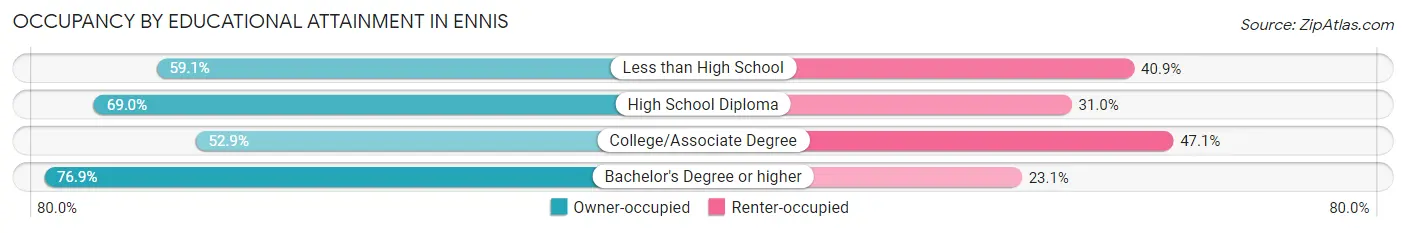
| Household Size | Owner-occupied | Renter-occupied |
| Less than High School | 771 (59.1%) | 534 (40.9%) |
| High School Diploma | 1,423 (69.0%) | 639 (31.0%) |
| College/Associate Degree | 1,273 (52.9%) | 1,134 (47.1%) |
| Bachelor's Degree or higher | 1,150 (76.9%) | 345 (23.1%) |
Occupancy by Age of Householder in Ennis
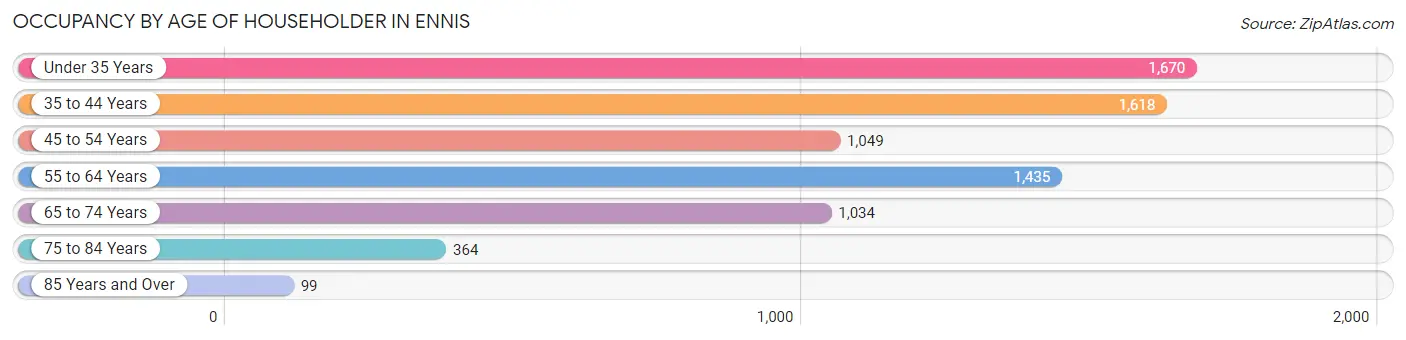
| Age Bracket | # Households | % Households |
| Under 35 Years | 1,670 | 23.0% |
| 35 to 44 Years | 1,618 | 22.3% |
| 45 to 54 Years | 1,049 | 14.4% |
| 55 to 64 Years | 1,435 | 19.7% |
| 65 to 74 Years | 1,034 | 14.2% |
| 75 to 84 Years | 364 | 5.0% |
| 85 Years and Over | 99 | 1.4% |
| Total | 7,269 | 100.0% |
Housing Finances in Ennis
Median Income by Occupancy in Ennis
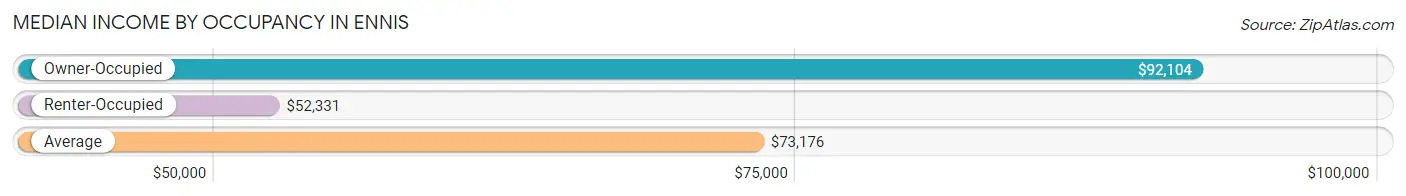
| Occupancy Type | # Households | Median Income |
| Owner-Occupied | 4,617 (63.5%) | $92,104 |
| Renter-Occupied | 2,652 (36.5%) | $52,331 |
| Average | 7,269 (100.0%) | $73,176 |
Occupancy by Householder Income Bracket in Ennis
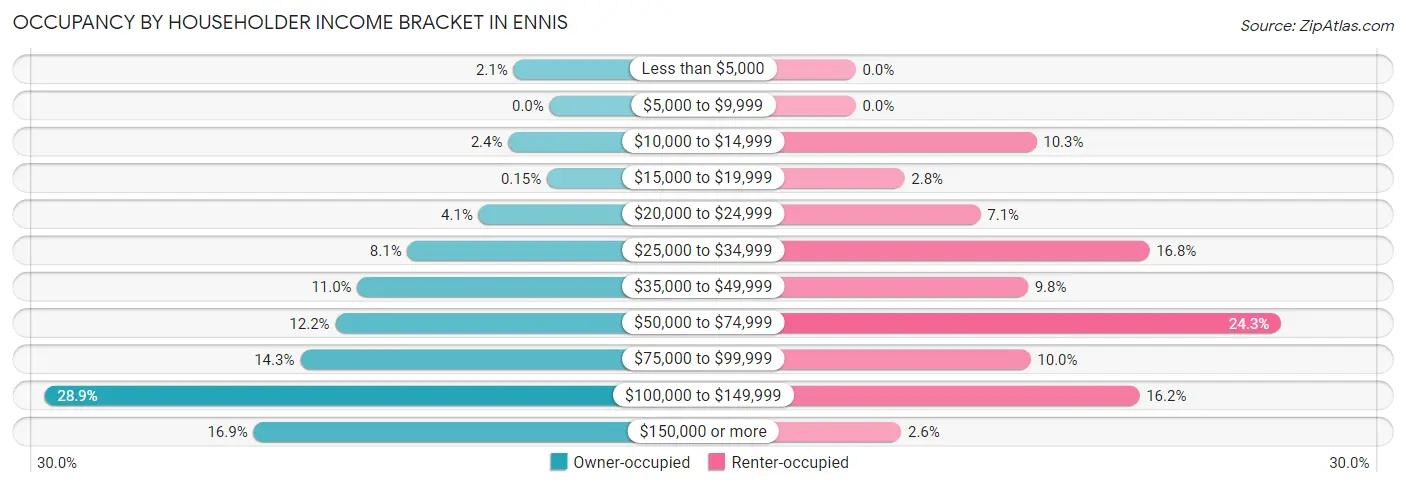
| Income Bracket | Owner-occupied | Renter-occupied |
| Less than $5,000 | 95 (2.1%) | 0 (0.0%) |
| $5,000 to $9,999 | 0 (0.0%) | 0 (0.0%) |
| $10,000 to $14,999 | 109 (2.4%) | 274 (10.3%) |
| $15,000 to $19,999 | 7 (0.2%) | 74 (2.8%) |
| $20,000 to $24,999 | 187 (4.1%) | 189 (7.1%) |
| $25,000 to $34,999 | 375 (8.1%) | 445 (16.8%) |
| $35,000 to $49,999 | 507 (11.0%) | 261 (9.8%) |
| $50,000 to $74,999 | 565 (12.2%) | 645 (24.3%) |
| $75,000 to $99,999 | 658 (14.2%) | 265 (10.0%) |
| $100,000 to $149,999 | 1,333 (28.9%) | 430 (16.2%) |
| $150,000 or more | 781 (16.9%) | 69 (2.6%) |
| Total | 4,617 (100.0%) | 2,652 (100.0%) |
Monthly Housing Cost Tiers in Ennis
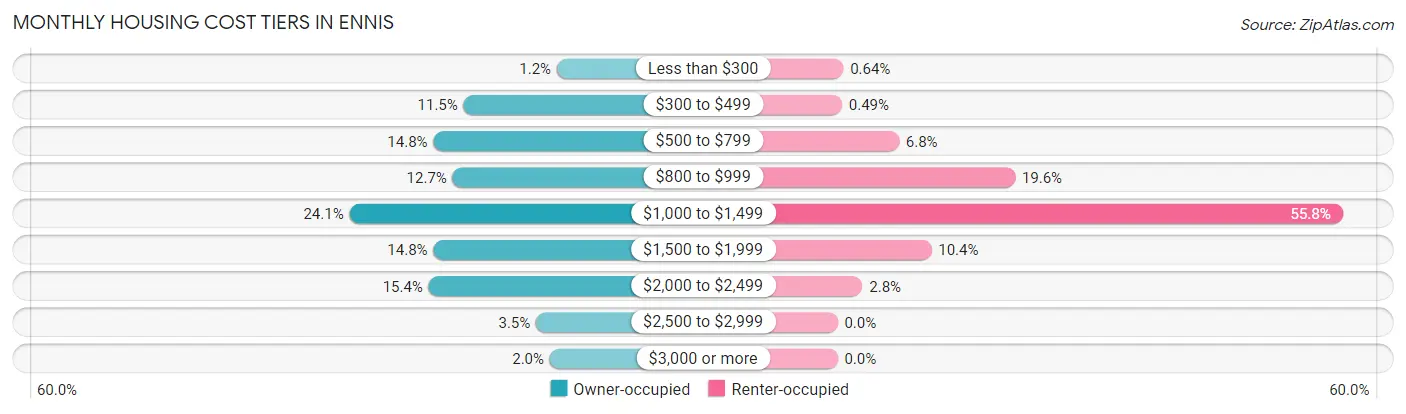
| Monthly Cost | Owner-occupied | Renter-occupied |
| Less than $300 | 55 (1.2%) | 17 (0.6%) |
| $300 to $499 | 531 (11.5%) | 13 (0.5%) |
| $500 to $799 | 685 (14.8%) | 180 (6.8%) |
| $800 to $999 | 587 (12.7%) | 520 (19.6%) |
| $1,000 to $1,499 | 1,113 (24.1%) | 1,480 (55.8%) |
| $1,500 to $1,999 | 685 (14.8%) | 275 (10.4%) |
| $2,000 to $2,499 | 709 (15.4%) | 73 (2.8%) |
| $2,500 to $2,999 | 161 (3.5%) | 0 (0.0%) |
| $3,000 or more | 91 (2.0%) | 0 (0.0%) |
| Total | 4,617 (100.0%) | 2,652 (100.0%) |
Physical Housing Characteristics in Ennis
Housing Structures in Ennis
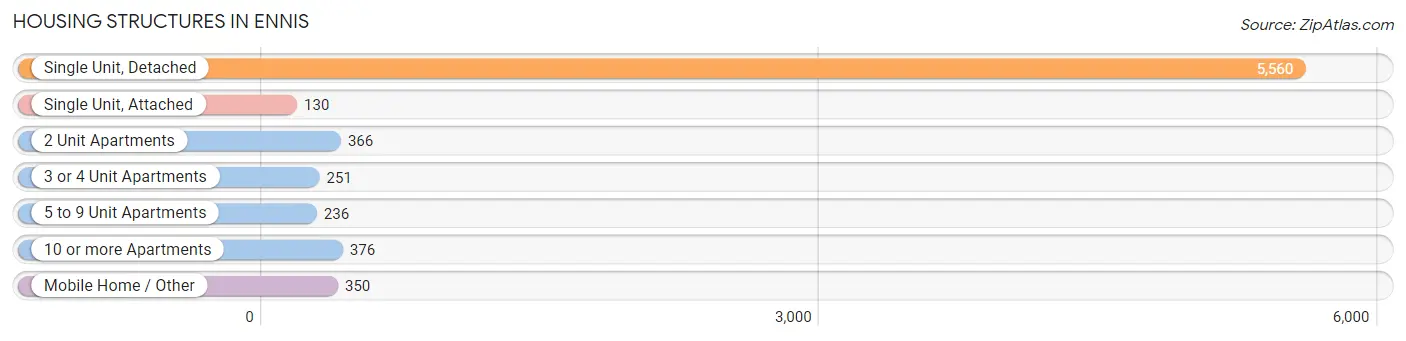
| Structure Type | # Housing Units | % Housing Units |
| Single Unit, Detached | 5,560 | 76.5% |
| Single Unit, Attached | 130 | 1.8% |
| 2 Unit Apartments | 366 | 5.0% |
| 3 or 4 Unit Apartments | 251 | 3.5% |
| 5 to 9 Unit Apartments | 236 | 3.3% |
| 10 or more Apartments | 376 | 5.2% |
| Mobile Home / Other | 350 | 4.8% |
| Total | 7,269 | 100.0% |
Housing Structures by Occupancy in Ennis
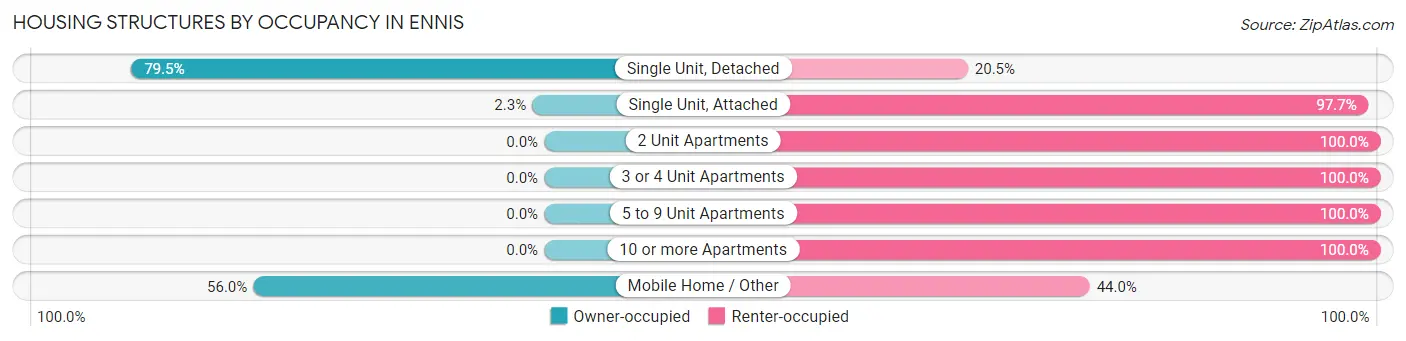
| Structure Type | Owner-occupied | Renter-occupied |
| Single Unit, Detached | 4,418 (79.5%) | 1,142 (20.5%) |
| Single Unit, Attached | 3 (2.3%) | 127 (97.7%) |
| 2 Unit Apartments | 0 (0.0%) | 366 (100.0%) |
| 3 or 4 Unit Apartments | 0 (0.0%) | 251 (100.0%) |
| 5 to 9 Unit Apartments | 0 (0.0%) | 236 (100.0%) |
| 10 or more Apartments | 0 (0.0%) | 376 (100.0%) |
| Mobile Home / Other | 196 (56.0%) | 154 (44.0%) |
| Total | 4,617 (63.5%) | 2,652 (36.5%) |
Housing Structures by Number of Rooms in Ennis
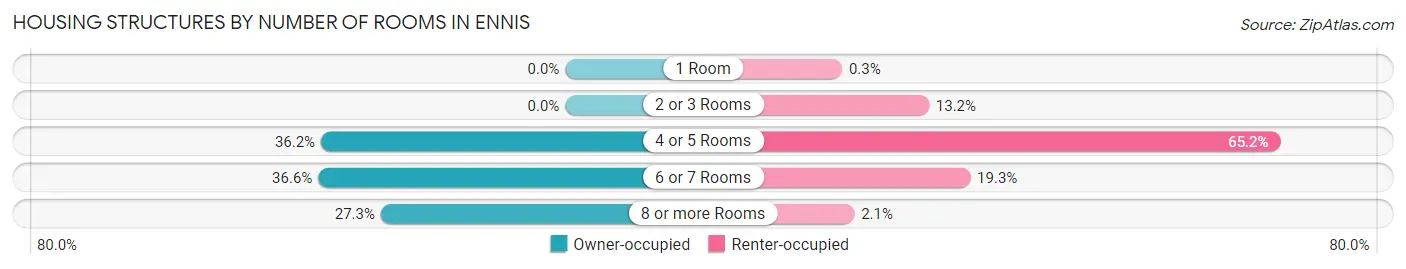
| Number of Rooms | Owner-occupied | Renter-occupied |
| 1 Room | 0 (0.0%) | 8 (0.3%) |
| 2 or 3 Rooms | 0 (0.0%) | 349 (13.2%) |
| 4 or 5 Rooms | 1,669 (36.1%) | 1,728 (65.2%) |
| 6 or 7 Rooms | 1,688 (36.6%) | 511 (19.3%) |
| 8 or more Rooms | 1,260 (27.3%) | 56 (2.1%) |
| Total | 4,617 (100.0%) | 2,652 (100.0%) |
Housing Structure by Heating Type in Ennis
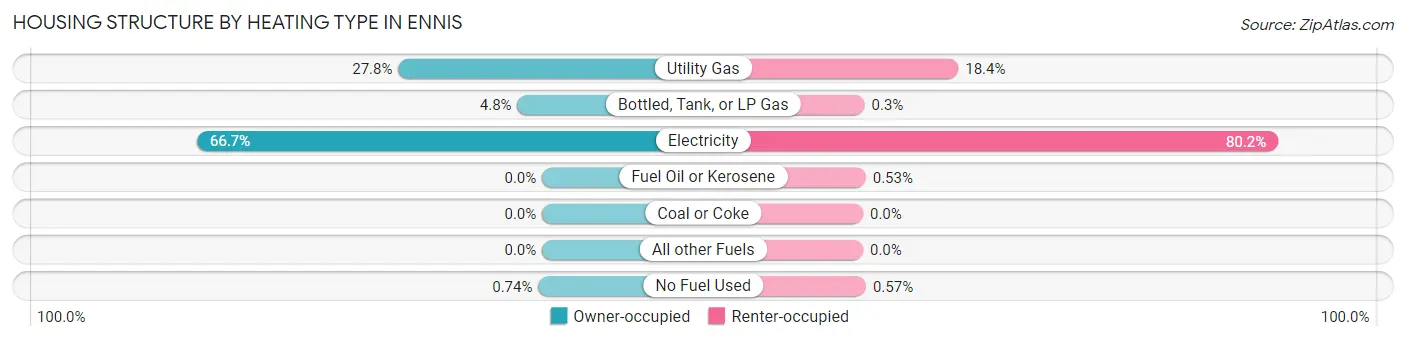
| Heating Type | Owner-occupied | Renter-occupied |
| Utility Gas | 1,283 (27.8%) | 488 (18.4%) |
| Bottled, Tank, or LP Gas | 220 (4.8%) | 8 (0.3%) |
| Electricity | 3,080 (66.7%) | 2,127 (80.2%) |
| Fuel Oil or Kerosene | 0 (0.0%) | 14 (0.5%) |
| Coal or Coke | 0 (0.0%) | 0 (0.0%) |
| All other Fuels | 0 (0.0%) | 0 (0.0%) |
| No Fuel Used | 34 (0.7%) | 15 (0.6%) |
| Total | 4,617 (100.0%) | 2,652 (100.0%) |
Household Vehicle Usage in Ennis
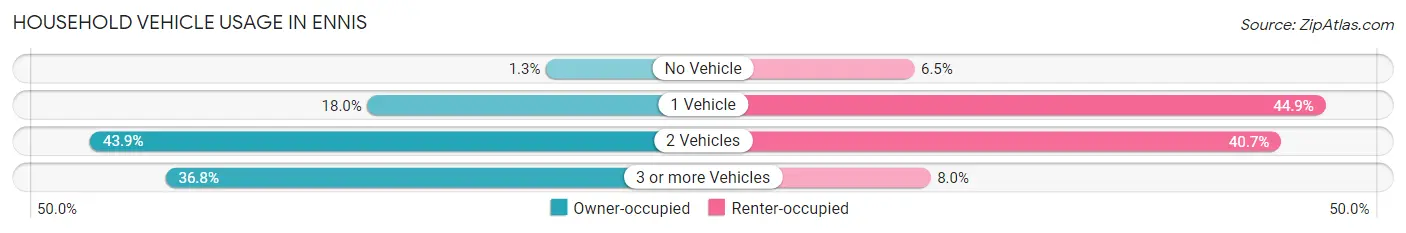
| Vehicles per Household | Owner-occupied | Renter-occupied |
| No Vehicle | 60 (1.3%) | 171 (6.5%) |
| 1 Vehicle | 830 (18.0%) | 1,190 (44.9%) |
| 2 Vehicles | 2,026 (43.9%) | 1,080 (40.7%) |
| 3 or more Vehicles | 1,701 (36.8%) | 211 (8.0%) |
| Total | 4,617 (100.0%) | 2,652 (100.0%) |
Real Estate & Mortgages in Ennis
Real Estate and Mortgage Overview in Ennis
| Characteristic | Without Mortgage | With Mortgage |
| Housing Units | 1,801 | 2,816 |
| Median Property Value | $143,100 | $238,400 |
| Median Household Income | $65,026 | $577 |
| Monthly Housing Costs | $608 | $91 |
| Real Estate Taxes | $2,532 | $42 |
Property Value by Mortgage Status in Ennis
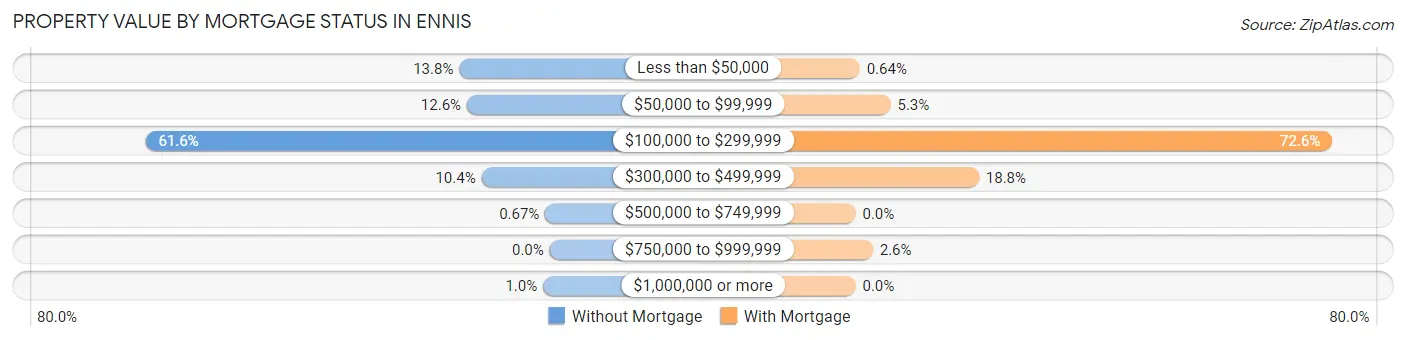
| Property Value | Without Mortgage | With Mortgage |
| Less than $50,000 | 248 (13.8%) | 18 (0.6%) |
| $50,000 to $99,999 | 227 (12.6%) | 150 (5.3%) |
| $100,000 to $299,999 | 1,109 (61.6%) | 2,045 (72.6%) |
| $300,000 to $499,999 | 187 (10.4%) | 529 (18.8%) |
| $500,000 to $749,999 | 12 (0.7%) | 0 (0.0%) |
| $750,000 to $999,999 | 0 (0.0%) | 74 (2.6%) |
| $1,000,000 or more | 18 (1.0%) | 0 (0.0%) |
| Total | 1,801 (100.0%) | 2,816 (100.0%) |
Household Income by Mortgage Status in Ennis
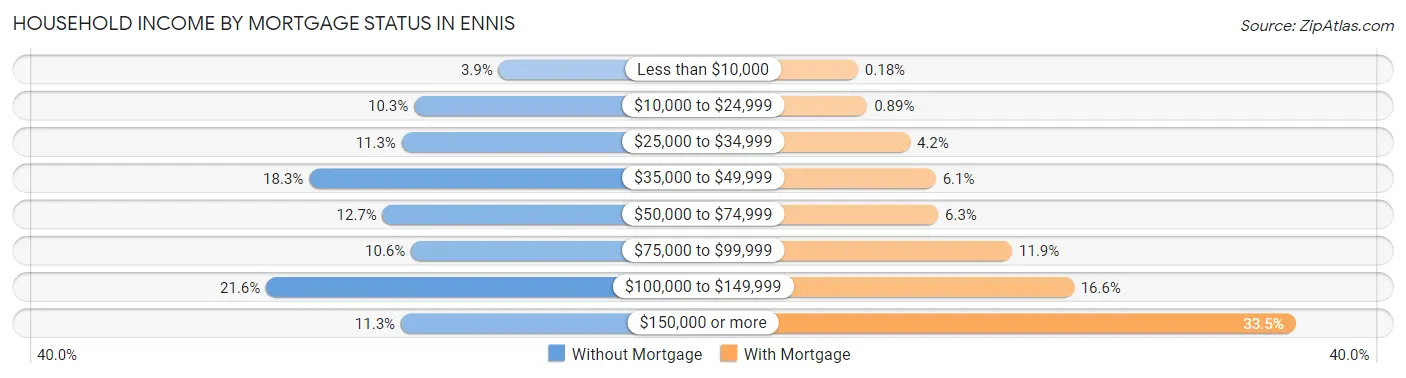
| Household Income | Without Mortgage | With Mortgage |
| Less than $10,000 | 70 (3.9%) | 5 (0.2%) |
| $10,000 to $24,999 | 186 (10.3%) | 25 (0.9%) |
| $25,000 to $34,999 | 203 (11.3%) | 117 (4.2%) |
| $35,000 to $49,999 | 330 (18.3%) | 172 (6.1%) |
| $50,000 to $74,999 | 229 (12.7%) | 177 (6.3%) |
| $75,000 to $99,999 | 190 (10.5%) | 336 (11.9%) |
| $100,000 to $149,999 | 389 (21.6%) | 468 (16.6%) |
| $150,000 or more | 204 (11.3%) | 944 (33.5%) |
| Total | 1,801 (100.0%) | 2,816 (100.0%) |
Property Value to Household Income Ratio in Ennis
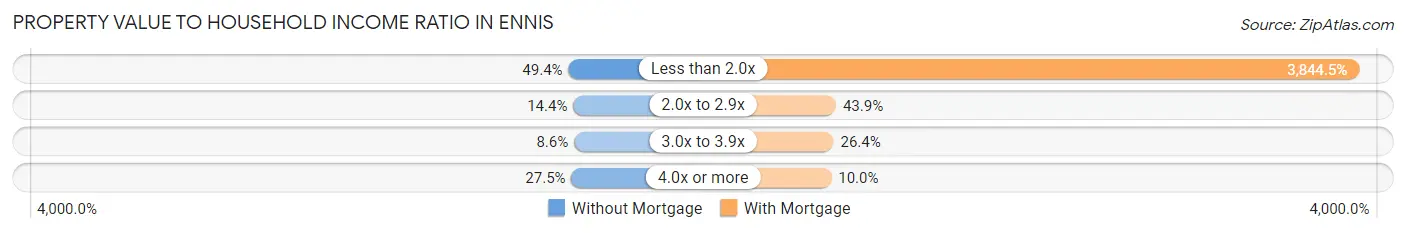
| Value-to-Income Ratio | Without Mortgage | With Mortgage |
| Less than 2.0x | 890 (49.4%) | 108,262 (3,844.5%) |
| 2.0x to 2.9x | 260 (14.4%) | 1,237 (43.9%) |
| 3.0x to 3.9x | 155 (8.6%) | 744 (26.4%) |
| 4.0x or more | 496 (27.5%) | 282 (10.0%) |
| Total | 1,801 (100.0%) | 2,816 (100.0%) |
Real Estate Taxes by Mortgage Status in Ennis
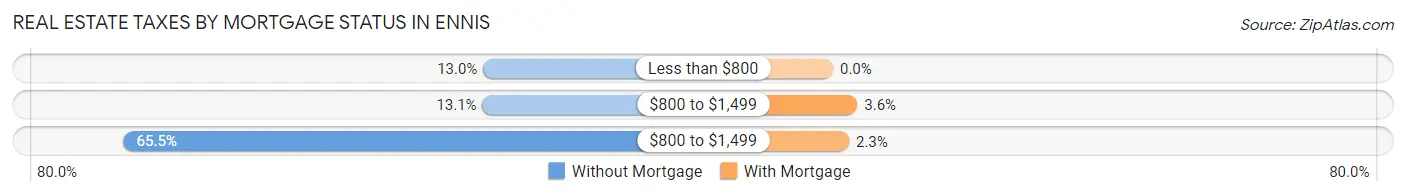
| Property Taxes | Without Mortgage | With Mortgage |
| Less than $800 | 234 (13.0%) | 0 (0.0%) |
| $800 to $1,499 | 236 (13.1%) | 100 (3.5%) |
| $800 to $1,499 | 1,180 (65.5%) | 66 (2.3%) |
| Total | 1,801 (100.0%) | 2,816 (100.0%) |
Health & Disability in Ennis
Health Insurance Coverage by Age in Ennis
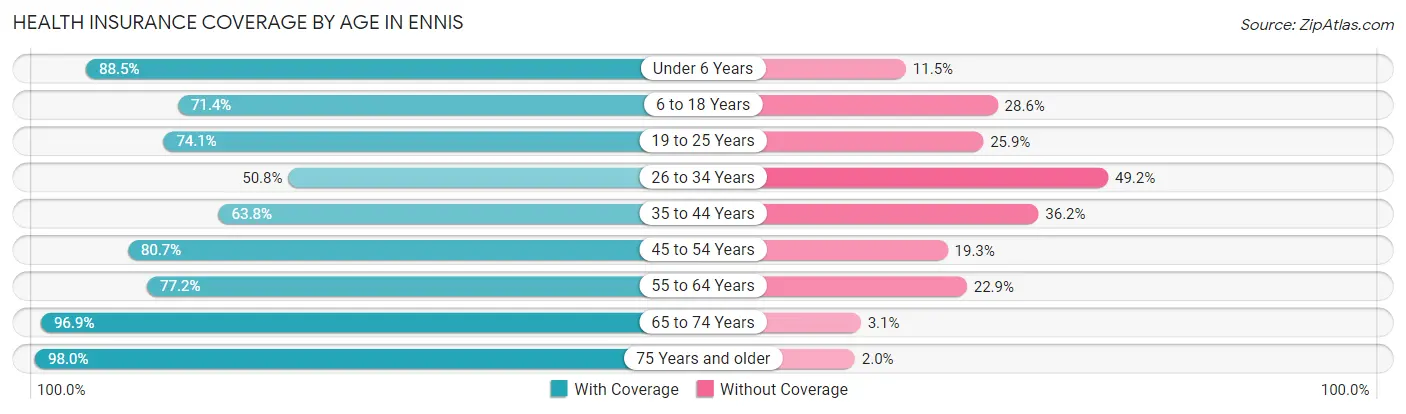
| Age Bracket | With Coverage | Without Coverage |
| Under 6 Years | 1,371 (88.5%) | 178 (11.5%) |
| 6 to 18 Years | 2,923 (71.4%) | 1,171 (28.6%) |
| 19 to 25 Years | 1,765 (74.1%) | 617 (25.9%) |
| 26 to 34 Years | 1,392 (50.8%) | 1,347 (49.2%) |
| 35 to 44 Years | 1,758 (63.8%) | 997 (36.2%) |
| 45 to 54 Years | 1,727 (80.7%) | 412 (19.3%) |
| 55 to 64 Years | 1,979 (77.1%) | 586 (22.9%) |
| 65 to 74 Years | 1,491 (96.9%) | 47 (3.1%) |
| 75 Years and older | 698 (98.0%) | 14 (2.0%) |
| Total | 15,104 (73.8%) | 5,369 (26.2%) |
Health Insurance Coverage by Citizenship Status in Ennis
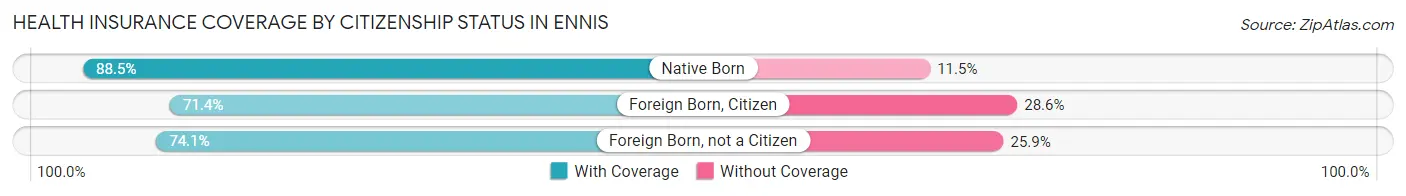
| Citizenship Status | With Coverage | Without Coverage |
| Native Born | 1,371 (88.5%) | 178 (11.5%) |
| Foreign Born, Citizen | 2,923 (71.4%) | 1,171 (28.6%) |
| Foreign Born, not a Citizen | 1,765 (74.1%) | 617 (25.9%) |
Health Insurance Coverage by Household Income in Ennis
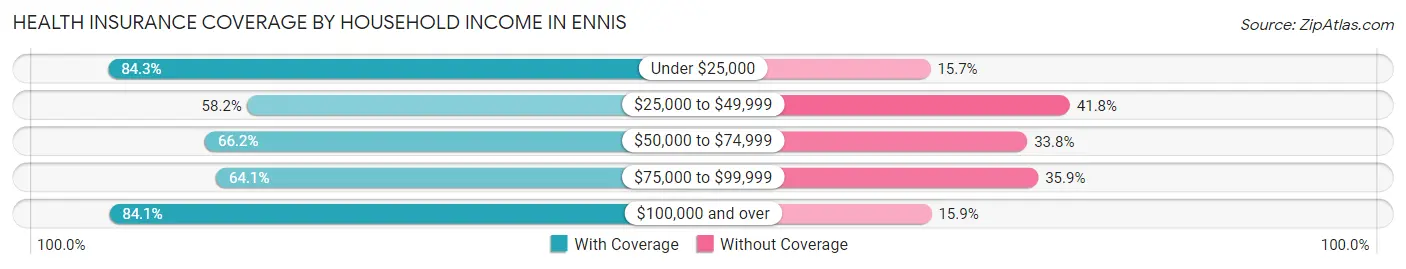
| Household Income | With Coverage | Without Coverage |
| Under $25,000 | 1,609 (84.3%) | 299 (15.7%) |
| $25,000 to $49,999 | 2,250 (58.2%) | 1,615 (41.8%) |
| $50,000 to $74,999 | 1,889 (66.2%) | 965 (33.8%) |
| $75,000 to $99,999 | 1,958 (64.1%) | 1,095 (35.9%) |
| $100,000 and over | 7,396 (84.1%) | 1,395 (15.9%) |
Public vs Private Health Insurance Coverage by Age in Ennis
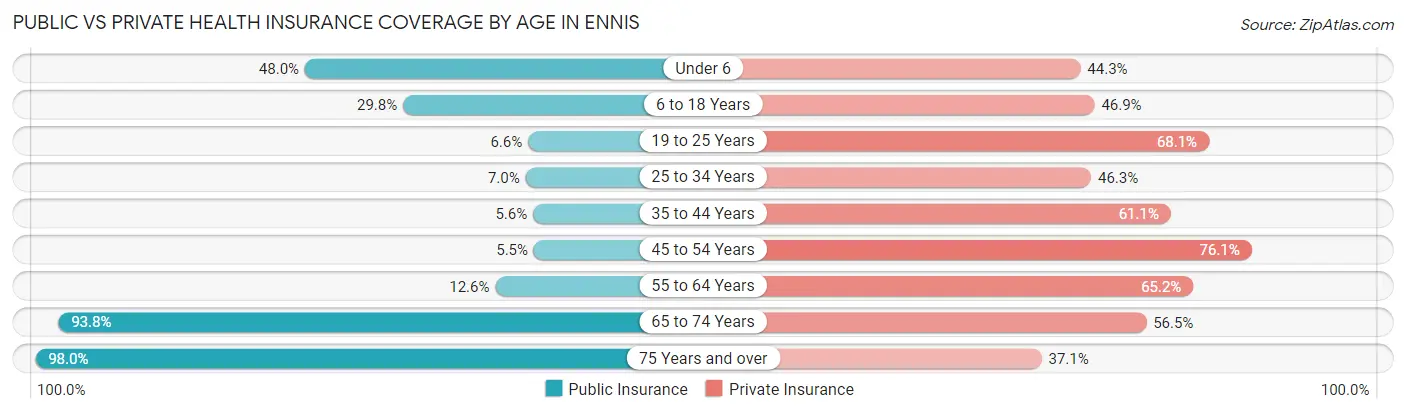
| Age Bracket | Public Insurance | Private Insurance |
| Under 6 | 743 (48.0%) | 686 (44.3%) |
| 6 to 18 Years | 1,218 (29.7%) | 1,920 (46.9%) |
| 19 to 25 Years | 156 (6.6%) | 1,623 (68.1%) |
| 25 to 34 Years | 192 (7.0%) | 1,267 (46.3%) |
| 35 to 44 Years | 155 (5.6%) | 1,682 (61.1%) |
| 45 to 54 Years | 117 (5.5%) | 1,627 (76.1%) |
| 55 to 64 Years | 324 (12.6%) | 1,673 (65.2%) |
| 65 to 74 Years | 1,442 (93.8%) | 869 (56.5%) |
| 75 Years and over | 698 (98.0%) | 264 (37.1%) |
| Total | 5,045 (24.6%) | 11,611 (56.7%) |
Disability Status by Sex by Age in Ennis
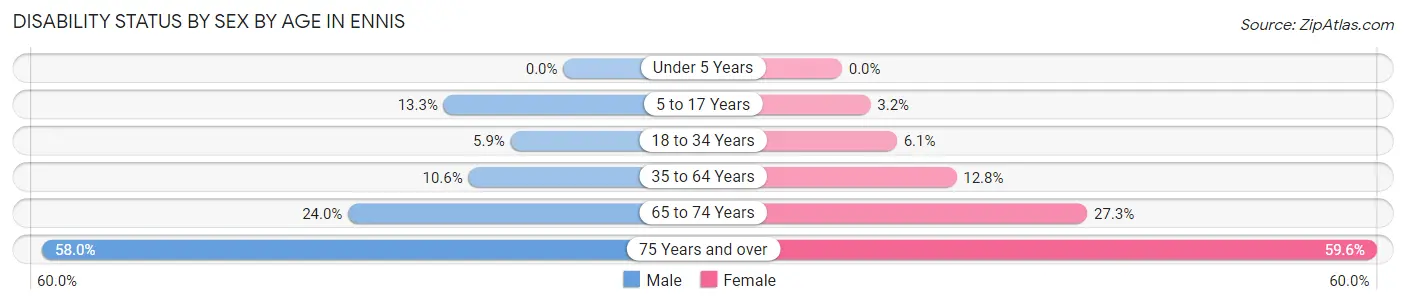
| Age Bracket | Male | Female |
| Under 5 Years | 0 (0.0%) | 0 (0.0%) |
| 5 to 17 Years | 316 (13.3%) | 50 (3.2%) |
| 18 to 34 Years | 163 (5.9%) | 170 (6.1%) |
| 35 to 64 Years | 370 (10.6%) | 504 (12.8%) |
| 65 to 74 Years | 179 (24.0%) | 216 (27.3%) |
| 75 Years and over | 83 (58.0%) | 339 (59.6%) |
Disability Class by Sex by Age in Ennis
Disability Class: Hearing Difficulty
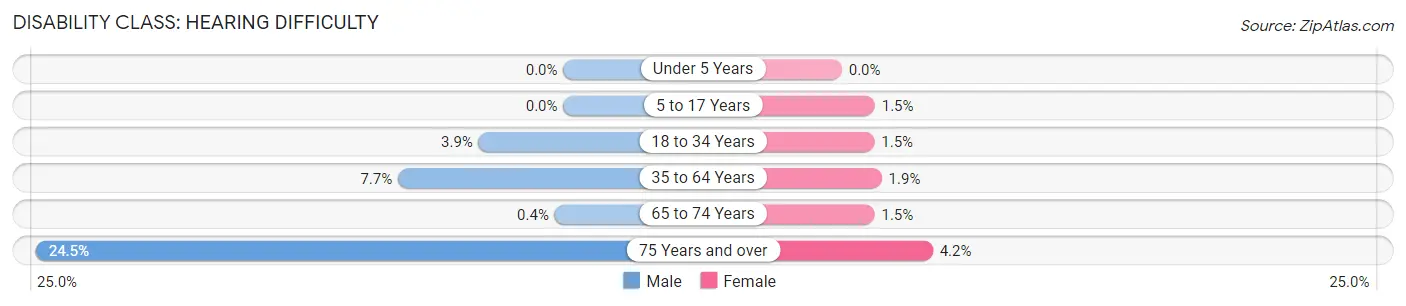
| Age Bracket | Male | Female |
| Under 5 Years | 0 (0.0%) | 0 (0.0%) |
| 5 to 17 Years | 0 (0.0%) | 24 (1.5%) |
| 18 to 34 Years | 109 (3.9%) | 42 (1.5%) |
| 35 to 64 Years | 269 (7.7%) | 73 (1.8%) |
| 65 to 74 Years | 3 (0.4%) | 12 (1.5%) |
| 75 Years and over | 35 (24.5%) | 24 (4.2%) |
Disability Class: Vision Difficulty
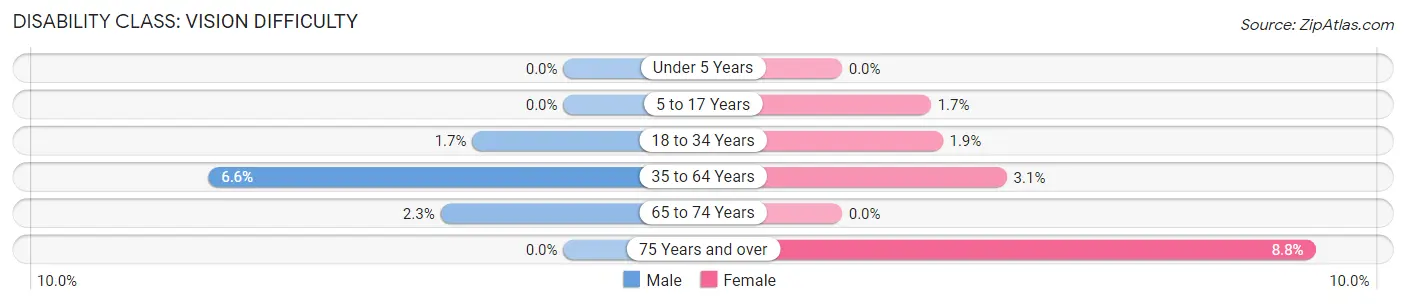
| Age Bracket | Male | Female |
| Under 5 Years | 0 (0.0%) | 0 (0.0%) |
| 5 to 17 Years | 0 (0.0%) | 26 (1.7%) |
| 18 to 34 Years | 47 (1.7%) | 52 (1.9%) |
| 35 to 64 Years | 231 (6.6%) | 121 (3.1%) |
| 65 to 74 Years | 17 (2.3%) | 0 (0.0%) |
| 75 Years and over | 0 (0.0%) | 50 (8.8%) |
Disability Class: Cognitive Difficulty
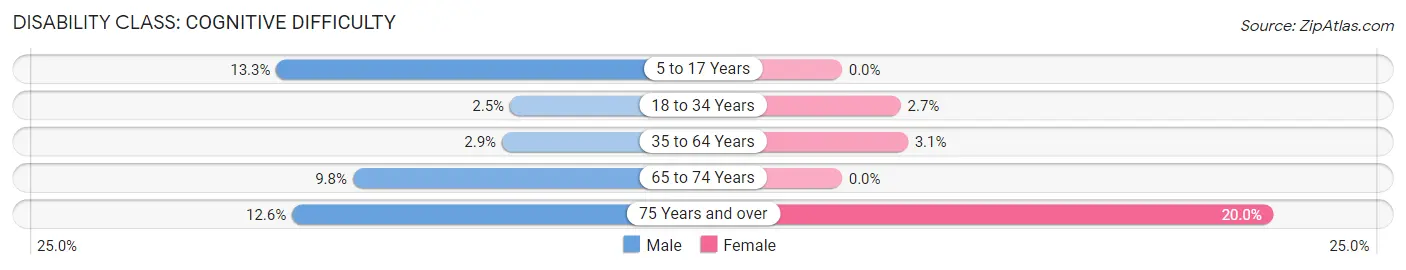
| Age Bracket | Male | Female |
| 5 to 17 Years | 316 (13.3%) | 0 (0.0%) |
| 18 to 34 Years | 69 (2.5%) | 76 (2.7%) |
| 35 to 64 Years | 100 (2.9%) | 121 (3.1%) |
| 65 to 74 Years | 73 (9.8%) | 0 (0.0%) |
| 75 Years and over | 18 (12.6%) | 114 (20.0%) |
Disability Class: Ambulatory Difficulty
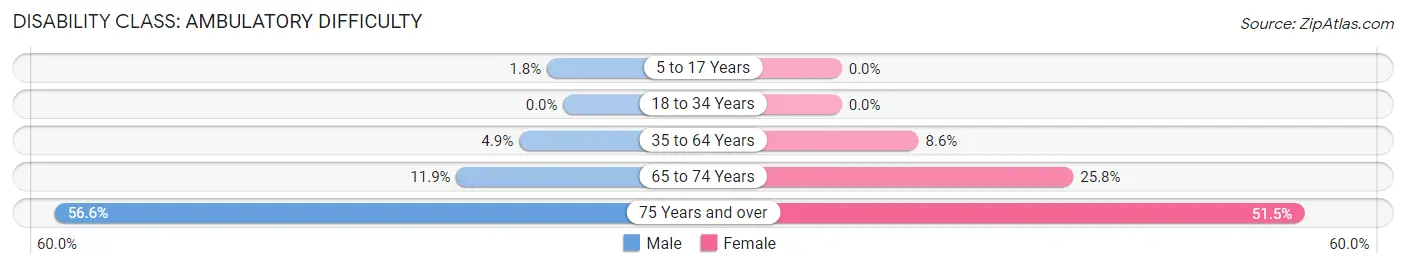
| Age Bracket | Male | Female |
| 5 to 17 Years | 43 (1.8%) | 0 (0.0%) |
| 18 to 34 Years | 0 (0.0%) | 0 (0.0%) |
| 35 to 64 Years | 173 (4.9%) | 338 (8.6%) |
| 65 to 74 Years | 89 (11.9%) | 204 (25.8%) |
| 75 Years and over | 81 (56.6%) | 293 (51.5%) |
Disability Class: Self-Care Difficulty
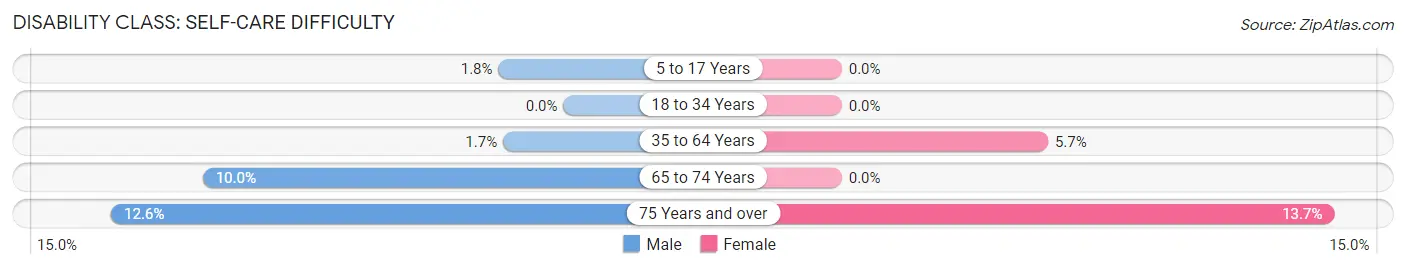
| Age Bracket | Male | Female |
| 5 to 17 Years | 43 (1.8%) | 0 (0.0%) |
| 18 to 34 Years | 0 (0.0%) | 0 (0.0%) |
| 35 to 64 Years | 59 (1.7%) | 227 (5.7%) |
| 65 to 74 Years | 75 (10.0%) | 0 (0.0%) |
| 75 Years and over | 18 (12.6%) | 78 (13.7%) |
Technology Access in Ennis
Computing Device Access in Ennis
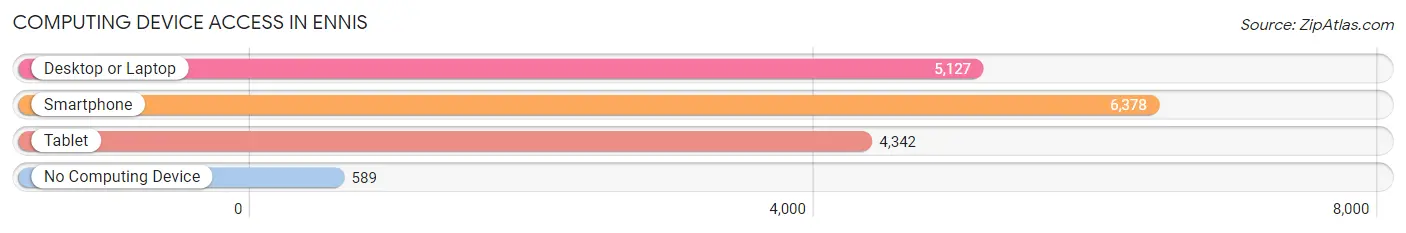
| Device Type | # Households | % Households |
| Desktop or Laptop | 5,127 | 70.5% |
| Smartphone | 6,378 | 87.7% |
| Tablet | 4,342 | 59.7% |
| No Computing Device | 589 | 8.1% |
| Total | 7,269 | 100.0% |
Internet Access in Ennis
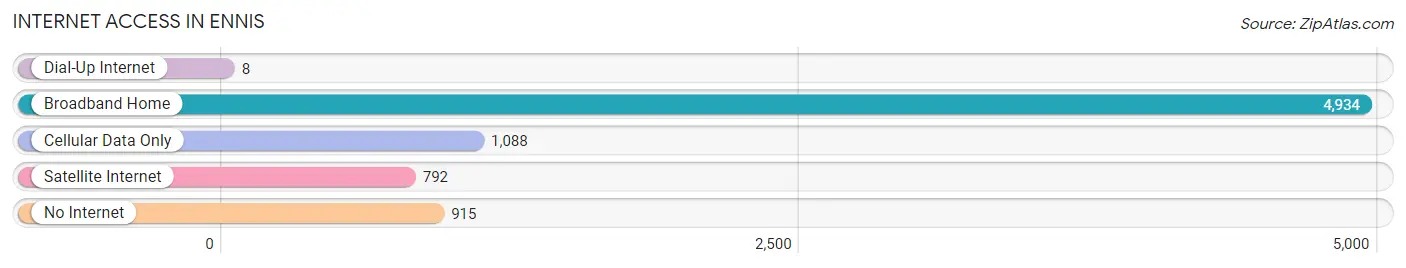
| Internet Type | # Households | % Households |
| Dial-Up Internet | 8 | 0.1% |
| Broadband Home | 4,934 | 67.9% |
| Cellular Data Only | 1,088 | 15.0% |
| Satellite Internet | 792 | 10.9% |
| No Internet | 915 | 12.6% |
| Total | 7,269 | 100.0% |
Ennis Summary
Ennis, Texas is a city located in Ellis County, Texas, United States. It is the county seat of Ellis County and is situated just south of Dallas. The city has a population of 18,513 as of the 2010 census, making it the 18th most populous city in the state of Texas.
History
Ennis was founded in 1872 by the Houston and Texas Central Railway. The city was named after Cornelius Ennis, a railroad official. The city was incorporated in 1873 and was the first city in Ellis County to be incorporated.
In the late 19th century, Ennis was a major cotton-producing center. The city was also home to a large number of cotton gins and other related businesses. The city was also home to a large number of saloons and brothels, which were popular with the railroad workers.
In the early 20th century, Ennis experienced a period of growth and prosperity. The city was home to a number of businesses, including a cotton mill, a brick plant, a canning factory, and a number of other businesses. The city also had a number of churches, schools, and other civic organizations.
In the mid-20th century, Ennis experienced a period of decline. The city's economy was hurt by the Great Depression and the decline of the cotton industry. The city's population also declined as people moved away in search of better economic opportunities.
Geography
Ennis is located in Ellis County, Texas, about 30 miles south of Dallas. The city is situated on the banks of the Trinity River and is surrounded by rolling hills and prairies. The city has a total area of 8.7 square miles, all of which is land.
Economy
Ennis is a major center for the production of cotton and other agricultural products. The city is also home to a number of manufacturing and service-based businesses. The city is home to a number of retail stores, restaurants, and other businesses.
The city is also home to a number of educational institutions, including the University of Texas at Dallas, Texas A&M University-Commerce, and Navarro College.
Demographics
As of the 2010 census, Ennis had a population of 18,513. The racial makeup of the city was 75.3% White, 11.2% African American, 0.7% Native American, 0.5% Asian, 0.1% Pacific Islander, 10.2% from other races, and 2.1% from two or more races. Hispanic or Latino of any race were 24.3% of the population.
The median income for a household in Ennis was $37,945, and the median income for a family was $45,945. The per capita income for the city was $19,945. About 17.2% of families and 20.7% of the population were below the poverty line, including 28.3% of those under age 18 and 11.7% of those age 65 or over.
Common Questions
What is Per Capita Income in Ennis?
Per Capita income in Ennis is $31,278.
What is the Median Family Income in Ennis?
Median Family Income in Ennis is $86,875.
What is the Median Household income in Ennis?
Median Household Income in Ennis is $73,176.
What is Income or Wage Gap in Ennis?
Income or Wage Gap in Ennis is 27.8%.
Women in Ennis earn 72.2 cents for every dollar earned by a man.
What is Family Income Deficit in Ennis?
Family Income Deficit in Ennis is $7,146.
Families that are below poverty line in Ennis earn $7,146 less on average than the poverty threshold level.
What is Inequality or Gini Index in Ennis?
Inequality or Gini Index in Ennis is 0.38.
What is the Total Population of Ennis?
Total Population of Ennis is 20,709.
What is the Total Male Population of Ennis?
Total Male Population of Ennis is 10,357.
What is the Total Female Population of Ennis?
Total Female Population of Ennis is 10,352.
What is the Ratio of Males per 100 Females in Ennis?
There are 100.05 Males per 100 Females in Ennis.
What is the Ratio of Females per 100 Males in Ennis?
There are 99.95 Females per 100 Males in Ennis.
What is the Median Population Age in Ennis?
Median Population Age in Ennis is 33.7 Years.
What is the Average Family Size in Ennis
Average Family Size in Ennis is 3.3 People.
What is the Average Household Size in Ennis
Average Household Size in Ennis is 2.8 People.
How Large is the Labor Force in Ennis?
There are 11,493 People in the Labor Forcein in Ennis.
What is the Percentage of People in the Labor Force in Ennis?
71.7% of People are in the Labor Force in Ennis.
What is the Unemployment Rate in Ennis?
Unemployment Rate in Ennis is 3.1%.