East Mountain, TX Map & Demographics
East Mountain Map
East Mountain Overview
$33,392
PER CAPITA INCOME
$84,167
AVG FAMILY INCOME
$67,500
AVG HOUSEHOLD INCOME
21.7%
WAGE / INCOME GAP [ % ]
78.3¢/ $1
WAGE / INCOME GAP [ $ ]
0.41
INEQUALITY / GINI INDEX
918
TOTAL POPULATION
497
MALE POPULATION
421
FEMALE POPULATION
118.05
MALES / 100 FEMALES
84.71
FEMALES / 100 MALES
37.8
MEDIAN AGE
3.4
AVG FAMILY SIZE
2.8
AVG HOUSEHOLD SIZE
396
LABOR FORCE [ PEOPLE ]
55.5%
PERCENT IN LABOR FORCE
3.3%
UNEMPLOYMENT RATE
Income in East Mountain
Income Overview in East Mountain
Per Capita Income in East Mountain is $33,392, while median incomes of families and households are $84,167 and $67,500 respectively.
| Characteristic | Number | Measure |
| Per Capita Income | 918 | $33,392 |
| Median Family Income | 232 | $84,167 |
| Mean Family Income | 232 | $103,357 |
| Median Household Income | 334 | $67,500 |
| Mean Household Income | 334 | $88,896 |
| Income Deficit | 232 | $0 |
| Wage / Income Gap (%) | 918 | 21.71% |
| Wage / Income Gap ($) | 918 | 78.29¢ per $1 |
| Gini / Inequality Index | 918 | 0.41 |
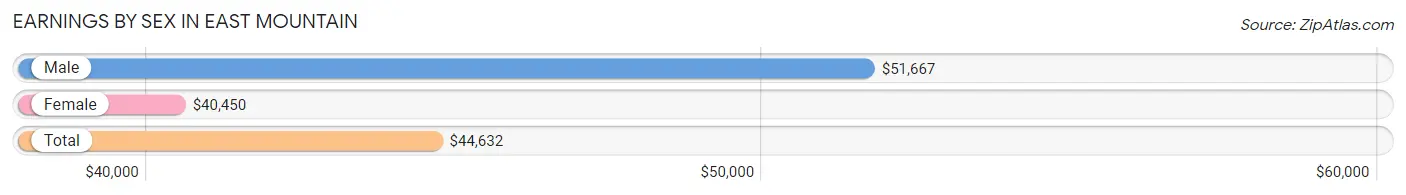
Earnings by Sex in East Mountain
Average Earnings in East Mountain are $44,632, $51,667 for men and $40,450 for women, a difference of 21.7%.
| Sex | Number | Average Earnings |
| Male | 252 (63.2%) | $51,667 |
| Female | 147 (36.8%) | $40,450 |
| Total | 399 (100.0%) | $44,632 |
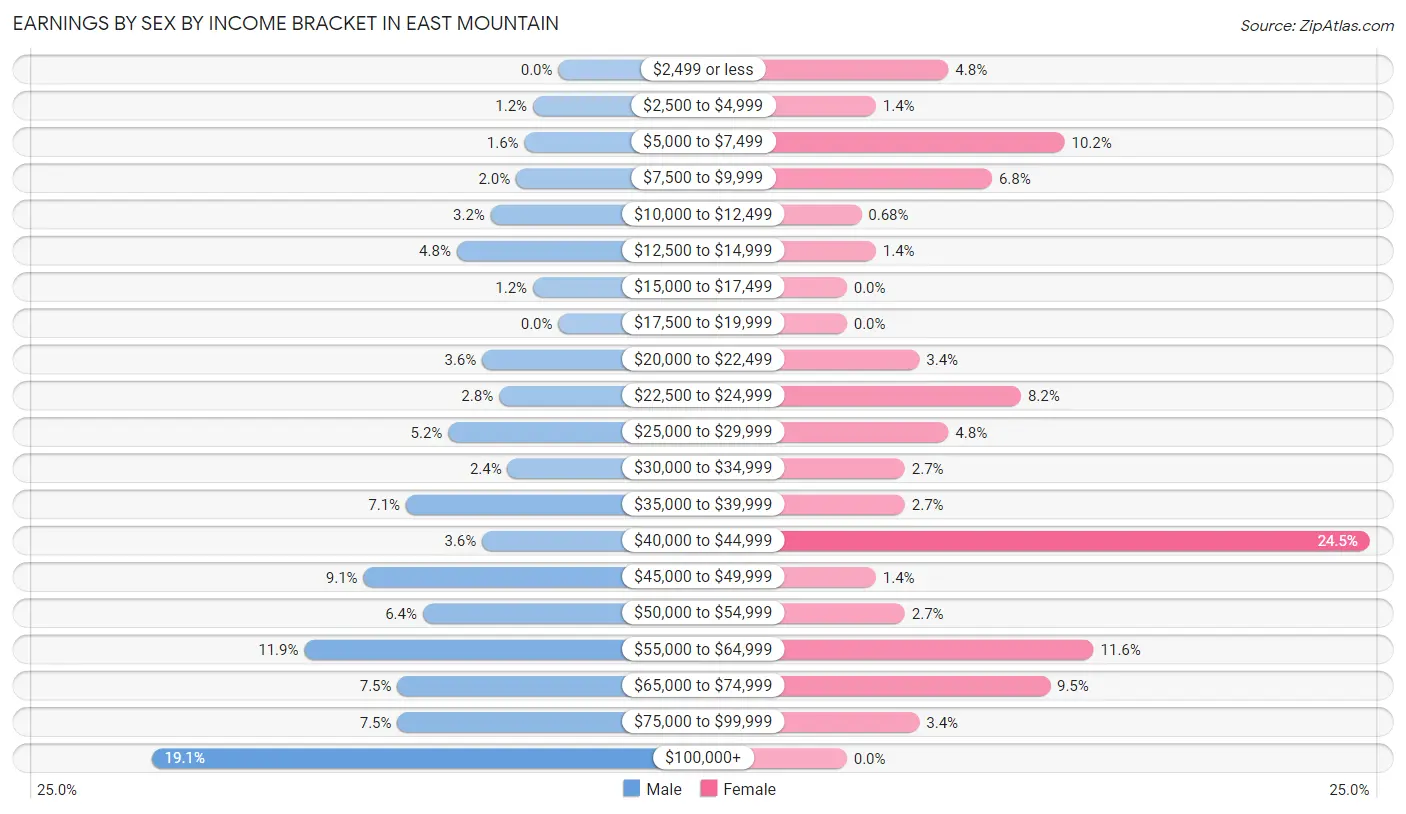
Earnings by Sex by Income Bracket in East Mountain
The most common earnings brackets in East Mountain are $100,000+ for men (48 | 19.1%) and $40,000 to $44,999 for women (36 | 24.5%).
| Income | Male | Female |
| $2,499 or less | 0 (0.0%) | 7 (4.8%) |
| $2,500 to $4,999 | 3 (1.2%) | 2 (1.4%) |
| $5,000 to $7,499 | 4 (1.6%) | 15 (10.2%) |
| $7,500 to $9,999 | 5 (2.0%) | 10 (6.8%) |
| $10,000 to $12,499 | 8 (3.2%) | 1 (0.7%) |
| $12,500 to $14,999 | 12 (4.8%) | 2 (1.4%) |
| $15,000 to $17,499 | 3 (1.2%) | 0 (0.0%) |
| $17,500 to $19,999 | 0 (0.0%) | 0 (0.0%) |
| $20,000 to $22,499 | 9 (3.6%) | 5 (3.4%) |
| $22,500 to $24,999 | 7 (2.8%) | 12 (8.2%) |
| $25,000 to $29,999 | 13 (5.2%) | 7 (4.8%) |
| $30,000 to $34,999 | 6 (2.4%) | 4 (2.7%) |
| $35,000 to $39,999 | 18 (7.1%) | 4 (2.7%) |
| $40,000 to $44,999 | 9 (3.6%) | 36 (24.5%) |
| $45,000 to $49,999 | 23 (9.1%) | 2 (1.4%) |
| $50,000 to $54,999 | 16 (6.4%) | 4 (2.7%) |
| $55,000 to $64,999 | 30 (11.9%) | 17 (11.6%) |
| $65,000 to $74,999 | 19 (7.5%) | 14 (9.5%) |
| $75,000 to $99,999 | 19 (7.5%) | 5 (3.4%) |
| $100,000+ | 48 (19.1%) | 0 (0.0%) |
| Total | 252 (100.0%) | 147 (100.0%) |
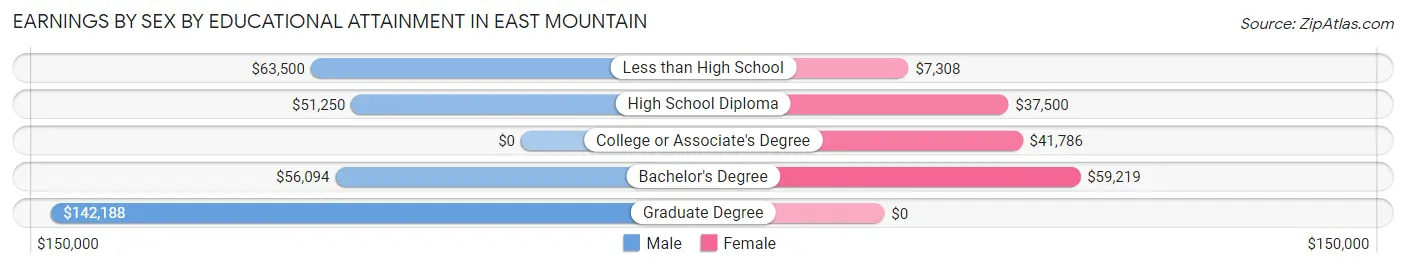
Earnings by Sex by Educational Attainment in East Mountain
Average earnings in East Mountain are $55,938 for men and $40,350 for women, a difference of 27.9%. Men with an educational attainment of graduate degree enjoy the highest average annual earnings of $142,188, while those with high school diploma education earn the least with $51,250. Women with an educational attainment of bachelor's degree earn the most with the average annual earnings of $59,219, while those with less than high school education have the smallest earnings of $7,308.
| Educational Attainment | Male Income | Female Income |
| Less than High School | $63,500 | $7,308 |
| High School Diploma | $51,250 | $37,500 |
| College or Associate's Degree | - | - |
| Bachelor's Degree | $56,094 | $59,219 |
| Graduate Degree | $142,188 | $0 |
| Total | $55,938 | $40,350 |
Family Income in East Mountain
Family Income Brackets in East Mountain
According to the East Mountain family income data, there are 52 families falling into the $50,000 to $74,999 income range, which is the most common income bracket and makes up 22.4% of all families.
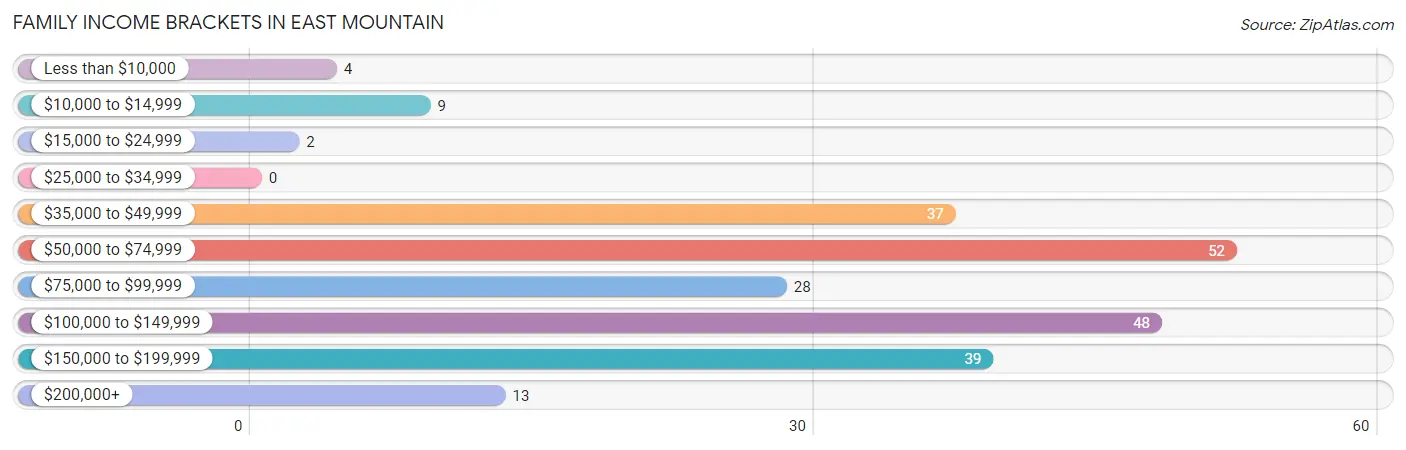
| Income Bracket | # Families | % Families |
| Less than $10,000 | 4 | 1.7% |
| $10,000 to $14,999 | 9 | 3.9% |
| $15,000 to $24,999 | 2 | 0.9% |
| $25,000 to $34,999 | 0 | 0.0% |
| $35,000 to $49,999 | 37 | 15.9% |
| $50,000 to $74,999 | 52 | 22.4% |
| $75,000 to $99,999 | 28 | 12.1% |
| $100,000 to $149,999 | 48 | 20.7% |
| $150,000 to $199,999 | 39 | 16.8% |
| $200,000+ | 13 | 5.6% |
Family Income by Famaliy Size in East Mountain
3-person families (27 | 11.6%) account for the highest median family income in East Mountain with $135,313 per family, while 3-person families (27 | 11.6%) have the highest median income of $45,104 per family member.
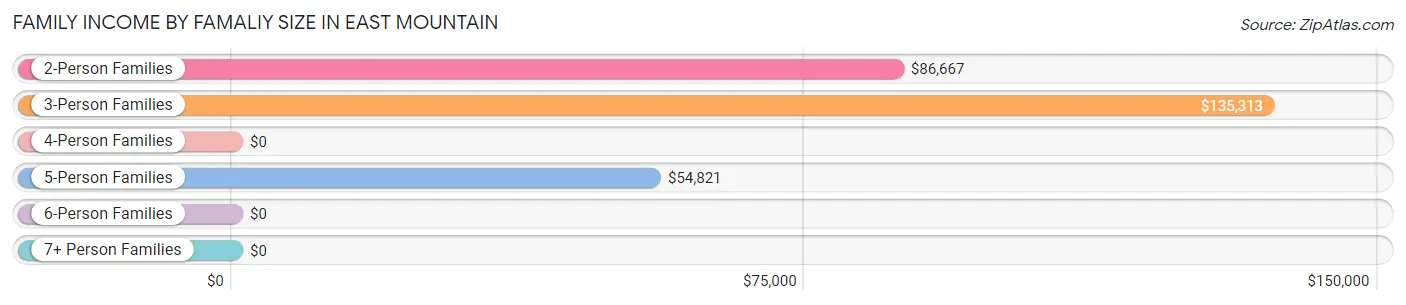
| Income Bracket | # Families | Median Income |
| 2-Person Families | 118 (50.9%) | $86,667 |
| 3-Person Families | 27 (11.6%) | $135,313 |
| 4-Person Families | 52 (22.4%) | $0 |
| 5-Person Families | 35 (15.1%) | $54,821 |
| 6-Person Families | 0 (0.0%) | $0 |
| 7+ Person Families | 0 (0.0%) | $0 |
| Total | 232 (100.0%) | $84,167 |
Family Income by Number of Earners in East Mountain
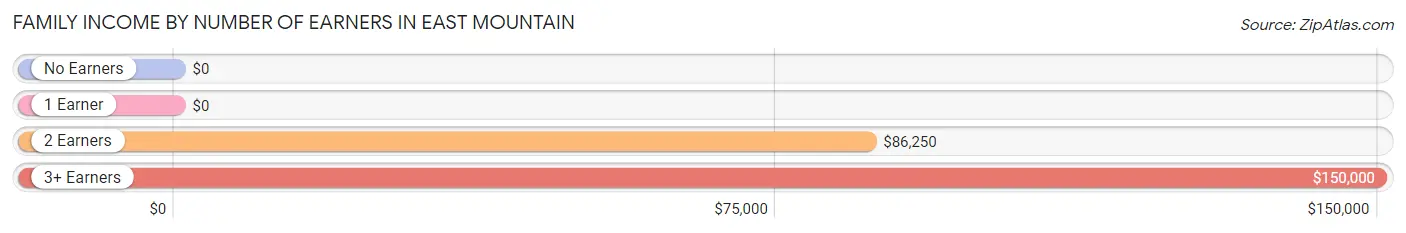
| Number of Earners | # Families | Median Income |
| No Earners | 27 (11.6%) | $0 |
| 1 Earner | 96 (41.4%) | $0 |
| 2 Earners | 95 (40.9%) | $86,250 |
| 3+ Earners | 14 (6.0%) | $150,000 |
| Total | 232 (100.0%) | $84,167 |
Household Income in East Mountain
Household Income Brackets in East Mountain
With 71 households falling in the category, the $50,000 to $74,999 income range is the most frequent in East Mountain, accounting for 21.3% of all households. In contrast, only 9 households (2.7%) fall into the less than $10,000 income bracket, making it the least populous group.
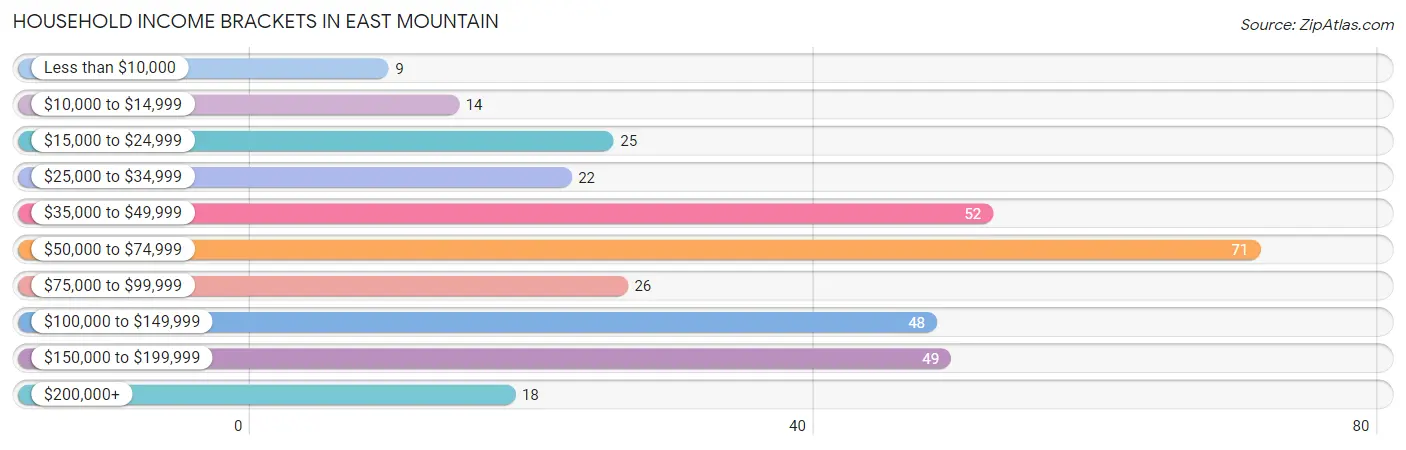
| Income Bracket | # Households | % Households |
| Less than $10,000 | 9 | 2.7% |
| $10,000 to $14,999 | 14 | 4.2% |
| $15,000 to $24,999 | 25 | 7.5% |
| $25,000 to $34,999 | 22 | 6.6% |
| $35,000 to $49,999 | 52 | 15.6% |
| $50,000 to $74,999 | 71 | 21.3% |
| $75,000 to $99,999 | 26 | 7.8% |
| $100,000 to $149,999 | 48 | 14.4% |
| $150,000 to $199,999 | 49 | 14.7% |
| $200,000+ | 18 | 5.4% |
Household Income by Householder Age in East Mountain
The median household income in East Mountain is $67,500, with the highest median household income of $74,375 found in the 25 to 44 years age bracket for the primary householder. A total of 112 households (33.5%) fall into this category. Meanwhile, the 15 to 24 years age bracket for the primary householder has the lowest median household income of $0, with 4 households (1.2%) in this group.
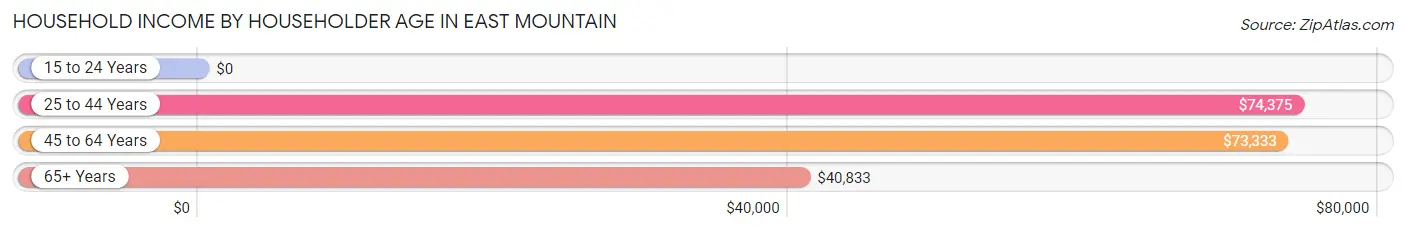
| Income Bracket | # Households | Median Income |
| 15 to 24 Years | 4 (1.2%) | $0 |
| 25 to 44 Years | 112 (33.5%) | $74,375 |
| 45 to 64 Years | 108 (32.3%) | $73,333 |
| 65+ Years | 110 (32.9%) | $40,833 |
| Total | 334 (100.0%) | $67,500 |
Poverty in East Mountain
Income Below Poverty by Sex and Age in East Mountain
With 2.6% poverty level for males and 8.6% for females among the residents of East Mountain, 65 to 74 year old males and 16 and 17 year old females are the most vulnerable to poverty, with 6 males (8.8%) and 4 females (66.7%) in their respective age groups living below the poverty level.
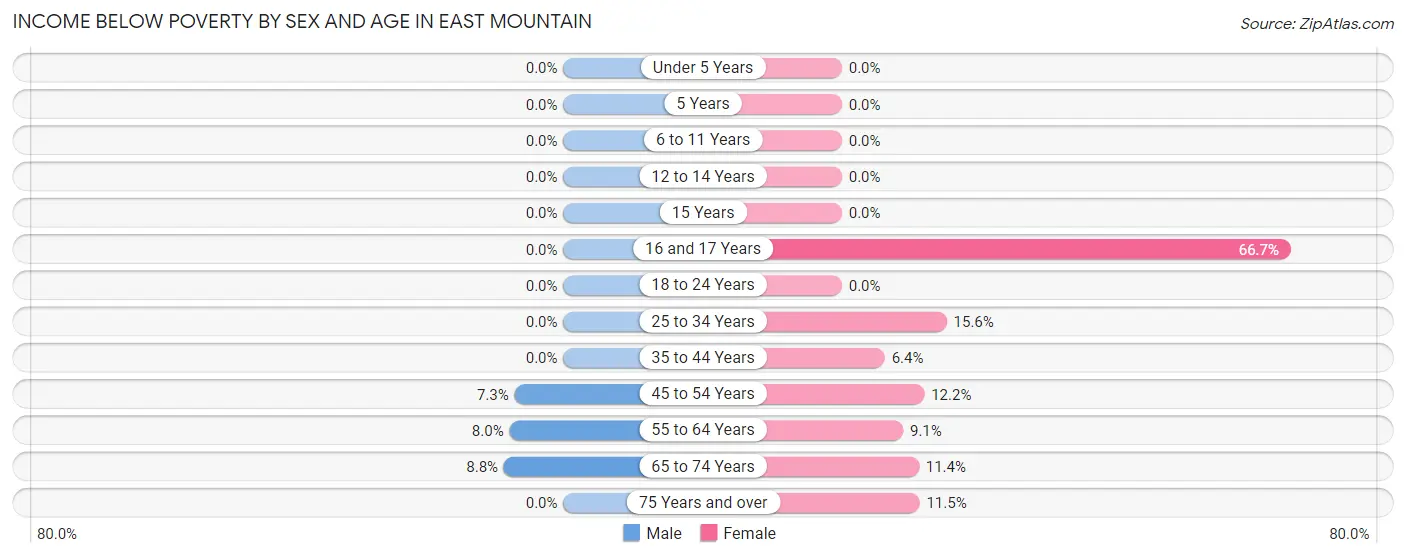
| Age Bracket | Male | Female |
| Under 5 Years | 0 (0.0%) | 0 (0.0%) |
| 5 Years | 0 (0.0%) | 0 (0.0%) |
| 6 to 11 Years | 0 (0.0%) | 0 (0.0%) |
| 12 to 14 Years | 0 (0.0%) | 0 (0.0%) |
| 15 Years | 0 (0.0%) | 0 (0.0%) |
| 16 and 17 Years | 0 (0.0%) | 4 (66.7%) |
| 18 to 24 Years | 0 (0.0%) | 0 (0.0%) |
| 25 to 34 Years | 0 (0.0%) | 7 (15.6%) |
| 35 to 44 Years | 0 (0.0%) | 6 (6.4%) |
| 45 to 54 Years | 5 (7.2%) | 6 (12.2%) |
| 55 to 64 Years | 2 (8.0%) | 2 (9.1%) |
| 65 to 74 Years | 6 (8.8%) | 8 (11.4%) |
| 75 Years and over | 0 (0.0%) | 3 (11.5%) |
| Total | 13 (2.6%) | 36 (8.6%) |
Income Above Poverty by Sex and Age in East Mountain
According to the poverty statistics in East Mountain, males aged under 5 years and females aged under 5 years are the age groups that are most secure financially, with 100.0% of males and 100.0% of females in these age groups living above the poverty line.
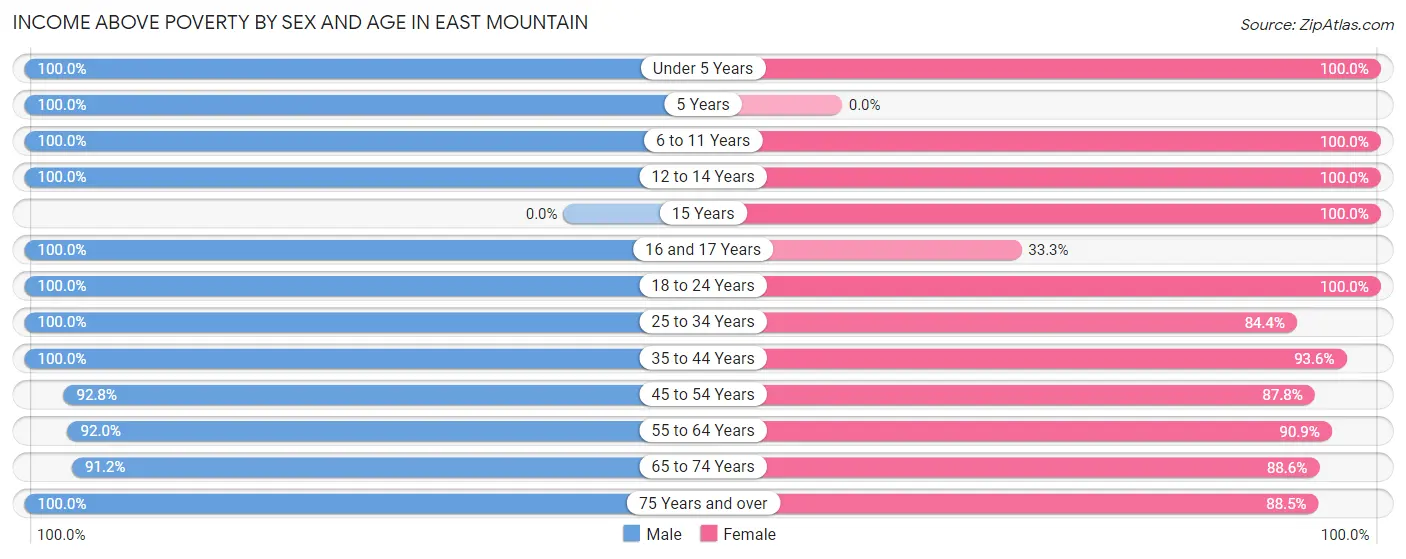
| Age Bracket | Male | Female |
| Under 5 Years | 40 (100.0%) | 21 (100.0%) |
| 5 Years | 7 (100.0%) | 0 (0.0%) |
| 6 to 11 Years | 34 (100.0%) | 53 (100.0%) |
| 12 to 14 Years | 27 (100.0%) | 10 (100.0%) |
| 15 Years | 0 (0.0%) | 12 (100.0%) |
| 16 and 17 Years | 14 (100.0%) | 2 (33.3%) |
| 18 to 24 Years | 86 (100.0%) | 13 (100.0%) |
| 25 to 34 Years | 52 (100.0%) | 38 (84.4%) |
| 35 to 44 Years | 66 (100.0%) | 88 (93.6%) |
| 45 to 54 Years | 64 (92.7%) | 43 (87.8%) |
| 55 to 64 Years | 23 (92.0%) | 20 (90.9%) |
| 65 to 74 Years | 62 (91.2%) | 62 (88.6%) |
| 75 Years and over | 9 (100.0%) | 23 (88.5%) |
| Total | 484 (97.4%) | 385 (91.4%) |
Income Below Poverty Among Married-Couple Families in East Mountain
The poverty statistics for married-couple families in East Mountain show that 4.1% or 9 of the total 218 families live below the poverty line. Families with no children have the highest poverty rate of 7.0%, comprising of 9 families. On the other hand, families with 1 or 2 children have the lowest poverty rate of 0.0%, which includes 0 families.
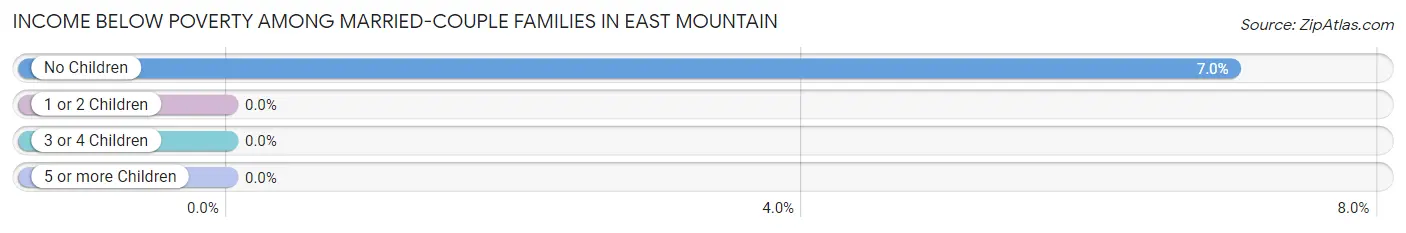
| Children | Above Poverty | Below Poverty |
| No Children | 120 (93.0%) | 9 (7.0%) |
| 1 or 2 Children | 72 (100.0%) | 0 (0.0%) |
| 3 or 4 Children | 17 (100.0%) | 0 (0.0%) |
| 5 or more Children | 0 (0.0%) | 0 (0.0%) |
| Total | 209 (95.9%) | 9 (4.1%) |
Income Below Poverty Among Single-Parent Households in East Mountain
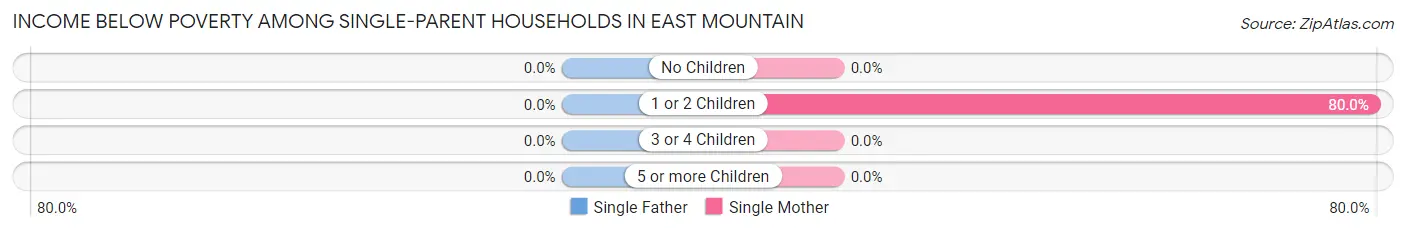
| Children | Single Father | Single Mother |
| No Children | 0 (0.0%) | 0 (0.0%) |
| 1 or 2 Children | 0 (0.0%) | 4 (80.0%) |
| 3 or 4 Children | 0 (0.0%) | 0 (0.0%) |
| 5 or more Children | 0 (0.0%) | 0 (0.0%) |
| Total | 0 (0.0%) | 4 (80.0%) |
Income Below Poverty Among Married-Couple vs Single-Parent Households in East Mountain
The poverty data for East Mountain shows that 9 of the married-couple family households (4.1%) and 4 of the single-parent households (28.6%) are living below the poverty level. Within the married-couple family households, those with no children have the highest poverty rate, with 9 households (7.0%) falling below the poverty line. Among the single-parent households, those with 1 or 2 children have the highest poverty rate, with 4 household (50.0%) living below poverty.
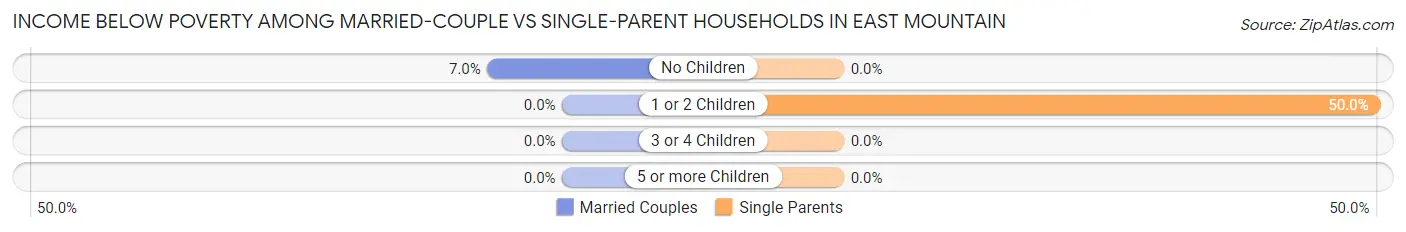
| Children | Married-Couple Families | Single-Parent Households |
| No Children | 9 (7.0%) | 0 (0.0%) |
| 1 or 2 Children | 0 (0.0%) | 4 (50.0%) |
| 3 or 4 Children | 0 (0.0%) | 0 (0.0%) |
| 5 or more Children | 0 (0.0%) | 0 (0.0%) |
| Total | 9 (4.1%) | 4 (28.6%) |
Race in East Mountain
The most populous races in East Mountain are White / Caucasian (713 | 77.7%), Hispanic or Latino (247 | 26.9%), and Two or more Races (111 | 12.1%).
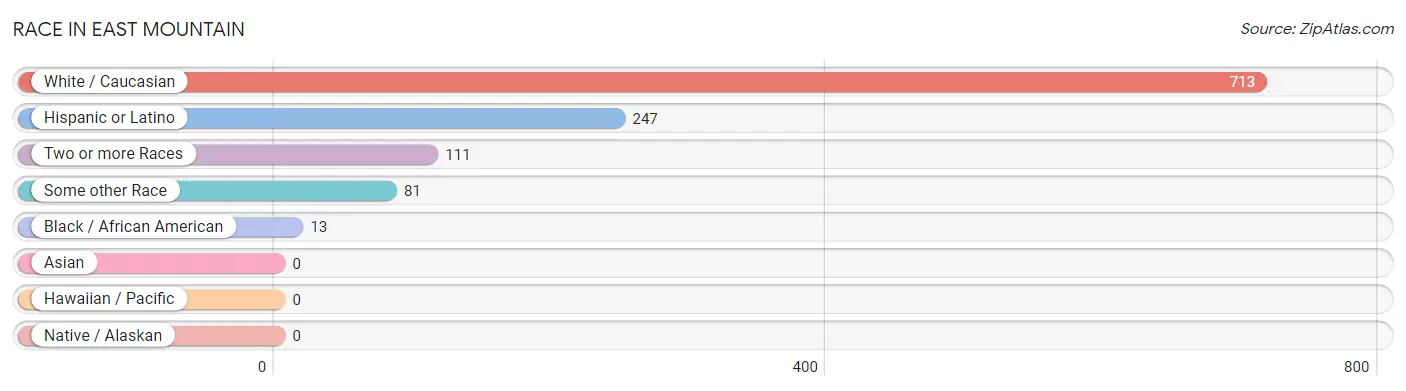
| Race | # Population | % Population |
| Asian | 0 | 0.0% |
| Black / African American | 13 | 1.4% |
| Hawaiian / Pacific | 0 | 0.0% |
| Hispanic or Latino | 247 | 26.9% |
| Native / Alaskan | 0 | 0.0% |
| White / Caucasian | 713 | 77.7% |
| Two or more Races | 111 | 12.1% |
| Some other Race | 81 | 8.8% |
| Total | 918 | 100.0% |
Ancestry in East Mountain
The most populous ancestries reported in East Mountain are Mexican (245 | 26.7%), German (109 | 11.9%), Irish (100 | 10.9%), American (46 | 5.0%), and English (43 | 4.7%), together accounting for 59.1% of all East Mountain residents.
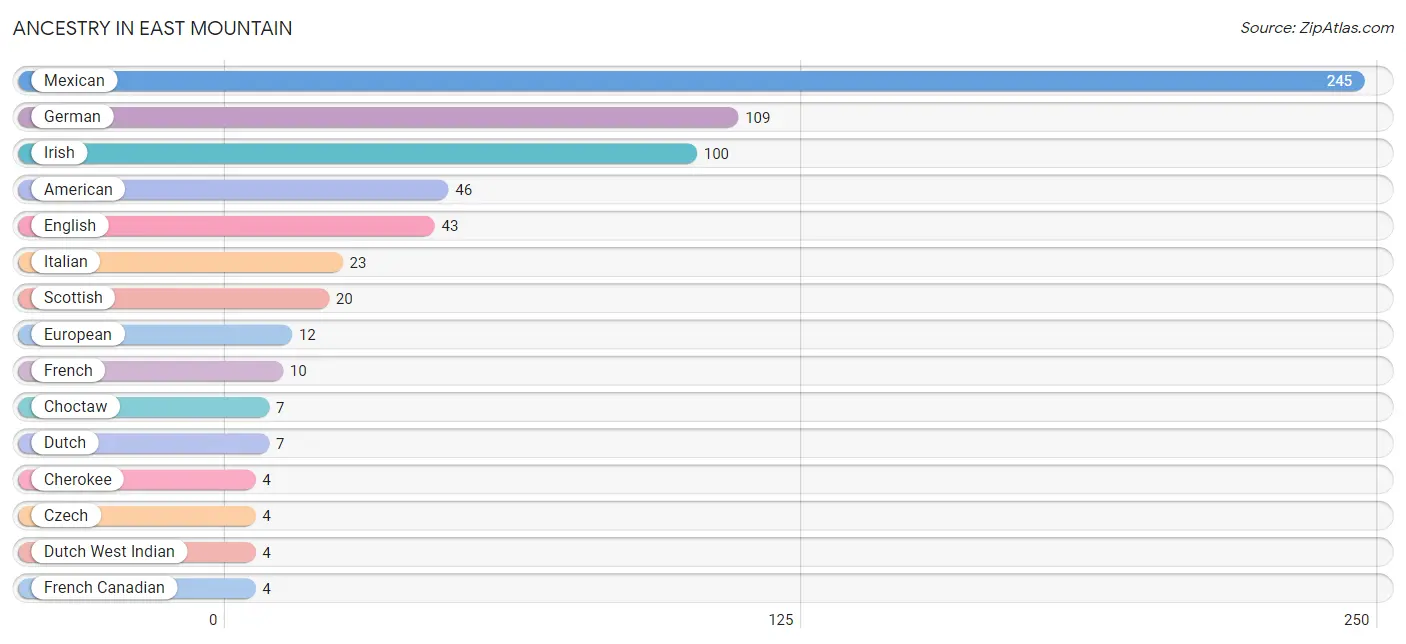
| Ancestry | # Population | % Population |
| American | 46 | 5.0% |
| Arab | 3 | 0.3% |
| Cherokee | 4 | 0.4% |
| Choctaw | 7 | 0.8% |
| Czech | 4 | 0.4% |
| Dutch | 7 | 0.8% |
| Dutch West Indian | 4 | 0.4% |
| English | 43 | 4.7% |
| European | 12 | 1.3% |
| French | 10 | 1.1% |
| French Canadian | 4 | 0.4% |
| German | 109 | 11.9% |
| Irish | 100 | 10.9% |
| Italian | 23 | 2.5% |
| Lebanese | 3 | 0.3% |
| Mexican | 245 | 26.7% |
| Polish | 4 | 0.4% |
| Puerto Rican | 2 | 0.2% |
| Scottish | 20 | 2.2% | View All 19 Rows |
Immigrants in East Mountain
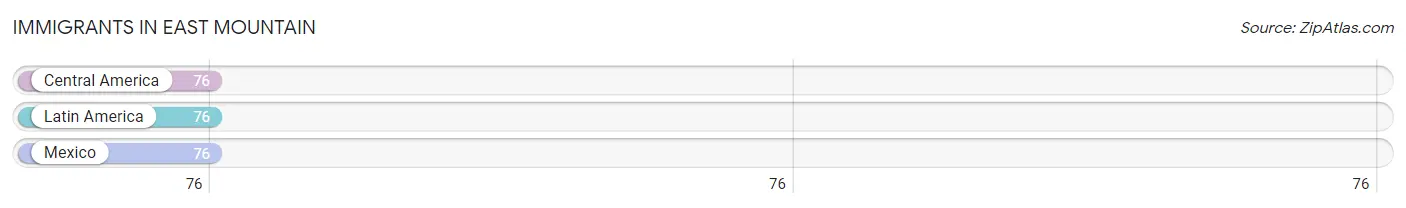
The most numerous immigrant groups reported in East Mountain came from Central America (76 | 8.3%), Latin America (76 | 8.3%), and Mexico (76 | 8.3%), together accounting for 24.8% of all East Mountain residents.
| Immigration Origin | # Population | % Population |
| Central America | 76 | 8.3% |
| Latin America | 76 | 8.3% |
| Mexico | 76 | 8.3% | View All 3 Rows |
Sex and Age in East Mountain
Sex and Age in East Mountain
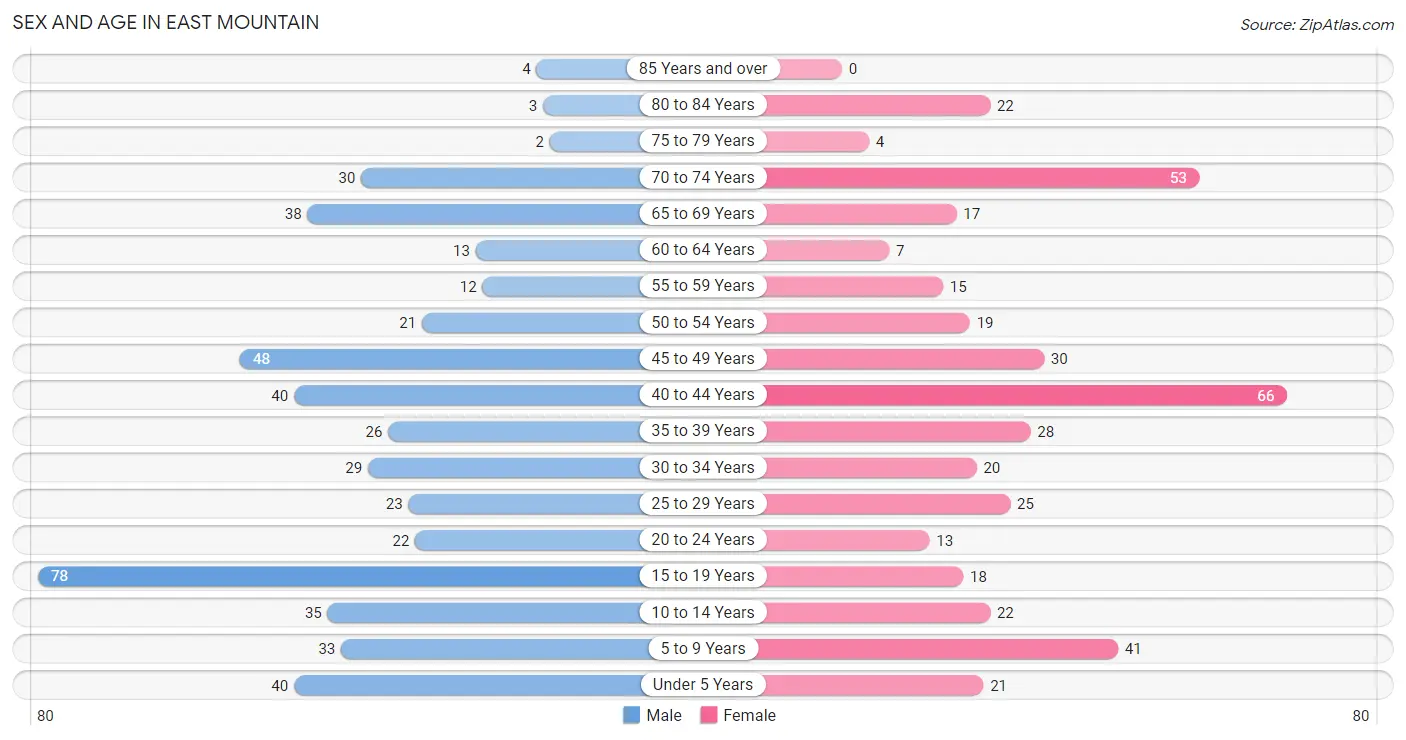
The most populous age groups in East Mountain are 15 to 19 Years (78 | 15.7%) for men and 40 to 44 Years (66 | 15.7%) for women.
| Age Bracket | Male | Female |
| Under 5 Years | 40 (8.1%) | 21 (5.0%) |
| 5 to 9 Years | 33 (6.6%) | 41 (9.7%) |
| 10 to 14 Years | 35 (7.0%) | 22 (5.2%) |
| 15 to 19 Years | 78 (15.7%) | 18 (4.3%) |
| 20 to 24 Years | 22 (4.4%) | 13 (3.1%) |
| 25 to 29 Years | 23 (4.6%) | 25 (5.9%) |
| 30 to 34 Years | 29 (5.8%) | 20 (4.8%) |
| 35 to 39 Years | 26 (5.2%) | 28 (6.7%) |
| 40 to 44 Years | 40 (8.1%) | 66 (15.7%) |
| 45 to 49 Years | 48 (9.7%) | 30 (7.1%) |
| 50 to 54 Years | 21 (4.2%) | 19 (4.5%) |
| 55 to 59 Years | 12 (2.4%) | 15 (3.6%) |
| 60 to 64 Years | 13 (2.6%) | 7 (1.7%) |
| 65 to 69 Years | 38 (7.6%) | 17 (4.0%) |
| 70 to 74 Years | 30 (6.0%) | 53 (12.6%) |
| 75 to 79 Years | 2 (0.4%) | 4 (0.9%) |
| 80 to 84 Years | 3 (0.6%) | 22 (5.2%) |
| 85 Years and over | 4 (0.8%) | 0 (0.0%) |
| Total | 497 (100.0%) | 421 (100.0%) |
Families and Households in East Mountain
Median Family Size in East Mountain
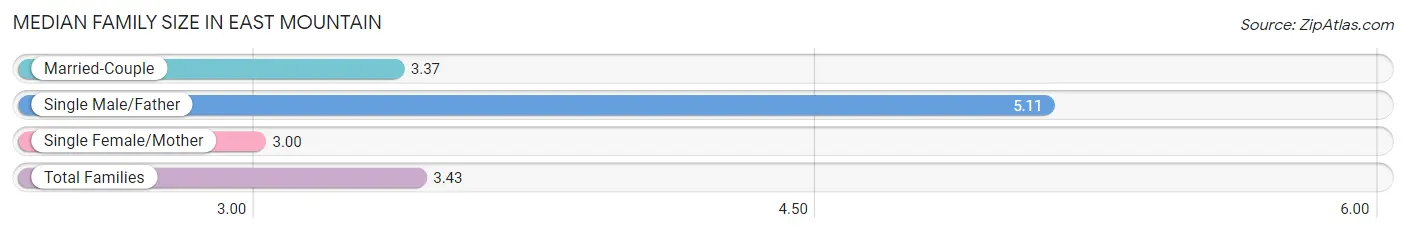
The median family size in East Mountain is 3.43 persons per family, with single male/father families (9 | 3.9%) accounting for the largest median family size of 5.11 persons per family. On the other hand, single female/mother families (5 | 2.2%) represent the smallest median family size with 3.00 persons per family.
| Family Type | # Families | Family Size |
| Married-Couple | 218 (94.0%) | 3.37 |
| Single Male/Father | 9 (3.9%) | 5.11 |
| Single Female/Mother | 5 (2.2%) | 3.00 |
| Total Families | 232 (100.0%) | 3.43 |
Median Household Size in East Mountain
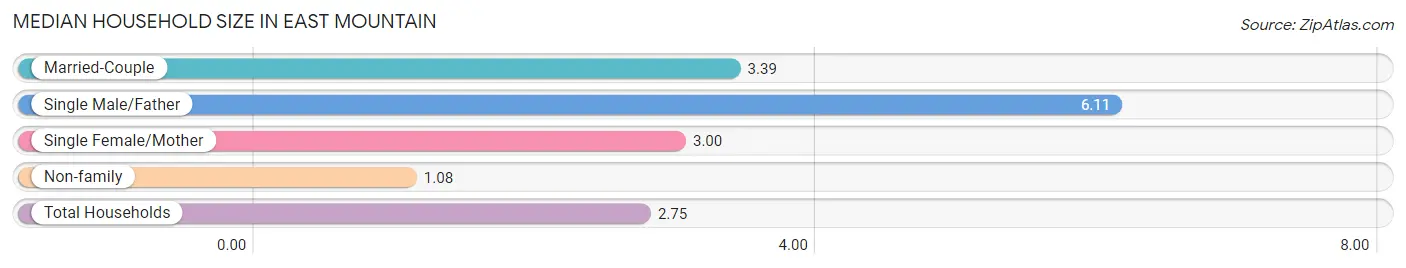
The median household size in East Mountain is 2.75 persons per household, with single male/father households (9 | 2.7%) accounting for the largest median household size of 6.11 persons per household. non-family households (102 | 30.5%) represent the smallest median household size with 1.08 persons per household.
| Household Type | # Households | Household Size |
| Married-Couple | 218 (65.3%) | 3.39 |
| Single Male/Father | 9 (2.7%) | 6.11 |
| Single Female/Mother | 5 (1.5%) | 3.00 |
| Non-family | 102 (30.5%) | 1.08 |
| Total Households | 334 (100.0%) | 2.75 |
Household Size by Marriage Status in East Mountain
Out of a total of 334 households in East Mountain, 232 (69.5%) are family households, while 102 (30.5%) are nonfamily households. The most numerous type of family households are 2-person households, comprising 115, and the most common type of nonfamily households are 1-person households, comprising 99.
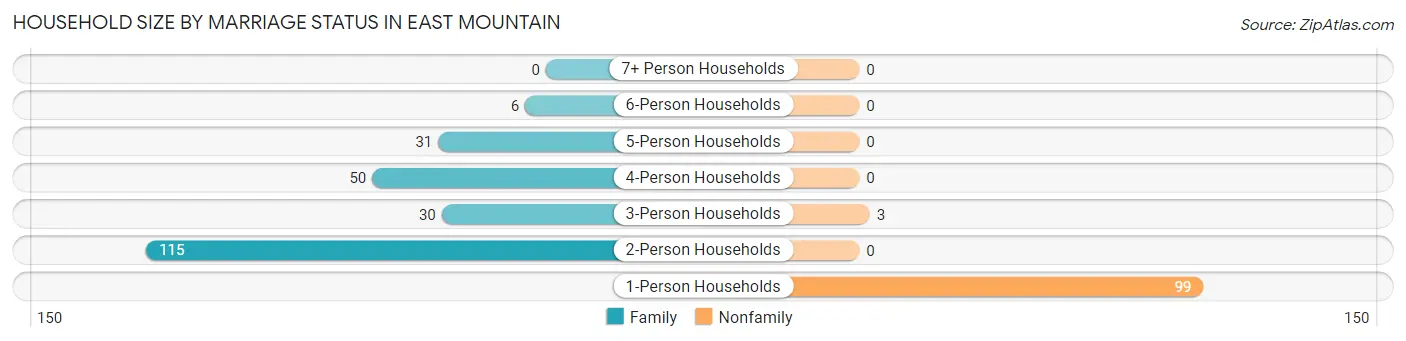
| Household Size | Family Households | Nonfamily Households |
| 1-Person Households | - | 99 (29.6%) |
| 2-Person Households | 115 (34.4%) | 0 (0.0%) |
| 3-Person Households | 30 (9.0%) | 3 (0.9%) |
| 4-Person Households | 50 (15.0%) | 0 (0.0%) |
| 5-Person Households | 31 (9.3%) | 0 (0.0%) |
| 6-Person Households | 6 (1.8%) | 0 (0.0%) |
| 7+ Person Households | 0 (0.0%) | 0 (0.0%) |
| Total | 232 (69.5%) | 102 (30.5%) |
Female Fertility in East Mountain
Fertility by Age in East Mountain
Average fertility rate in East Mountain is 65.0 births per 1,000 women. Women in the age bracket of 20 to 34 years have the highest fertility rate with 190.0 births per 1,000 women. Women in the age bracket of 20 to 34 years acount for 78.6% of all women with births.
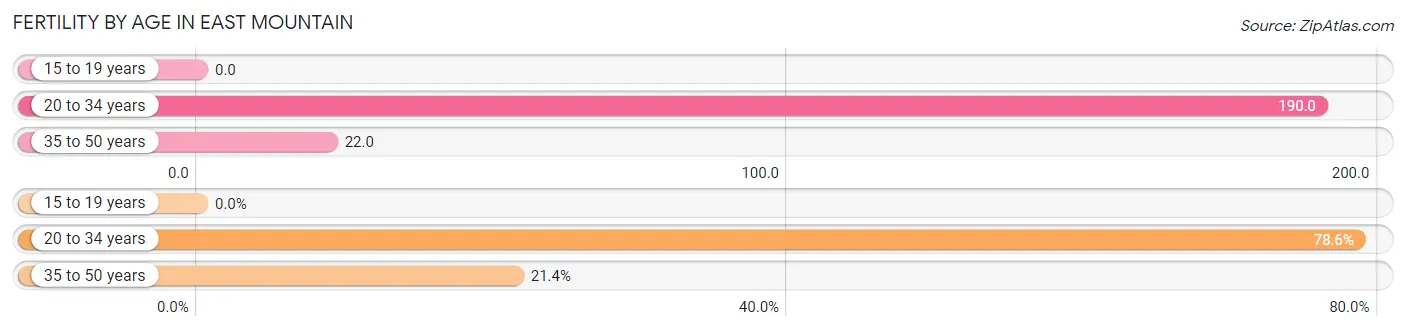
| Age Bracket | Women with Births | Births / 1,000 Women |
| 15 to 19 years | 0 (0.0%) | 0.0 |
| 20 to 34 years | 11 (78.6%) | 190.0 |
| 35 to 50 years | 3 (21.4%) | 22.0 |
| Total | 14 (100.0%) | 65.0 |
Fertility by Age by Marriage Status in East Mountain
50.0% of women with births (14) in East Mountain are married. The highest percentage of unmarried women with births falls into 20 to 34 years age bracket with 63.6% of them unmarried at the time of birth, while the lowest percentage of unmarried women with births belong to 35 to 50 years age bracket with 0.0% of them unmarried.
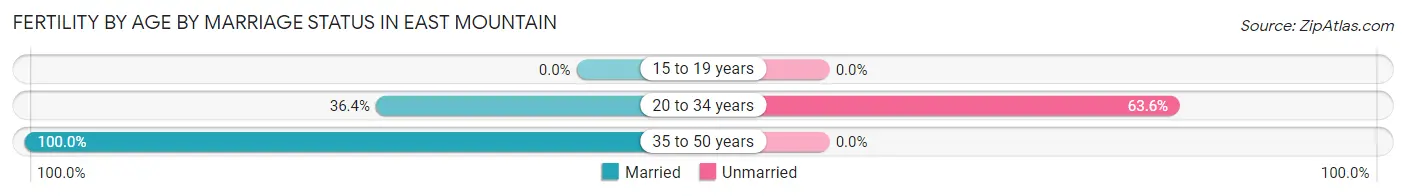
| Age Bracket | Married | Unmarried |
| 15 to 19 years | 0 (0.0%) | 0 (0.0%) |
| 20 to 34 years | 4 (36.4%) | 7 (63.6%) |
| 35 to 50 years | 3 (100.0%) | 0 (0.0%) |
| Total | 7 (50.0%) | 7 (50.0%) |
Fertility by Education in East Mountain
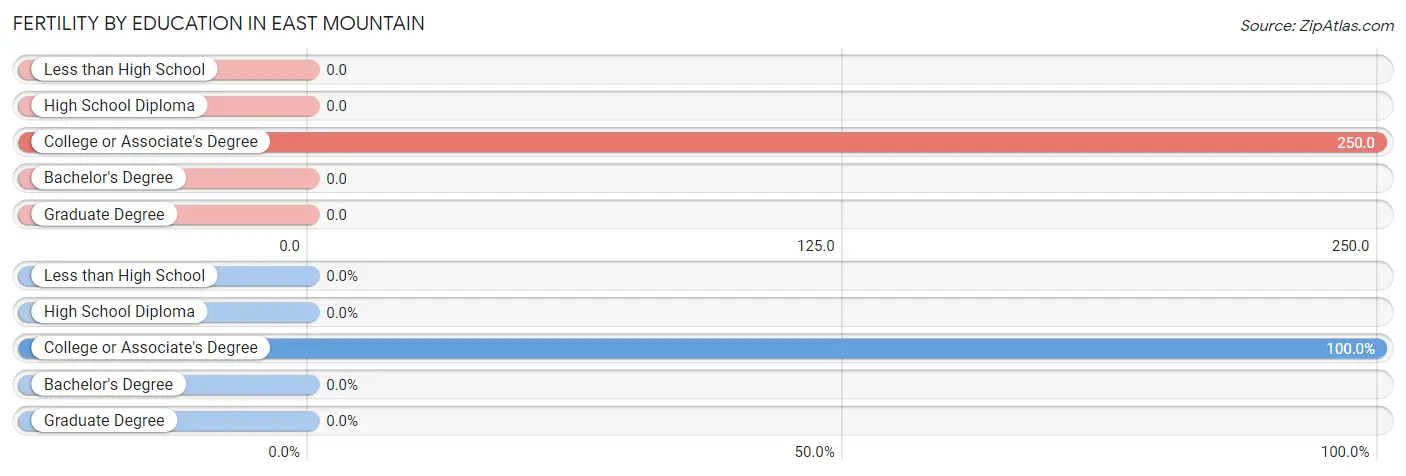
| Educational Attainment | Women with Births | Births / 1,000 Women |
| Less than High School | 0 (0.0%) | 0.0 |
| High School Diploma | 0 (0.0%) | 0.0 |
| College or Associate's Degree | 14 (100.0%) | 250.0 |
| Bachelor's Degree | 0 (0.0%) | 0.0 |
| Graduate Degree | 0 (0.0%) | 0.0 |
| Total | 14 (100.0%) | 65.0 |
Fertility by Education by Marriage Status in East Mountain
50.0% of women with births in East Mountain are unmarried. Women with the educational attainment of college or associate's degree are most likely to be married with 50.0% of them married at childbirth, while women with the educational attainment of college or associate's degree are least likely to be married with 50.0% of them unmarried at childbirth.
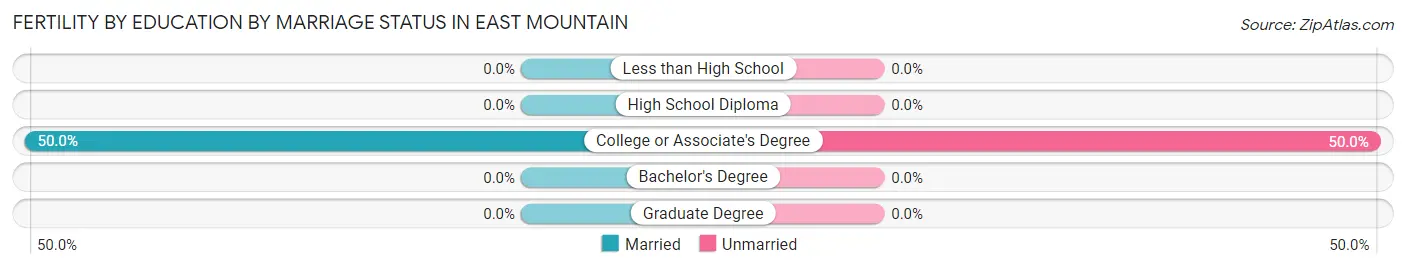
| Educational Attainment | Married | Unmarried |
| Less than High School | 0 (0.0%) | 0 (0.0%) |
| High School Diploma | 0 (0.0%) | 0 (0.0%) |
| College or Associate's Degree | 7 (50.0%) | 7 (50.0%) |
| Bachelor's Degree | 0 (0.0%) | 0 (0.0%) |
| Graduate Degree | 0 (0.0%) | 0 (0.0%) |
| Total | 7 (50.0%) | 7 (50.0%) |
Employment Characteristics in East Mountain
Employment by Class of Employer in East Mountain
Among the 379 employed individuals in East Mountain, private company employees (270 | 71.2%), self-employed (not incorporated) (34 | 9.0%), and self-employed (incorporated) (29 | 7.6%) make up the most common classes of employment.
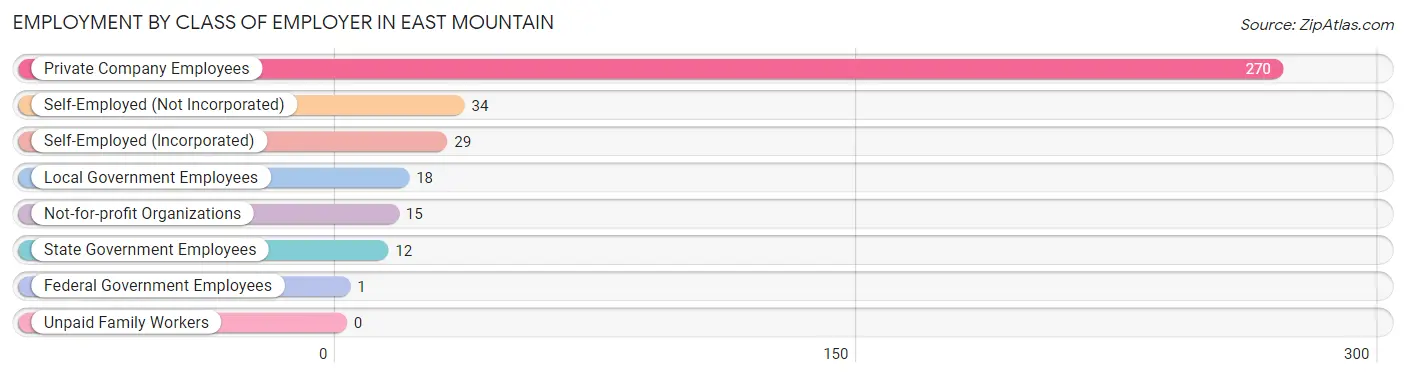
| Employer Class | # Employees | % Employees |
| Private Company Employees | 270 | 71.2% |
| Self-Employed (Incorporated) | 29 | 7.6% |
| Self-Employed (Not Incorporated) | 34 | 9.0% |
| Not-for-profit Organizations | 15 | 4.0% |
| Local Government Employees | 18 | 4.8% |
| State Government Employees | 12 | 3.2% |
| Federal Government Employees | 1 | 0.3% |
| Unpaid Family Workers | 0 | 0.0% |
| Total | 379 | 100.0% |
Employment Status by Age in East Mountain
According to the labor force statistics for East Mountain, out of the total population over 16 years of age (714), 55.5% or 396 individuals are in the labor force, with 3.3% or 13 of them unemployed. The age group with the highest labor force participation rate is 45 to 54 years, with 86.4% or 102 individuals in the labor force. Within the labor force, the 16 to 19 years age range has the highest percentage of unemployed individuals, with 50.0% or 4 of them being unemployed.
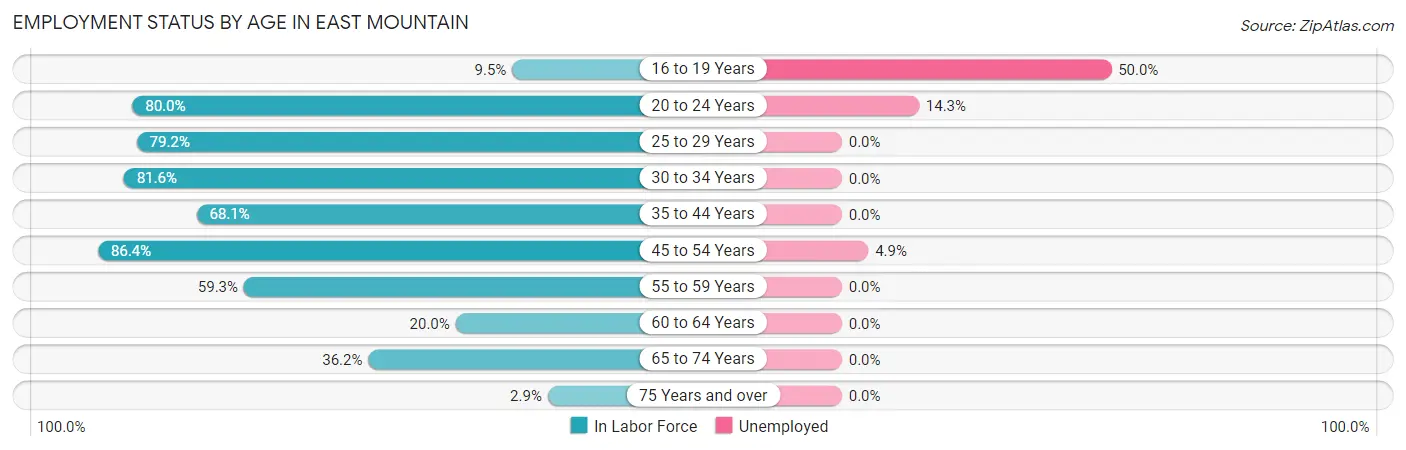
| Age Bracket | In Labor Force | Unemployed |
| 16 to 19 Years | 8 (9.5%) | 4 (50.0%) |
| 20 to 24 Years | 28 (80.0%) | 4 (14.3%) |
| 25 to 29 Years | 38 (79.2%) | 0 (0.0%) |
| 30 to 34 Years | 40 (81.6%) | 0 (0.0%) |
| 35 to 44 Years | 109 (68.1%) | 0 (0.0%) |
| 45 to 54 Years | 102 (86.4%) | 5 (4.9%) |
| 55 to 59 Years | 16 (59.3%) | 0 (0.0%) |
| 60 to 64 Years | 4 (20.0%) | 0 (0.0%) |
| 65 to 74 Years | 50 (36.2%) | 0 (0.0%) |
| 75 Years and over | 1 (2.9%) | 0 (0.0%) |
| Total | 396 (55.5%) | 13 (3.3%) |
Employment Status by Educational Attainment in East Mountain
According to labor force statistics for East Mountain, 73.2% of individuals (309) out of the total population between 25 and 64 years of age (422) are in the labor force, with 1.6% or 5 of them being unemployed. The group with the highest labor force participation rate are those with the educational attainment of bachelor's degree or higher, with 86.1% or 62 individuals in the labor force. Within the labor force, individuals with less than high school education have the highest percentage of unemployment, with 7.4% or 5 of them being unemployed.
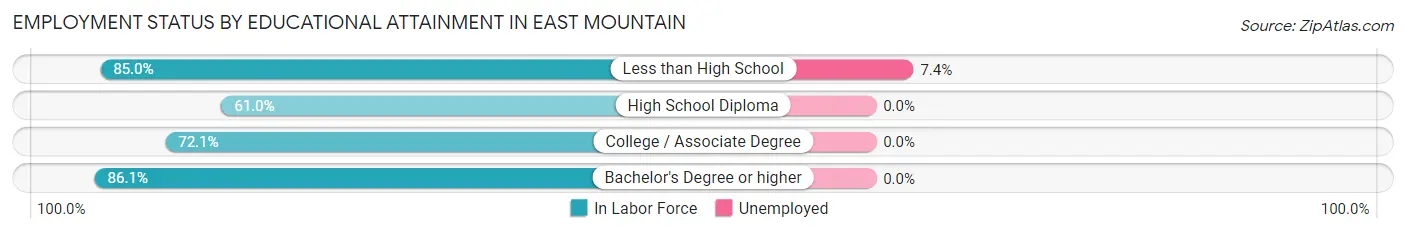
| Educational Attainment | In Labor Force | Unemployed |
| Less than High School | 68 (85.0%) | 6 (7.4%) |
| High School Diploma | 86 (61.0%) | 0 (0.0%) |
| College / Associate Degree | 93 (72.1%) | 0 (0.0%) |
| Bachelor's Degree or higher | 62 (86.1%) | 0 (0.0%) |
| Total | 309 (73.2%) | 7 (1.6%) |
Employment Occupations by Sex in East Mountain
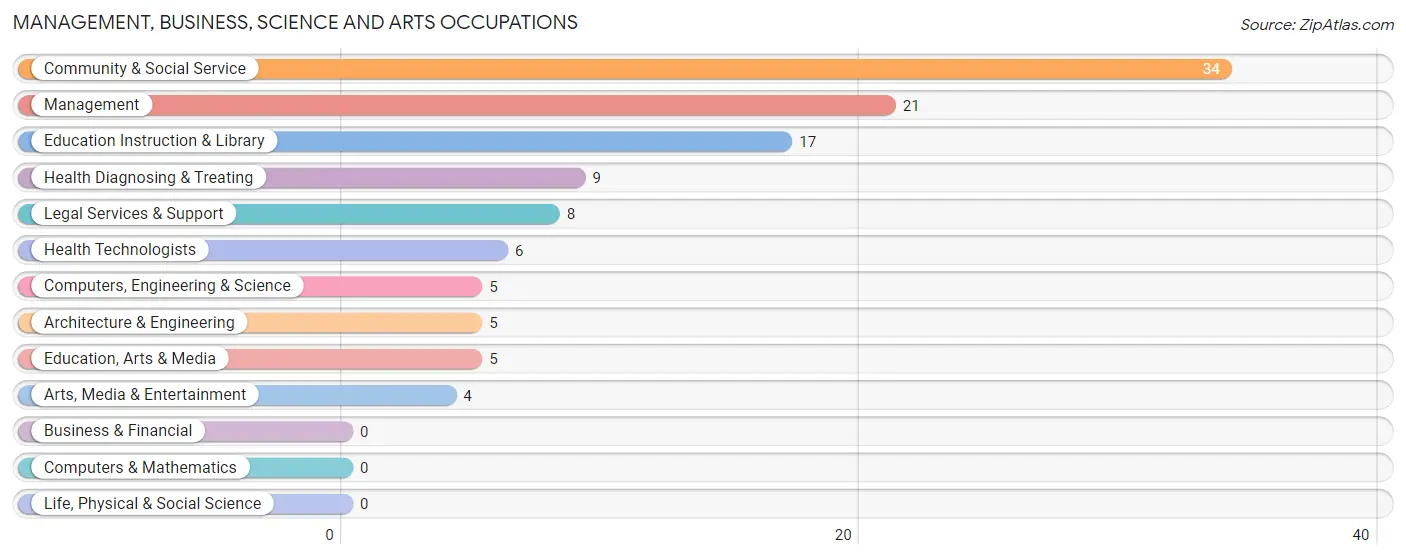
Management, Business, Science and Arts Occupations
The most common Management, Business, Science and Arts occupations in East Mountain are Community & Social Service (34 | 8.9%), Management (21 | 5.5%), Education Instruction & Library (17 | 4.4%), Health Diagnosing & Treating (9 | 2.4%), and Legal Services & Support (8 | 2.1%).
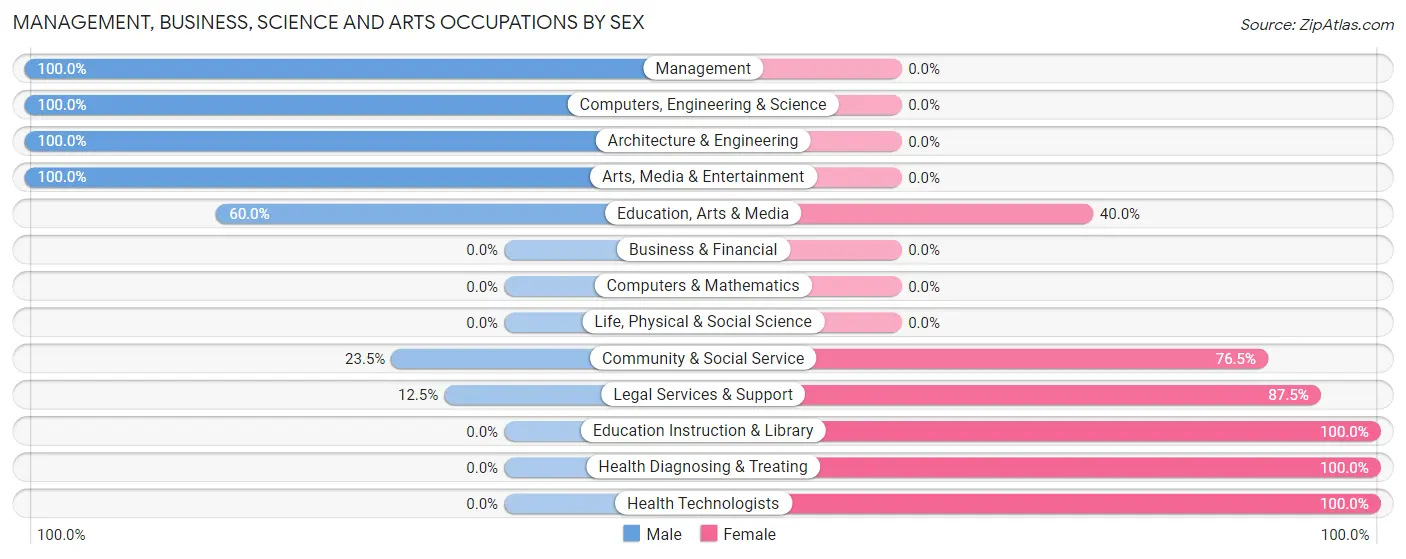
Management, Business, Science and Arts Occupations by Sex
Within the Management, Business, Science and Arts occupations in East Mountain, the most male-oriented occupations are Management (100.0%), Computers, Engineering & Science (100.0%), and Architecture & Engineering (100.0%), while the most female-oriented occupations are Education Instruction & Library (100.0%), Health Diagnosing & Treating (100.0%), and Health Technologists (100.0%).
| Occupation | Male | Female |
| Management | 21 (100.0%) | 0 (0.0%) |
| Business & Financial | 0 (0.0%) | 0 (0.0%) |
| Computers, Engineering & Science | 5 (100.0%) | 0 (0.0%) |
| Computers & Mathematics | 0 (0.0%) | 0 (0.0%) |
| Architecture & Engineering | 5 (100.0%) | 0 (0.0%) |
| Life, Physical & Social Science | 0 (0.0%) | 0 (0.0%) |
| Community & Social Service | 8 (23.5%) | 26 (76.5%) |
| Education, Arts & Media | 3 (60.0%) | 2 (40.0%) |
| Legal Services & Support | 1 (12.5%) | 7 (87.5%) |
| Education Instruction & Library | 0 (0.0%) | 17 (100.0%) |
| Arts, Media & Entertainment | 4 (100.0%) | 0 (0.0%) |
| Health Diagnosing & Treating | 0 (0.0%) | 9 (100.0%) |
| Health Technologists | 0 (0.0%) | 6 (100.0%) |
| Total (Category) | 34 (49.3%) | 35 (50.7%) |
| Total (Overall) | 243 (63.4%) | 140 (36.5%) |
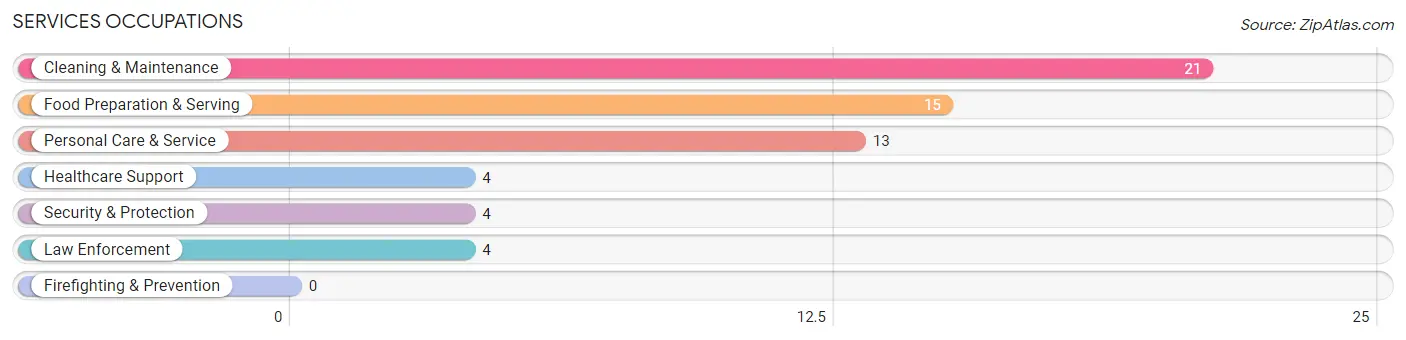
Services Occupations
The most common Services occupations in East Mountain are Cleaning & Maintenance (21 | 5.5%), Food Preparation & Serving (15 | 3.9%), Personal Care & Service (13 | 3.4%), Healthcare Support (4 | 1.0%), and Security & Protection (4 | 1.0%).
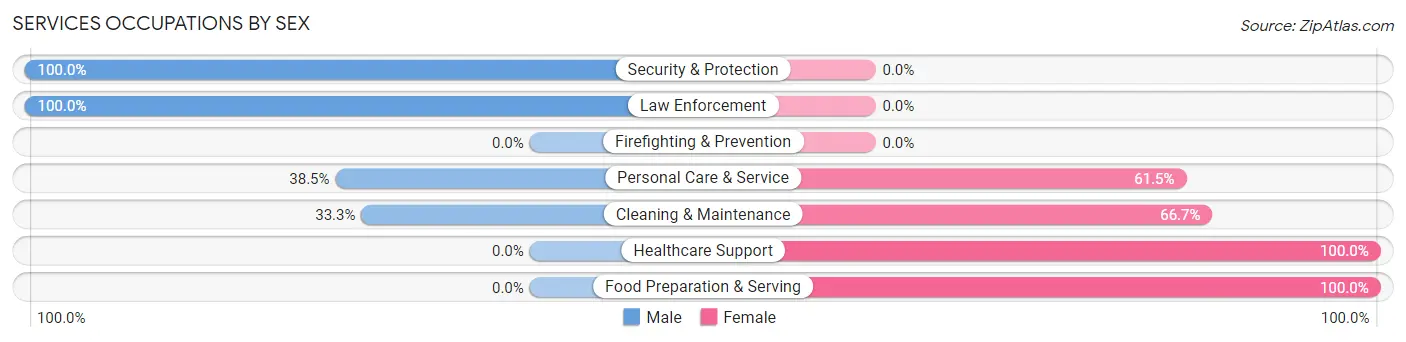
Services Occupations by Sex
Within the Services occupations in East Mountain, the most male-oriented occupations are Security & Protection (100.0%), Law Enforcement (100.0%), and Personal Care & Service (38.5%), while the most female-oriented occupations are Healthcare Support (100.0%), Food Preparation & Serving (100.0%), and Cleaning & Maintenance (66.7%).
| Occupation | Male | Female |
| Healthcare Support | 0 (0.0%) | 4 (100.0%) |
| Security & Protection | 4 (100.0%) | 0 (0.0%) |
| Firefighting & Prevention | 0 (0.0%) | 0 (0.0%) |
| Law Enforcement | 4 (100.0%) | 0 (0.0%) |
| Food Preparation & Serving | 0 (0.0%) | 15 (100.0%) |
| Cleaning & Maintenance | 7 (33.3%) | 14 (66.7%) |
| Personal Care & Service | 5 (38.5%) | 8 (61.5%) |
| Total (Category) | 16 (28.1%) | 41 (71.9%) |
| Total (Overall) | 243 (63.4%) | 140 (36.5%) |
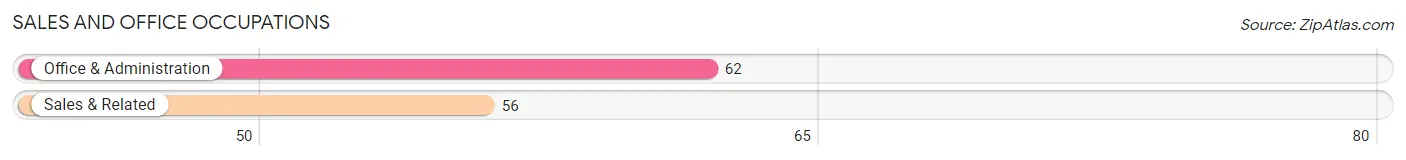
Sales and Office Occupations
The most common Sales and Office occupations in East Mountain are Office & Administration (62 | 16.2%), and Sales & Related (56 | 14.6%).
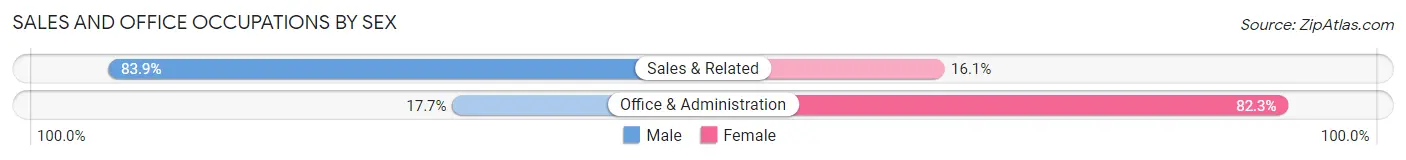
Sales and Office Occupations by Sex
| Occupation | Male | Female |
| Sales & Related | 47 (83.9%) | 9 (16.1%) |
| Office & Administration | 11 (17.7%) | 51 (82.3%) |
| Total (Category) | 58 (49.1%) | 60 (50.8%) |
| Total (Overall) | 243 (63.4%) | 140 (36.5%) |
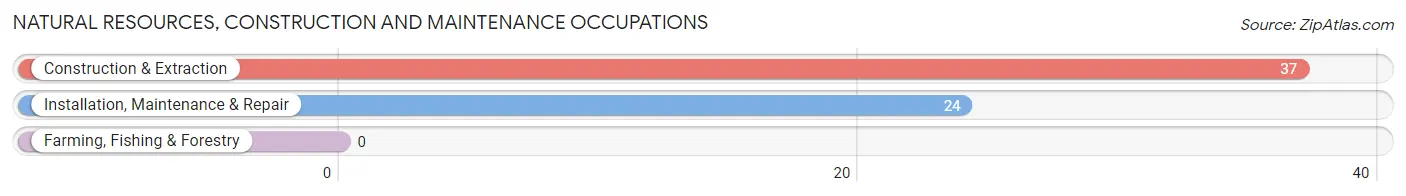
Natural Resources, Construction and Maintenance Occupations
The most common Natural Resources, Construction and Maintenance occupations in East Mountain are Construction & Extraction (37 | 9.7%), and Installation, Maintenance & Repair (24 | 6.3%).
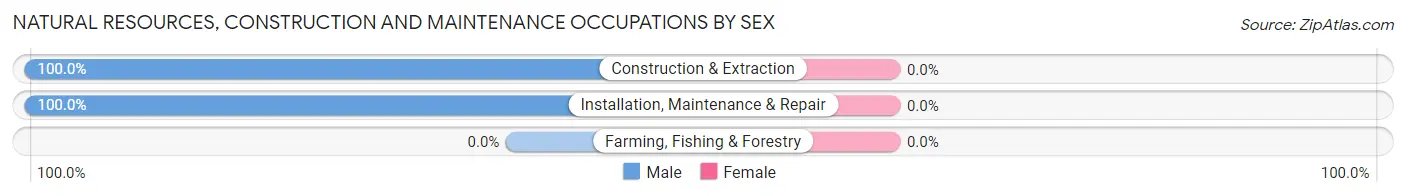
Natural Resources, Construction and Maintenance Occupations by Sex
| Occupation | Male | Female |
| Farming, Fishing & Forestry | 0 (0.0%) | 0 (0.0%) |
| Construction & Extraction | 37 (100.0%) | 0 (0.0%) |
| Installation, Maintenance & Repair | 24 (100.0%) | 0 (0.0%) |
| Total (Category) | 61 (100.0%) | 0 (0.0%) |
| Total (Overall) | 243 (63.4%) | 140 (36.5%) |
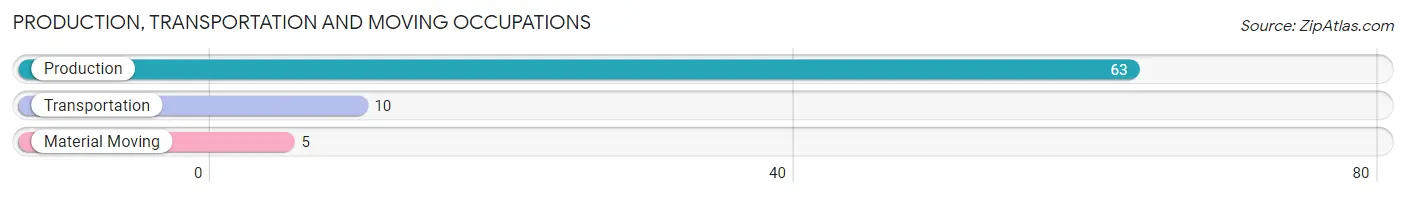
Production, Transportation and Moving Occupations
The most common Production, Transportation and Moving occupations in East Mountain are Production (63 | 16.5%), Transportation (10 | 2.6%), and Material Moving (5 | 1.3%).
Production, Transportation and Moving Occupations by Sex
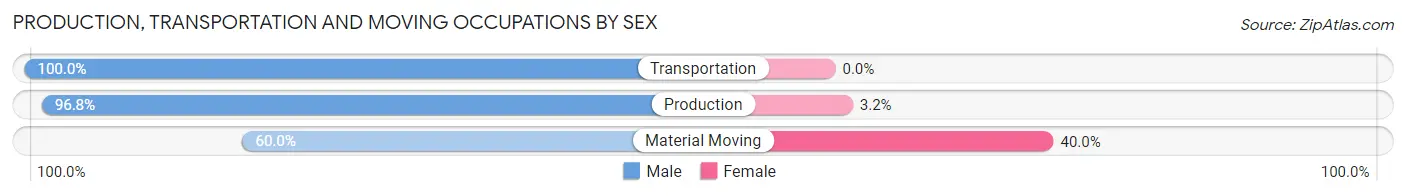
| Occupation | Male | Female |
| Production | 61 (96.8%) | 2 (3.2%) |
| Transportation | 10 (100.0%) | 0 (0.0%) |
| Material Moving | 3 (60.0%) | 2 (40.0%) |
| Total (Category) | 74 (94.9%) | 4 (5.1%) |
| Total (Overall) | 243 (63.4%) | 140 (36.5%) |
Employment Industries by Sex in East Mountain
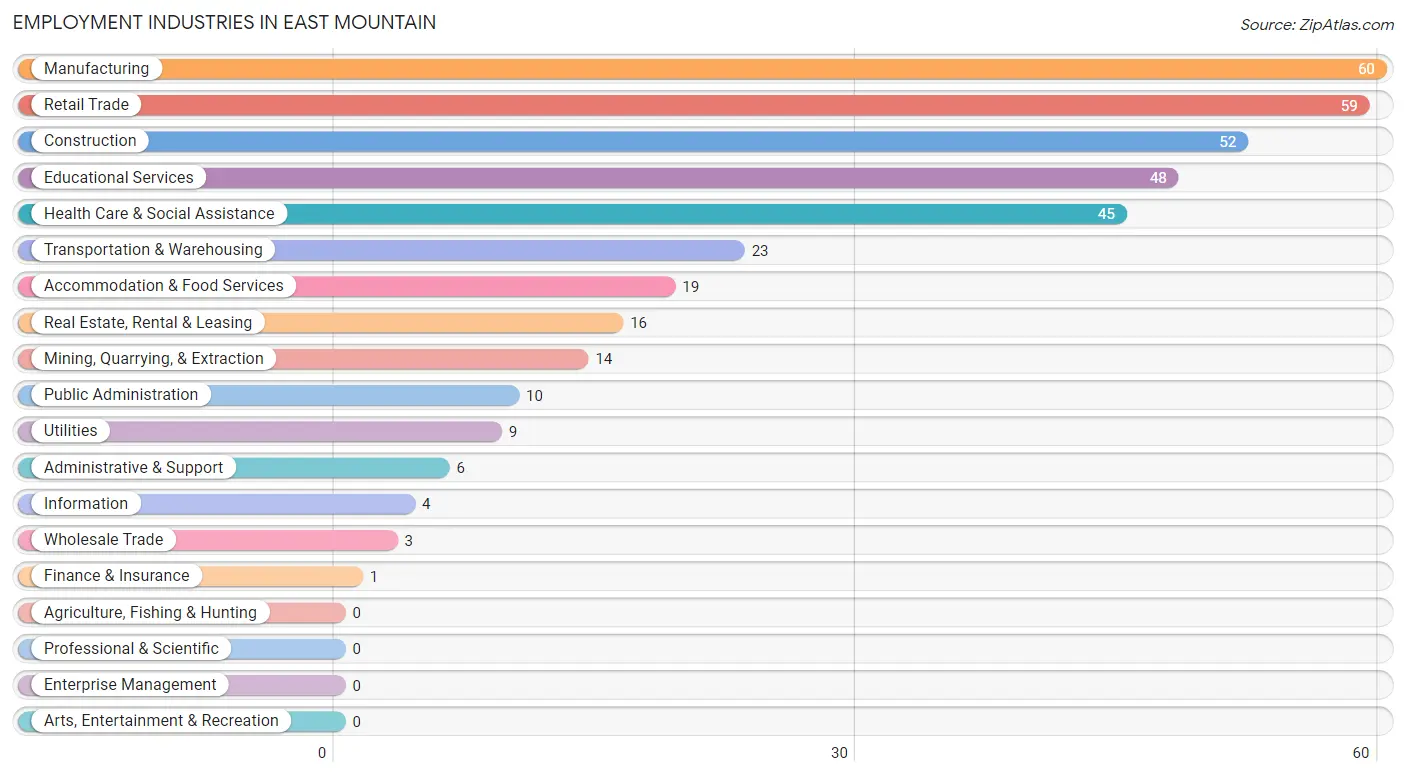
Employment Industries in East Mountain
The major employment industries in East Mountain include Manufacturing (60 | 15.7%), Retail Trade (59 | 15.4%), Construction (52 | 13.6%), Educational Services (48 | 12.5%), and Health Care & Social Assistance (45 | 11.7%).
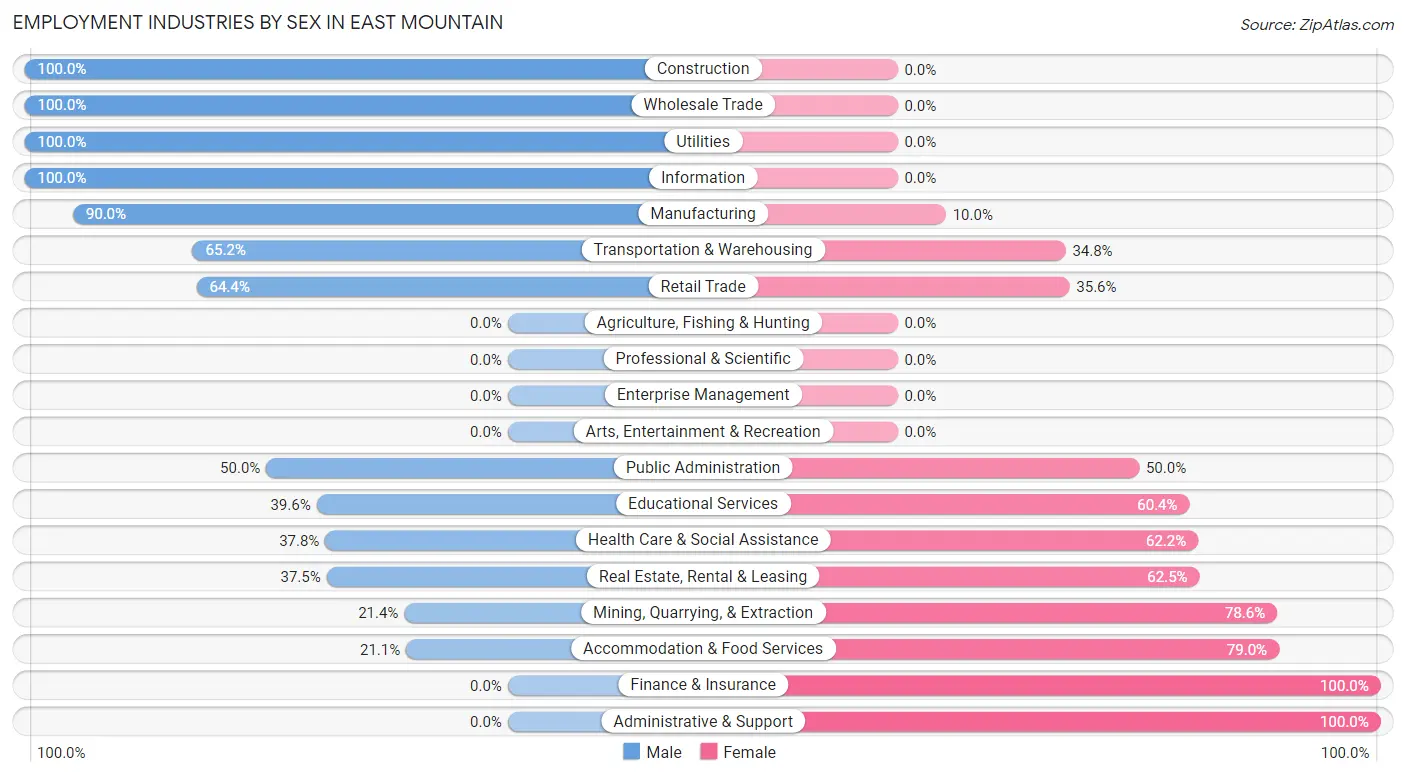
Employment Industries by Sex in East Mountain
The East Mountain industries that see more men than women are Construction (100.0%), Wholesale Trade (100.0%), and Utilities (100.0%), whereas the industries that tend to have a higher number of women are Finance & Insurance (100.0%), Administrative & Support (100.0%), and Accommodation & Food Services (78.9%).
| Industry | Male | Female |
| Agriculture, Fishing & Hunting | 0 (0.0%) | 0 (0.0%) |
| Mining, Quarrying, & Extraction | 3 (21.4%) | 11 (78.6%) |
| Construction | 52 (100.0%) | 0 (0.0%) |
| Manufacturing | 54 (90.0%) | 6 (10.0%) |
| Wholesale Trade | 3 (100.0%) | 0 (0.0%) |
| Retail Trade | 38 (64.4%) | 21 (35.6%) |
| Transportation & Warehousing | 15 (65.2%) | 8 (34.8%) |
| Utilities | 9 (100.0%) | 0 (0.0%) |
| Information | 4 (100.0%) | 0 (0.0%) |
| Finance & Insurance | 0 (0.0%) | 1 (100.0%) |
| Real Estate, Rental & Leasing | 6 (37.5%) | 10 (62.5%) |
| Professional & Scientific | 0 (0.0%) | 0 (0.0%) |
| Enterprise Management | 0 (0.0%) | 0 (0.0%) |
| Administrative & Support | 0 (0.0%) | 6 (100.0%) |
| Educational Services | 19 (39.6%) | 29 (60.4%) |
| Health Care & Social Assistance | 17 (37.8%) | 28 (62.2%) |
| Arts, Entertainment & Recreation | 0 (0.0%) | 0 (0.0%) |
| Accommodation & Food Services | 4 (21.0%) | 15 (78.9%) |
| Public Administration | 5 (50.0%) | 5 (50.0%) |
| Total | 243 (63.4%) | 140 (36.5%) |
Education in East Mountain
School Enrollment in East Mountain
The most common levels of schooling among the 162 students in East Mountain are middle school (51 | 31.5%), elementary school (39 | 24.1%), and high school (32 | 19.8%).
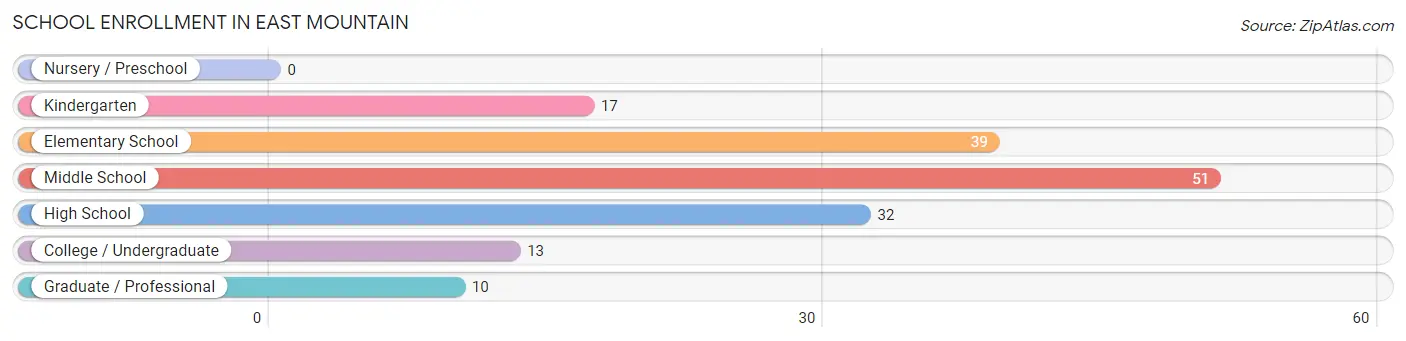
| School Level | # Students | % Students |
| Nursery / Preschool | 0 | 0.0% |
| Kindergarten | 17 | 10.5% |
| Elementary School | 39 | 24.1% |
| Middle School | 51 | 31.5% |
| High School | 32 | 19.8% |
| College / Undergraduate | 13 | 8.0% |
| Graduate / Professional | 10 | 6.2% |
| Total | 162 | 100.0% |
School Enrollment by Age by Funding Source in East Mountain
Out of a total of 162 students who are enrolled in schools in East Mountain, 25 (15.4%) attend a private institution, while the remaining 137 (84.6%) are enrolled in public schools. The age group of 5 to 9 year old has the highest likelihood of being enrolled in private schools, with 14 (25.9% in the age bracket) enrolled. Conversely, the age group of 15 to 17 year olds has the lowest likelihood of being enrolled in a private school, with 32 (100.0% in the age bracket) attending a public institution.
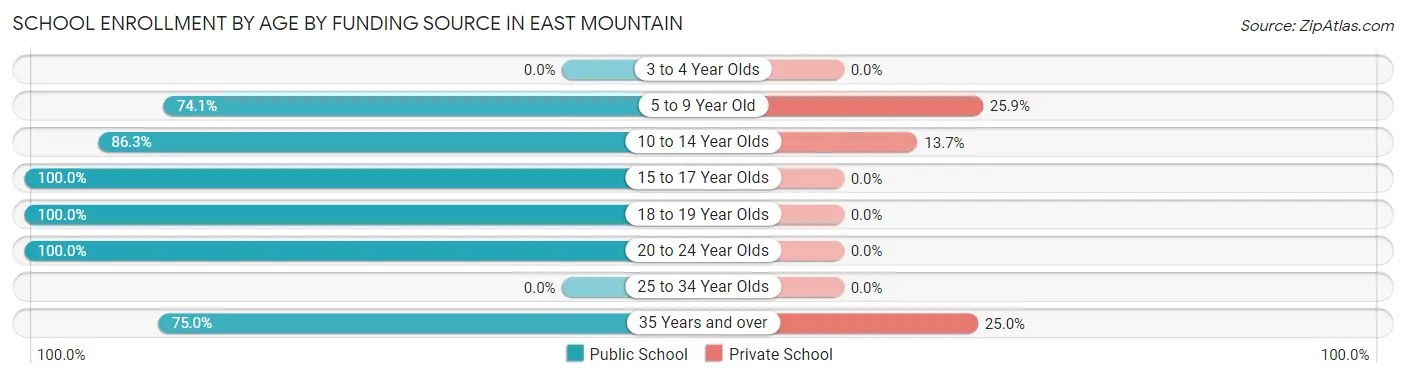
| Age Bracket | Public School | Private School |
| 3 to 4 Year Olds | 0 (0.0%) | 0 (0.0%) |
| 5 to 9 Year Old | 40 (74.1%) | 14 (25.9%) |
| 10 to 14 Year Olds | 44 (86.3%) | 7 (13.7%) |
| 15 to 17 Year Olds | 32 (100.0%) | 0 (0.0%) |
| 18 to 19 Year Olds | 4 (100.0%) | 0 (0.0%) |
| 20 to 24 Year Olds | 5 (100.0%) | 0 (0.0%) |
| 25 to 34 Year Olds | 0 (0.0%) | 0 (0.0%) |
| 35 Years and over | 12 (75.0%) | 4 (25.0%) |
| Total | 137 (84.6%) | 25 (15.4%) |
Educational Attainment by Field of Study in East Mountain
Social sciences (20 | 15.4%), education (19 | 14.6%), engineering (18 | 13.9%), business (17 | 13.1%), and bio, nature & agricultural (16 | 12.3%) are the most common fields of study among 130 individuals in East Mountain who have obtained a bachelor's degree or higher.
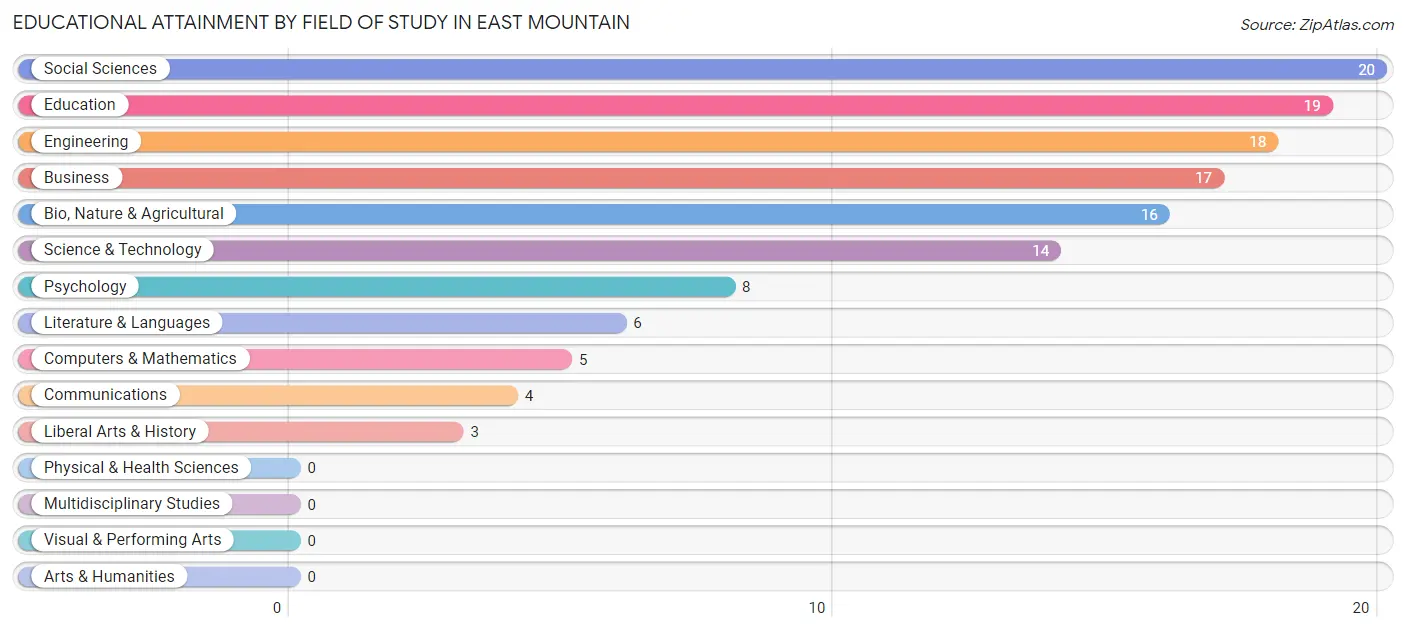
| Field of Study | # Graduates | % Graduates |
| Computers & Mathematics | 5 | 3.8% |
| Bio, Nature & Agricultural | 16 | 12.3% |
| Physical & Health Sciences | 0 | 0.0% |
| Psychology | 8 | 6.1% |
| Social Sciences | 20 | 15.4% |
| Engineering | 18 | 13.9% |
| Multidisciplinary Studies | 0 | 0.0% |
| Science & Technology | 14 | 10.8% |
| Business | 17 | 13.1% |
| Education | 19 | 14.6% |
| Literature & Languages | 6 | 4.6% |
| Liberal Arts & History | 3 | 2.3% |
| Visual & Performing Arts | 0 | 0.0% |
| Communications | 4 | 3.1% |
| Arts & Humanities | 0 | 0.0% |
| Total | 130 | 100.0% |
Transportation & Commute in East Mountain
Vehicle Availability by Sex in East Mountain
The most prevalent vehicle ownership categories in East Mountain are males with 2 vehicles (114, accounting for 46.9%) and females with 2 vehicles (74, making up 83.8%).
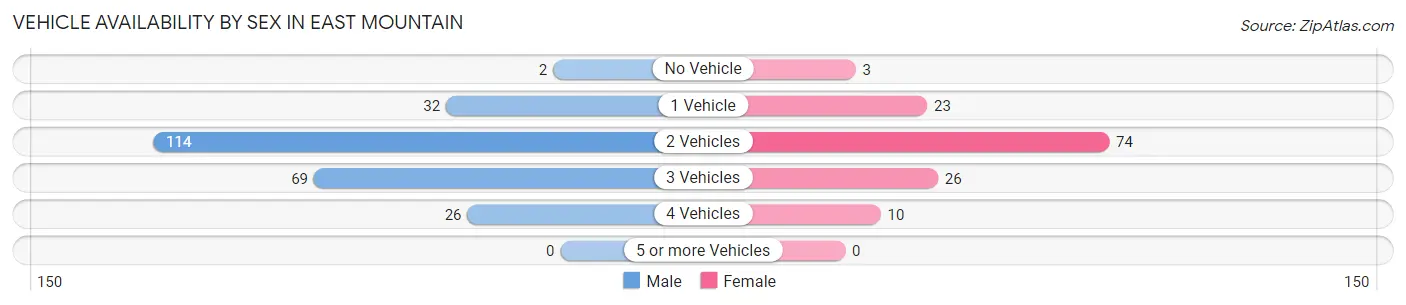
| Vehicles Available | Male | Female |
| No Vehicle | 2 (0.8%) | 3 (2.2%) |
| 1 Vehicle | 32 (13.2%) | 23 (16.9%) |
| 2 Vehicles | 114 (46.9%) | 74 (54.4%) |
| 3 Vehicles | 69 (28.4%) | 26 (19.1%) |
| 4 Vehicles | 26 (10.7%) | 10 (7.3%) |
| 5 or more Vehicles | 0 (0.0%) | 0 (0.0%) |
| Total | 243 (100.0%) | 136 (100.0%) |
Commute Time in East Mountain
The most frequently occuring commute durations in East Mountain are 20 to 24 minutes (96 commuters, 26.8%), 15 to 19 minutes (51 commuters, 14.2%), and 10 to 14 minutes (50 commuters, 14.0%).
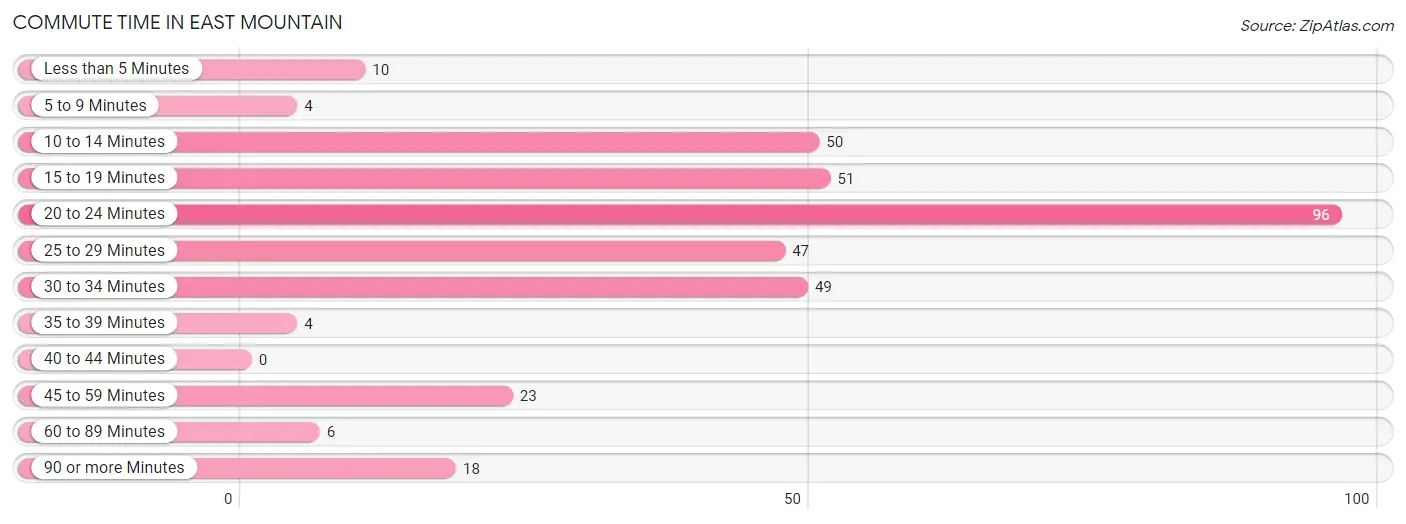
| Commute Time | # Commuters | % Commuters |
| Less than 5 Minutes | 10 | 2.8% |
| 5 to 9 Minutes | 4 | 1.1% |
| 10 to 14 Minutes | 50 | 14.0% |
| 15 to 19 Minutes | 51 | 14.2% |
| 20 to 24 Minutes | 96 | 26.8% |
| 25 to 29 Minutes | 47 | 13.1% |
| 30 to 34 Minutes | 49 | 13.7% |
| 35 to 39 Minutes | 4 | 1.1% |
| 40 to 44 Minutes | 0 | 0.0% |
| 45 to 59 Minutes | 23 | 6.4% |
| 60 to 89 Minutes | 6 | 1.7% |
| 90 or more Minutes | 18 | 5.0% |
Commute Time by Sex in East Mountain
The most common commute times in East Mountain are 20 to 24 minutes (66 commuters, 28.9%) for males and 15 to 19 minutes (31 commuters, 23.8%) for females.

| Commute Time | Male | Female |
| Less than 5 Minutes | 0 (0.0%) | 10 (7.7%) |
| 5 to 9 Minutes | 4 (1.8%) | 0 (0.0%) |
| 10 to 14 Minutes | 35 (15.3%) | 15 (11.5%) |
| 15 to 19 Minutes | 20 (8.8%) | 31 (23.8%) |
| 20 to 24 Minutes | 66 (28.9%) | 30 (23.1%) |
| 25 to 29 Minutes | 37 (16.2%) | 10 (7.7%) |
| 30 to 34 Minutes | 32 (14.0%) | 17 (13.1%) |
| 35 to 39 Minutes | 0 (0.0%) | 4 (3.1%) |
| 40 to 44 Minutes | 0 (0.0%) | 0 (0.0%) |
| 45 to 59 Minutes | 18 (7.9%) | 5 (3.8%) |
| 60 to 89 Minutes | 6 (2.6%) | 0 (0.0%) |
| 90 or more Minutes | 10 (4.4%) | 8 (6.1%) |
Time of Departure to Work by Sex in East Mountain
The most frequent times of departure to work in East Mountain are 7:30 AM to 7:59 AM (50, 21.9%) for males and 7:00 AM to 7:29 AM (23, 17.7%) for females.
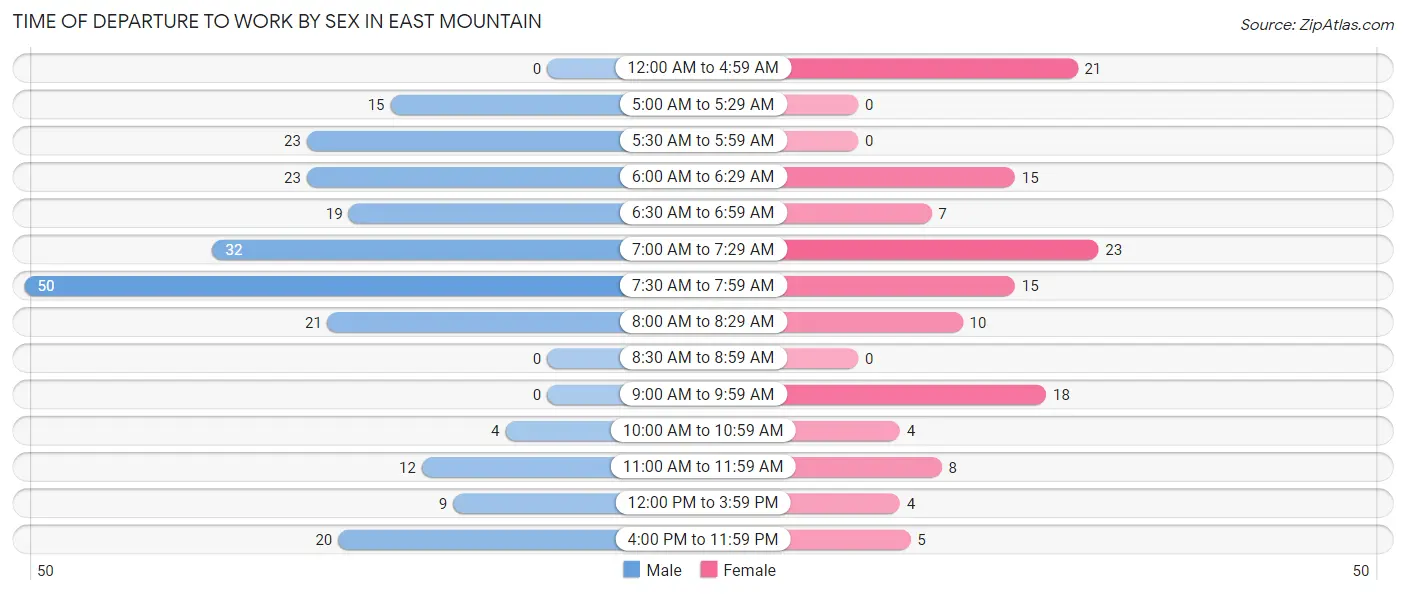
| Time of Departure | Male | Female |
| 12:00 AM to 4:59 AM | 0 (0.0%) | 21 (16.2%) |
| 5:00 AM to 5:29 AM | 15 (6.6%) | 0 (0.0%) |
| 5:30 AM to 5:59 AM | 23 (10.1%) | 0 (0.0%) |
| 6:00 AM to 6:29 AM | 23 (10.1%) | 15 (11.5%) |
| 6:30 AM to 6:59 AM | 19 (8.3%) | 7 (5.4%) |
| 7:00 AM to 7:29 AM | 32 (14.0%) | 23 (17.7%) |
| 7:30 AM to 7:59 AM | 50 (21.9%) | 15 (11.5%) |
| 8:00 AM to 8:29 AM | 21 (9.2%) | 10 (7.7%) |
| 8:30 AM to 8:59 AM | 0 (0.0%) | 0 (0.0%) |
| 9:00 AM to 9:59 AM | 0 (0.0%) | 18 (13.9%) |
| 10:00 AM to 10:59 AM | 4 (1.8%) | 4 (3.1%) |
| 11:00 AM to 11:59 AM | 12 (5.3%) | 8 (6.1%) |
| 12:00 PM to 3:59 PM | 9 (4.0%) | 4 (3.1%) |
| 4:00 PM to 11:59 PM | 20 (8.8%) | 5 (3.8%) |
| Total | 228 (100.0%) | 130 (100.0%) |
Housing Occupancy in East Mountain
Occupancy by Ownership in East Mountain
Of the total 334 dwellings in East Mountain, owner-occupied units account for 253 (75.7%), while renter-occupied units make up 81 (24.2%).
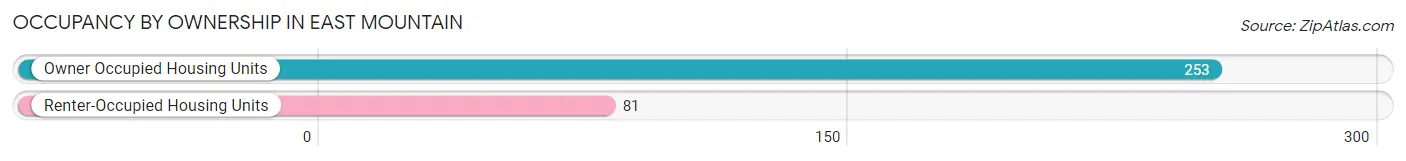
| Occupancy | # Housing Units | % Housing Units |
| Owner Occupied Housing Units | 253 | 75.7% |
| Renter-Occupied Housing Units | 81 | 24.2% |
| Total Occupied Housing Units | 334 | 100.0% |
Occupancy by Household Size in East Mountain
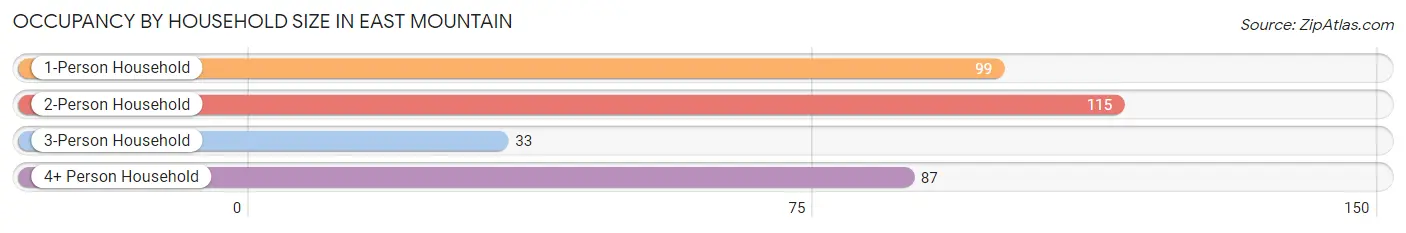
| Household Size | # Housing Units | % Housing Units |
| 1-Person Household | 99 | 29.6% |
| 2-Person Household | 115 | 34.4% |
| 3-Person Household | 33 | 9.9% |
| 4+ Person Household | 87 | 26.1% |
| Total Housing Units | 334 | 100.0% |
Occupancy by Ownership by Household Size in East Mountain
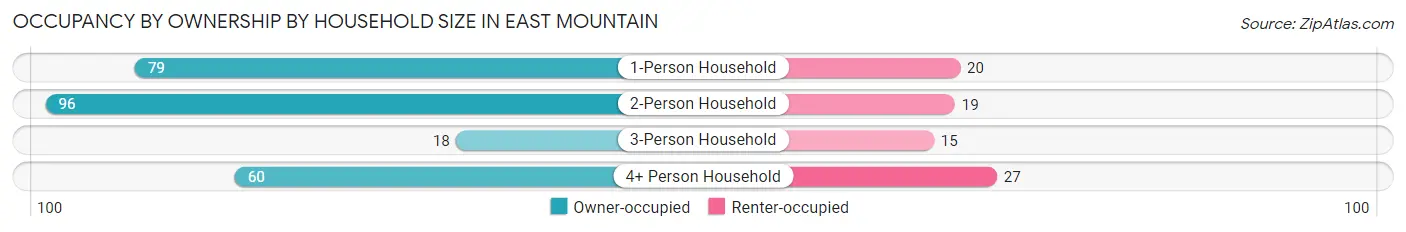
| Household Size | Owner-occupied | Renter-occupied |
| 1-Person Household | 79 (79.8%) | 20 (20.2%) |
| 2-Person Household | 96 (83.5%) | 19 (16.5%) |
| 3-Person Household | 18 (54.5%) | 15 (45.5%) |
| 4+ Person Household | 60 (69.0%) | 27 (31.0%) |
| Total Housing Units | 253 (75.7%) | 81 (24.2%) |
Occupancy by Educational Attainment in East Mountain
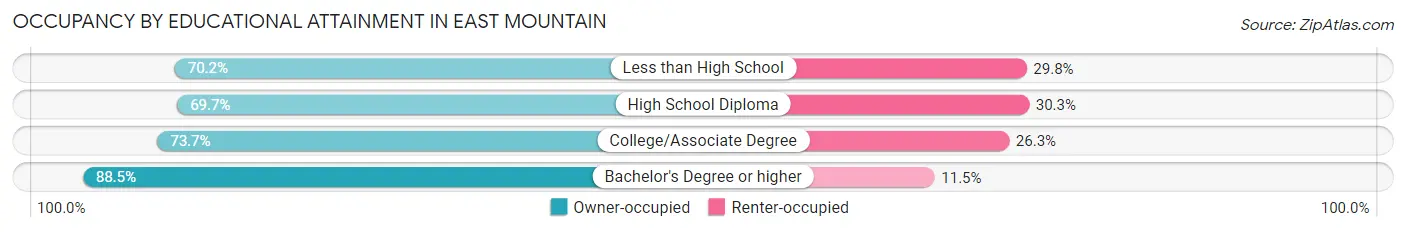
| Household Size | Owner-occupied | Renter-occupied |
| Less than High School | 33 (70.2%) | 14 (29.8%) |
| High School Diploma | 53 (69.7%) | 23 (30.3%) |
| College/Associate Degree | 98 (73.7%) | 35 (26.3%) |
| Bachelor's Degree or higher | 69 (88.5%) | 9 (11.5%) |
Occupancy by Age of Householder in East Mountain
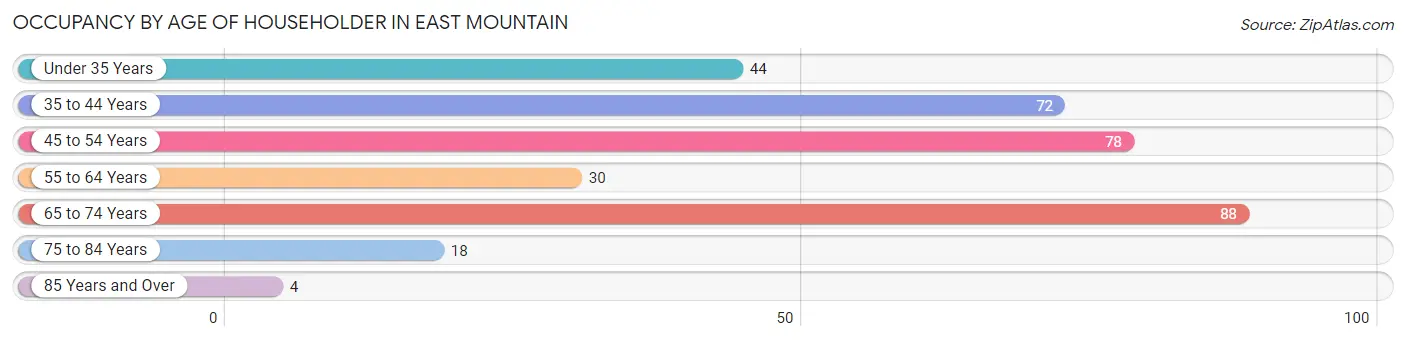
| Age Bracket | # Households | % Households |
| Under 35 Years | 44 | 13.2% |
| 35 to 44 Years | 72 | 21.6% |
| 45 to 54 Years | 78 | 23.4% |
| 55 to 64 Years | 30 | 9.0% |
| 65 to 74 Years | 88 | 26.4% |
| 75 to 84 Years | 18 | 5.4% |
| 85 Years and Over | 4 | 1.2% |
| Total | 334 | 100.0% |
Housing Finances in East Mountain
Median Income by Occupancy in East Mountain
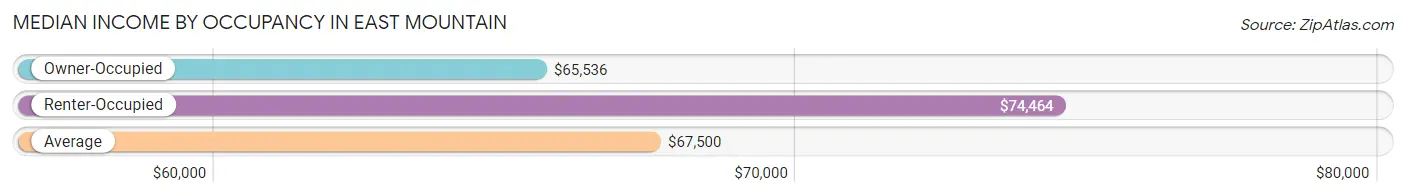
| Occupancy Type | # Households | Median Income |
| Owner-Occupied | 253 (75.7%) | $65,536 |
| Renter-Occupied | 81 (24.2%) | $74,464 |
| Average | 334 (100.0%) | $67,500 |
Occupancy by Householder Income Bracket in East Mountain
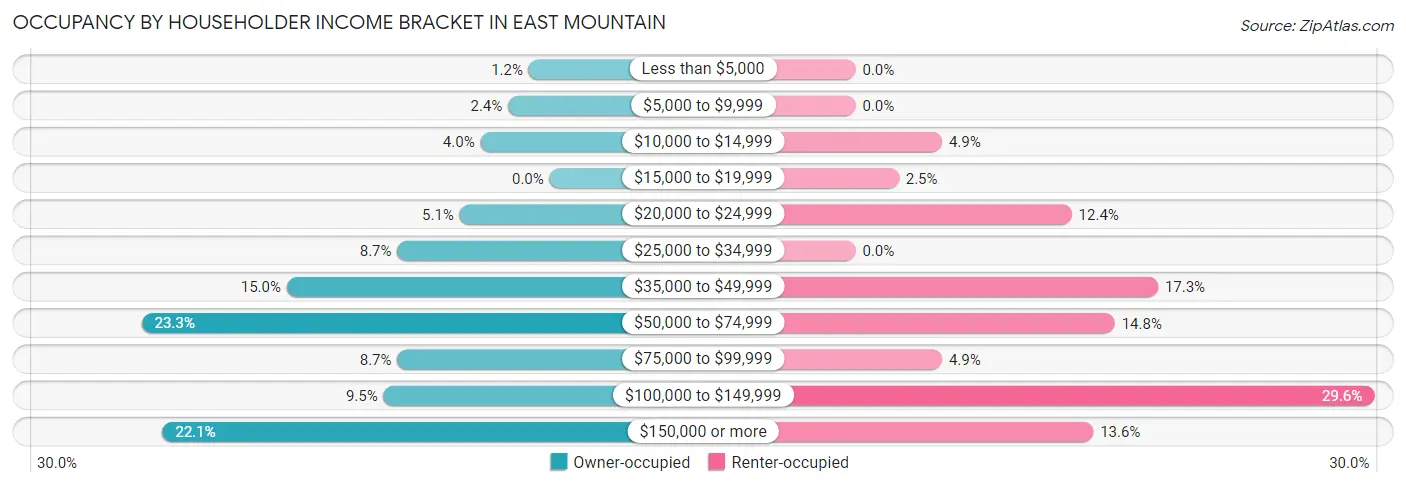
| Income Bracket | Owner-occupied | Renter-occupied |
| Less than $5,000 | 3 (1.2%) | 0 (0.0%) |
| $5,000 to $9,999 | 6 (2.4%) | 0 (0.0%) |
| $10,000 to $14,999 | 10 (4.0%) | 4 (4.9%) |
| $15,000 to $19,999 | 0 (0.0%) | 2 (2.5%) |
| $20,000 to $24,999 | 13 (5.1%) | 10 (12.3%) |
| $25,000 to $34,999 | 22 (8.7%) | 0 (0.0%) |
| $35,000 to $49,999 | 38 (15.0%) | 14 (17.3%) |
| $50,000 to $74,999 | 59 (23.3%) | 12 (14.8%) |
| $75,000 to $99,999 | 22 (8.7%) | 4 (4.9%) |
| $100,000 to $149,999 | 24 (9.5%) | 24 (29.6%) |
| $150,000 or more | 56 (22.1%) | 11 (13.6%) |
| Total | 253 (100.0%) | 81 (100.0%) |
Monthly Housing Cost Tiers in East Mountain
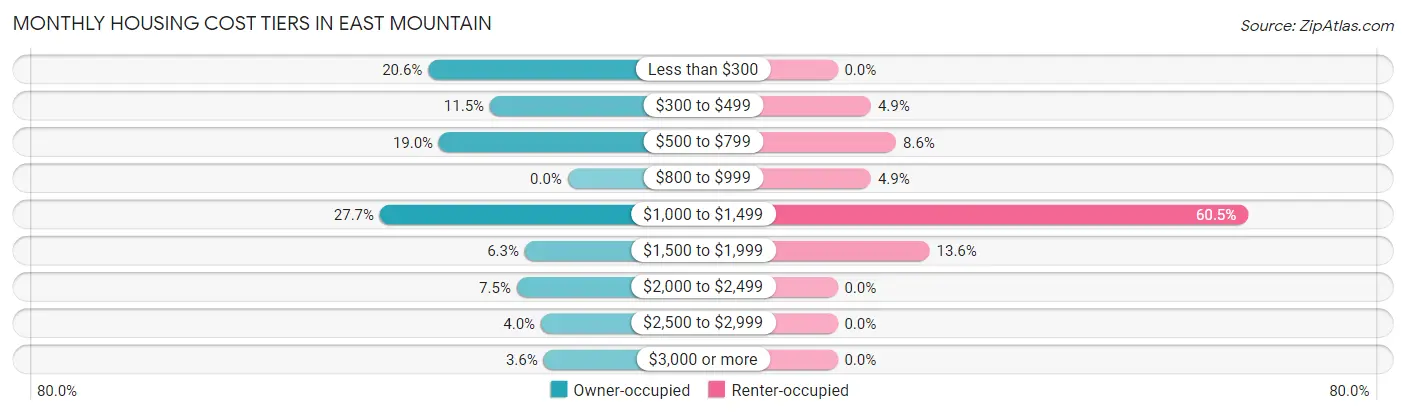
| Monthly Cost | Owner-occupied | Renter-occupied |
| Less than $300 | 52 (20.5%) | 0 (0.0%) |
| $300 to $499 | 29 (11.5%) | 4 (4.9%) |
| $500 to $799 | 48 (19.0%) | 7 (8.6%) |
| $800 to $999 | 0 (0.0%) | 4 (4.9%) |
| $1,000 to $1,499 | 70 (27.7%) | 49 (60.5%) |
| $1,500 to $1,999 | 16 (6.3%) | 11 (13.6%) |
| $2,000 to $2,499 | 19 (7.5%) | 0 (0.0%) |
| $2,500 to $2,999 | 10 (4.0%) | 0 (0.0%) |
| $3,000 or more | 9 (3.6%) | 0 (0.0%) |
| Total | 253 (100.0%) | 81 (100.0%) |
Physical Housing Characteristics in East Mountain
Housing Structures in East Mountain
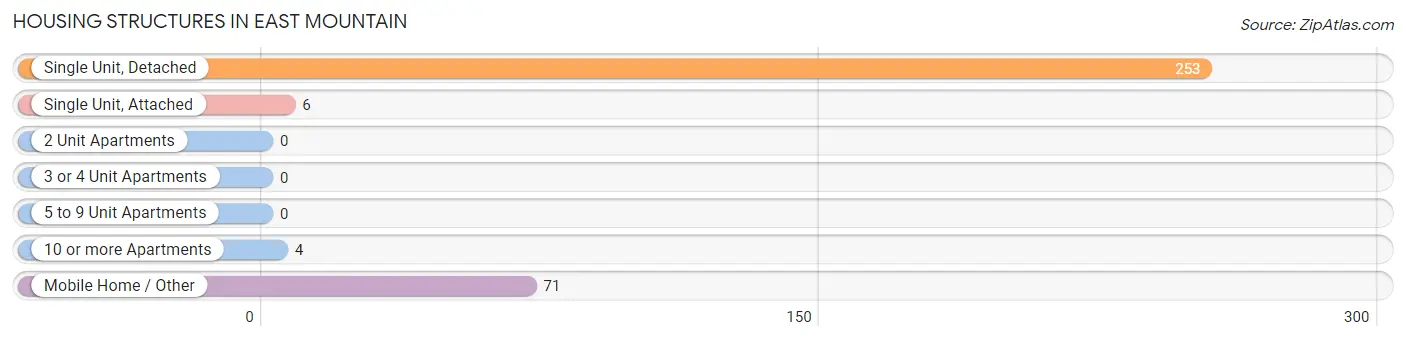
| Structure Type | # Housing Units | % Housing Units |
| Single Unit, Detached | 253 | 75.7% |
| Single Unit, Attached | 6 | 1.8% |
| 2 Unit Apartments | 0 | 0.0% |
| 3 or 4 Unit Apartments | 0 | 0.0% |
| 5 to 9 Unit Apartments | 0 | 0.0% |
| 10 or more Apartments | 4 | 1.2% |
| Mobile Home / Other | 71 | 21.3% |
| Total | 334 | 100.0% |
Housing Structures by Occupancy in East Mountain
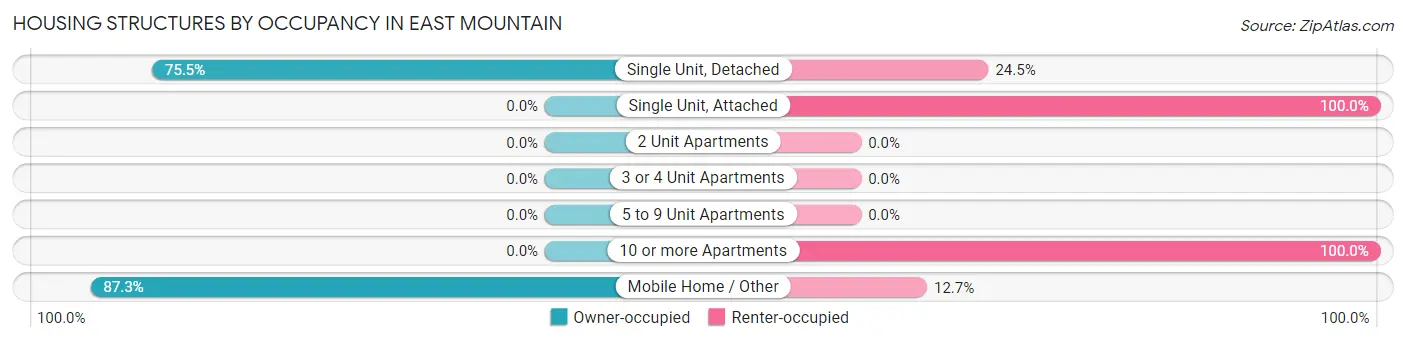
| Structure Type | Owner-occupied | Renter-occupied |
| Single Unit, Detached | 191 (75.5%) | 62 (24.5%) |
| Single Unit, Attached | 0 (0.0%) | 6 (100.0%) |
| 2 Unit Apartments | 0 (0.0%) | 0 (0.0%) |
| 3 or 4 Unit Apartments | 0 (0.0%) | 0 (0.0%) |
| 5 to 9 Unit Apartments | 0 (0.0%) | 0 (0.0%) |
| 10 or more Apartments | 0 (0.0%) | 4 (100.0%) |
| Mobile Home / Other | 62 (87.3%) | 9 (12.7%) |
| Total | 253 (75.7%) | 81 (24.2%) |
Housing Structures by Number of Rooms in East Mountain
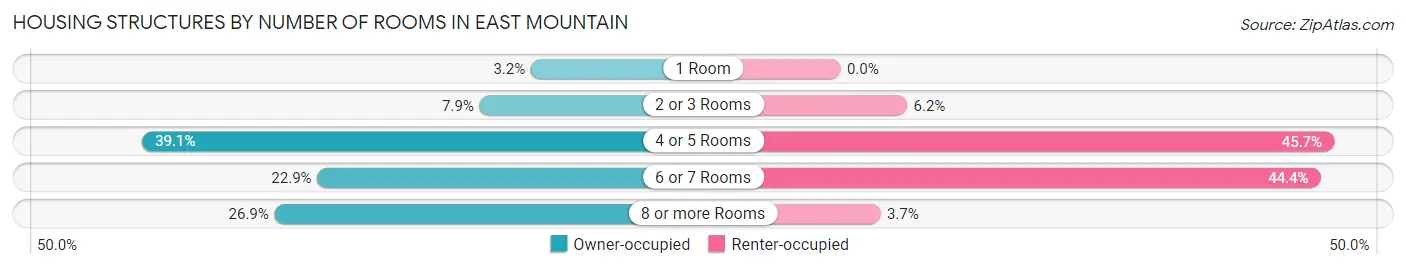
| Number of Rooms | Owner-occupied | Renter-occupied |
| 1 Room | 8 (3.2%) | 0 (0.0%) |
| 2 or 3 Rooms | 20 (7.9%) | 5 (6.2%) |
| 4 or 5 Rooms | 99 (39.1%) | 37 (45.7%) |
| 6 or 7 Rooms | 58 (22.9%) | 36 (44.4%) |
| 8 or more Rooms | 68 (26.9%) | 3 (3.7%) |
| Total | 253 (100.0%) | 81 (100.0%) |
Housing Structure by Heating Type in East Mountain
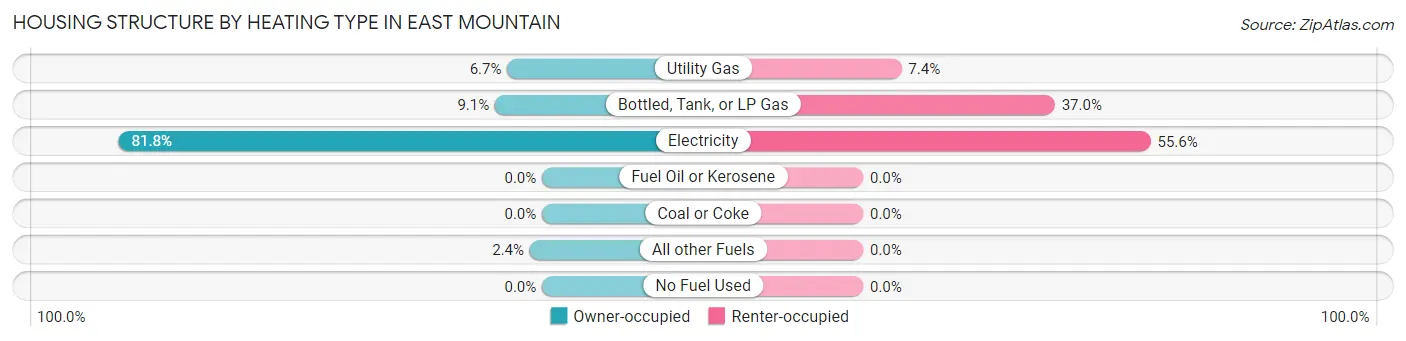
| Heating Type | Owner-occupied | Renter-occupied |
| Utility Gas | 17 (6.7%) | 6 (7.4%) |
| Bottled, Tank, or LP Gas | 23 (9.1%) | 30 (37.0%) |
| Electricity | 207 (81.8%) | 45 (55.6%) |
| Fuel Oil or Kerosene | 0 (0.0%) | 0 (0.0%) |
| Coal or Coke | 0 (0.0%) | 0 (0.0%) |
| All other Fuels | 6 (2.4%) | 0 (0.0%) |
| No Fuel Used | 0 (0.0%) | 0 (0.0%) |
| Total | 253 (100.0%) | 81 (100.0%) |
Household Vehicle Usage in East Mountain
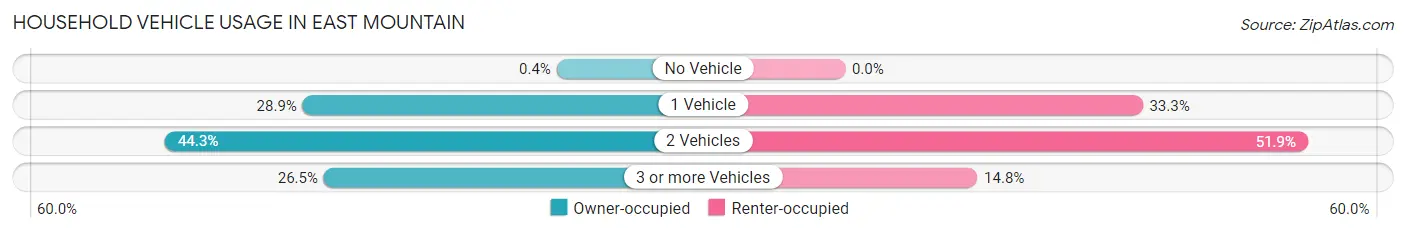
| Vehicles per Household | Owner-occupied | Renter-occupied |
| No Vehicle | 1 (0.4%) | 0 (0.0%) |
| 1 Vehicle | 73 (28.8%) | 27 (33.3%) |
| 2 Vehicles | 112 (44.3%) | 42 (51.8%) |
| 3 or more Vehicles | 67 (26.5%) | 12 (14.8%) |
| Total | 253 (100.0%) | 81 (100.0%) |
Real Estate & Mortgages in East Mountain
Real Estate and Mortgage Overview in East Mountain
| Characteristic | Without Mortgage | With Mortgage |
| Housing Units | 147 | 106 |
| Median Property Value | $129,200 | $210,000 |
| Median Household Income | $51,125 | $36 |
| Monthly Housing Costs | $467 | $9 |
| Real Estate Taxes | - | - |
Property Value by Mortgage Status in East Mountain
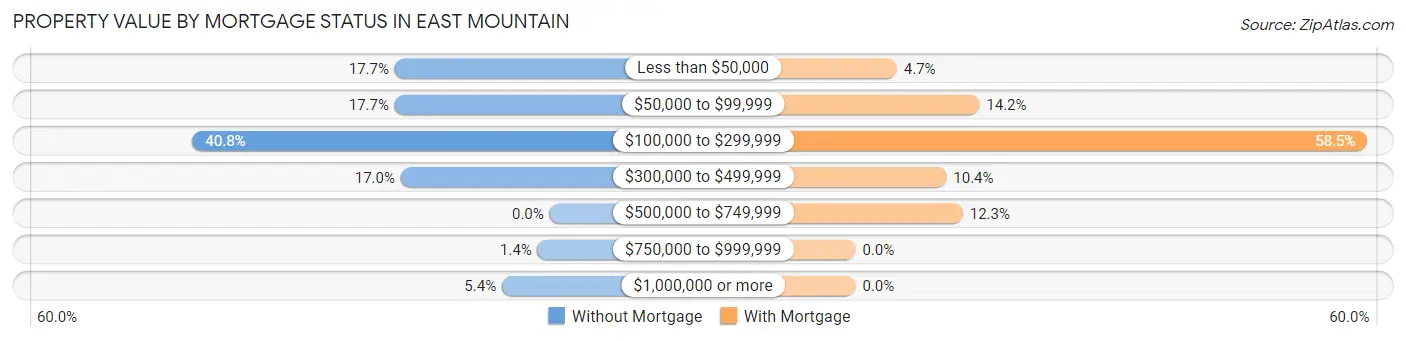
| Property Value | Without Mortgage | With Mortgage |
| Less than $50,000 | 26 (17.7%) | 5 (4.7%) |
| $50,000 to $99,999 | 26 (17.7%) | 15 (14.1%) |
| $100,000 to $299,999 | 60 (40.8%) | 62 (58.5%) |
| $300,000 to $499,999 | 25 (17.0%) | 11 (10.4%) |
| $500,000 to $749,999 | 0 (0.0%) | 13 (12.3%) |
| $750,000 to $999,999 | 2 (1.4%) | 0 (0.0%) |
| $1,000,000 or more | 8 (5.4%) | 0 (0.0%) |
| Total | 147 (100.0%) | 106 (100.0%) |
Household Income by Mortgage Status in East Mountain
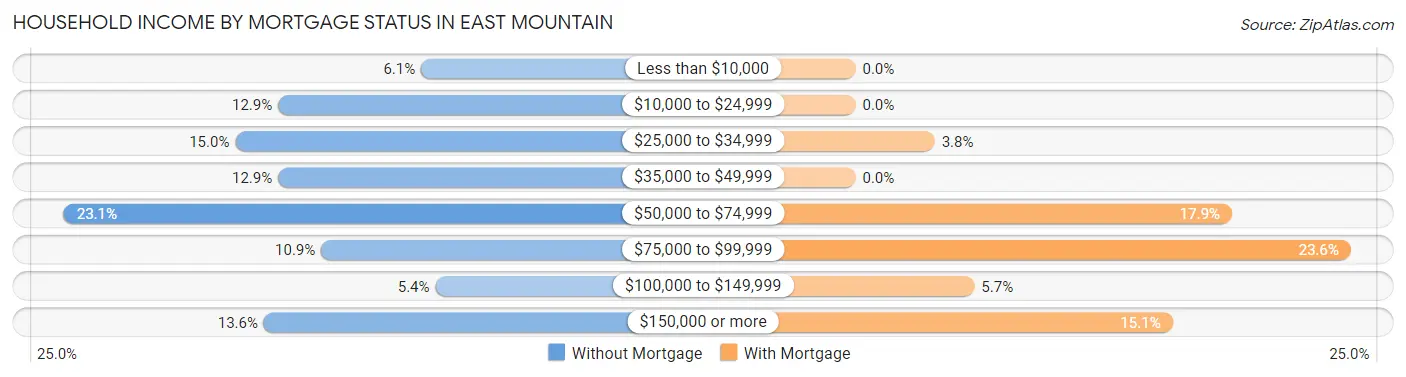
| Household Income | Without Mortgage | With Mortgage |
| Less than $10,000 | 9 (6.1%) | 0 (0.0%) |
| $10,000 to $24,999 | 19 (12.9%) | 0 (0.0%) |
| $25,000 to $34,999 | 22 (15.0%) | 4 (3.8%) |
| $35,000 to $49,999 | 19 (12.9%) | 0 (0.0%) |
| $50,000 to $74,999 | 34 (23.1%) | 19 (17.9%) |
| $75,000 to $99,999 | 16 (10.9%) | 25 (23.6%) |
| $100,000 to $149,999 | 8 (5.4%) | 6 (5.7%) |
| $150,000 or more | 20 (13.6%) | 16 (15.1%) |
| Total | 147 (100.0%) | 106 (100.0%) |
Property Value to Household Income Ratio in East Mountain
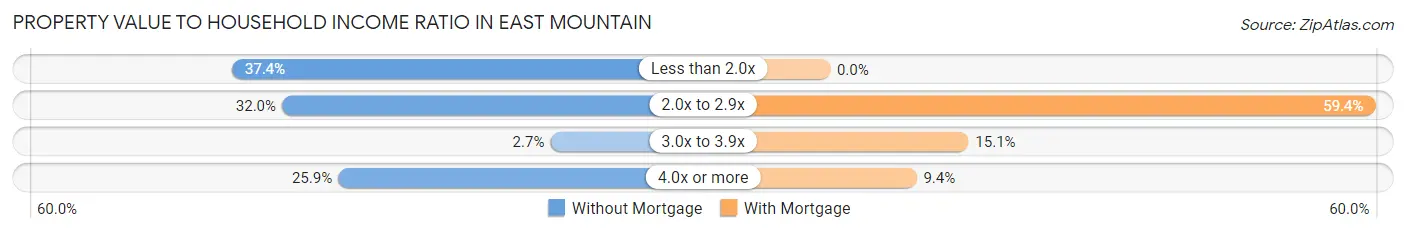
| Value-to-Income Ratio | Without Mortgage | With Mortgage |
| Less than 2.0x | 55 (37.4%) | 0 (0.0%) |
| 2.0x to 2.9x | 47 (32.0%) | 63 (59.4%) |
| 3.0x to 3.9x | 4 (2.7%) | 16 (15.1%) |
| 4.0x or more | 38 (25.9%) | 10 (9.4%) |
| Total | 147 (100.0%) | 106 (100.0%) |
Real Estate Taxes by Mortgage Status in East Mountain
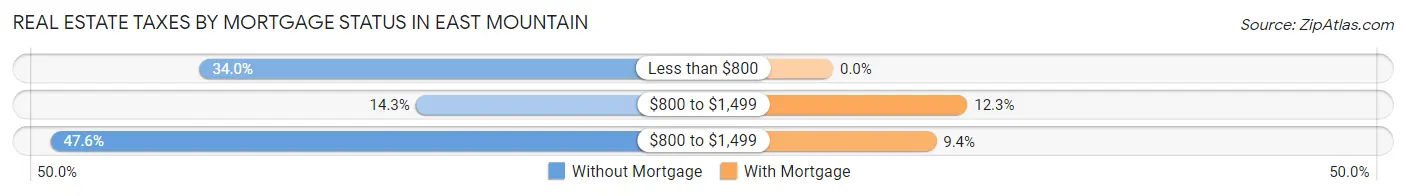
| Property Taxes | Without Mortgage | With Mortgage |
| Less than $800 | 50 (34.0%) | 0 (0.0%) |
| $800 to $1,499 | 21 (14.3%) | 13 (12.3%) |
| $800 to $1,499 | 70 (47.6%) | 10 (9.4%) |
| Total | 147 (100.0%) | 106 (100.0%) |
Health & Disability in East Mountain
Health Insurance Coverage by Age in East Mountain
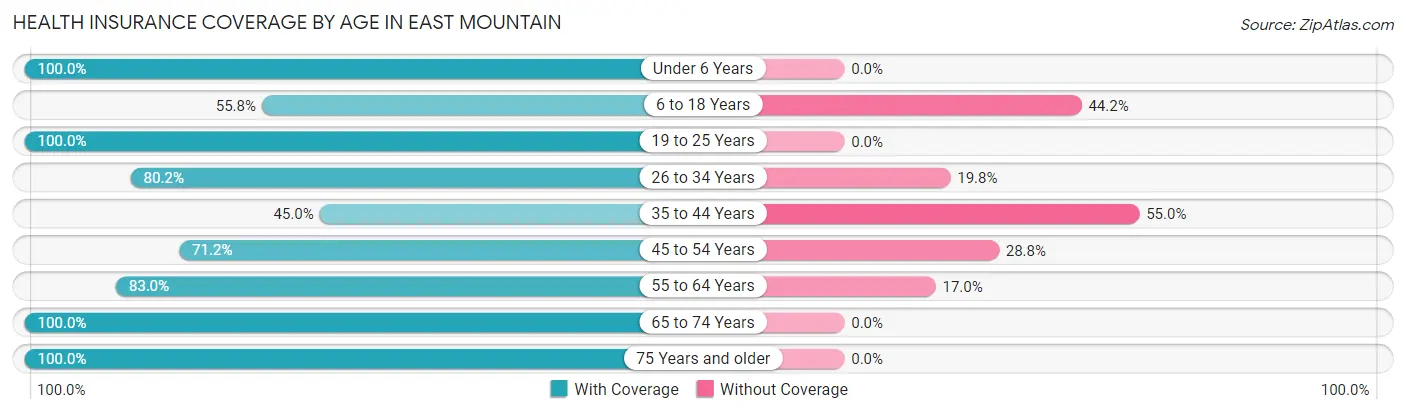
| Age Bracket | With Coverage | Without Coverage |
| Under 6 Years | 68 (100.0%) | 0 (0.0%) |
| 6 to 18 Years | 87 (55.8%) | 69 (44.2%) |
| 19 to 25 Years | 110 (100.0%) | 0 (0.0%) |
| 26 to 34 Years | 69 (80.2%) | 17 (19.8%) |
| 35 to 44 Years | 72 (45.0%) | 88 (55.0%) |
| 45 to 54 Years | 84 (71.2%) | 34 (28.8%) |
| 55 to 64 Years | 39 (83.0%) | 8 (17.0%) |
| 65 to 74 Years | 138 (100.0%) | 0 (0.0%) |
| 75 Years and older | 35 (100.0%) | 0 (0.0%) |
| Total | 702 (76.5%) | 216 (23.5%) |
Health Insurance Coverage by Citizenship Status in East Mountain
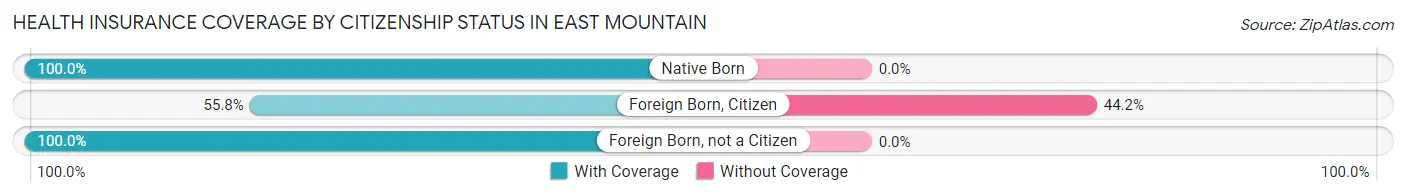
| Citizenship Status | With Coverage | Without Coverage |
| Native Born | 68 (100.0%) | 0 (0.0%) |
| Foreign Born, Citizen | 87 (55.8%) | 69 (44.2%) |
| Foreign Born, not a Citizen | 110 (100.0%) | 0 (0.0%) |
Health Insurance Coverage by Household Income in East Mountain
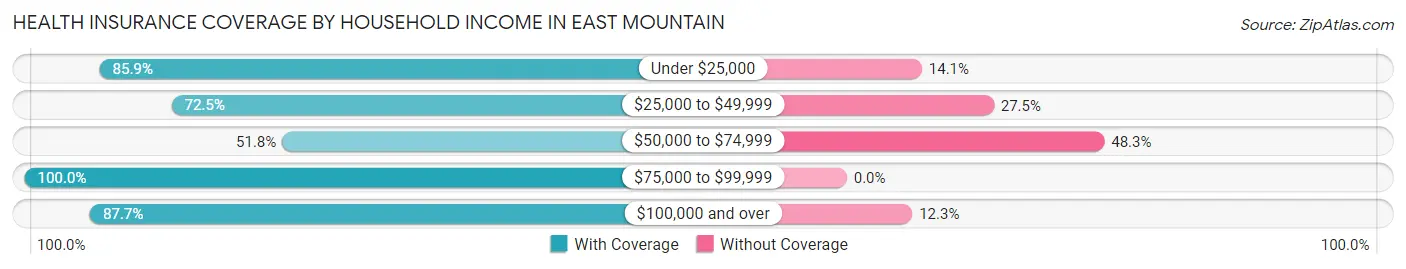
| Household Income | With Coverage | Without Coverage |
| Under $25,000 | 55 (85.9%) | 9 (14.1%) |
| $25,000 to $49,999 | 100 (72.5%) | 38 (27.5%) |
| $50,000 to $74,999 | 133 (51.7%) | 124 (48.2%) |
| $75,000 to $99,999 | 92 (100.0%) | 0 (0.0%) |
| $100,000 and over | 322 (87.7%) | 45 (12.3%) |
Public vs Private Health Insurance Coverage by Age in East Mountain
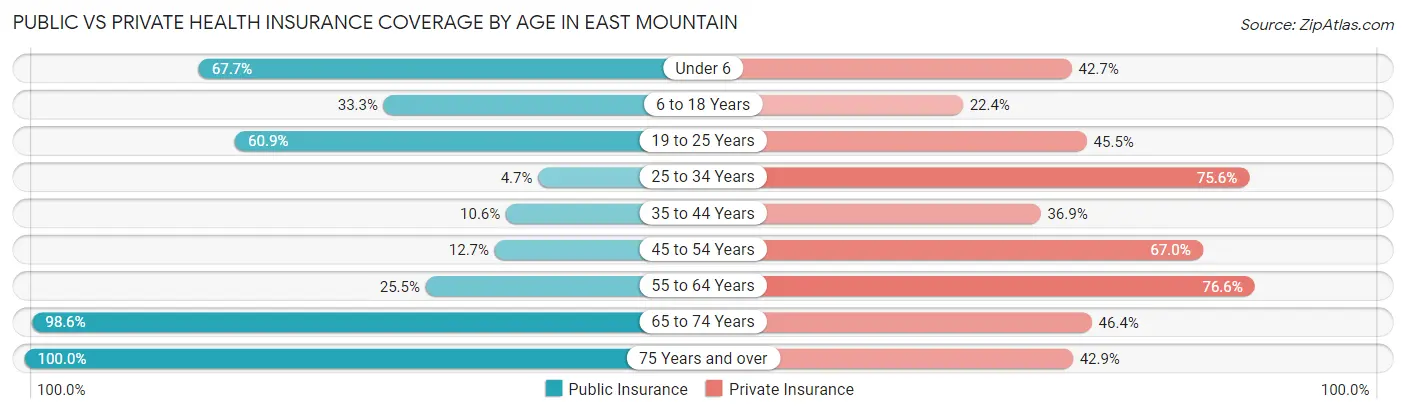
| Age Bracket | Public Insurance | Private Insurance |
| Under 6 | 46 (67.6%) | 29 (42.6%) |
| 6 to 18 Years | 52 (33.3%) | 35 (22.4%) |
| 19 to 25 Years | 67 (60.9%) | 50 (45.5%) |
| 25 to 34 Years | 4 (4.6%) | 65 (75.6%) |
| 35 to 44 Years | 17 (10.6%) | 59 (36.9%) |
| 45 to 54 Years | 15 (12.7%) | 79 (66.9%) |
| 55 to 64 Years | 12 (25.5%) | 36 (76.6%) |
| 65 to 74 Years | 136 (98.6%) | 64 (46.4%) |
| 75 Years and over | 35 (100.0%) | 15 (42.9%) |
| Total | 384 (41.8%) | 432 (47.1%) |
Disability Status by Sex by Age in East Mountain
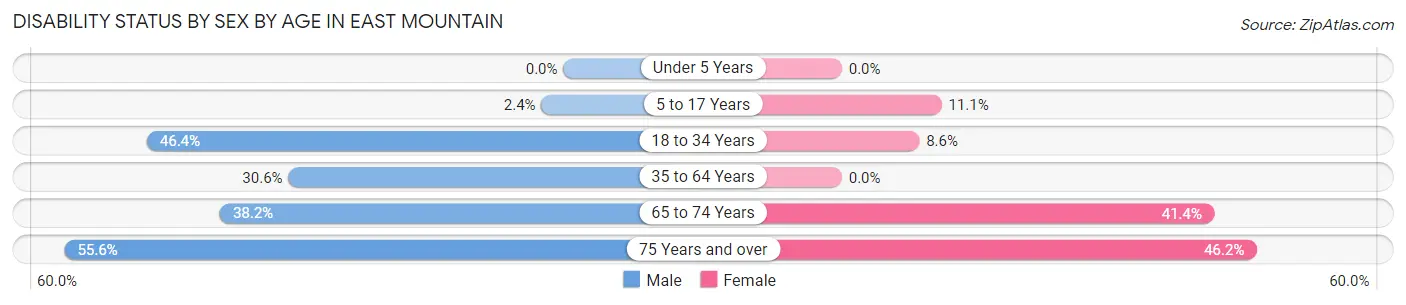
| Age Bracket | Male | Female |
| Under 5 Years | 0 (0.0%) | 0 (0.0%) |
| 5 to 17 Years | 2 (2.4%) | 9 (11.1%) |
| 18 to 34 Years | 64 (46.4%) | 5 (8.6%) |
| 35 to 64 Years | 49 (30.6%) | 0 (0.0%) |
| 65 to 74 Years | 26 (38.2%) | 29 (41.4%) |
| 75 Years and over | 5 (55.6%) | 12 (46.2%) |
Disability Class by Sex by Age in East Mountain
Disability Class: Hearing Difficulty
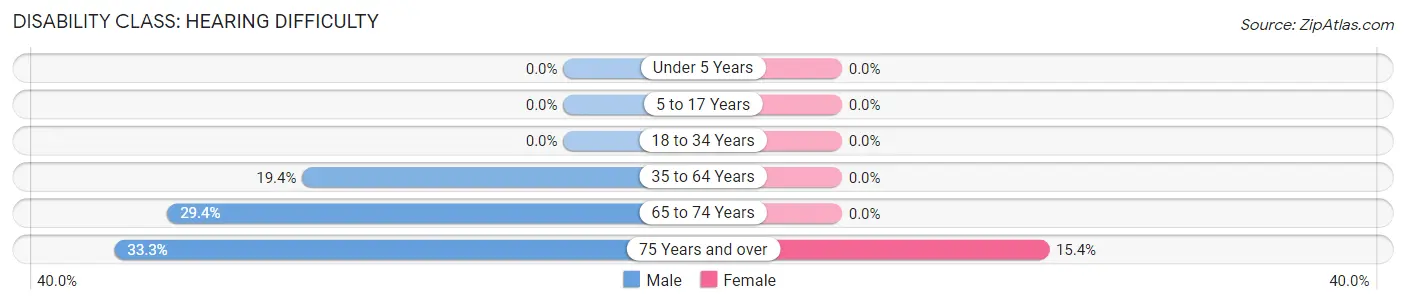
| Age Bracket | Male | Female |
| Under 5 Years | 0 (0.0%) | 0 (0.0%) |
| 5 to 17 Years | 0 (0.0%) | 0 (0.0%) |
| 18 to 34 Years | 0 (0.0%) | 0 (0.0%) |
| 35 to 64 Years | 31 (19.4%) | 0 (0.0%) |
| 65 to 74 Years | 20 (29.4%) | 0 (0.0%) |
| 75 Years and over | 3 (33.3%) | 4 (15.4%) |
Disability Class: Vision Difficulty
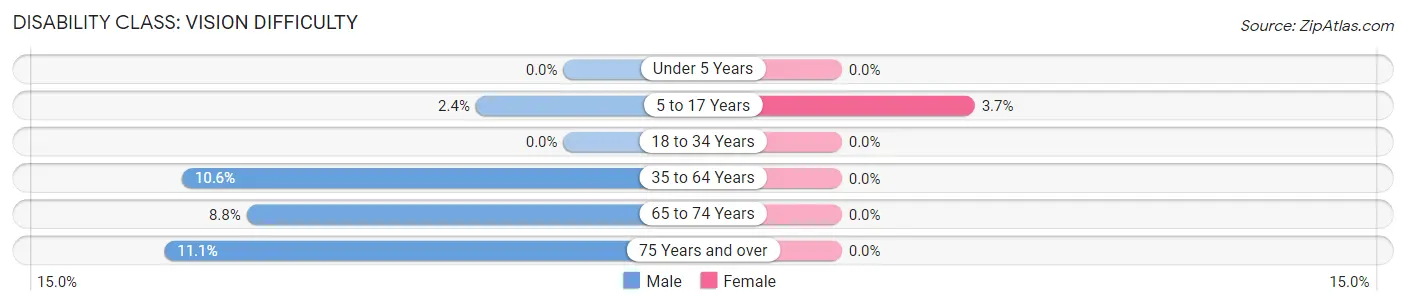
| Age Bracket | Male | Female |
| Under 5 Years | 0 (0.0%) | 0 (0.0%) |
| 5 to 17 Years | 2 (2.4%) | 3 (3.7%) |
| 18 to 34 Years | 0 (0.0%) | 0 (0.0%) |
| 35 to 64 Years | 17 (10.6%) | 0 (0.0%) |
| 65 to 74 Years | 6 (8.8%) | 0 (0.0%) |
| 75 Years and over | 1 (11.1%) | 0 (0.0%) |
Disability Class: Cognitive Difficulty
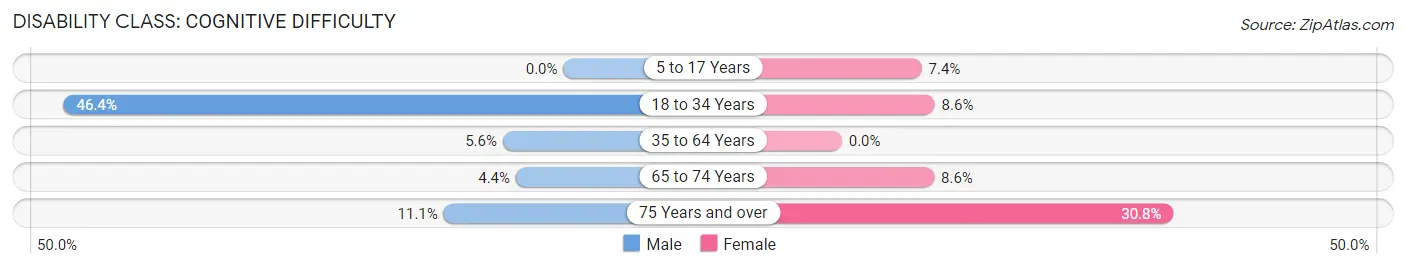
| Age Bracket | Male | Female |
| 5 to 17 Years | 0 (0.0%) | 6 (7.4%) |
| 18 to 34 Years | 64 (46.4%) | 5 (8.6%) |
| 35 to 64 Years | 9 (5.6%) | 0 (0.0%) |
| 65 to 74 Years | 3 (4.4%) | 6 (8.6%) |
| 75 Years and over | 1 (11.1%) | 8 (30.8%) |
Disability Class: Ambulatory Difficulty
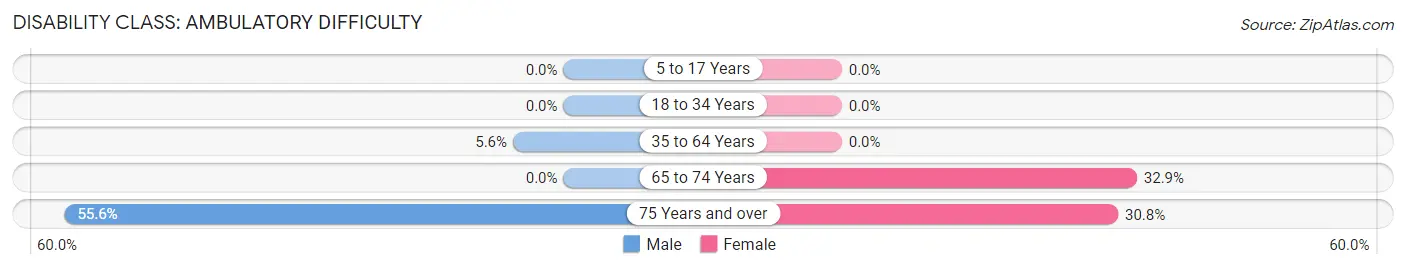
| Age Bracket | Male | Female |
| 5 to 17 Years | 0 (0.0%) | 0 (0.0%) |
| 18 to 34 Years | 0 (0.0%) | 0 (0.0%) |
| 35 to 64 Years | 9 (5.6%) | 0 (0.0%) |
| 65 to 74 Years | 0 (0.0%) | 23 (32.9%) |
| 75 Years and over | 5 (55.6%) | 8 (30.8%) |
Disability Class: Self-Care Difficulty
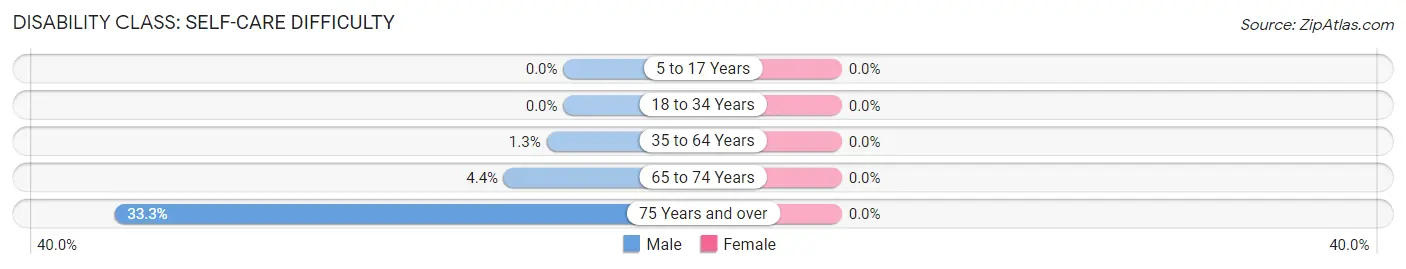
| Age Bracket | Male | Female |
| 5 to 17 Years | 0 (0.0%) | 0 (0.0%) |
| 18 to 34 Years | 0 (0.0%) | 0 (0.0%) |
| 35 to 64 Years | 2 (1.3%) | 0 (0.0%) |
| 65 to 74 Years | 3 (4.4%) | 0 (0.0%) |
| 75 Years and over | 3 (33.3%) | 0 (0.0%) |
Technology Access in East Mountain
Computing Device Access in East Mountain
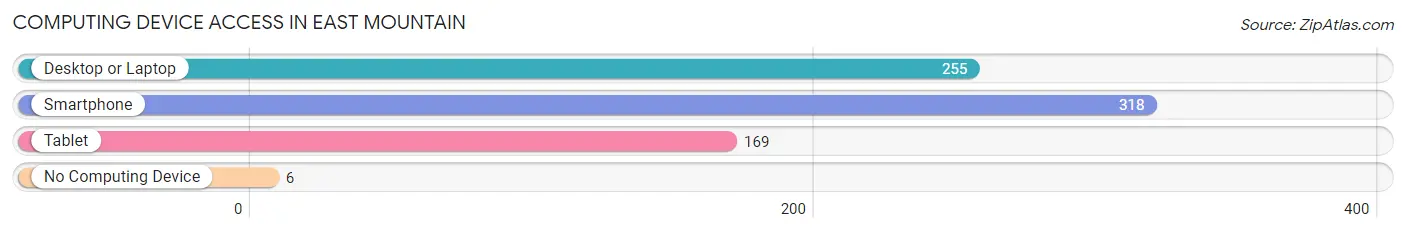
| Device Type | # Households | % Households |
| Desktop or Laptop | 255 | 76.3% |
| Smartphone | 318 | 95.2% |
| Tablet | 169 | 50.6% |
| No Computing Device | 6 | 1.8% |
| Total | 334 | 100.0% |
Internet Access in East Mountain
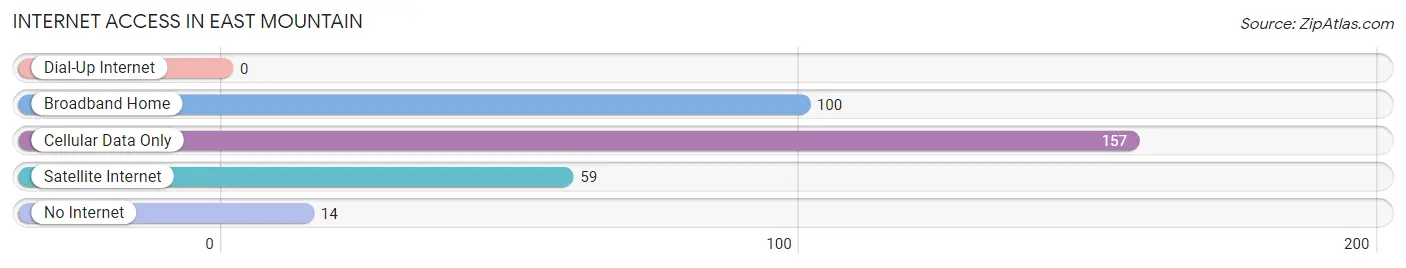
| Internet Type | # Households | % Households |
| Dial-Up Internet | 0 | 0.0% |
| Broadband Home | 100 | 29.9% |
| Cellular Data Only | 157 | 47.0% |
| Satellite Internet | 59 | 17.7% |
| No Internet | 14 | 4.2% |
| Total | 334 | 100.0% |
East Mountain Summary
History
The area now known as East Mountain, Texas was first settled in the late 1800s by a small group of settlers from the nearby town of Palestine. The settlers were looking for a place to call home and found the area to be a perfect fit. The area was mostly rural and had plenty of land for farming and ranching. The settlers quickly established a small community and named it East Mountain.
The area was sparsely populated until the early 1900s when the railroad came through. This brought more people to the area and the population began to grow. The town of East Mountain was officially incorporated in 1912.
The town grew slowly but steadily over the years and by the 1950s it had become a thriving community. The town had a few stores, a post office, a bank, and a few other businesses. The town also had a school and a church.
The town continued to grow and by the 1970s it had become a popular destination for tourists. The town had a few motels, restaurants, and other businesses catering to tourists.
The town continued to grow and by the 1990s it had become a popular destination for retirees. The town had a few retirement communities and a few golf courses.
Geography
East Mountain is located in Anderson County, Texas. It is situated in the eastern part of the county, near the city of Palestine. The town is located on the edge of the East Mountain Range, which is part of the larger Appalachian Mountains. The town is surrounded by rolling hills and forests.
The town is located about 80 miles southeast of Dallas and about 100 miles northwest of Houston. The nearest major airport is in Tyler, which is about 40 miles away.
The climate in East Mountain is generally mild and temperate. The average high temperature in the summer is around 90 degrees Fahrenheit and the average low temperature in the winter is around 40 degrees Fahrenheit.
Economy
The economy of East Mountain is largely based on tourism and retirement. The town has a few motels, restaurants, and other businesses catering to tourists. The town also has a few retirement communities and golf courses.
The town also has a few small businesses, such as a grocery store, a hardware store, and a few other shops. The town also has a few manufacturing plants, which provide jobs for the local residents.
Demographics
As of the 2010 census, the population of East Mountain was 1,845. The racial makeup of the town was 94.3% White, 2.2% African American, 0.3% Native American, 0.7% Asian, 0.1% Pacific Islander, and 2.4% from other races. Hispanic or Latino of any race were 4.2% of the population.
The median household income in East Mountain was $37,917 and the median family income was $45,625. The per capita income was $19,945. About 11.2% of the population was below the poverty line.
Conclusion
East Mountain, Texas is a small town located in Anderson County. The town has a long history and has grown steadily over the years. The town is largely based on tourism and retirement and has a few small businesses. The population of East Mountain is 1,845 and the median household income is $37,917.
Common Questions
What is Per Capita Income in East Mountain?
Per Capita income in East Mountain is $33,392.
What is the Median Family Income in East Mountain?
Median Family Income in East Mountain is $84,167.
What is the Median Household income in East Mountain?
Median Household Income in East Mountain is $67,500.
What is Income or Wage Gap in East Mountain?
Income or Wage Gap in East Mountain is 21.7%.
Women in East Mountain earn 78.3 cents for every dollar earned by a man.
What is Inequality or Gini Index in East Mountain?
Inequality or Gini Index in East Mountain is 0.41.
What is the Total Population of East Mountain?
Total Population of East Mountain is 918.
What is the Total Male Population of East Mountain?
Total Male Population of East Mountain is 497.
What is the Total Female Population of East Mountain?
Total Female Population of East Mountain is 421.
What is the Ratio of Males per 100 Females in East Mountain?
There are 118.05 Males per 100 Females in East Mountain.
What is the Ratio of Females per 100 Males in East Mountain?
There are 84.71 Females per 100 Males in East Mountain.
What is the Median Population Age in East Mountain?
Median Population Age in East Mountain is 37.8 Years.
What is the Average Family Size in East Mountain
Average Family Size in East Mountain is 3.4 People.
What is the Average Household Size in East Mountain
Average Household Size in East Mountain is 2.8 People.
How Large is the Labor Force in East Mountain?
There are 396 People in the Labor Forcein in East Mountain.
What is the Percentage of People in the Labor Force in East Mountain?
55.5% of People are in the Labor Force in East Mountain.
What is the Unemployment Rate in East Mountain?
Unemployment Rate in East Mountain is 3.3%.