Cleveland, TX Map & Demographics
Cleveland Map
Cleveland Overview
$22,652
PER CAPITA INCOME
$53,513
AVG FAMILY INCOME
$46,875
AVG HOUSEHOLD INCOME
23.1%
WAGE / INCOME GAP [ % ]
76.9¢/ $1
WAGE / INCOME GAP [ $ ]
$10,945
FAMILY INCOME DEFICIT
0.46
INEQUALITY / GINI INDEX
7,756
TOTAL POPULATION
4,382
MALE POPULATION
3,374
FEMALE POPULATION
129.88
MALES / 100 FEMALES
77.00
FEMALES / 100 MALES
36.5
MEDIAN AGE
3.2
AVG FAMILY SIZE
2.7
AVG HOUSEHOLD SIZE
3,073
LABOR FORCE [ PEOPLE ]
50.2%
PERCENT IN LABOR FORCE
2.4%
UNEMPLOYMENT RATE
Income in Cleveland
Income Overview in Cleveland
Per Capita Income in Cleveland is $22,652, while median incomes of families and households are $53,513 and $46,875 respectively.
| Characteristic | Number | Measure |
| Per Capita Income | 7,756 | $22,652 |
| Median Family Income | 1,836 | $53,513 |
| Mean Family Income | 1,836 | $81,820 |
| Median Household Income | 2,653 | $46,875 |
| Mean Household Income | 2,653 | $67,603 |
| Income Deficit | 1,836 | $10,945 |
| Wage / Income Gap (%) | 7,756 | 23.08% |
| Wage / Income Gap ($) | 7,756 | 76.92¢ per $1 |
| Gini / Inequality Index | 7,756 | 0.46 |
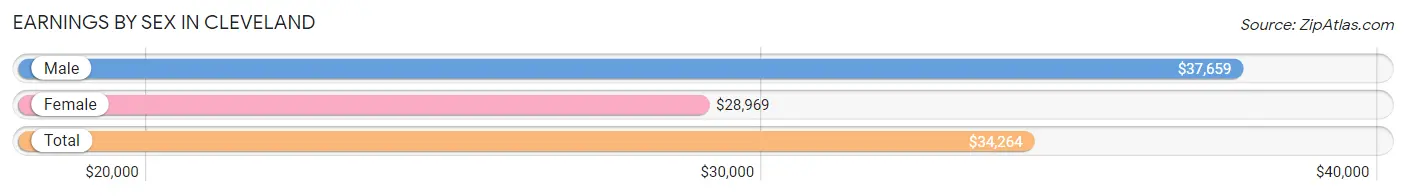
Earnings by Sex in Cleveland
Average Earnings in Cleveland are $34,264, $37,659 for men and $28,969 for women, a difference of 23.1%.
| Sex | Number | Average Earnings |
| Male | 1,750 (52.5%) | $37,659 |
| Female | 1,584 (47.5%) | $28,969 |
| Total | 3,334 (100.0%) | $34,264 |
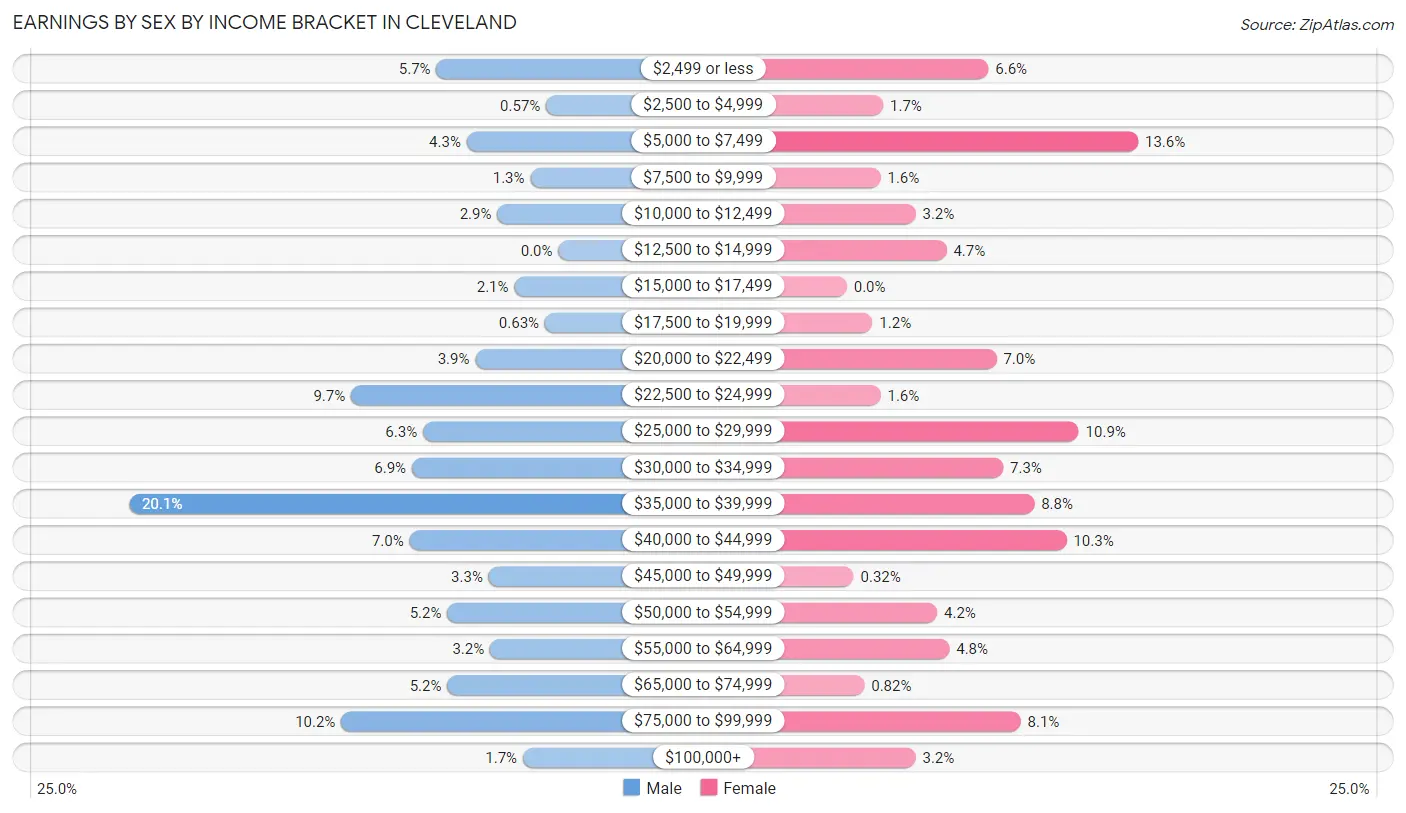
Earnings by Sex by Income Bracket in Cleveland
The most common earnings brackets in Cleveland are $35,000 to $39,999 for men (352 | 20.1%) and $5,000 to $7,499 for women (216 | 13.6%).
| Income | Male | Female |
| $2,499 or less | 100 (5.7%) | 105 (6.6%) |
| $2,500 to $4,999 | 10 (0.6%) | 27 (1.7%) |
| $5,000 to $7,499 | 75 (4.3%) | 216 (13.6%) |
| $7,500 to $9,999 | 23 (1.3%) | 25 (1.6%) |
| $10,000 to $12,499 | 50 (2.9%) | 51 (3.2%) |
| $12,500 to $14,999 | 0 (0.0%) | 74 (4.7%) |
| $15,000 to $17,499 | 36 (2.1%) | 0 (0.0%) |
| $17,500 to $19,999 | 11 (0.6%) | 19 (1.2%) |
| $20,000 to $22,499 | 68 (3.9%) | 111 (7.0%) |
| $22,500 to $24,999 | 170 (9.7%) | 25 (1.6%) |
| $25,000 to $29,999 | 111 (6.3%) | 172 (10.9%) |
| $30,000 to $34,999 | 120 (6.9%) | 116 (7.3%) |
| $35,000 to $39,999 | 352 (20.1%) | 139 (8.8%) |
| $40,000 to $44,999 | 122 (7.0%) | 163 (10.3%) |
| $45,000 to $49,999 | 57 (3.3%) | 5 (0.3%) |
| $50,000 to $54,999 | 91 (5.2%) | 67 (4.2%) |
| $55,000 to $64,999 | 56 (3.2%) | 76 (4.8%) |
| $65,000 to $74,999 | 91 (5.2%) | 13 (0.8%) |
| $75,000 to $99,999 | 178 (10.2%) | 129 (8.1%) |
| $100,000+ | 29 (1.7%) | 51 (3.2%) |
| Total | 1,750 (100.0%) | 1,584 (100.0%) |
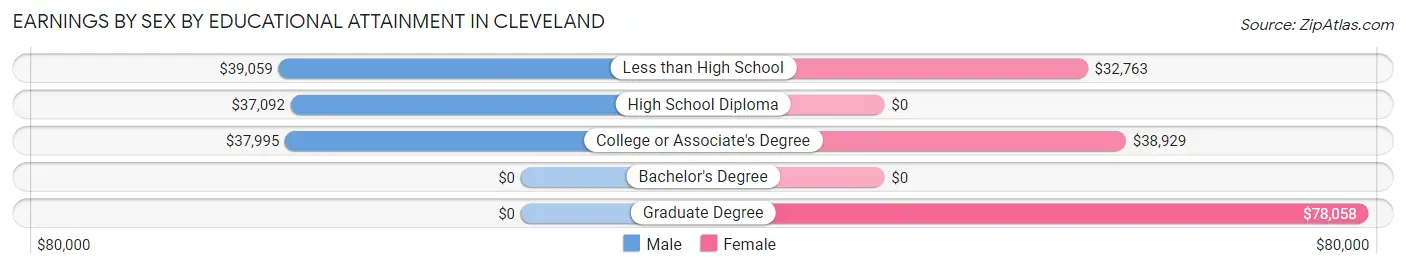
Earnings by Sex by Educational Attainment in Cleveland
Average earnings in Cleveland are $38,302 for men and $30,854 for women, a difference of 19.5%. Men with an educational attainment of less than high school enjoy the highest average annual earnings of $39,059, while those with high school diploma education earn the least with $37,092. Women with an educational attainment of graduate degree earn the most with the average annual earnings of $78,058, while those with less than high school education have the smallest earnings of $32,763.
| Educational Attainment | Male Income | Female Income |
| Less than High School | $39,059 | $32,763 |
| High School Diploma | $37,092 | $0 |
| College or Associate's Degree | $37,995 | $38,929 |
| Bachelor's Degree | - | - |
| Graduate Degree | - | - |
| Total | $38,302 | $30,854 |
Family Income in Cleveland
Family Income Brackets in Cleveland
According to the Cleveland family income data, there are 507 families falling into the $35,000 to $49,999 income range, which is the most common income bracket and makes up 27.6% of all families. Conversely, the $10,000 to $14,999 income bracket is the least frequent group with only 26 families (1.4%) belonging to this category.
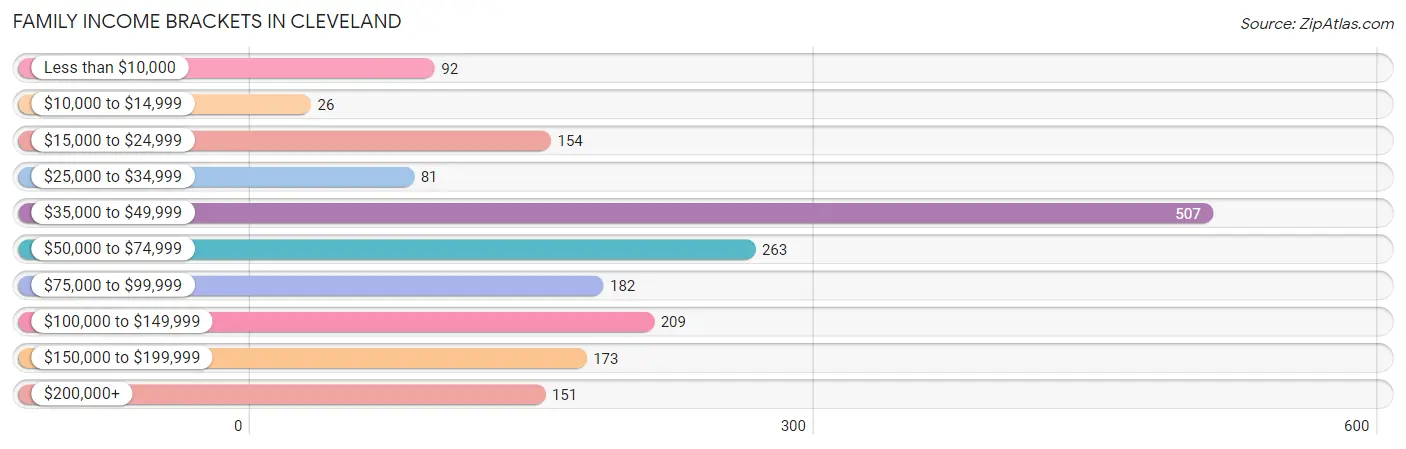
| Income Bracket | # Families | % Families |
| Less than $10,000 | 92 | 5.0% |
| $10,000 to $14,999 | 26 | 1.4% |
| $15,000 to $24,999 | 154 | 8.4% |
| $25,000 to $34,999 | 81 | 4.4% |
| $35,000 to $49,999 | 507 | 27.6% |
| $50,000 to $74,999 | 263 | 14.3% |
| $75,000 to $99,999 | 182 | 9.9% |
| $100,000 to $149,999 | 209 | 11.4% |
| $150,000 to $199,999 | 173 | 9.4% |
| $200,000+ | 151 | 8.2% |
Family Income by Famaliy Size in Cleveland
5-person families (157 | 8.6%) account for the highest median family income in Cleveland with $88,625 per family, while 2-person families (932 | 50.8%) have the highest median income of $24,505 per family member.
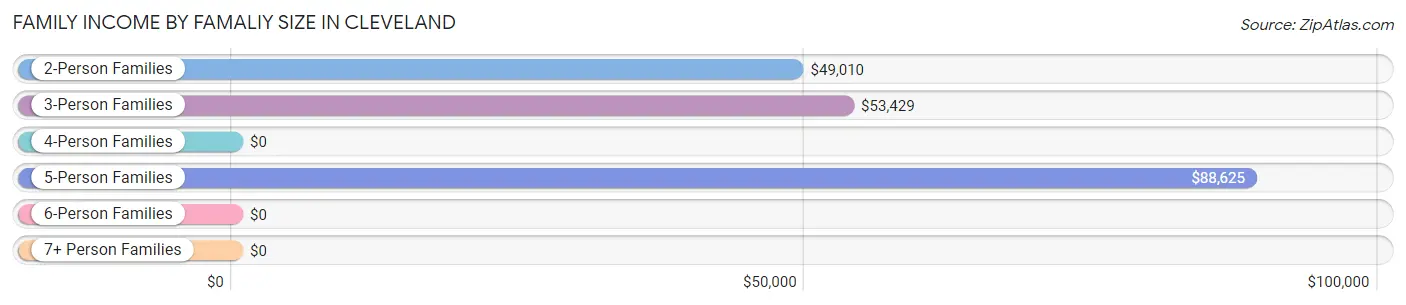
| Income Bracket | # Families | Median Income |
| 2-Person Families | 932 (50.8%) | $49,010 |
| 3-Person Families | 373 (20.3%) | $53,429 |
| 4-Person Families | 234 (12.8%) | $0 |
| 5-Person Families | 157 (8.6%) | $88,625 |
| 6-Person Families | 121 (6.6%) | $0 |
| 7+ Person Families | 19 (1.0%) | $0 |
| Total | 1,836 (100.0%) | $53,513 |
Family Income by Number of Earners in Cleveland
The median family income in Cleveland is $53,513, with families comprising 3+ earners (216) having the highest median family income of $175,496, while families with no earners (448) have the lowest median family income of $28,289, accounting for 11.8% and 24.4% of families, respectively.
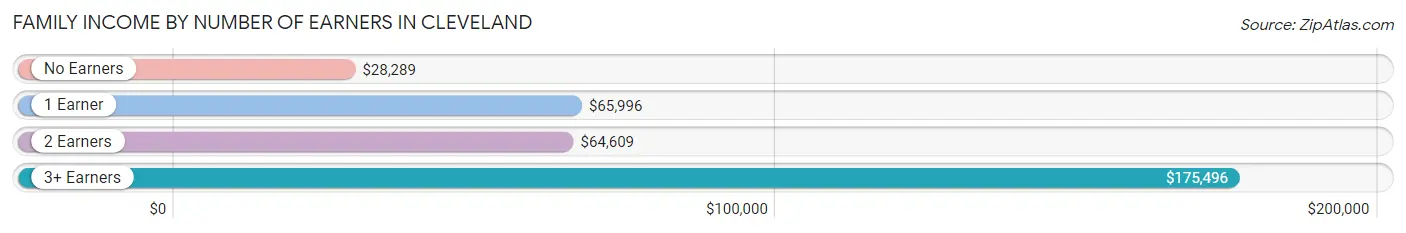
| Number of Earners | # Families | Median Income |
| No Earners | 448 (24.4%) | $28,289 |
| 1 Earner | 503 (27.4%) | $65,996 |
| 2 Earners | 669 (36.4%) | $64,609 |
| 3+ Earners | 216 (11.8%) | $175,496 |
| Total | 1,836 (100.0%) | $53,513 |
Household Income in Cleveland
Household Income Brackets in Cleveland
With 589 households falling in the category, the $35,000 to $49,999 income range is the most frequent in Cleveland, accounting for 22.2% of all households. In contrast, only 117 households (4.4%) fall into the $10,000 to $14,999 income bracket, making it the least populous group.
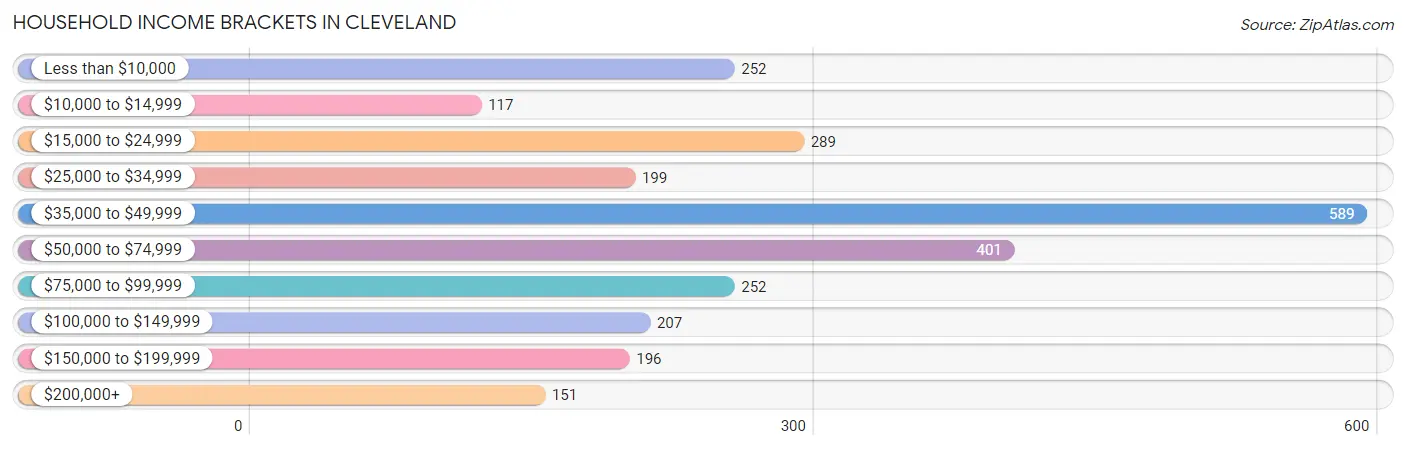
| Income Bracket | # Households | % Households |
| Less than $10,000 | 252 | 9.5% |
| $10,000 to $14,999 | 117 | 4.4% |
| $15,000 to $24,999 | 289 | 10.9% |
| $25,000 to $34,999 | 199 | 7.5% |
| $35,000 to $49,999 | 589 | 22.2% |
| $50,000 to $74,999 | 401 | 15.1% |
| $75,000 to $99,999 | 252 | 9.5% |
| $100,000 to $149,999 | 207 | 7.8% |
| $150,000 to $199,999 | 196 | 7.4% |
| $200,000+ | 151 | 5.7% |
Household Income by Householder Age in Cleveland
The median household income in Cleveland is $46,875, with the highest median household income of $60,599 found in the 45 to 64 years age bracket for the primary householder. A total of 1,087 households (41.0%) fall into this category. Meanwhile, the 15 to 24 years age bracket for the primary householder has the lowest median household income of $0, with 148 households (5.6%) in this group.
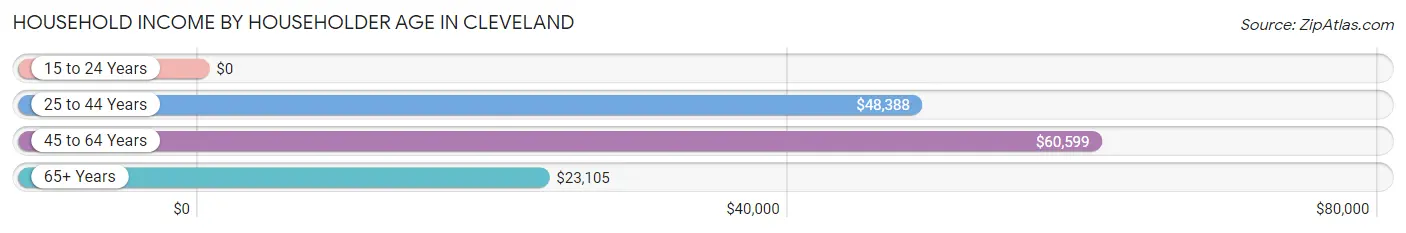
| Income Bracket | # Households | Median Income |
| 15 to 24 Years | 148 (5.6%) | $0 |
| 25 to 44 Years | 863 (32.5%) | $48,388 |
| 45 to 64 Years | 1,087 (41.0%) | $60,599 |
| 65+ Years | 555 (20.9%) | $23,105 |
| Total | 2,653 (100.0%) | $46,875 |
Poverty in Cleveland
Income Below Poverty by Sex and Age in Cleveland
With 10.0% poverty level for males and 18.5% for females among the residents of Cleveland, 6 to 11 year old males and 12 to 14 year old females are the most vulnerable to poverty, with 112 males (26.3%) and 19 females (39.6%) in their respective age groups living below the poverty level.
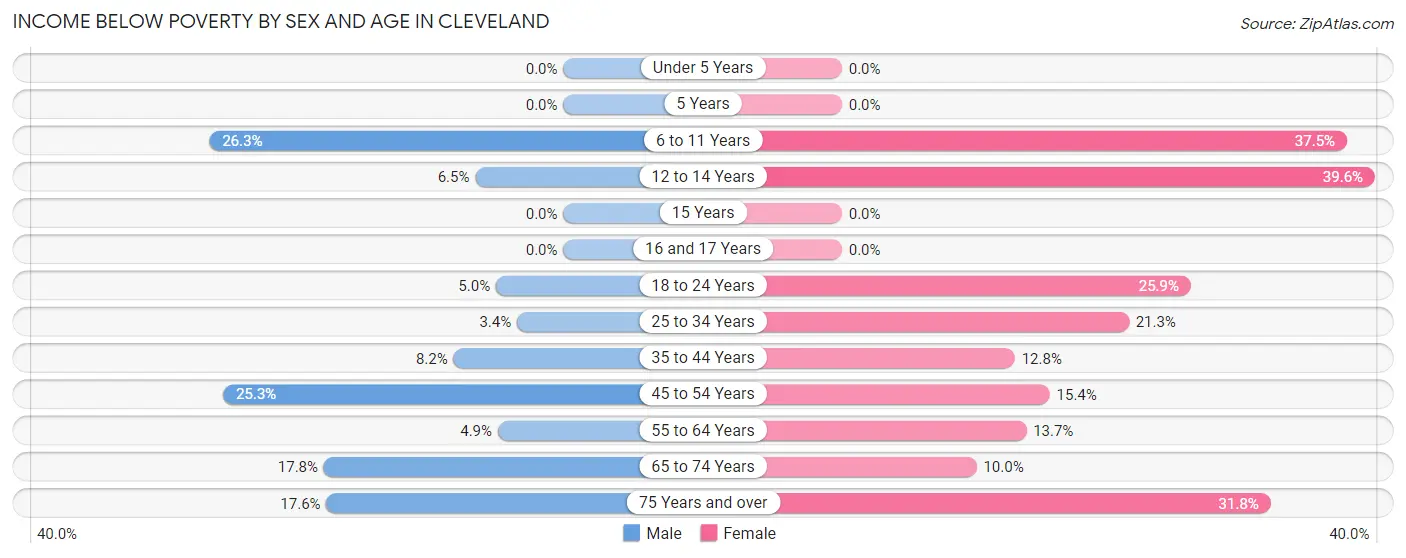
| Age Bracket | Male | Female |
| Under 5 Years | 0 (0.0%) | 0 (0.0%) |
| 5 Years | 0 (0.0%) | 0 (0.0%) |
| 6 to 11 Years | 112 (26.3%) | 96 (37.5%) |
| 12 to 14 Years | 20 (6.5%) | 19 (39.6%) |
| 15 Years | 0 (0.0%) | 0 (0.0%) |
| 16 and 17 Years | 0 (0.0%) | 0 (0.0%) |
| 18 to 24 Years | 8 (5.0%) | 93 (25.9%) |
| 25 to 34 Years | 22 (3.4%) | 115 (21.3%) |
| 35 to 44 Years | 34 (8.2%) | 42 (12.8%) |
| 45 to 54 Years | 69 (25.3%) | 58 (15.4%) |
| 55 to 64 Years | 27 (4.9%) | 82 (13.7%) |
| 65 to 74 Years | 72 (17.8%) | 32 (10.0%) |
| 75 Years and over | 19 (17.6%) | 71 (31.8%) |
| Total | 383 (10.0%) | 608 (18.5%) |
Income Above Poverty by Sex and Age in Cleveland
According to the poverty statistics in Cleveland, males aged under 5 years and females aged under 5 years are the age groups that are most secure financially, with 100.0% of males and 100.0% of females in these age groups living above the poverty line.
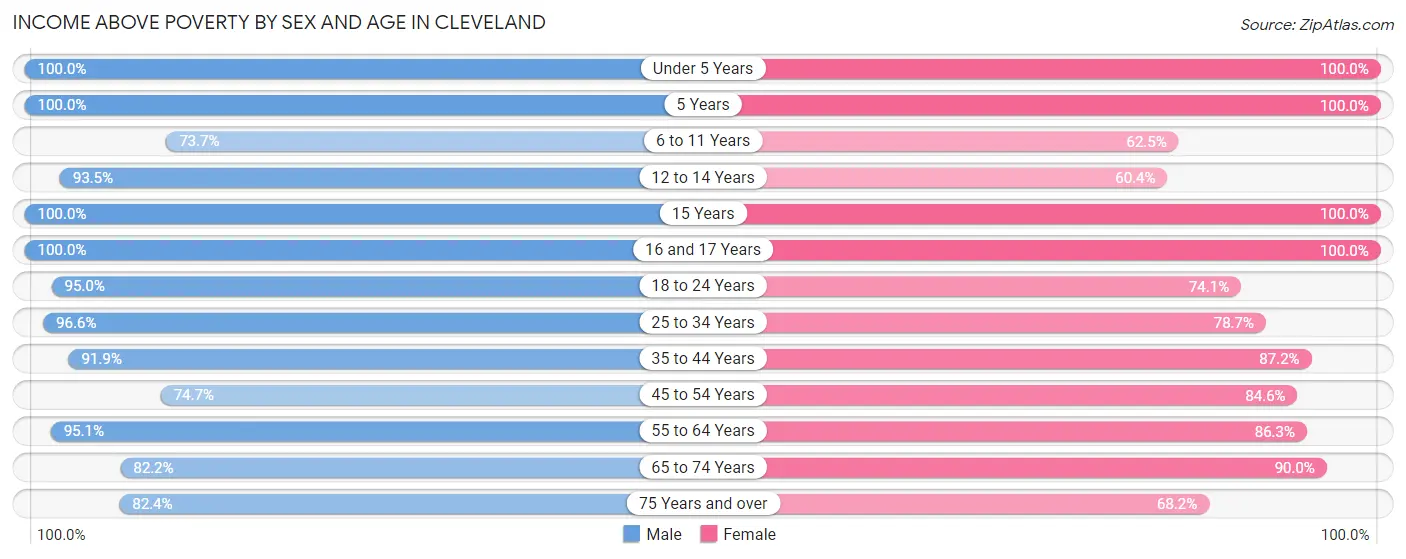
| Age Bracket | Male | Female |
| Under 5 Years | 274 (100.0%) | 106 (100.0%) |
| 5 Years | 16 (100.0%) | 95 (100.0%) |
| 6 to 11 Years | 314 (73.7%) | 160 (62.5%) |
| 12 to 14 Years | 286 (93.5%) | 29 (60.4%) |
| 15 Years | 39 (100.0%) | 26 (100.0%) |
| 16 and 17 Years | 201 (100.0%) | 7 (100.0%) |
| 18 to 24 Years | 152 (95.0%) | 266 (74.1%) |
| 25 to 34 Years | 617 (96.6%) | 425 (78.7%) |
| 35 to 44 Years | 383 (91.8%) | 285 (87.2%) |
| 45 to 54 Years | 204 (74.7%) | 318 (84.6%) |
| 55 to 64 Years | 529 (95.1%) | 517 (86.3%) |
| 65 to 74 Years | 333 (82.2%) | 288 (90.0%) |
| 75 Years and over | 89 (82.4%) | 152 (68.2%) |
| Total | 3,437 (90.0%) | 2,674 (81.5%) |
Income Below Poverty Among Married-Couple Families in Cleveland
The poverty statistics for married-couple families in Cleveland show that 6.4% or 83 of the total 1,300 families live below the poverty line. Families with 1 or 2 children have the highest poverty rate of 9.8%, comprising of 37 families. On the other hand, families with 3 or 4 children have the lowest poverty rate of 0.0%, which includes 0 families.
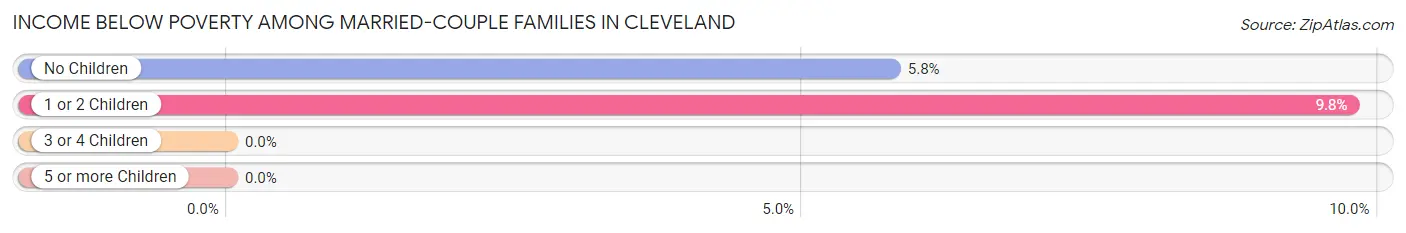
| Children | Above Poverty | Below Poverty |
| No Children | 751 (94.2%) | 46 (5.8%) |
| 1 or 2 Children | 342 (90.2%) | 37 (9.8%) |
| 3 or 4 Children | 124 (100.0%) | 0 (0.0%) |
| 5 or more Children | 0 (0.0%) | 0 (0.0%) |
| Total | 1,217 (93.6%) | 83 (6.4%) |
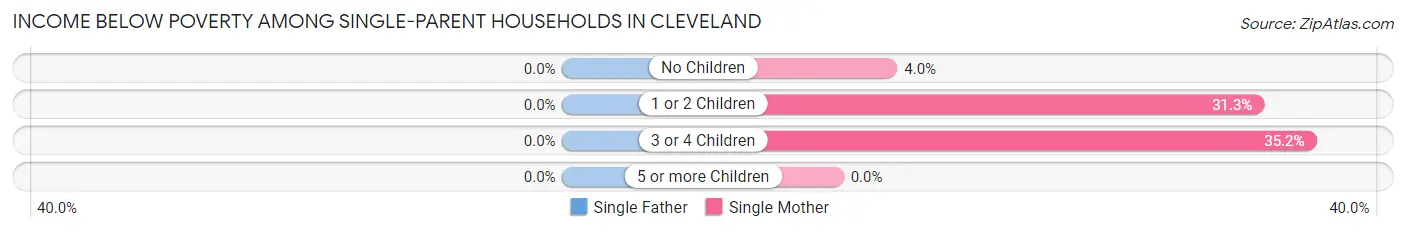
Income Below Poverty Among Single-Parent Households in Cleveland
| Children | Single Father | Single Mother |
| No Children | 0 (0.0%) | 3 (4.0%) |
| 1 or 2 Children | 0 (0.0%) | 73 (31.3%) |
| 3 or 4 Children | 0 (0.0%) | 25 (35.2%) |
| 5 or more Children | 0 (0.0%) | 0 (0.0%) |
| Total | 0 (0.0%) | 101 (26.7%) |
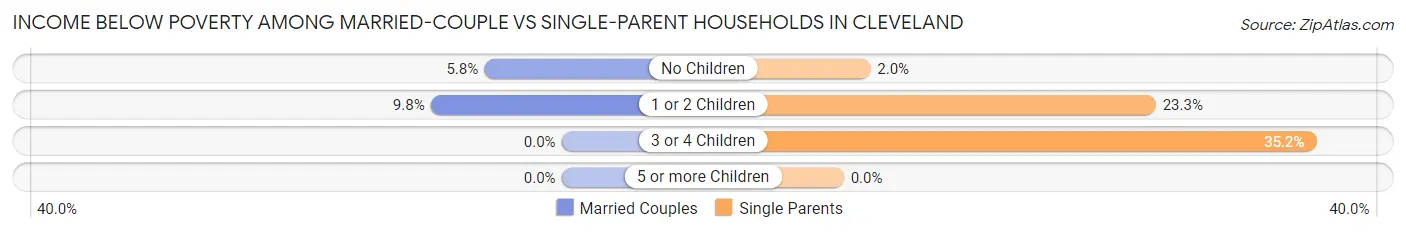
Income Below Poverty Among Married-Couple vs Single-Parent Households in Cleveland
The poverty data for Cleveland shows that 83 of the married-couple family households (6.4%) and 101 of the single-parent households (18.8%) are living below the poverty level. Within the married-couple family households, those with 1 or 2 children have the highest poverty rate, with 37 households (9.8%) falling below the poverty line. Among the single-parent households, those with 3 or 4 children have the highest poverty rate, with 25 household (35.2%) living below poverty.
| Children | Married-Couple Families | Single-Parent Households |
| No Children | 46 (5.8%) | 3 (2.0%) |
| 1 or 2 Children | 37 (9.8%) | 73 (23.3%) |
| 3 or 4 Children | 0 (0.0%) | 25 (35.2%) |
| 5 or more Children | 0 (0.0%) | 0 (0.0%) |
| Total | 83 (6.4%) | 101 (18.8%) |
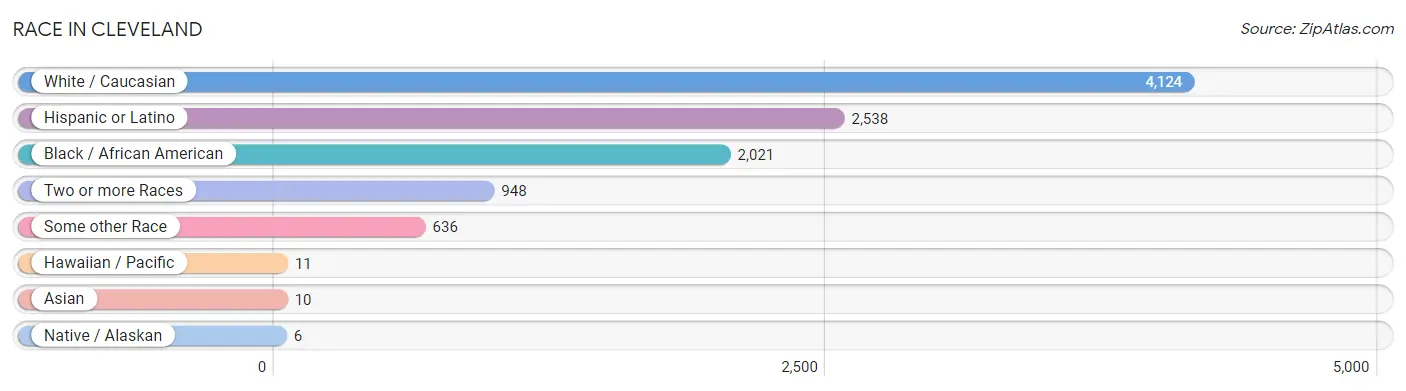
Race in Cleveland
The most populous races in Cleveland are White / Caucasian (4,124 | 53.2%), Hispanic or Latino (2,538 | 32.7%), and Black / African American (2,021 | 26.1%).
| Race | # Population | % Population |
| Asian | 10 | 0.1% |
| Black / African American | 2,021 | 26.1% |
| Hawaiian / Pacific | 11 | 0.1% |
| Hispanic or Latino | 2,538 | 32.7% |
| Native / Alaskan | 6 | 0.1% |
| White / Caucasian | 4,124 | 53.2% |
| Two or more Races | 948 | 12.2% |
| Some other Race | 636 | 8.2% |
| Total | 7,756 | 100.0% |
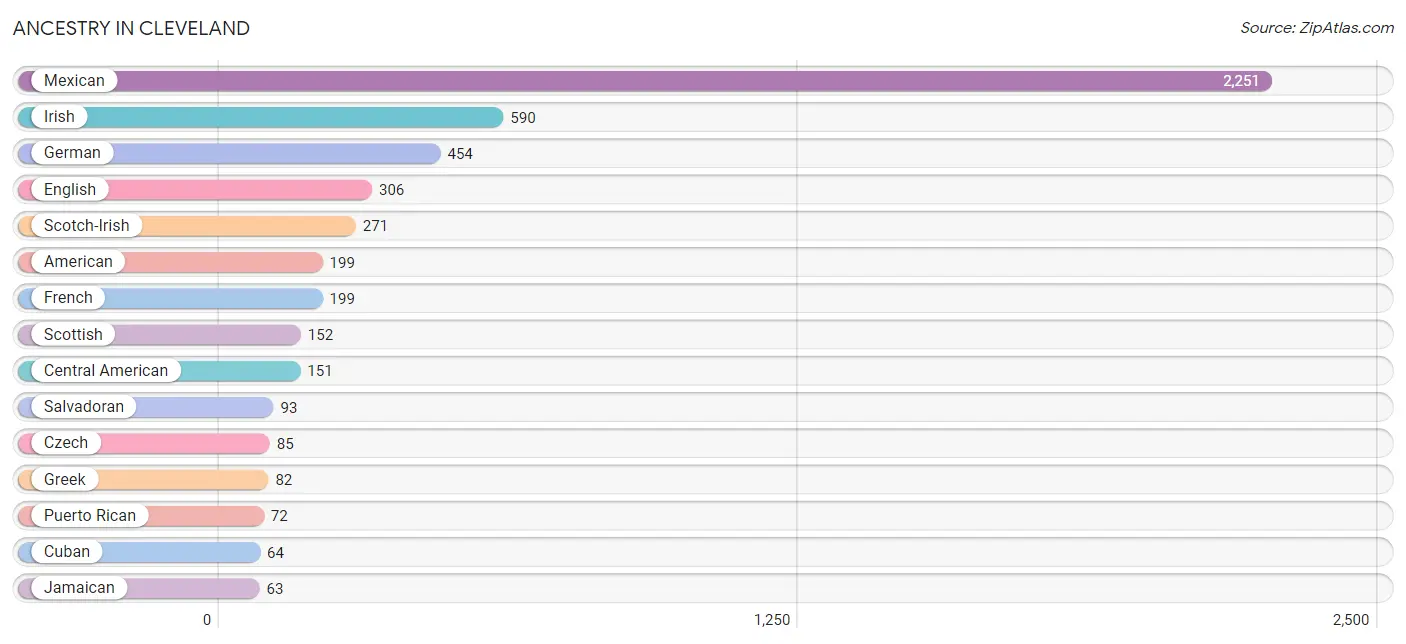
Ancestry in Cleveland
The most populous ancestries reported in Cleveland are Mexican (2,251 | 29.0%), Irish (590 | 7.6%), German (454 | 5.9%), English (306 | 4.0%), and Scotch-Irish (271 | 3.5%), together accounting for 49.9% of all Cleveland residents.
| Ancestry | # Population | % Population |
| African | 35 | 0.4% |
| American | 199 | 2.6% |
| Belgian | 15 | 0.2% |
| Bhutanese | 9 | 0.1% |
| Central American | 151 | 1.9% |
| Cherokee | 11 | 0.1% |
| Choctaw | 49 | 0.6% |
| Comanche | 9 | 0.1% |
| Cuban | 64 | 0.8% |
| Czech | 85 | 1.1% |
| Dutch | 22 | 0.3% |
| English | 306 | 4.0% |
| French | 199 | 2.6% |
| German | 454 | 5.9% |
| Greek | 82 | 1.1% |
| Guatemalan | 9 | 0.1% |
| Haitian | 8 | 0.1% |
| Honduran | 49 | 0.6% |
| Irish | 590 | 7.6% |
| Italian | 44 | 0.6% |
| Jamaican | 63 | 0.8% |
| Lithuanian | 42 | 0.5% |
| Mexican | 2,251 | 29.0% |
| Norwegian | 26 | 0.3% |
| Polish | 55 | 0.7% |
| Pueblo | 6 | 0.1% |
| Puerto Rican | 72 | 0.9% |
| Russian | 9 | 0.1% |
| Salvadoran | 93 | 1.2% |
| Scotch-Irish | 271 | 3.5% |
| Scottish | 152 | 2.0% |
| Subsaharan African | 35 | 0.4% |
| Swedish | 12 | 0.2% |
| Swiss | 17 | 0.2% |
| Thai | 62 | 0.8% |
| Ute | 6 | 0.1% | View All 36 Rows |
Immigrants in Cleveland
The most numerous immigrant groups reported in Cleveland came from Latin America (909 | 11.7%), Central America (803 | 10.3%), Mexico (699 | 9.0%), Caribbean (106 | 1.4%), and Jamaica (63 | 0.8%), together accounting for 33.3% of all Cleveland residents.
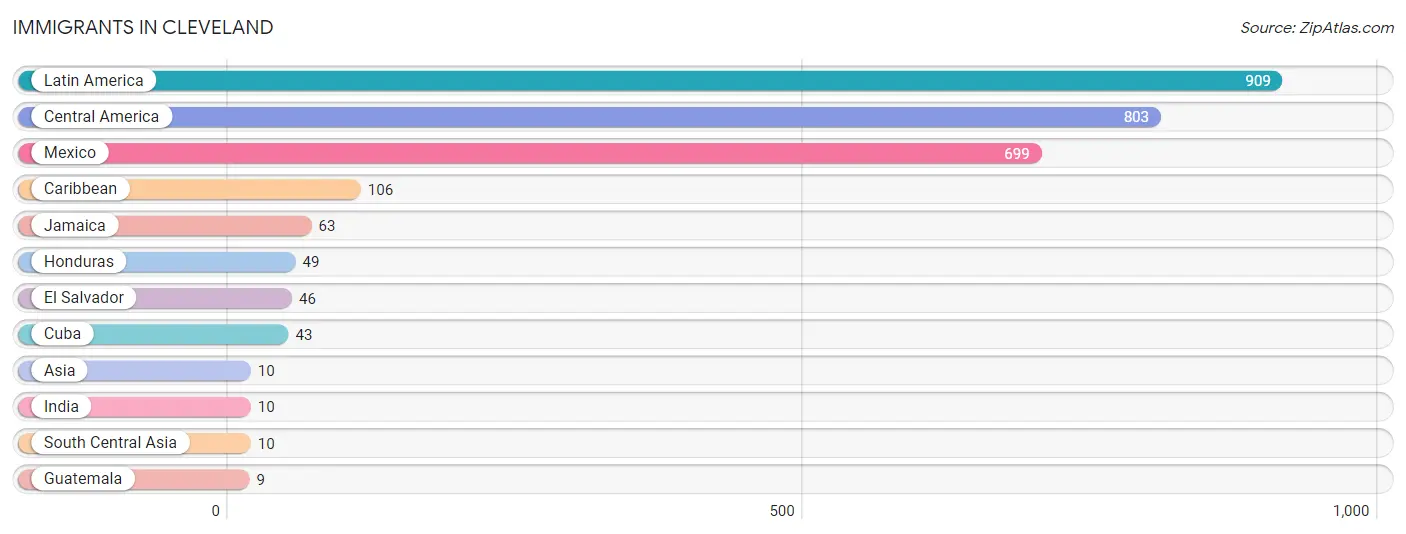
| Immigration Origin | # Population | % Population |
| Asia | 10 | 0.1% |
| Caribbean | 106 | 1.4% |
| Central America | 803 | 10.3% |
| Cuba | 43 | 0.5% |
| El Salvador | 46 | 0.6% |
| Guatemala | 9 | 0.1% |
| Honduras | 49 | 0.6% |
| India | 10 | 0.1% |
| Jamaica | 63 | 0.8% |
| Latin America | 909 | 11.7% |
| Mexico | 699 | 9.0% |
| South Central Asia | 10 | 0.1% | View All 12 Rows |
Sex and Age in Cleveland
Sex and Age in Cleveland
The most populous age groups in Cleveland are 30 to 34 Years (590 | 13.5%) for men and 60 to 64 Years (426 | 12.6%) for women.
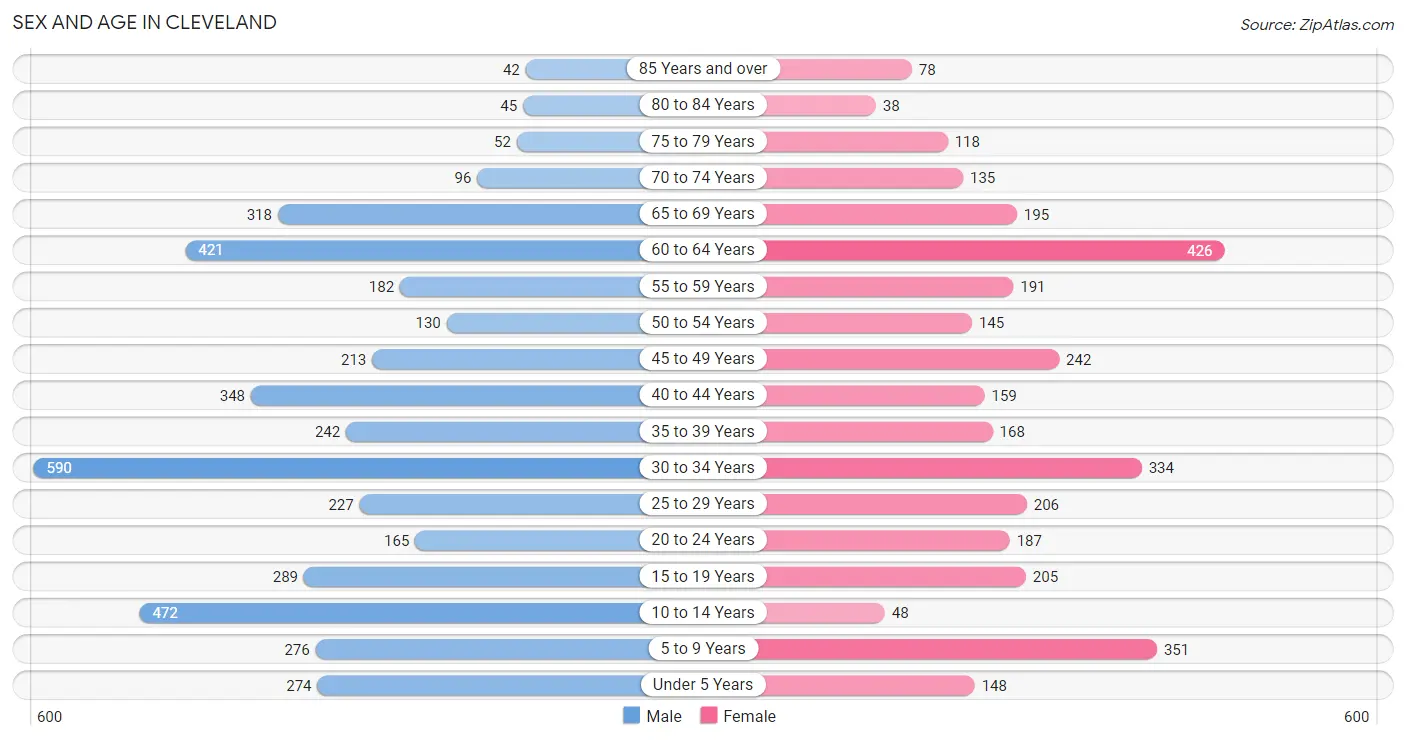
| Age Bracket | Male | Female |
| Under 5 Years | 274 (6.2%) | 148 (4.4%) |
| 5 to 9 Years | 276 (6.3%) | 351 (10.4%) |
| 10 to 14 Years | 472 (10.8%) | 48 (1.4%) |
| 15 to 19 Years | 289 (6.6%) | 205 (6.1%) |
| 20 to 24 Years | 165 (3.8%) | 187 (5.5%) |
| 25 to 29 Years | 227 (5.2%) | 206 (6.1%) |
| 30 to 34 Years | 590 (13.5%) | 334 (9.9%) |
| 35 to 39 Years | 242 (5.5%) | 168 (5.0%) |
| 40 to 44 Years | 348 (7.9%) | 159 (4.7%) |
| 45 to 49 Years | 213 (4.9%) | 242 (7.2%) |
| 50 to 54 Years | 130 (3.0%) | 145 (4.3%) |
| 55 to 59 Years | 182 (4.2%) | 191 (5.7%) |
| 60 to 64 Years | 421 (9.6%) | 426 (12.6%) |
| 65 to 69 Years | 318 (7.3%) | 195 (5.8%) |
| 70 to 74 Years | 96 (2.2%) | 135 (4.0%) |
| 75 to 79 Years | 52 (1.2%) | 118 (3.5%) |
| 80 to 84 Years | 45 (1.0%) | 38 (1.1%) |
| 85 Years and over | 42 (1.0%) | 78 (2.3%) |
| Total | 4,382 (100.0%) | 3,374 (100.0%) |
Families and Households in Cleveland
Median Family Size in Cleveland
The median family size in Cleveland is 3.24 persons per family, with single female/mother families (379 | 20.6%) accounting for the largest median family size of 3.83 persons per family. On the other hand, married-couple families (1,300 | 70.8%) represent the smallest median family size with 3.07 persons per family.
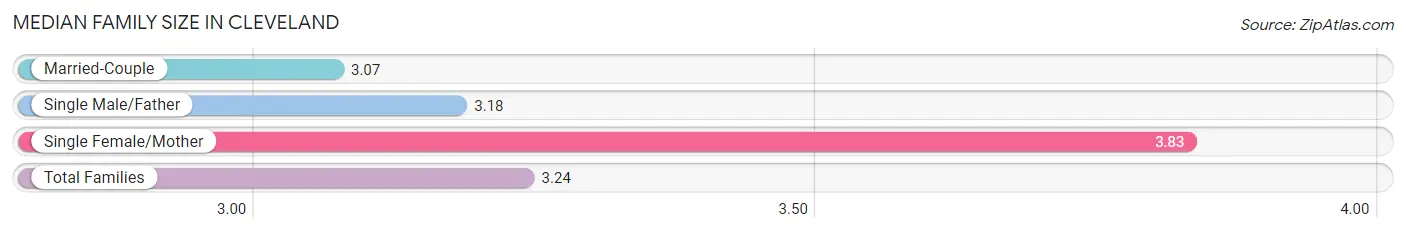
| Family Type | # Families | Family Size |
| Married-Couple | 1,300 (70.8%) | 3.07 |
| Single Male/Father | 157 (8.6%) | 3.18 |
| Single Female/Mother | 379 (20.6%) | 3.83 |
| Total Families | 1,836 (100.0%) | 3.24 |
Median Household Size in Cleveland
The median household size in Cleveland is 2.68 persons per household, with single female/mother households (379 | 14.3%) accounting for the largest median household size of 3.91 persons per household. non-family households (817 | 30.8%) represent the smallest median household size with 1.27 persons per household.
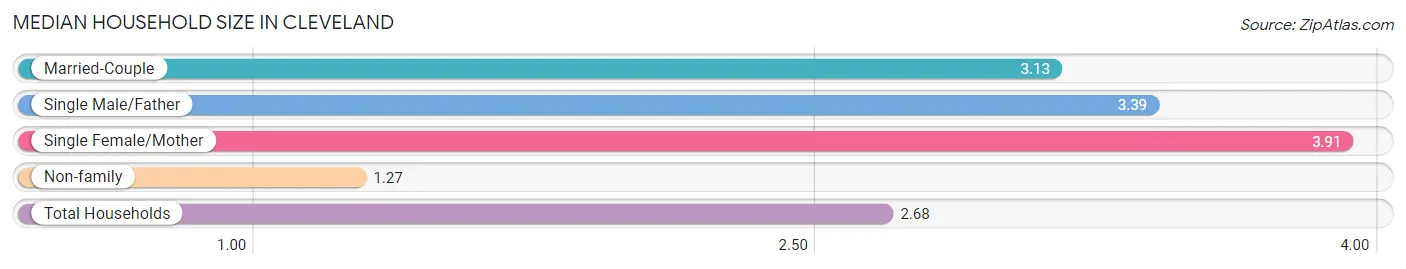
| Household Type | # Households | Household Size |
| Married-Couple | 1,300 (49.0%) | 3.13 |
| Single Male/Father | 157 (5.9%) | 3.39 |
| Single Female/Mother | 379 (14.3%) | 3.91 |
| Non-family | 817 (30.8%) | 1.27 |
| Total Households | 2,653 (100.0%) | 2.68 |
Household Size by Marriage Status in Cleveland
Out of a total of 2,653 households in Cleveland, 1,836 (69.2%) are family households, while 817 (30.8%) are nonfamily households. The most numerous type of family households are 2-person households, comprising 865, and the most common type of nonfamily households are 1-person households, comprising 627.
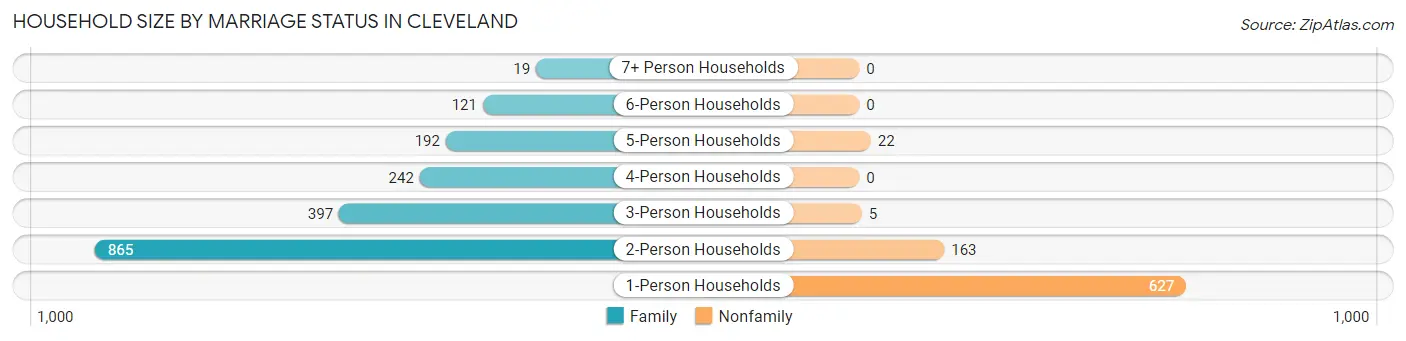
| Household Size | Family Households | Nonfamily Households |
| 1-Person Households | - | 627 (23.6%) |
| 2-Person Households | 865 (32.6%) | 163 (6.1%) |
| 3-Person Households | 397 (15.0%) | 5 (0.2%) |
| 4-Person Households | 242 (9.1%) | 0 (0.0%) |
| 5-Person Households | 192 (7.2%) | 22 (0.8%) |
| 6-Person Households | 121 (4.6%) | 0 (0.0%) |
| 7+ Person Households | 19 (0.7%) | 0 (0.0%) |
| Total | 1,836 (69.2%) | 817 (30.8%) |
Female Fertility in Cleveland
Fertility by Age in Cleveland
Average fertility rate in Cleveland is 101.0 births per 1,000 women. Women in the age bracket of 20 to 34 years have the highest fertility rate with 209.0 births per 1,000 women. Women in the age bracket of 20 to 34 years acount for 100.0% of all women with births.
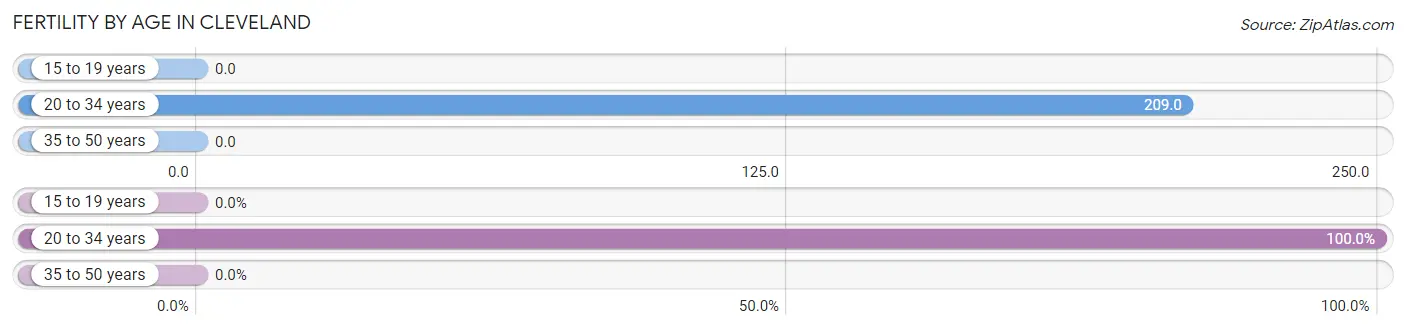
| Age Bracket | Women with Births | Births / 1,000 Women |
| 15 to 19 years | 0 (0.0%) | 0.0 |
| 20 to 34 years | 152 (100.0%) | 209.0 |
| 35 to 50 years | 0 (0.0%) | 0.0 |
| Total | 152 (100.0%) | 101.0 |
Fertility by Age by Marriage Status in Cleveland
66.4% of women with births (152) in Cleveland are married. The highest percentage of unmarried women with births falls into 20 to 34 years age bracket with 33.6% of them unmarried at the time of birth, while the lowest percentage of unmarried women with births belong to 20 to 34 years age bracket with 33.6% of them unmarried.
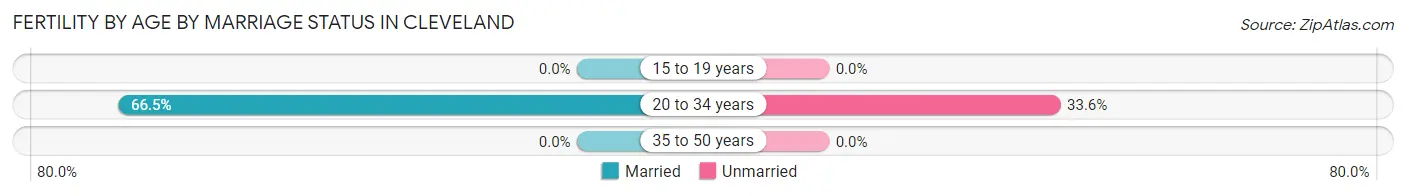
| Age Bracket | Married | Unmarried |
| 15 to 19 years | 0 (0.0%) | 0 (0.0%) |
| 20 to 34 years | 101 (66.4%) | 51 (33.6%) |
| 35 to 50 years | 0 (0.0%) | 0 (0.0%) |
| Total | 101 (66.4%) | 51 (33.6%) |
Fertility by Education in Cleveland
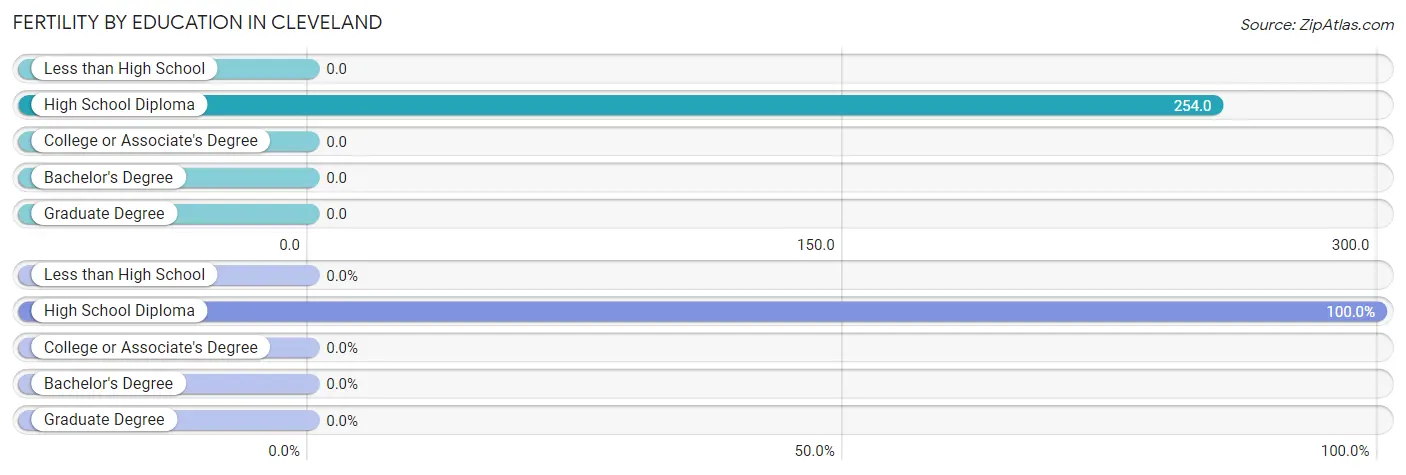
| Educational Attainment | Women with Births | Births / 1,000 Women |
| Less than High School | 0 (0.0%) | 0.0 |
| High School Diploma | 152 (100.0%) | 254.0 |
| College or Associate's Degree | 0 (0.0%) | 0.0 |
| Bachelor's Degree | 0 (0.0%) | 0.0 |
| Graduate Degree | 0 (0.0%) | 0.0 |
| Total | 152 (100.0%) | 101.0 |
Fertility by Education by Marriage Status in Cleveland
33.6% of women with births in Cleveland are unmarried. Women with the educational attainment of high school diploma are most likely to be married with 66.4% of them married at childbirth, while women with the educational attainment of high school diploma are least likely to be married with 33.6% of them unmarried at childbirth.
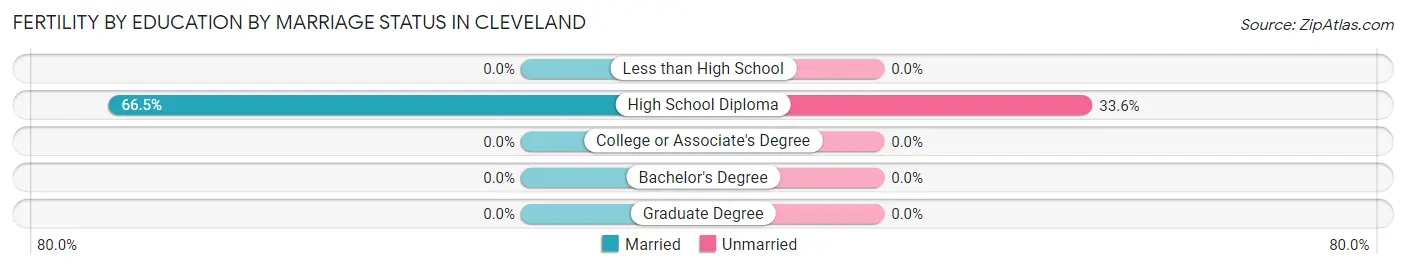
| Educational Attainment | Married | Unmarried |
| Less than High School | 0 (0.0%) | 0 (0.0%) |
| High School Diploma | 101 (66.4%) | 51 (33.6%) |
| College or Associate's Degree | 0 (0.0%) | 0 (0.0%) |
| Bachelor's Degree | 0 (0.0%) | 0 (0.0%) |
| Graduate Degree | 0 (0.0%) | 0 (0.0%) |
| Total | 101 (66.4%) | 51 (33.6%) |
Employment Characteristics in Cleveland
Employment by Class of Employer in Cleveland
Among the 2,964 employed individuals in Cleveland, private company employees (1,815 | 61.2%), state government employees (370 | 12.5%), and self-employed (not incorporated) (332 | 11.2%) make up the most common classes of employment.
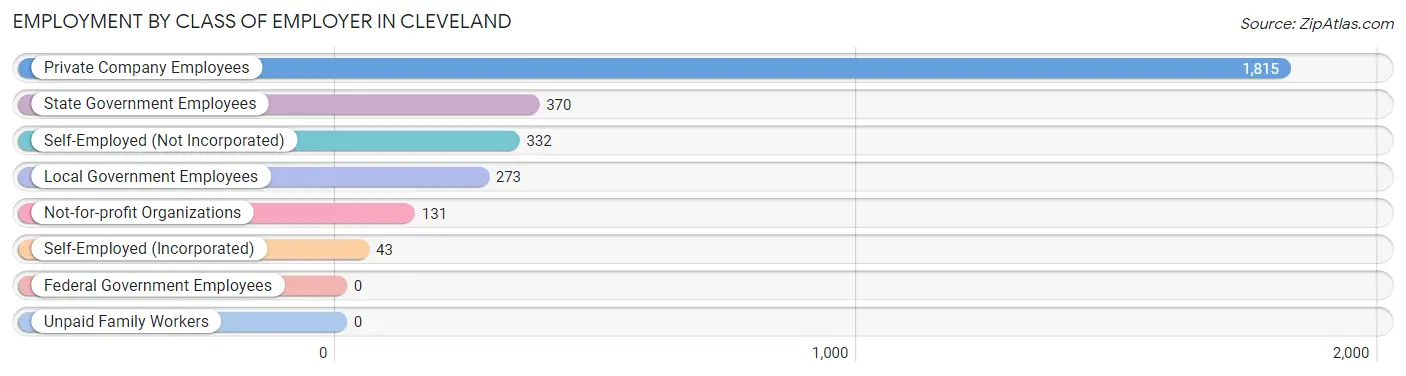
| Employer Class | # Employees | % Employees |
| Private Company Employees | 1,815 | 61.2% |
| Self-Employed (Incorporated) | 43 | 1.5% |
| Self-Employed (Not Incorporated) | 332 | 11.2% |
| Not-for-profit Organizations | 131 | 4.4% |
| Local Government Employees | 273 | 9.2% |
| State Government Employees | 370 | 12.5% |
| Federal Government Employees | 0 | 0.0% |
| Unpaid Family Workers | 0 | 0.0% |
| Total | 2,964 | 100.0% |
Employment Status by Age in Cleveland
According to the labor force statistics for Cleveland, out of the total population over 16 years of age (6,122), 50.2% or 3,073 individuals are in the labor force, with 2.4% or 74 of them unemployed. The age group with the highest labor force participation rate is 20 to 24 years, with 72.2% or 254 individuals in the labor force. Within the labor force, the 35 to 44 years age range has the highest percentage of unemployed individuals, with 10.1% or 56 of them being unemployed.
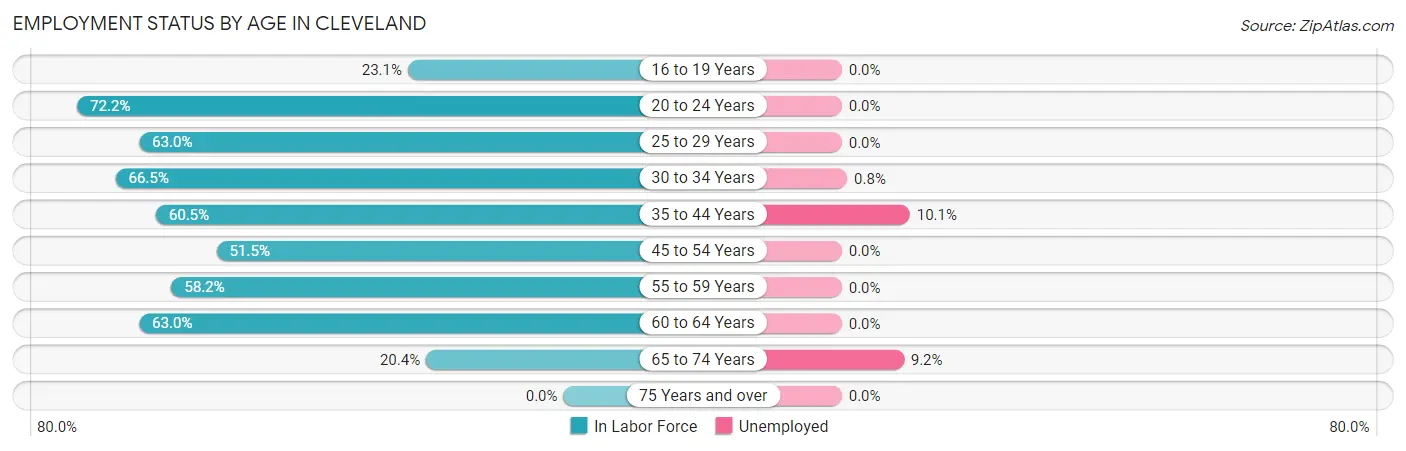
| Age Bracket | In Labor Force | Unemployed |
| 16 to 19 Years | 99 (23.1%) | 0 (0.0%) |
| 20 to 24 Years | 254 (72.2%) | 0 (0.0%) |
| 25 to 29 Years | 273 (63.0%) | 0 (0.0%) |
| 30 to 34 Years | 614 (66.5%) | 5 (0.8%) |
| 35 to 44 Years | 555 (60.5%) | 56 (10.1%) |
| 45 to 54 Years | 376 (51.5%) | 0 (0.0%) |
| 55 to 59 Years | 217 (58.2%) | 0 (0.0%) |
| 60 to 64 Years | 534 (63.0%) | 0 (0.0%) |
| 65 to 74 Years | 152 (20.4%) | 14 (9.2%) |
| 75 Years and over | 0 (0.0%) | 0 (0.0%) |
| Total | 3,073 (50.2%) | 74 (2.4%) |
Employment Status by Educational Attainment in Cleveland
According to labor force statistics for Cleveland, 60.8% of individuals (2,568) out of the total population between 25 and 64 years of age (4,224) are in the labor force, with 2.4% or 62 of them being unemployed. The group with the highest labor force participation rate are those with the educational attainment of bachelor's degree or higher, with 73.5% or 346 individuals in the labor force. Within the labor force, individuals with high school diploma education have the highest percentage of unemployment, with 5.8% or 56 of them being unemployed.
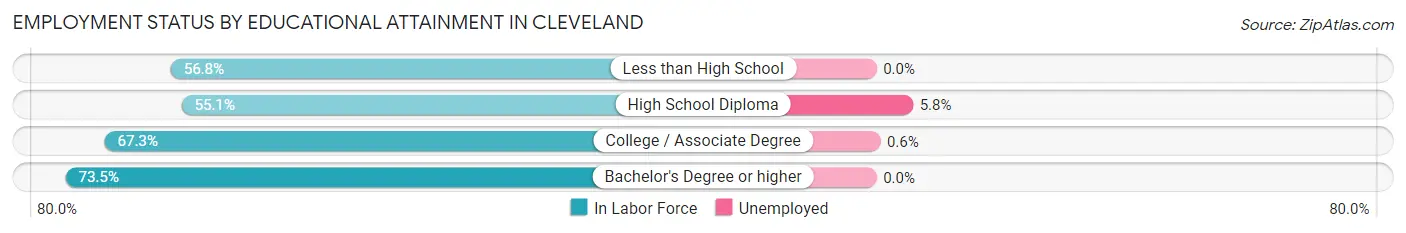
| Educational Attainment | In Labor Force | Unemployed |
| Less than High School | 481 (56.8%) | 0 (0.0%) |
| High School Diploma | 961 (55.1%) | 101 (5.8%) |
| College / Associate Degree | 781 (67.3%) | 7 (0.6%) |
| Bachelor's Degree or higher | 346 (73.5%) | 0 (0.0%) |
| Total | 2,568 (60.8%) | 101 (2.4%) |
Employment Occupations by Sex in Cleveland
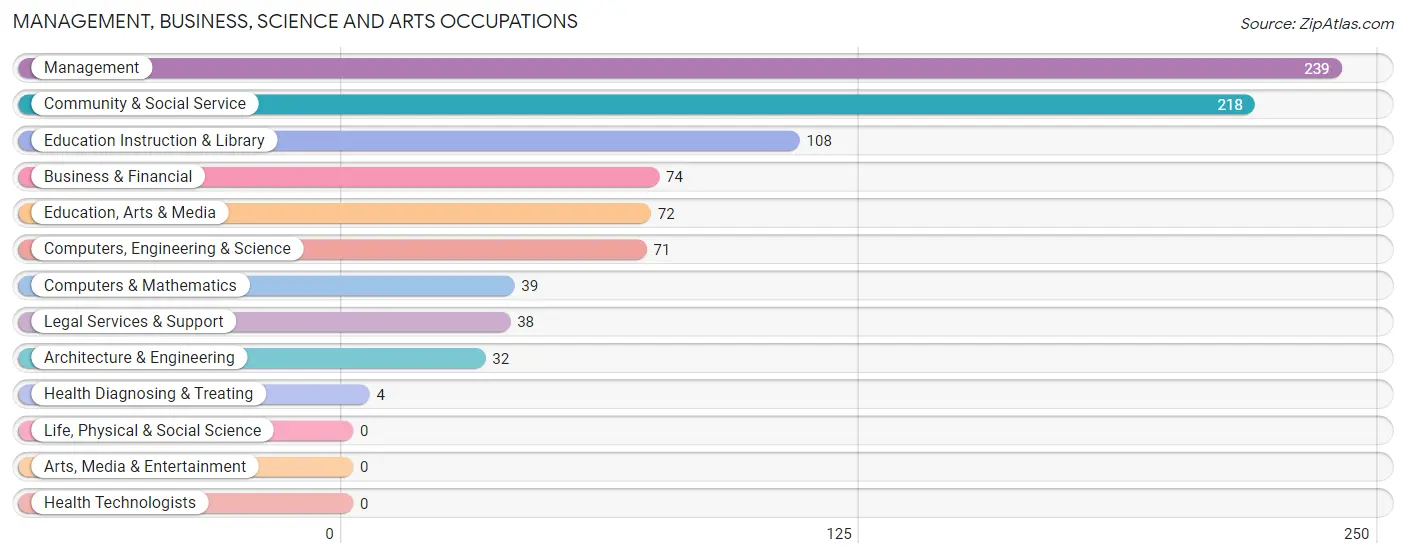
Management, Business, Science and Arts Occupations
The most common Management, Business, Science and Arts occupations in Cleveland are Management (239 | 8.0%), Community & Social Service (218 | 7.3%), Education Instruction & Library (108 | 3.6%), Business & Financial (74 | 2.5%), and Education, Arts & Media (72 | 2.4%).
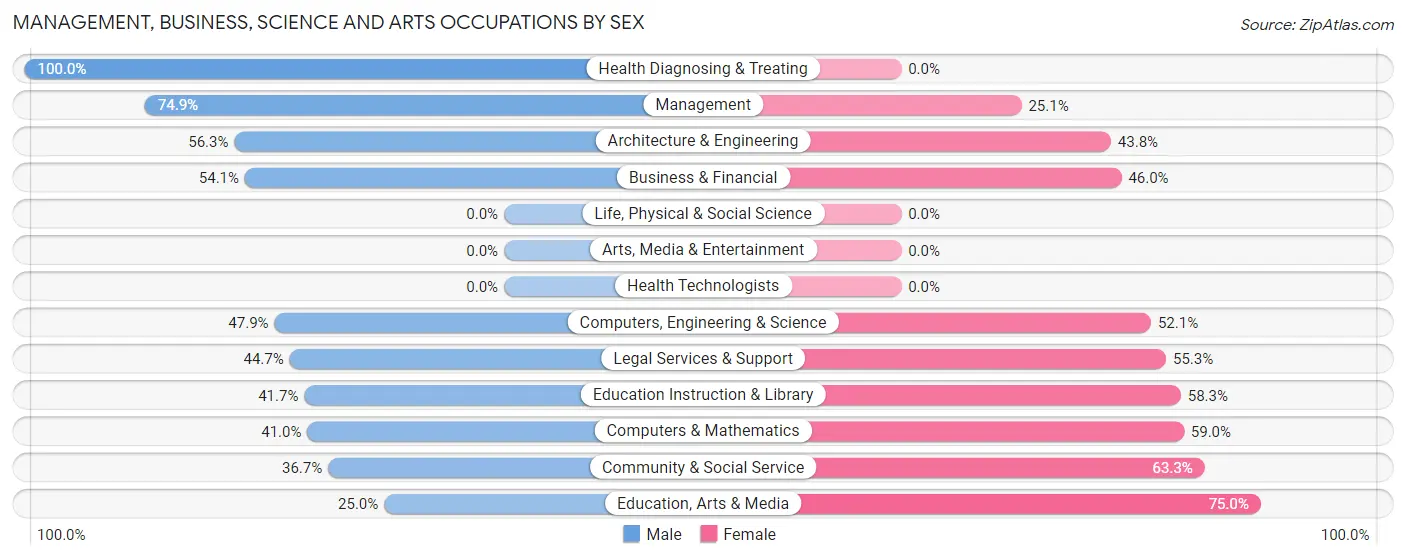
Management, Business, Science and Arts Occupations by Sex
Within the Management, Business, Science and Arts occupations in Cleveland, the most male-oriented occupations are Health Diagnosing & Treating (100.0%), Management (74.9%), and Architecture & Engineering (56.2%), while the most female-oriented occupations are Education, Arts & Media (75.0%), Community & Social Service (63.3%), and Computers & Mathematics (59.0%).
| Occupation | Male | Female |
| Management | 179 (74.9%) | 60 (25.1%) |
| Business & Financial | 40 (54.0%) | 34 (46.0%) |
| Computers, Engineering & Science | 34 (47.9%) | 37 (52.1%) |
| Computers & Mathematics | 16 (41.0%) | 23 (59.0%) |
| Architecture & Engineering | 18 (56.2%) | 14 (43.8%) |
| Life, Physical & Social Science | 0 (0.0%) | 0 (0.0%) |
| Community & Social Service | 80 (36.7%) | 138 (63.3%) |
| Education, Arts & Media | 18 (25.0%) | 54 (75.0%) |
| Legal Services & Support | 17 (44.7%) | 21 (55.3%) |
| Education Instruction & Library | 45 (41.7%) | 63 (58.3%) |
| Arts, Media & Entertainment | 0 (0.0%) | 0 (0.0%) |
| Health Diagnosing & Treating | 4 (100.0%) | 0 (0.0%) |
| Health Technologists | 0 (0.0%) | 0 (0.0%) |
| Total (Category) | 337 (55.6%) | 269 (44.4%) |
| Total (Overall) | 1,696 (56.6%) | 1,303 (43.4%) |
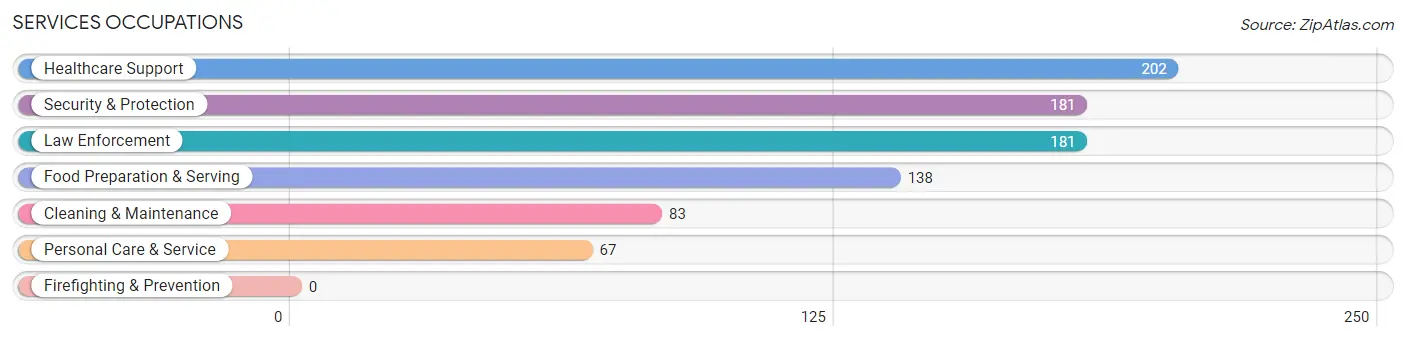
Services Occupations
The most common Services occupations in Cleveland are Healthcare Support (202 | 6.7%), Security & Protection (181 | 6.0%), Law Enforcement (181 | 6.0%), Food Preparation & Serving (138 | 4.6%), and Cleaning & Maintenance (83 | 2.8%).
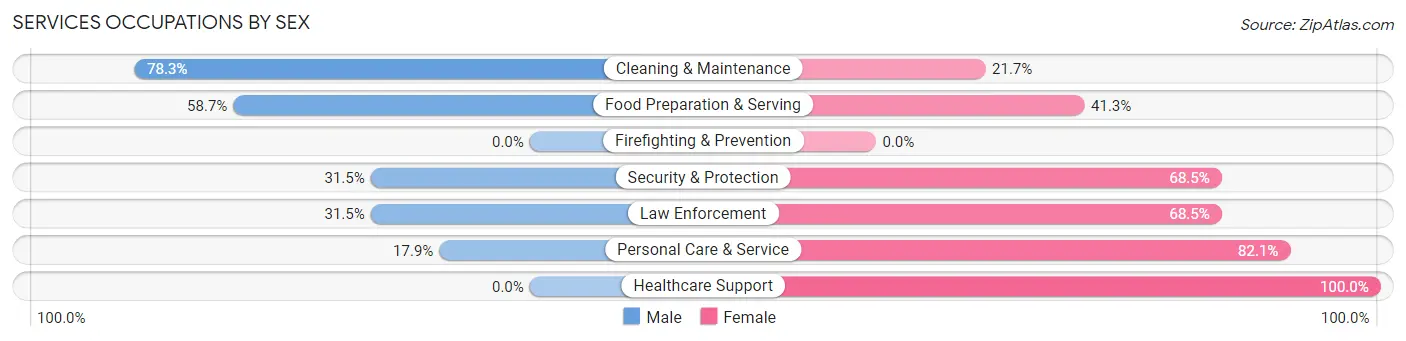
Services Occupations by Sex
Within the Services occupations in Cleveland, the most male-oriented occupations are Cleaning & Maintenance (78.3%), Food Preparation & Serving (58.7%), and Security & Protection (31.5%), while the most female-oriented occupations are Healthcare Support (100.0%), Personal Care & Service (82.1%), and Security & Protection (68.5%).
| Occupation | Male | Female |
| Healthcare Support | 0 (0.0%) | 202 (100.0%) |
| Security & Protection | 57 (31.5%) | 124 (68.5%) |
| Firefighting & Prevention | 0 (0.0%) | 0 (0.0%) |
| Law Enforcement | 57 (31.5%) | 124 (68.5%) |
| Food Preparation & Serving | 81 (58.7%) | 57 (41.3%) |
| Cleaning & Maintenance | 65 (78.3%) | 18 (21.7%) |
| Personal Care & Service | 12 (17.9%) | 55 (82.1%) |
| Total (Category) | 215 (32.0%) | 456 (68.0%) |
| Total (Overall) | 1,696 (56.6%) | 1,303 (43.4%) |
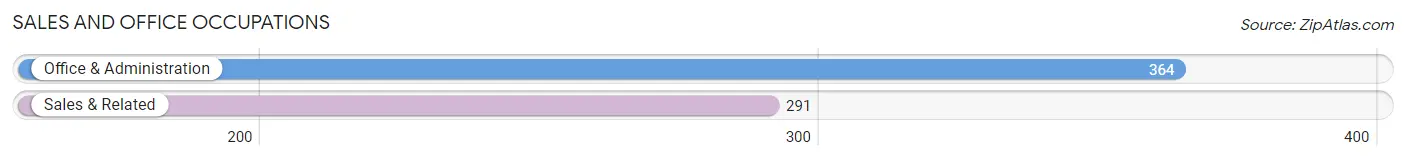
Sales and Office Occupations
The most common Sales and Office occupations in Cleveland are Office & Administration (364 | 12.1%), and Sales & Related (291 | 9.7%).
Sales and Office Occupations by Sex
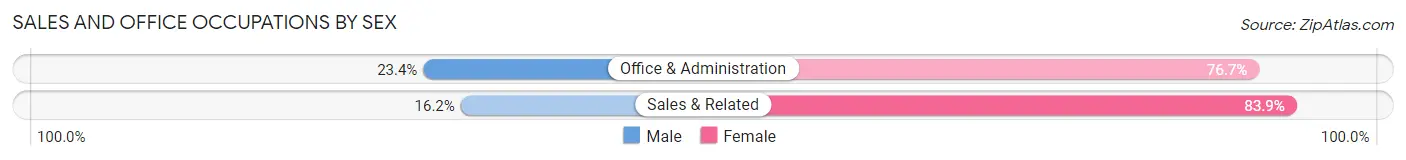
| Occupation | Male | Female |
| Sales & Related | 47 (16.2%) | 244 (83.9%) |
| Office & Administration | 85 (23.4%) | 279 (76.6%) |
| Total (Category) | 132 (20.2%) | 523 (79.8%) |
| Total (Overall) | 1,696 (56.6%) | 1,303 (43.4%) |
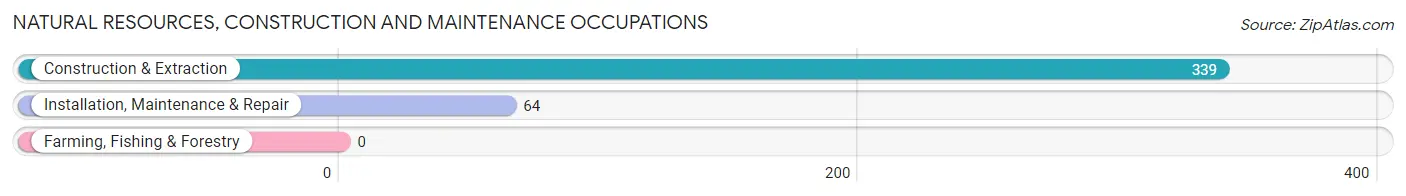
Natural Resources, Construction and Maintenance Occupations
The most common Natural Resources, Construction and Maintenance occupations in Cleveland are Construction & Extraction (339 | 11.3%), and Installation, Maintenance & Repair (64 | 2.1%).
Natural Resources, Construction and Maintenance Occupations by Sex
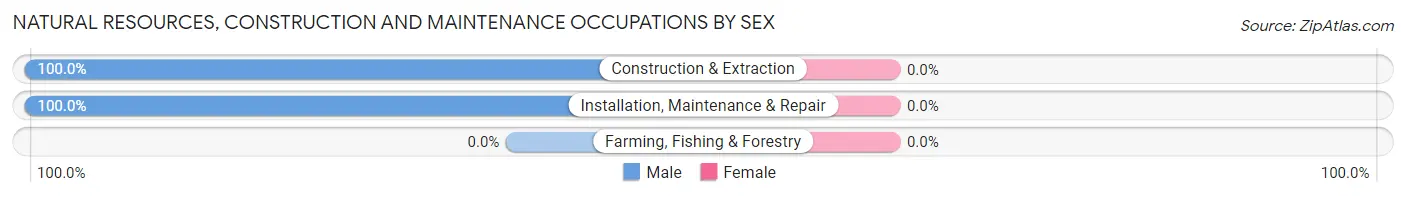
| Occupation | Male | Female |
| Farming, Fishing & Forestry | 0 (0.0%) | 0 (0.0%) |
| Construction & Extraction | 339 (100.0%) | 0 (0.0%) |
| Installation, Maintenance & Repair | 64 (100.0%) | 0 (0.0%) |
| Total (Category) | 403 (100.0%) | 0 (0.0%) |
| Total (Overall) | 1,696 (56.6%) | 1,303 (43.4%) |
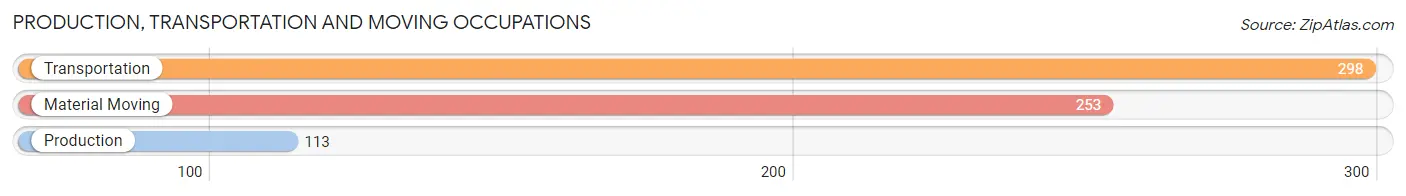
Production, Transportation and Moving Occupations
The most common Production, Transportation and Moving occupations in Cleveland are Transportation (298 | 9.9%), Material Moving (253 | 8.4%), and Production (113 | 3.8%).
Production, Transportation and Moving Occupations by Sex
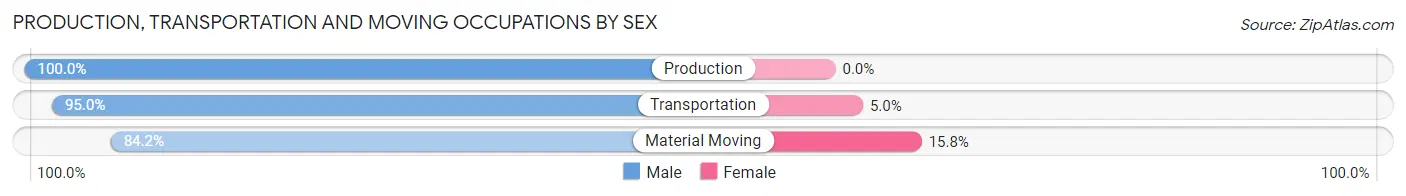
| Occupation | Male | Female |
| Production | 113 (100.0%) | 0 (0.0%) |
| Transportation | 283 (95.0%) | 15 (5.0%) |
| Material Moving | 213 (84.2%) | 40 (15.8%) |
| Total (Category) | 609 (91.7%) | 55 (8.3%) |
| Total (Overall) | 1,696 (56.6%) | 1,303 (43.4%) |
Employment Industries by Sex in Cleveland
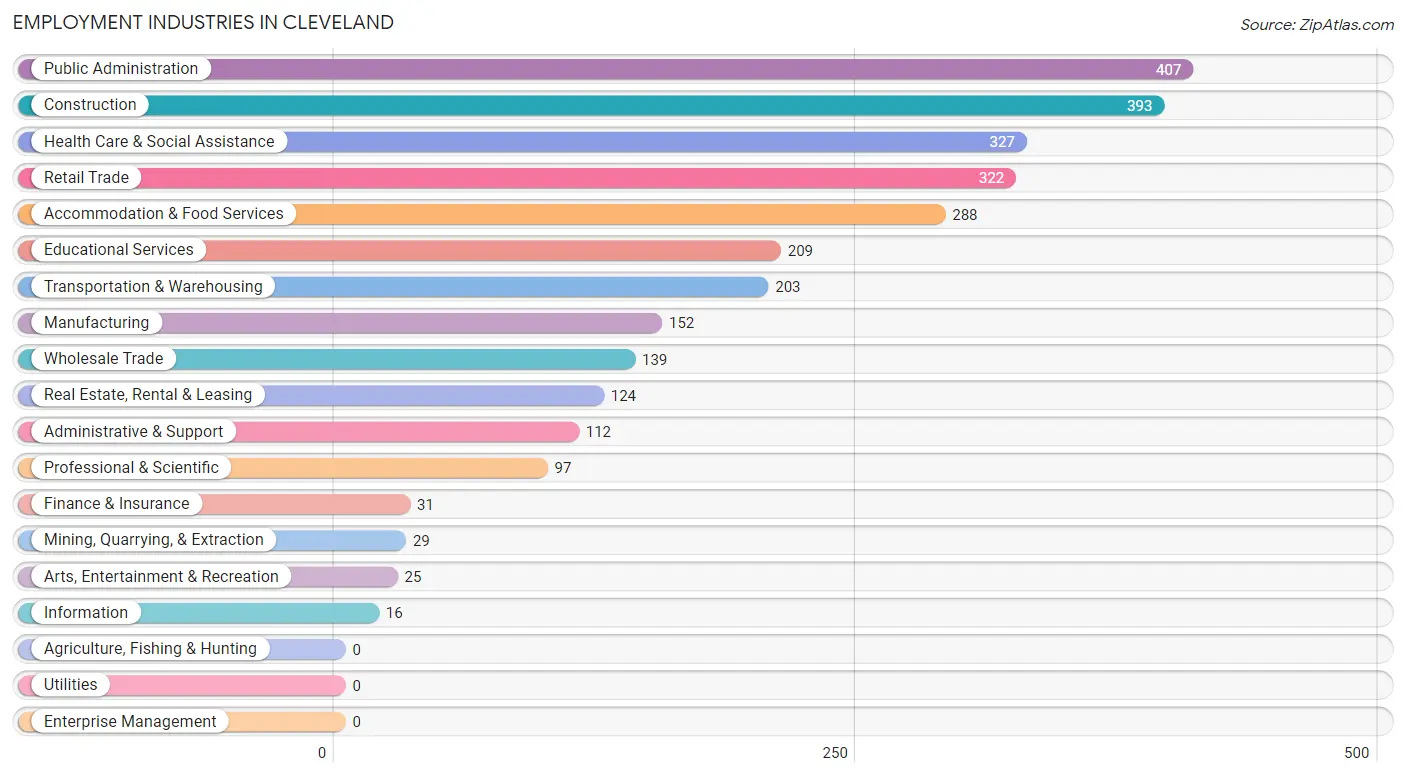
Employment Industries in Cleveland
The major employment industries in Cleveland include Public Administration (407 | 13.6%), Construction (393 | 13.1%), Health Care & Social Assistance (327 | 10.9%), Retail Trade (322 | 10.7%), and Accommodation & Food Services (288 | 9.6%).
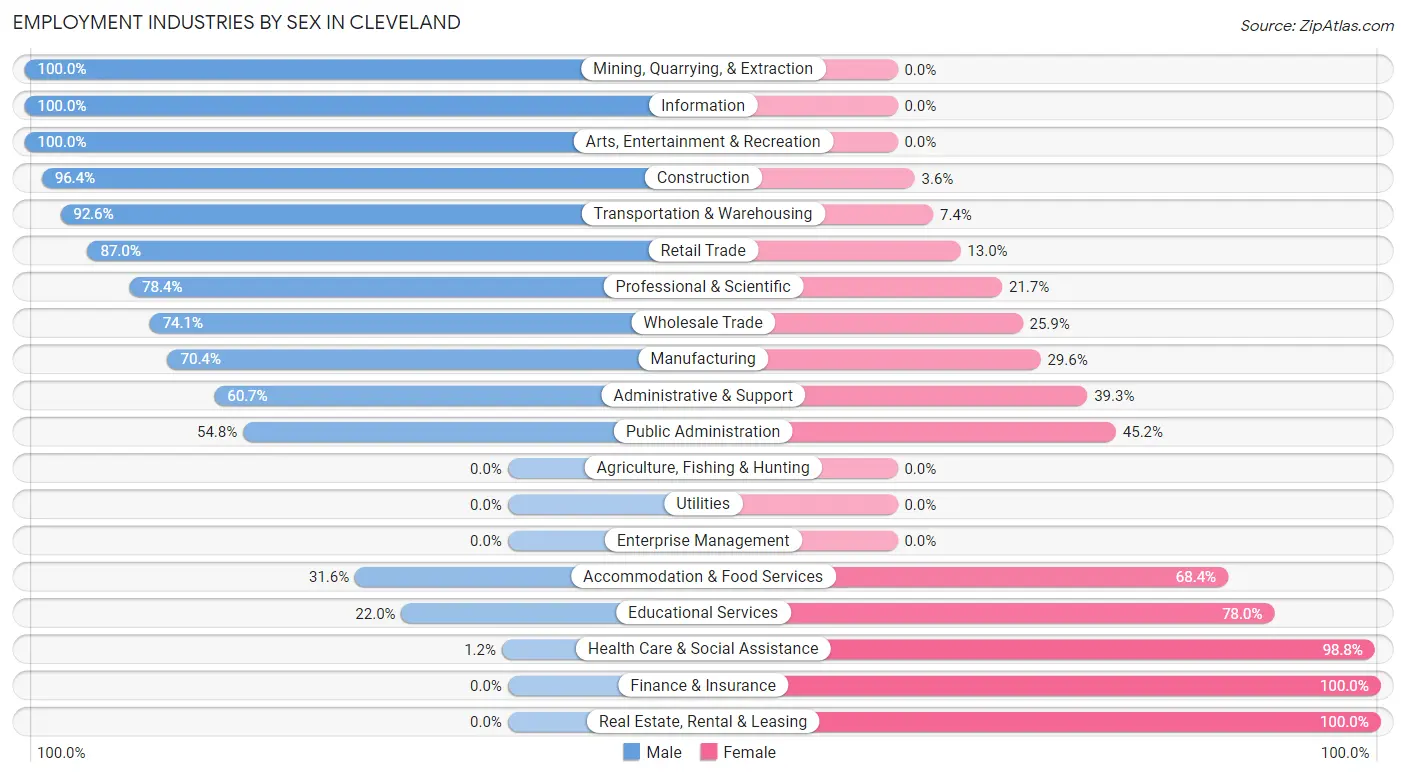
Employment Industries by Sex in Cleveland
The Cleveland industries that see more men than women are Mining, Quarrying, & Extraction (100.0%), Information (100.0%), and Arts, Entertainment & Recreation (100.0%), whereas the industries that tend to have a higher number of women are Finance & Insurance (100.0%), Real Estate, Rental & Leasing (100.0%), and Health Care & Social Assistance (98.8%).
| Industry | Male | Female |
| Agriculture, Fishing & Hunting | 0 (0.0%) | 0 (0.0%) |
| Mining, Quarrying, & Extraction | 29 (100.0%) | 0 (0.0%) |
| Construction | 379 (96.4%) | 14 (3.6%) |
| Manufacturing | 107 (70.4%) | 45 (29.6%) |
| Wholesale Trade | 103 (74.1%) | 36 (25.9%) |
| Retail Trade | 280 (87.0%) | 42 (13.0%) |
| Transportation & Warehousing | 188 (92.6%) | 15 (7.4%) |
| Utilities | 0 (0.0%) | 0 (0.0%) |
| Information | 16 (100.0%) | 0 (0.0%) |
| Finance & Insurance | 0 (0.0%) | 31 (100.0%) |
| Real Estate, Rental & Leasing | 0 (0.0%) | 124 (100.0%) |
| Professional & Scientific | 76 (78.3%) | 21 (21.6%) |
| Enterprise Management | 0 (0.0%) | 0 (0.0%) |
| Administrative & Support | 68 (60.7%) | 44 (39.3%) |
| Educational Services | 46 (22.0%) | 163 (78.0%) |
| Health Care & Social Assistance | 4 (1.2%) | 323 (98.8%) |
| Arts, Entertainment & Recreation | 25 (100.0%) | 0 (0.0%) |
| Accommodation & Food Services | 91 (31.6%) | 197 (68.4%) |
| Public Administration | 223 (54.8%) | 184 (45.2%) |
| Total | 1,696 (56.6%) | 1,303 (43.4%) |
Education in Cleveland
School Enrollment in Cleveland
The most common levels of schooling among the 1,564 students in Cleveland are elementary school (429 | 27.4%), middle school (414 | 26.5%), and high school (320 | 20.5%).
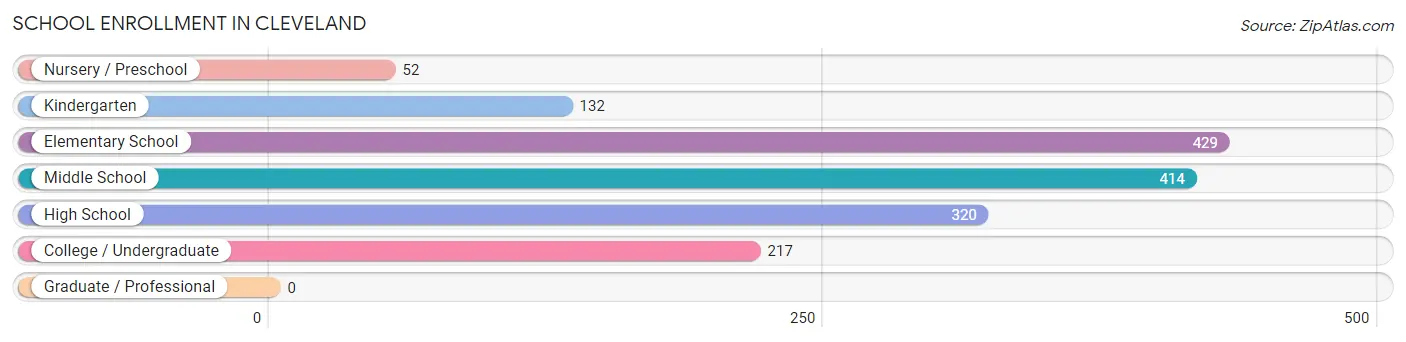
| School Level | # Students | % Students |
| Nursery / Preschool | 52 | 3.3% |
| Kindergarten | 132 | 8.4% |
| Elementary School | 429 | 27.4% |
| Middle School | 414 | 26.5% |
| High School | 320 | 20.5% |
| College / Undergraduate | 217 | 13.9% |
| Graduate / Professional | 0 | 0.0% |
| Total | 1,564 | 100.0% |
School Enrollment by Age by Funding Source in Cleveland
Out of a total of 1,564 students who are enrolled in schools in Cleveland, 177 (11.3%) attend a private institution, while the remaining 1,387 (88.7%) are enrolled in public schools. The age group of 18 to 19 year olds has the highest likelihood of being enrolled in private schools, with 43 (63.2% in the age bracket) enrolled. Conversely, the age group of 3 to 4 year olds has the lowest likelihood of being enrolled in a private school, with 36 (100.0% in the age bracket) attending a public institution.
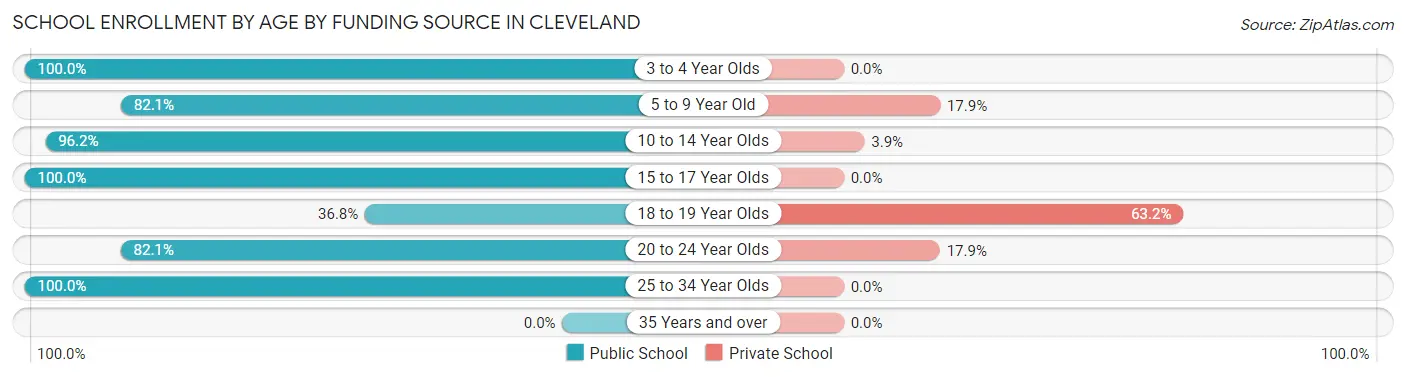
| Age Bracket | Public School | Private School |
| 3 to 4 Year Olds | 36 (100.0%) | 0 (0.0%) |
| 5 to 9 Year Old | 439 (82.1%) | 96 (17.9%) |
| 10 to 14 Year Olds | 500 (96.2%) | 20 (3.8%) |
| 15 to 17 Year Olds | 231 (100.0%) | 0 (0.0%) |
| 18 to 19 Year Olds | 25 (36.8%) | 43 (63.2%) |
| 20 to 24 Year Olds | 78 (82.1%) | 17 (17.9%) |
| 25 to 34 Year Olds | 79 (100.0%) | 0 (0.0%) |
| 35 Years and over | 0 (0.0%) | 0 (0.0%) |
| Total | 1,387 (88.7%) | 177 (11.3%) |
Educational Attainment by Field of Study in Cleveland
Business (267 | 39.7%), liberal arts & history (99 | 14.7%), education (88 | 13.1%), social sciences (53 | 7.9%), and computers & mathematics (33 | 4.9%) are the most common fields of study among 672 individuals in Cleveland who have obtained a bachelor's degree or higher.
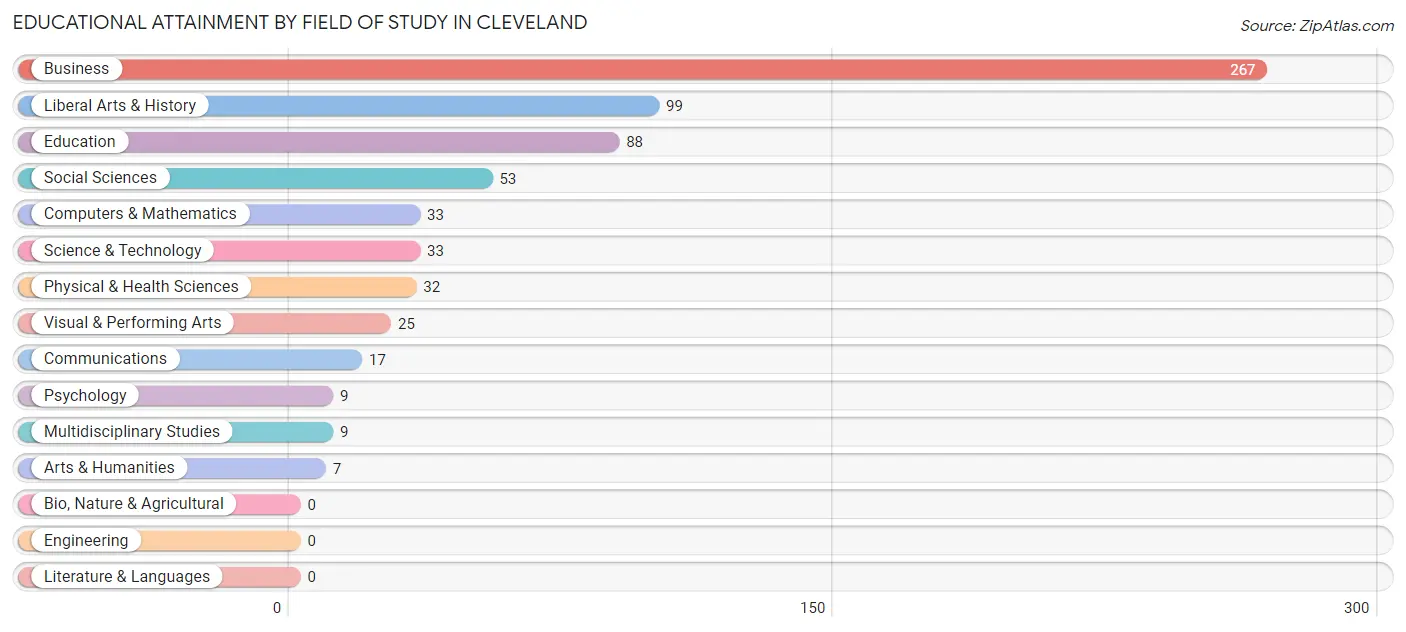
| Field of Study | # Graduates | % Graduates |
| Computers & Mathematics | 33 | 4.9% |
| Bio, Nature & Agricultural | 0 | 0.0% |
| Physical & Health Sciences | 32 | 4.8% |
| Psychology | 9 | 1.3% |
| Social Sciences | 53 | 7.9% |
| Engineering | 0 | 0.0% |
| Multidisciplinary Studies | 9 | 1.3% |
| Science & Technology | 33 | 4.9% |
| Business | 267 | 39.7% |
| Education | 88 | 13.1% |
| Literature & Languages | 0 | 0.0% |
| Liberal Arts & History | 99 | 14.7% |
| Visual & Performing Arts | 25 | 3.7% |
| Communications | 17 | 2.5% |
| Arts & Humanities | 7 | 1.0% |
| Total | 672 | 100.0% |
Transportation & Commute in Cleveland
Vehicle Availability by Sex in Cleveland
The most prevalent vehicle ownership categories in Cleveland are males with 2 vehicles (583, accounting for 35.2%) and females with 2 vehicles (401, making up 44.7%).
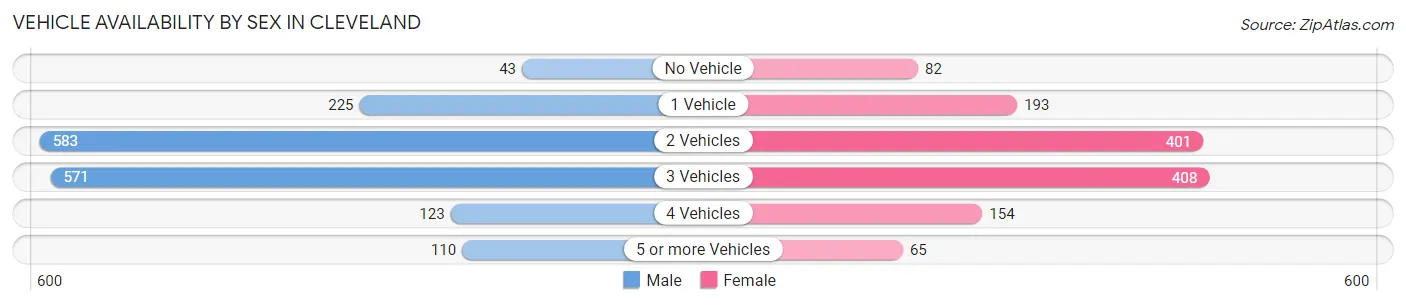
| Vehicles Available | Male | Female |
| No Vehicle | 43 (2.6%) | 82 (6.3%) |
| 1 Vehicle | 225 (13.6%) | 193 (14.8%) |
| 2 Vehicles | 583 (35.2%) | 401 (30.8%) |
| 3 Vehicles | 571 (34.5%) | 408 (31.3%) |
| 4 Vehicles | 123 (7.4%) | 154 (11.8%) |
| 5 or more Vehicles | 110 (6.7%) | 65 (5.0%) |
| Total | 1,655 (100.0%) | 1,303 (100.0%) |
Commute Time in Cleveland
The most frequently occuring commute durations in Cleveland are 5 to 9 minutes (515 commuters, 19.2%), 30 to 34 minutes (422 commuters, 15.8%), and 60 to 89 minutes (387 commuters, 14.5%).
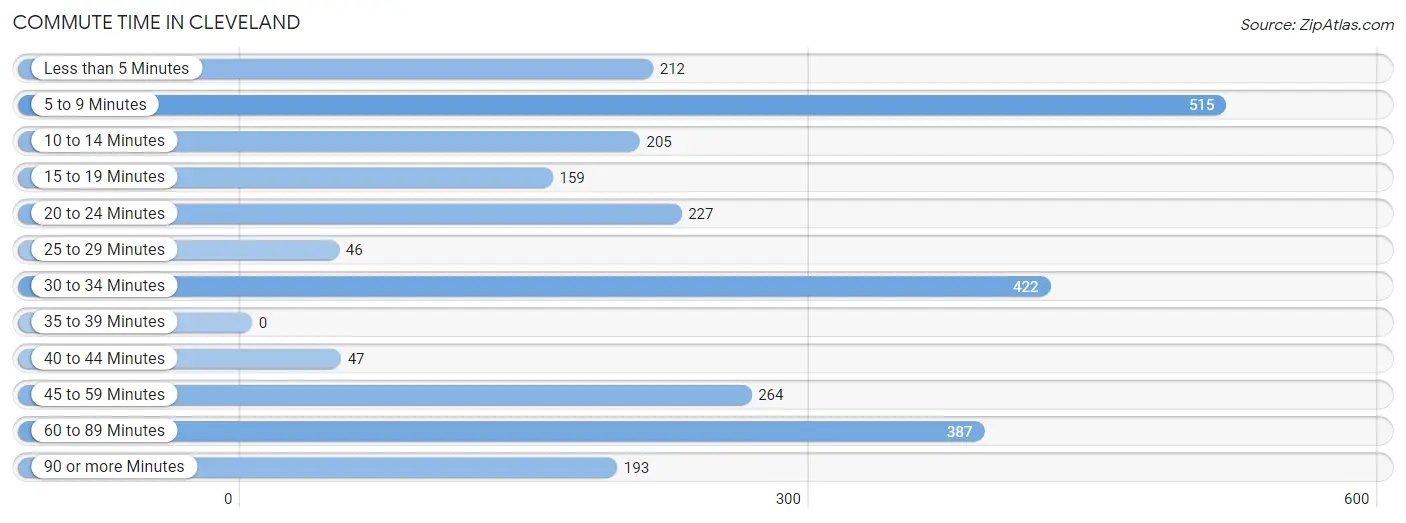
| Commute Time | # Commuters | % Commuters |
| Less than 5 Minutes | 212 | 7.9% |
| 5 to 9 Minutes | 515 | 19.2% |
| 10 to 14 Minutes | 205 | 7.7% |
| 15 to 19 Minutes | 159 | 5.9% |
| 20 to 24 Minutes | 227 | 8.5% |
| 25 to 29 Minutes | 46 | 1.7% |
| 30 to 34 Minutes | 422 | 15.8% |
| 35 to 39 Minutes | 0 | 0.0% |
| 40 to 44 Minutes | 47 | 1.8% |
| 45 to 59 Minutes | 264 | 9.9% |
| 60 to 89 Minutes | 387 | 14.5% |
| 90 or more Minutes | 193 | 7.2% |
Commute Time by Sex in Cleveland
The most common commute times in Cleveland are 60 to 89 minutes (349 commuters, 21.7%) for males and 5 to 9 minutes (255 commuters, 23.8%) for females.
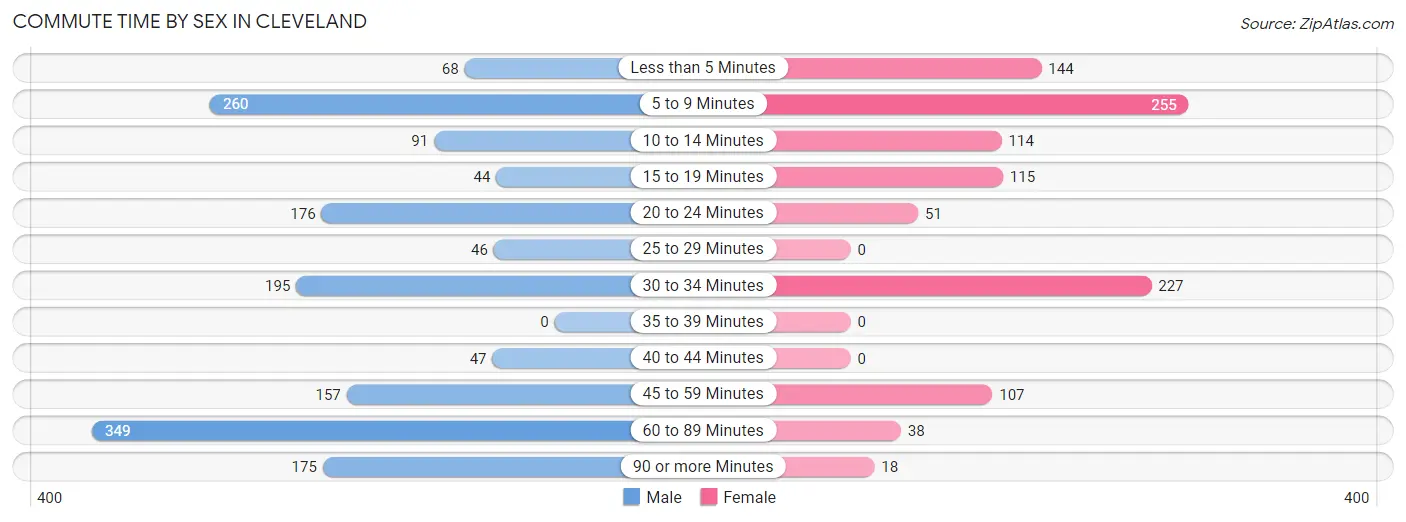
| Commute Time | Male | Female |
| Less than 5 Minutes | 68 (4.2%) | 144 (13.5%) |
| 5 to 9 Minutes | 260 (16.2%) | 255 (23.8%) |
| 10 to 14 Minutes | 91 (5.7%) | 114 (10.7%) |
| 15 to 19 Minutes | 44 (2.7%) | 115 (10.8%) |
| 20 to 24 Minutes | 176 (11.0%) | 51 (4.8%) |
| 25 to 29 Minutes | 46 (2.9%) | 0 (0.0%) |
| 30 to 34 Minutes | 195 (12.1%) | 227 (21.2%) |
| 35 to 39 Minutes | 0 (0.0%) | 0 (0.0%) |
| 40 to 44 Minutes | 47 (2.9%) | 0 (0.0%) |
| 45 to 59 Minutes | 157 (9.8%) | 107 (10.0%) |
| 60 to 89 Minutes | 349 (21.7%) | 38 (3.5%) |
| 90 or more Minutes | 175 (10.9%) | 18 (1.7%) |
Time of Departure to Work by Sex in Cleveland
The most frequent times of departure to work in Cleveland are 6:00 AM to 6:29 AM (431, 26.8%) for males and 7:00 AM to 7:29 AM (357, 33.4%) for females.
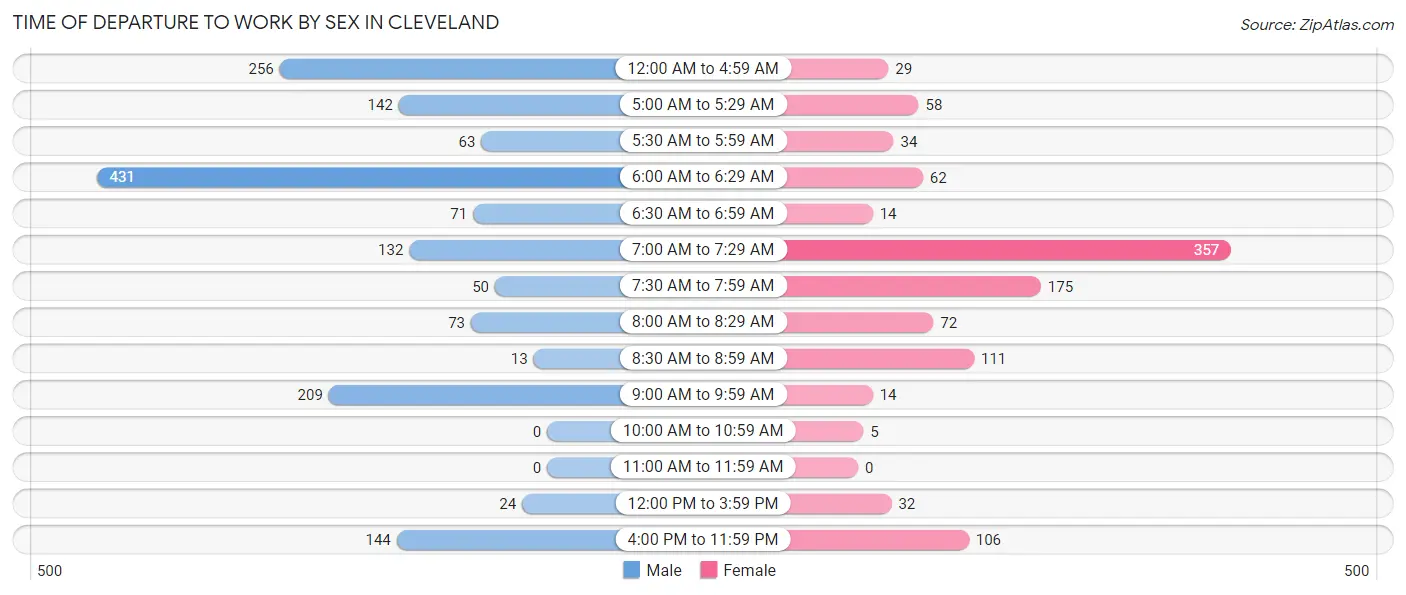
| Time of Departure | Male | Female |
| 12:00 AM to 4:59 AM | 256 (15.9%) | 29 (2.7%) |
| 5:00 AM to 5:29 AM | 142 (8.8%) | 58 (5.4%) |
| 5:30 AM to 5:59 AM | 63 (3.9%) | 34 (3.2%) |
| 6:00 AM to 6:29 AM | 431 (26.8%) | 62 (5.8%) |
| 6:30 AM to 6:59 AM | 71 (4.4%) | 14 (1.3%) |
| 7:00 AM to 7:29 AM | 132 (8.2%) | 357 (33.4%) |
| 7:30 AM to 7:59 AM | 50 (3.1%) | 175 (16.4%) |
| 8:00 AM to 8:29 AM | 73 (4.5%) | 72 (6.7%) |
| 8:30 AM to 8:59 AM | 13 (0.8%) | 111 (10.4%) |
| 9:00 AM to 9:59 AM | 209 (13.0%) | 14 (1.3%) |
| 10:00 AM to 10:59 AM | 0 (0.0%) | 5 (0.5%) |
| 11:00 AM to 11:59 AM | 0 (0.0%) | 0 (0.0%) |
| 12:00 PM to 3:59 PM | 24 (1.5%) | 32 (3.0%) |
| 4:00 PM to 11:59 PM | 144 (9.0%) | 106 (9.9%) |
| Total | 1,608 (100.0%) | 1,069 (100.0%) |
Housing Occupancy in Cleveland
Occupancy by Ownership in Cleveland
Of the total 2,653 dwellings in Cleveland, owner-occupied units account for 1,542 (58.1%), while renter-occupied units make up 1,111 (41.9%).
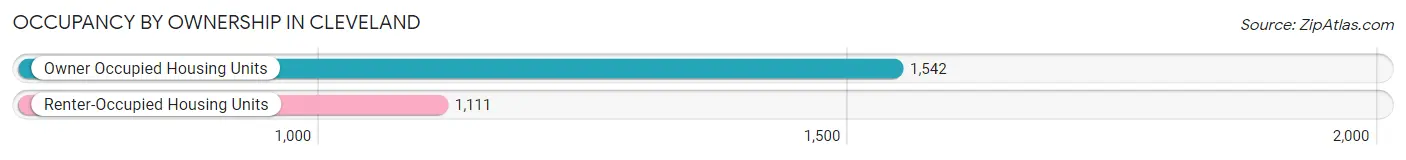
| Occupancy | # Housing Units | % Housing Units |
| Owner Occupied Housing Units | 1,542 | 58.1% |
| Renter-Occupied Housing Units | 1,111 | 41.9% |
| Total Occupied Housing Units | 2,653 | 100.0% |
Occupancy by Household Size in Cleveland
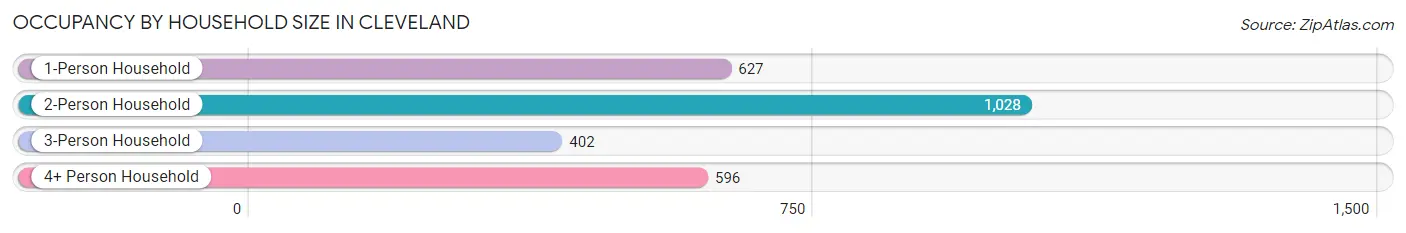
| Household Size | # Housing Units | % Housing Units |
| 1-Person Household | 627 | 23.6% |
| 2-Person Household | 1,028 | 38.8% |
| 3-Person Household | 402 | 15.1% |
| 4+ Person Household | 596 | 22.5% |
| Total Housing Units | 2,653 | 100.0% |
Occupancy by Ownership by Household Size in Cleveland
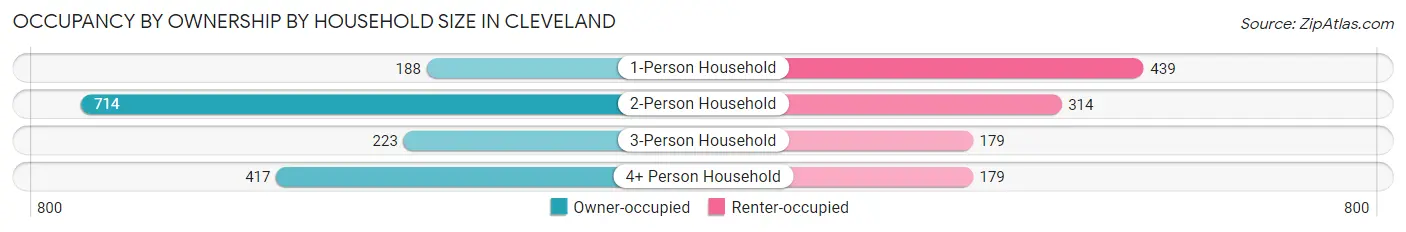
| Household Size | Owner-occupied | Renter-occupied |
| 1-Person Household | 188 (30.0%) | 439 (70.0%) |
| 2-Person Household | 714 (69.5%) | 314 (30.5%) |
| 3-Person Household | 223 (55.5%) | 179 (44.5%) |
| 4+ Person Household | 417 (70.0%) | 179 (30.0%) |
| Total Housing Units | 1,542 (58.1%) | 1,111 (41.9%) |
Occupancy by Educational Attainment in Cleveland
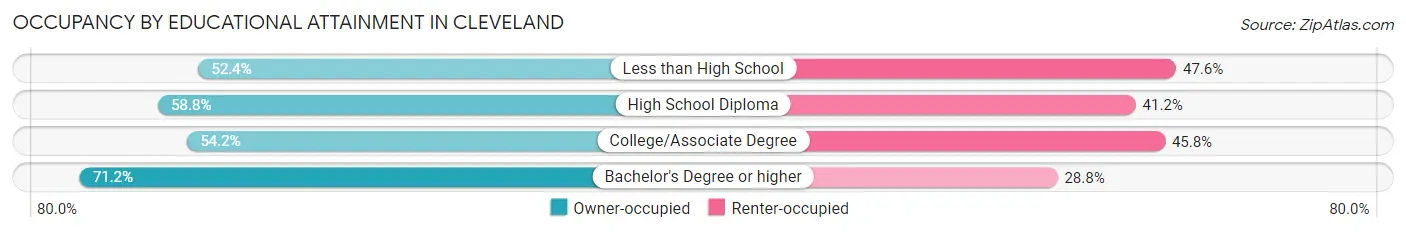
| Household Size | Owner-occupied | Renter-occupied |
| Less than High School | 205 (52.4%) | 186 (47.6%) |
| High School Diploma | 589 (58.8%) | 412 (41.2%) |
| College/Associate Degree | 478 (54.2%) | 404 (45.8%) |
| Bachelor's Degree or higher | 270 (71.2%) | 109 (28.8%) |
Occupancy by Age of Householder in Cleveland
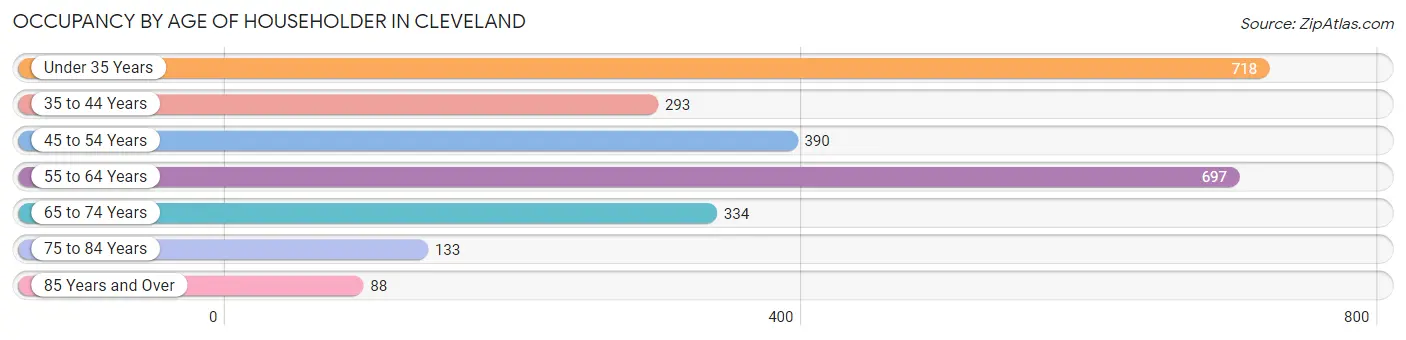
| Age Bracket | # Households | % Households |
| Under 35 Years | 718 | 27.1% |
| 35 to 44 Years | 293 | 11.0% |
| 45 to 54 Years | 390 | 14.7% |
| 55 to 64 Years | 697 | 26.3% |
| 65 to 74 Years | 334 | 12.6% |
| 75 to 84 Years | 133 | 5.0% |
| 85 Years and Over | 88 | 3.3% |
| Total | 2,653 | 100.0% |
Housing Finances in Cleveland
Median Income by Occupancy in Cleveland
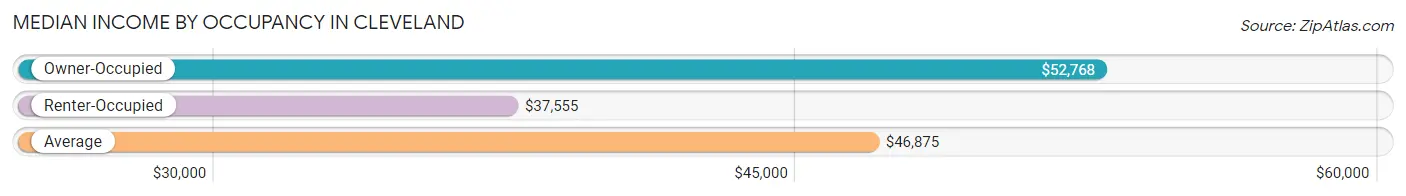
| Occupancy Type | # Households | Median Income |
| Owner-Occupied | 1,542 (58.1%) | $52,768 |
| Renter-Occupied | 1,111 (41.9%) | $37,555 |
| Average | 2,653 (100.0%) | $46,875 |
Occupancy by Householder Income Bracket in Cleveland
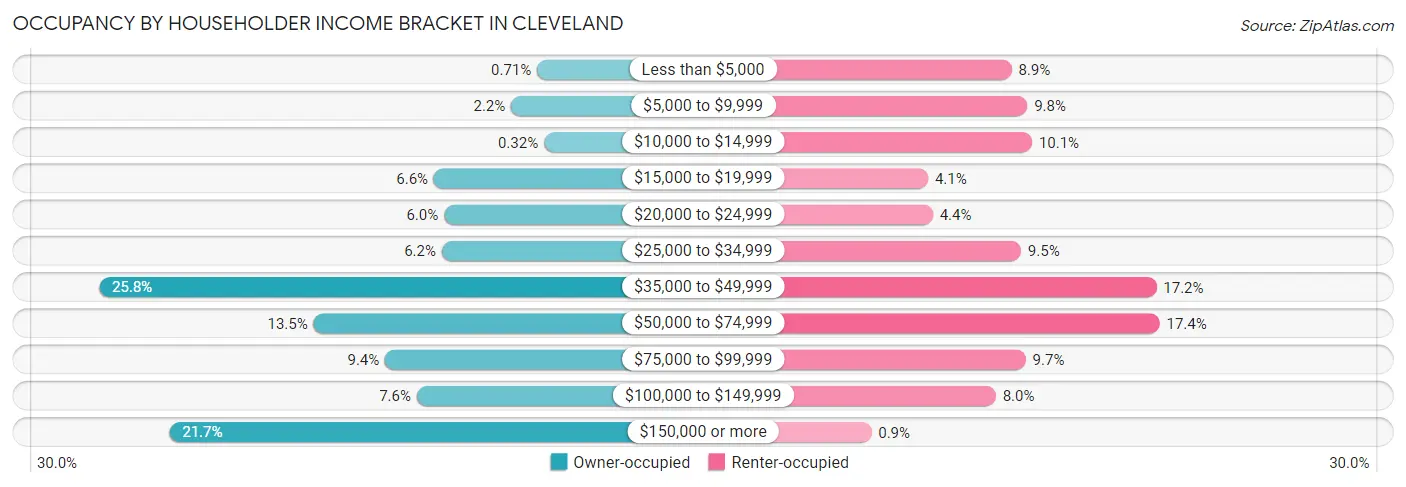
| Income Bracket | Owner-occupied | Renter-occupied |
| Less than $5,000 | 11 (0.7%) | 99 (8.9%) |
| $5,000 to $9,999 | 34 (2.2%) | 109 (9.8%) |
| $10,000 to $14,999 | 5 (0.3%) | 112 (10.1%) |
| $15,000 to $19,999 | 102 (6.6%) | 46 (4.1%) |
| $20,000 to $24,999 | 93 (6.0%) | 49 (4.4%) |
| $25,000 to $34,999 | 95 (6.2%) | 105 (9.5%) |
| $35,000 to $49,999 | 397 (25.8%) | 191 (17.2%) |
| $50,000 to $74,999 | 208 (13.5%) | 193 (17.4%) |
| $75,000 to $99,999 | 145 (9.4%) | 108 (9.7%) |
| $100,000 to $149,999 | 117 (7.6%) | 89 (8.0%) |
| $150,000 or more | 335 (21.7%) | 10 (0.9%) |
| Total | 1,542 (100.0%) | 1,111 (100.0%) |
Monthly Housing Cost Tiers in Cleveland
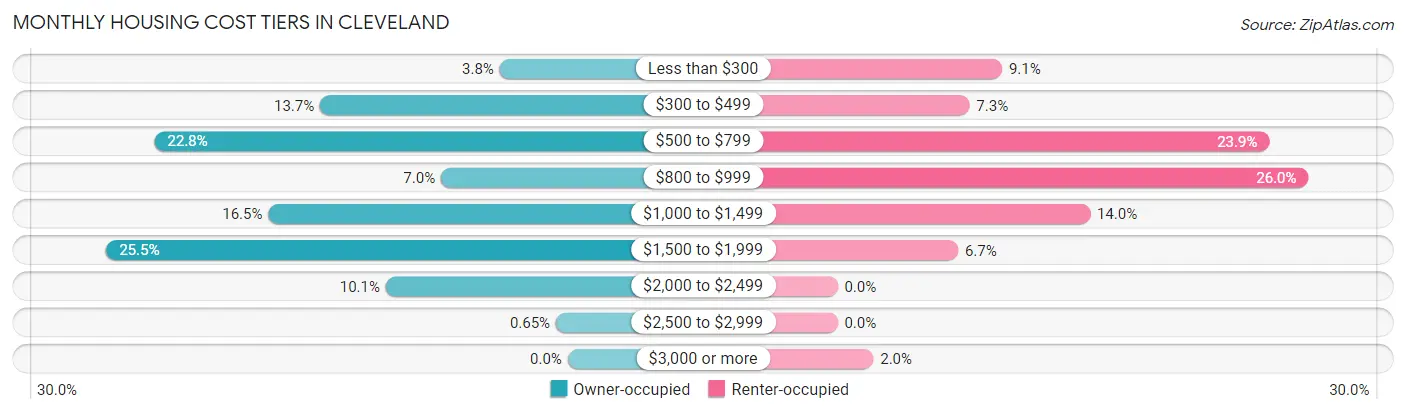
| Monthly Cost | Owner-occupied | Renter-occupied |
| Less than $300 | 58 (3.8%) | 101 (9.1%) |
| $300 to $499 | 211 (13.7%) | 81 (7.3%) |
| $500 to $799 | 352 (22.8%) | 265 (23.8%) |
| $800 to $999 | 108 (7.0%) | 289 (26.0%) |
| $1,000 to $1,499 | 255 (16.5%) | 155 (14.0%) |
| $1,500 to $1,999 | 393 (25.5%) | 74 (6.7%) |
| $2,000 to $2,499 | 155 (10.1%) | 0 (0.0%) |
| $2,500 to $2,999 | 10 (0.6%) | 0 (0.0%) |
| $3,000 or more | 0 (0.0%) | 22 (2.0%) |
| Total | 1,542 (100.0%) | 1,111 (100.0%) |
Physical Housing Characteristics in Cleveland
Housing Structures in Cleveland
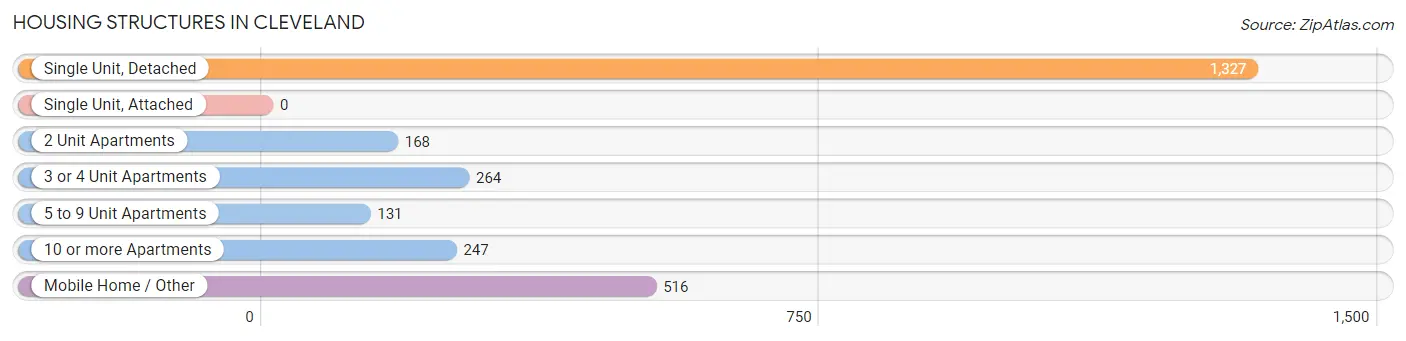
| Structure Type | # Housing Units | % Housing Units |
| Single Unit, Detached | 1,327 | 50.0% |
| Single Unit, Attached | 0 | 0.0% |
| 2 Unit Apartments | 168 | 6.3% |
| 3 or 4 Unit Apartments | 264 | 10.0% |
| 5 to 9 Unit Apartments | 131 | 4.9% |
| 10 or more Apartments | 247 | 9.3% |
| Mobile Home / Other | 516 | 19.5% |
| Total | 2,653 | 100.0% |
Housing Structures by Occupancy in Cleveland
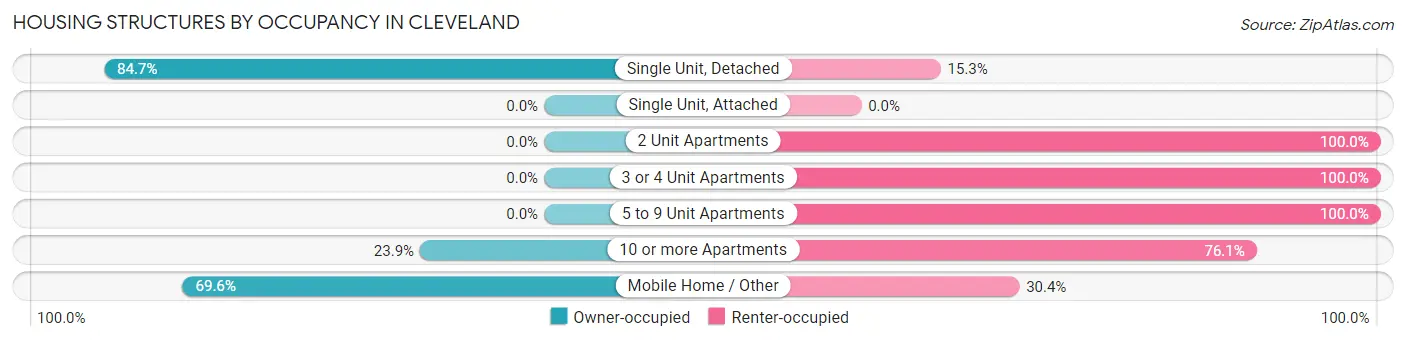
| Structure Type | Owner-occupied | Renter-occupied |
| Single Unit, Detached | 1,124 (84.7%) | 203 (15.3%) |
| Single Unit, Attached | 0 (0.0%) | 0 (0.0%) |
| 2 Unit Apartments | 0 (0.0%) | 168 (100.0%) |
| 3 or 4 Unit Apartments | 0 (0.0%) | 264 (100.0%) |
| 5 to 9 Unit Apartments | 0 (0.0%) | 131 (100.0%) |
| 10 or more Apartments | 59 (23.9%) | 188 (76.1%) |
| Mobile Home / Other | 359 (69.6%) | 157 (30.4%) |
| Total | 1,542 (58.1%) | 1,111 (41.9%) |
Housing Structures by Number of Rooms in Cleveland
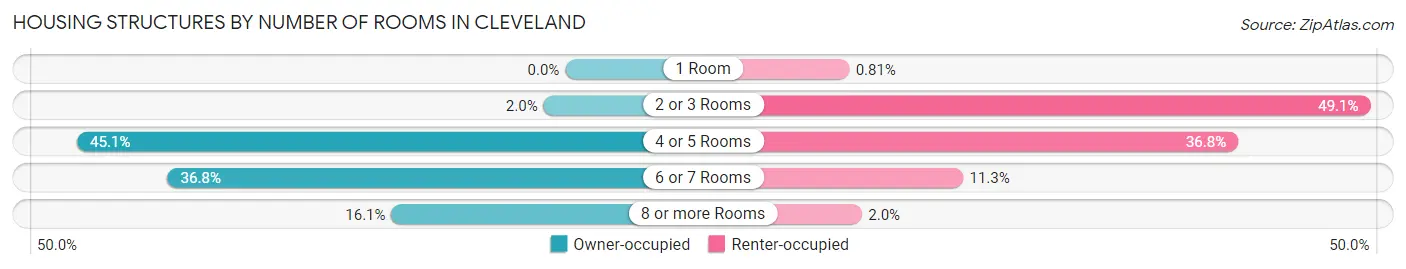
| Number of Rooms | Owner-occupied | Renter-occupied |
| 1 Room | 0 (0.0%) | 9 (0.8%) |
| 2 or 3 Rooms | 31 (2.0%) | 545 (49.0%) |
| 4 or 5 Rooms | 696 (45.1%) | 409 (36.8%) |
| 6 or 7 Rooms | 567 (36.8%) | 126 (11.3%) |
| 8 or more Rooms | 248 (16.1%) | 22 (2.0%) |
| Total | 1,542 (100.0%) | 1,111 (100.0%) |
Housing Structure by Heating Type in Cleveland
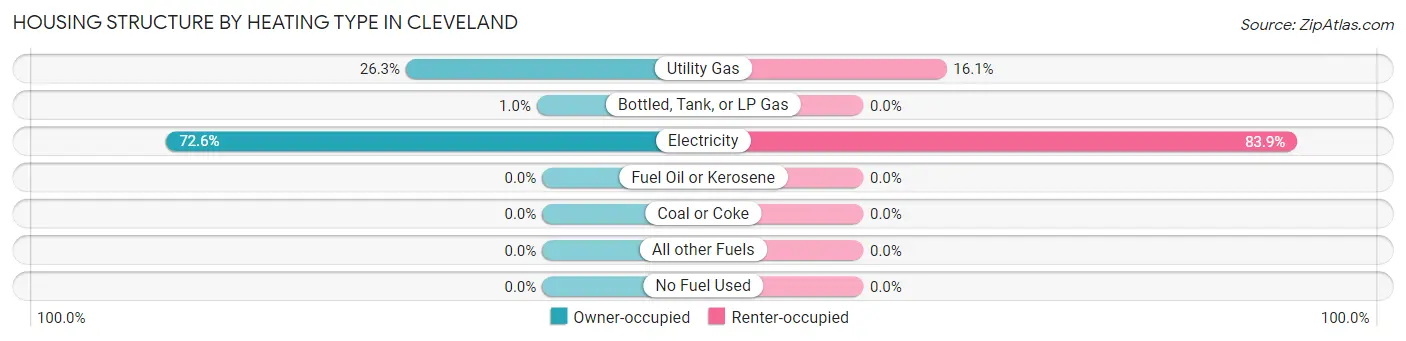
| Heating Type | Owner-occupied | Renter-occupied |
| Utility Gas | 406 (26.3%) | 179 (16.1%) |
| Bottled, Tank, or LP Gas | 16 (1.0%) | 0 (0.0%) |
| Electricity | 1,120 (72.6%) | 932 (83.9%) |
| Fuel Oil or Kerosene | 0 (0.0%) | 0 (0.0%) |
| Coal or Coke | 0 (0.0%) | 0 (0.0%) |
| All other Fuels | 0 (0.0%) | 0 (0.0%) |
| No Fuel Used | 0 (0.0%) | 0 (0.0%) |
| Total | 1,542 (100.0%) | 1,111 (100.0%) |
Household Vehicle Usage in Cleveland
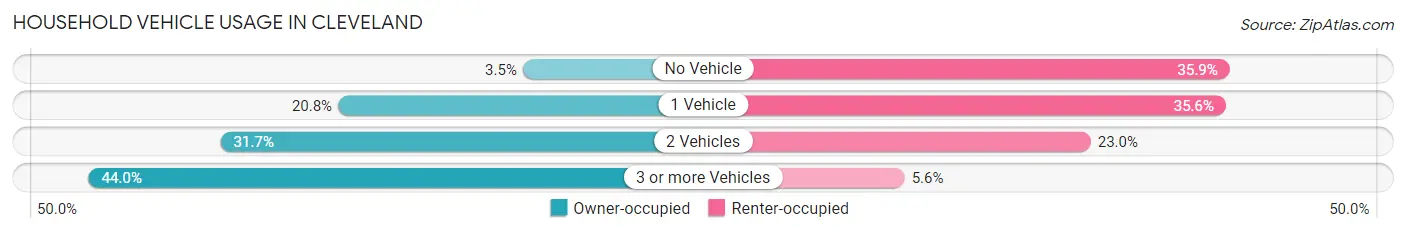
| Vehicles per Household | Owner-occupied | Renter-occupied |
| No Vehicle | 54 (3.5%) | 399 (35.9%) |
| 1 Vehicle | 320 (20.7%) | 395 (35.5%) |
| 2 Vehicles | 489 (31.7%) | 255 (23.0%) |
| 3 or more Vehicles | 679 (44.0%) | 62 (5.6%) |
| Total | 1,542 (100.0%) | 1,111 (100.0%) |
Real Estate & Mortgages in Cleveland
Real Estate and Mortgage Overview in Cleveland
| Characteristic | Without Mortgage | With Mortgage |
| Housing Units | 750 | 792 |
| Median Property Value | $122,400 | $156,600 |
| Median Household Income | $46,795 | $299 |
| Monthly Housing Costs | $545 | $0 |
| Real Estate Taxes | $1,975 | $122 |
Property Value by Mortgage Status in Cleveland
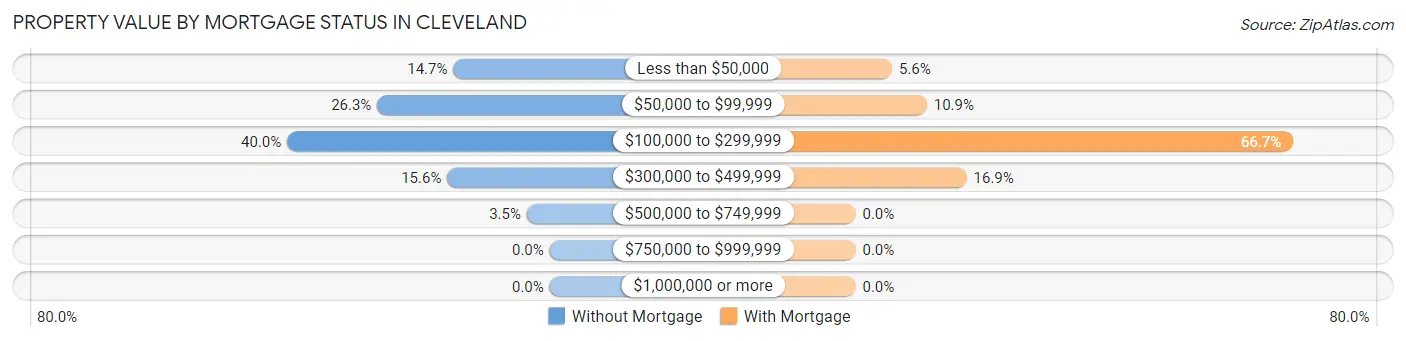
| Property Value | Without Mortgage | With Mortgage |
| Less than $50,000 | 110 (14.7%) | 44 (5.6%) |
| $50,000 to $99,999 | 197 (26.3%) | 86 (10.9%) |
| $100,000 to $299,999 | 300 (40.0%) | 528 (66.7%) |
| $300,000 to $499,999 | 117 (15.6%) | 134 (16.9%) |
| $500,000 to $749,999 | 26 (3.5%) | 0 (0.0%) |
| $750,000 to $999,999 | 0 (0.0%) | 0 (0.0%) |
| $1,000,000 or more | 0 (0.0%) | 0 (0.0%) |
| Total | 750 (100.0%) | 792 (100.0%) |
Household Income by Mortgage Status in Cleveland
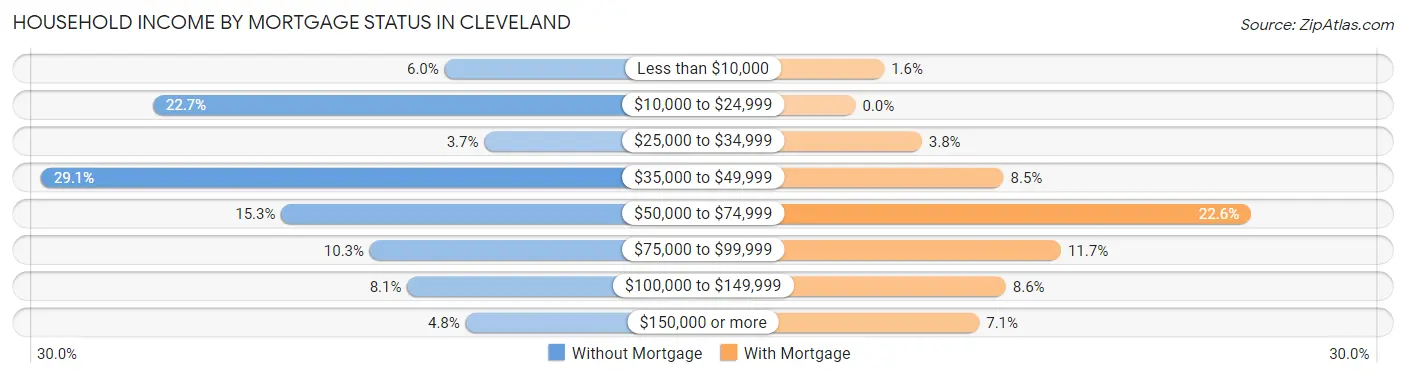
| Household Income | Without Mortgage | With Mortgage |
| Less than $10,000 | 45 (6.0%) | 13 (1.6%) |
| $10,000 to $24,999 | 170 (22.7%) | 0 (0.0%) |
| $25,000 to $34,999 | 28 (3.7%) | 30 (3.8%) |
| $35,000 to $49,999 | 218 (29.1%) | 67 (8.5%) |
| $50,000 to $74,999 | 115 (15.3%) | 179 (22.6%) |
| $75,000 to $99,999 | 77 (10.3%) | 93 (11.7%) |
| $100,000 to $149,999 | 61 (8.1%) | 68 (8.6%) |
| $150,000 or more | 36 (4.8%) | 56 (7.1%) |
| Total | 750 (100.0%) | 792 (100.0%) |
Property Value to Household Income Ratio in Cleveland
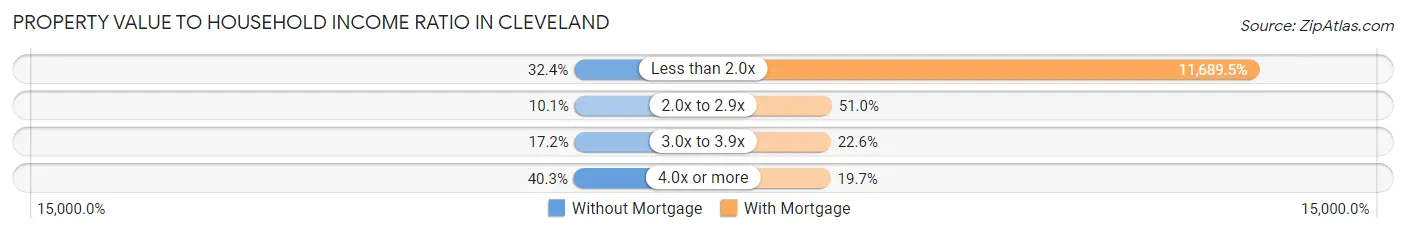
| Value-to-Income Ratio | Without Mortgage | With Mortgage |
| Less than 2.0x | 243 (32.4%) | 92,581 (11,689.5%) |
| 2.0x to 2.9x | 76 (10.1%) | 404 (51.0%) |
| 3.0x to 3.9x | 129 (17.2%) | 179 (22.6%) |
| 4.0x or more | 302 (40.3%) | 156 (19.7%) |
| Total | 750 (100.0%) | 792 (100.0%) |
Real Estate Taxes by Mortgage Status in Cleveland
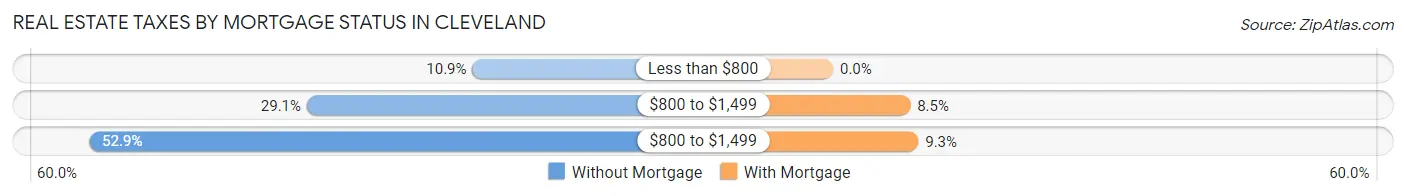
| Property Taxes | Without Mortgage | With Mortgage |
| Less than $800 | 82 (10.9%) | 0 (0.0%) |
| $800 to $1,499 | 218 (29.1%) | 67 (8.5%) |
| $800 to $1,499 | 397 (52.9%) | 74 (9.3%) |
| Total | 750 (100.0%) | 792 (100.0%) |
Health & Disability in Cleveland
Health Insurance Coverage by Age in Cleveland
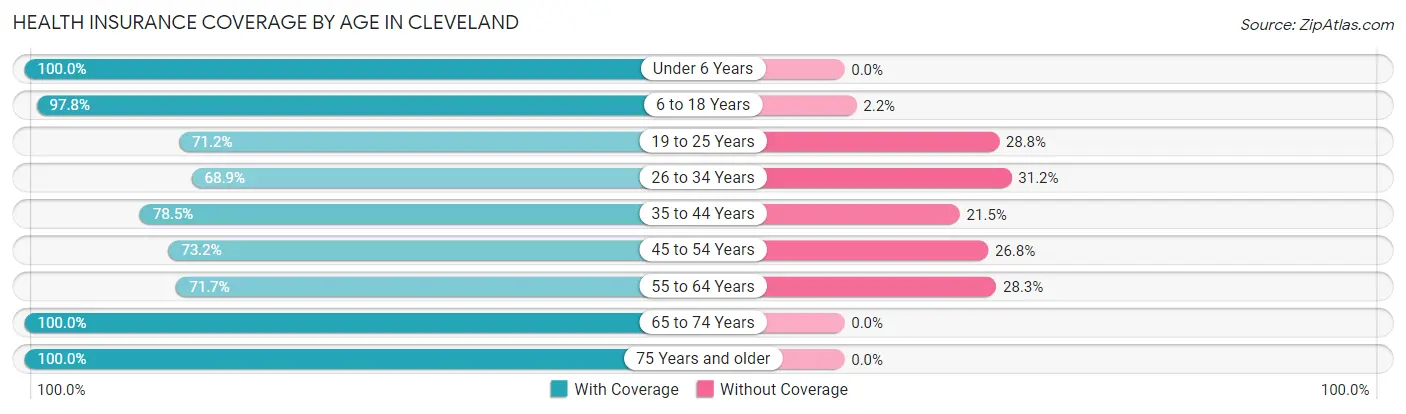
| Age Bracket | With Coverage | Without Coverage |
| Under 6 Years | 533 (100.0%) | 0 (0.0%) |
| 6 to 18 Years | 1,310 (97.8%) | 30 (2.2%) |
| 19 to 25 Years | 373 (71.2%) | 151 (28.8%) |
| 26 to 34 Years | 787 (68.9%) | 356 (31.1%) |
| 35 to 44 Years | 584 (78.5%) | 160 (21.5%) |
| 45 to 54 Years | 475 (73.2%) | 174 (26.8%) |
| 55 to 64 Years | 828 (71.7%) | 327 (28.3%) |
| 65 to 74 Years | 725 (100.0%) | 0 (0.0%) |
| 75 Years and older | 331 (100.0%) | 0 (0.0%) |
| Total | 5,946 (83.2%) | 1,198 (16.8%) |
Health Insurance Coverage by Citizenship Status in Cleveland
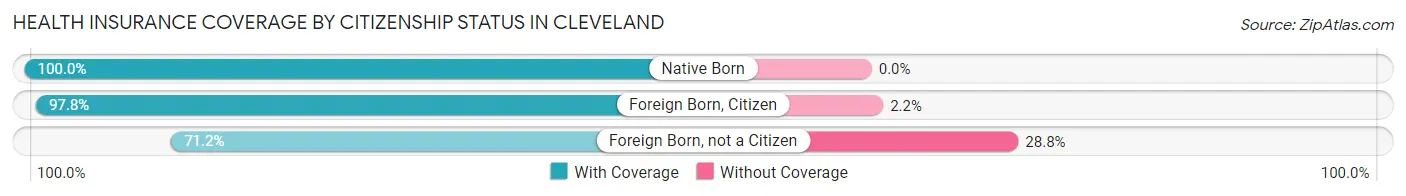
| Citizenship Status | With Coverage | Without Coverage |
| Native Born | 533 (100.0%) | 0 (0.0%) |
| Foreign Born, Citizen | 1,310 (97.8%) | 30 (2.2%) |
| Foreign Born, not a Citizen | 373 (71.2%) | 151 (28.8%) |
Health Insurance Coverage by Household Income in Cleveland
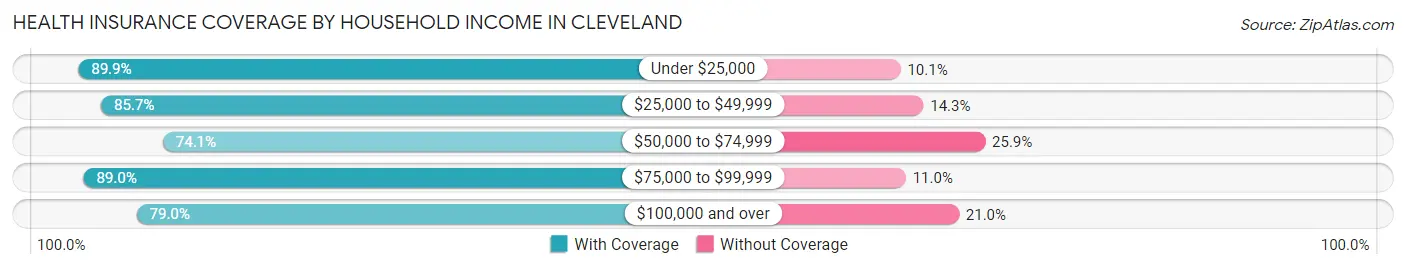
| Household Income | With Coverage | Without Coverage |
| Under $25,000 | 1,001 (89.9%) | 112 (10.1%) |
| $25,000 to $49,999 | 1,996 (85.7%) | 334 (14.3%) |
| $50,000 to $74,999 | 755 (74.1%) | 264 (25.9%) |
| $75,000 to $99,999 | 677 (89.0%) | 84 (11.0%) |
| $100,000 and over | 1,498 (79.0%) | 398 (21.0%) |
Public vs Private Health Insurance Coverage by Age in Cleveland
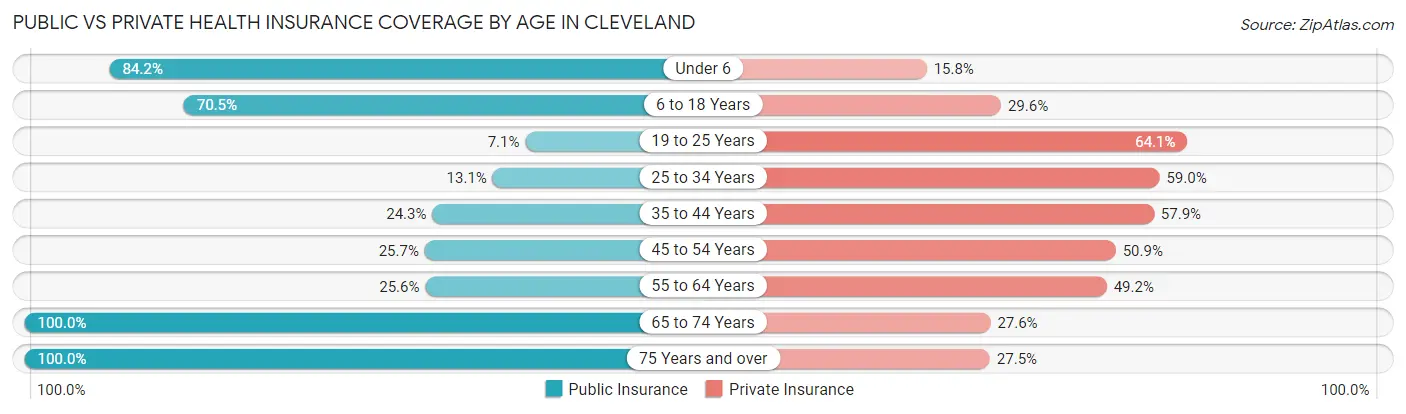
| Age Bracket | Public Insurance | Private Insurance |
| Under 6 | 449 (84.2%) | 84 (15.8%) |
| 6 to 18 Years | 944 (70.5%) | 396 (29.5%) |
| 19 to 25 Years | 37 (7.1%) | 336 (64.1%) |
| 25 to 34 Years | 150 (13.1%) | 674 (59.0%) |
| 35 to 44 Years | 181 (24.3%) | 431 (57.9%) |
| 45 to 54 Years | 167 (25.7%) | 330 (50.8%) |
| 55 to 64 Years | 296 (25.6%) | 568 (49.2%) |
| 65 to 74 Years | 725 (100.0%) | 200 (27.6%) |
| 75 Years and over | 331 (100.0%) | 91 (27.5%) |
| Total | 3,280 (45.9%) | 3,110 (43.5%) |
Disability Status by Sex by Age in Cleveland
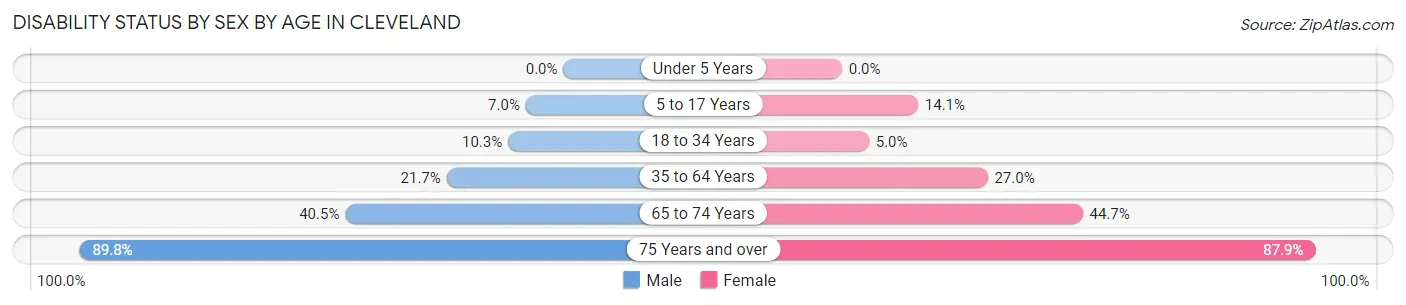
| Age Bracket | Male | Female |
| Under 5 Years | 0 (0.0%) | 0 (0.0%) |
| 5 to 17 Years | 69 (7.0%) | 61 (14.1%) |
| 18 to 34 Years | 82 (10.3%) | 45 (5.0%) |
| 35 to 64 Years | 270 (21.7%) | 352 (27.0%) |
| 65 to 74 Years | 164 (40.5%) | 143 (44.7%) |
| 75 Years and over | 97 (89.8%) | 196 (87.9%) |
Disability Class by Sex by Age in Cleveland
Disability Class: Hearing Difficulty
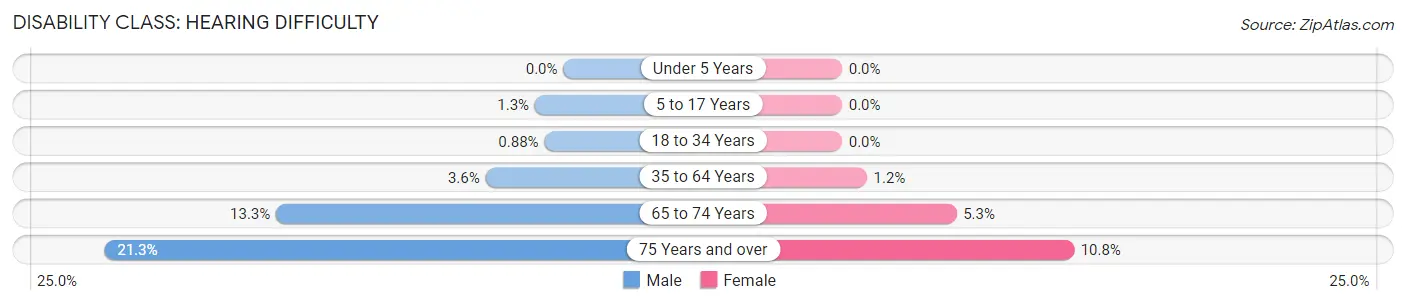
| Age Bracket | Male | Female |
| Under 5 Years | 0 (0.0%) | 0 (0.0%) |
| 5 to 17 Years | 13 (1.3%) | 0 (0.0%) |
| 18 to 34 Years | 7 (0.9%) | 0 (0.0%) |
| 35 to 64 Years | 45 (3.6%) | 15 (1.1%) |
| 65 to 74 Years | 54 (13.3%) | 17 (5.3%) |
| 75 Years and over | 23 (21.3%) | 24 (10.8%) |
Disability Class: Vision Difficulty
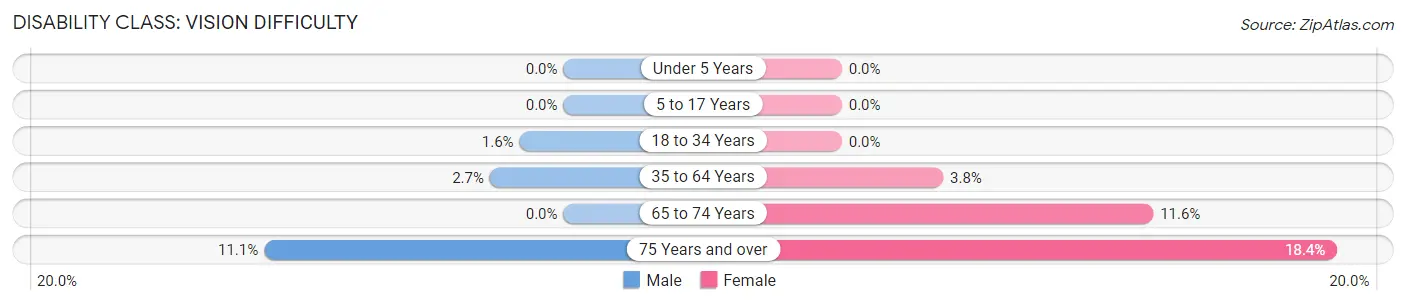
| Age Bracket | Male | Female |
| Under 5 Years | 0 (0.0%) | 0 (0.0%) |
| 5 to 17 Years | 0 (0.0%) | 0 (0.0%) |
| 18 to 34 Years | 13 (1.6%) | 0 (0.0%) |
| 35 to 64 Years | 34 (2.7%) | 49 (3.8%) |
| 65 to 74 Years | 0 (0.0%) | 37 (11.6%) |
| 75 Years and over | 12 (11.1%) | 41 (18.4%) |
Disability Class: Cognitive Difficulty
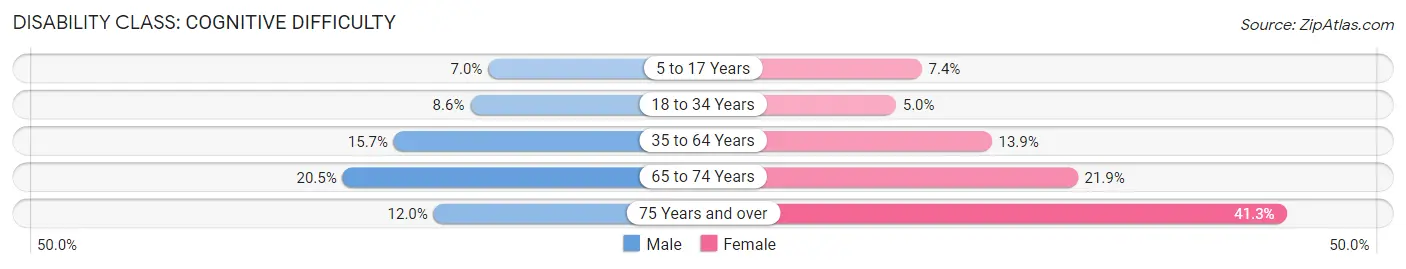
| Age Bracket | Male | Female |
| 5 to 17 Years | 69 (7.0%) | 32 (7.4%) |
| 18 to 34 Years | 69 (8.6%) | 45 (5.0%) |
| 35 to 64 Years | 196 (15.7%) | 181 (13.9%) |
| 65 to 74 Years | 83 (20.5%) | 70 (21.9%) |
| 75 Years and over | 13 (12.0%) | 92 (41.3%) |
Disability Class: Ambulatory Difficulty
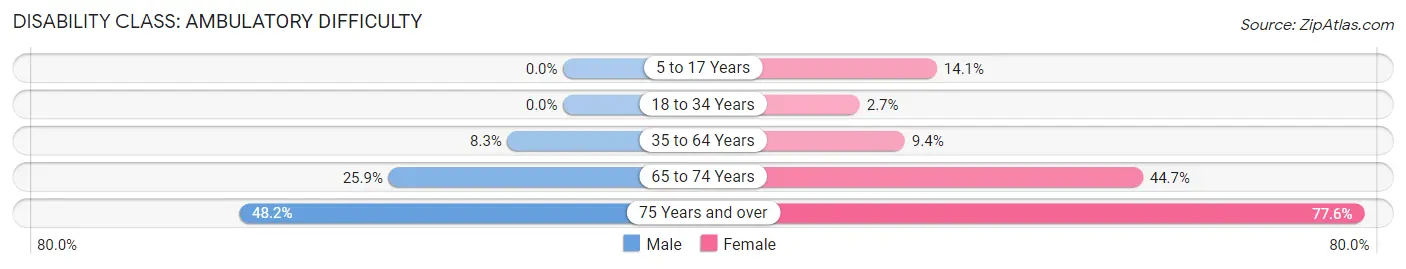
| Age Bracket | Male | Female |
| 5 to 17 Years | 0 (0.0%) | 61 (14.1%) |
| 18 to 34 Years | 0 (0.0%) | 24 (2.7%) |
| 35 to 64 Years | 103 (8.3%) | 122 (9.4%) |
| 65 to 74 Years | 105 (25.9%) | 143 (44.7%) |
| 75 Years and over | 52 (48.1%) | 173 (77.6%) |
Disability Class: Self-Care Difficulty
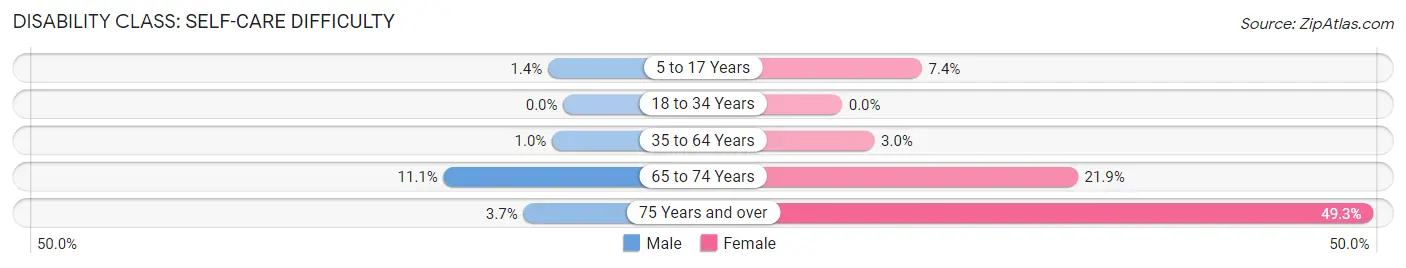
| Age Bracket | Male | Female |
| 5 to 17 Years | 14 (1.4%) | 32 (7.4%) |
| 18 to 34 Years | 0 (0.0%) | 0 (0.0%) |
| 35 to 64 Years | 13 (1.0%) | 39 (3.0%) |
| 65 to 74 Years | 45 (11.1%) | 70 (21.9%) |
| 75 Years and over | 4 (3.7%) | 110 (49.3%) |
Technology Access in Cleveland
Computing Device Access in Cleveland
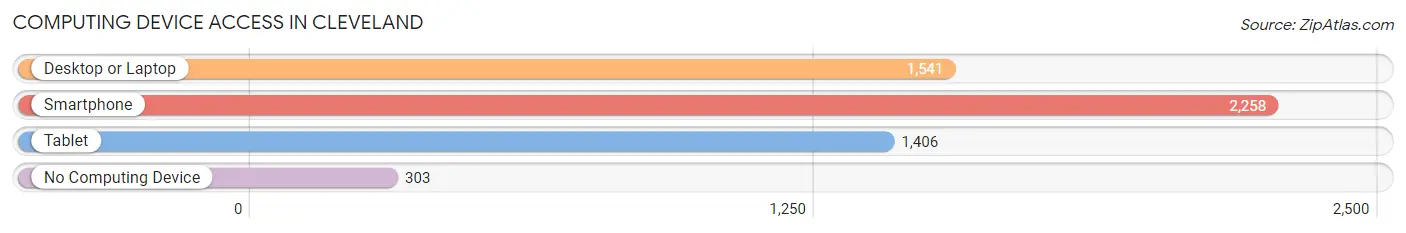
| Device Type | # Households | % Households |
| Desktop or Laptop | 1,541 | 58.1% |
| Smartphone | 2,258 | 85.1% |
| Tablet | 1,406 | 53.0% |
| No Computing Device | 303 | 11.4% |
| Total | 2,653 | 100.0% |
Internet Access in Cleveland
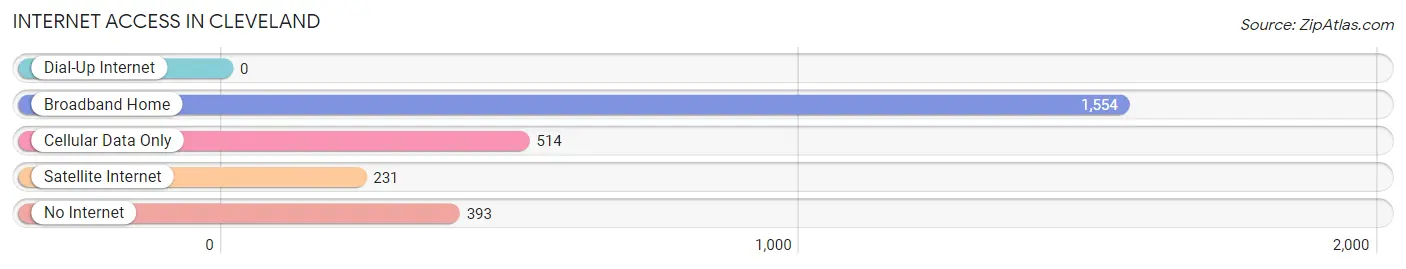
| Internet Type | # Households | % Households |
| Dial-Up Internet | 0 | 0.0% |
| Broadband Home | 1,554 | 58.6% |
| Cellular Data Only | 514 | 19.4% |
| Satellite Internet | 231 | 8.7% |
| No Internet | 393 | 14.8% |
| Total | 2,653 | 100.0% |
Cleveland Summary
Cleveland is a city located in Liberty County, Texas, United States. The population was 7,954 at the 2010 census. It is the county seat of Liberty County. Cleveland is part of the Houston–The Woodlands–Sugar Land metropolitan area.
History
The area around Cleveland was first settled in the early 1830s by settlers from the United States and Europe. The town was named after President Grover Cleveland, who was in office at the time. The town was officially incorporated in 1891.
In the early 1900s, Cleveland was a thriving agricultural center, with cotton, corn, and sweet potatoes being the main crops. The town also had a thriving lumber industry, with several sawmills in the area.
In the 1920s, the town began to experience a population boom, as oil was discovered in the area. This led to the construction of several oil refineries and other related industries. The population of Cleveland continued to grow throughout the 20th century, reaching its peak in the 1970s.
Geography
Cleveland is located in the southeastern part of Liberty County, at the intersection of U.S. Route 59 and State Highway 105. It is about 40 miles northeast of Houston and about 25 miles west of Beaumont.
The city has a total area of 8.2 square miles, of which 8.1 square miles is land and 0.1 square miles is water.
Economy
Cleveland is a major center for the oil and gas industry, with several oil refineries and related industries located in the area. The city is also home to several manufacturing companies, including a paper mill and a steel mill.
The city is also home to several retail stores, restaurants, and other businesses. The city is served by the Cleveland Independent School District.
Demographics
As of the 2010 census, there were 7,954 people, 2,845 households, and 1,945 families residing in the city. The population density was 983.3 people per square mile. There were 3,093 housing units at an average density of 382.3 per square mile.
The racial makeup of the city was 68.2% White, 19.2% African American, 0.7% Native American, 0.7% Asian, 0.1% Pacific Islander, 8.7% from other races, and 2.4% from two or more races. Hispanic or Latino of any race were 18.2% of the population.
There were 2,845 households, out of which 33.2% had children under the age of 18 living with them, 44.2% were married couples living together, 17.3% had a female householder with no husband present, and 32.7% were non-families. 28.2% of all households were made up of individuals, and 11.7% had someone living alone who was 65 years of age or older. The average household size was 2.71 and the average family size was 3.33.
In the city, the population was spread out, with 28.2% under the age of 18, 9.3% from 18 to 24, 27.2% from 25 to 44, 21.3% from 45 to 64, and 14.0% who were 65 years of age or older. The median age was 34 years. For every 100 females, there were 93.2 males. For every 100 females age 18 and over, there were 88.7 males.
The median income for a household in the city was $30,917, and the median income for a family was $36,944. Males had a median income of $30,917 versus $21,964 for females. The per capita income for the city was $14,945. About 16.2% of families and 19.2% of the population were below the poverty line, including 25.2% of those under age 18 and 14.2% of those age 65 or over.
Common Questions
What is Per Capita Income in Cleveland?
Per Capita income in Cleveland is $22,652.
What is the Median Family Income in Cleveland?
Median Family Income in Cleveland is $53,513.
What is the Median Household income in Cleveland?
Median Household Income in Cleveland is $46,875.
What is Income or Wage Gap in Cleveland?
Income or Wage Gap in Cleveland is 23.1%.
Women in Cleveland earn 76.9 cents for every dollar earned by a man.
What is Family Income Deficit in Cleveland?
Family Income Deficit in Cleveland is $10,945.
Families that are below poverty line in Cleveland earn $10,945 less on average than the poverty threshold level.
What is Inequality or Gini Index in Cleveland?
Inequality or Gini Index in Cleveland is 0.46.
What is the Total Population of Cleveland?
Total Population of Cleveland is 7,756.
What is the Total Male Population of Cleveland?
Total Male Population of Cleveland is 4,382.
What is the Total Female Population of Cleveland?
Total Female Population of Cleveland is 3,374.
What is the Ratio of Males per 100 Females in Cleveland?
There are 129.88 Males per 100 Females in Cleveland.
What is the Ratio of Females per 100 Males in Cleveland?
There are 77.00 Females per 100 Males in Cleveland.
What is the Median Population Age in Cleveland?
Median Population Age in Cleveland is 36.5 Years.
What is the Average Family Size in Cleveland
Average Family Size in Cleveland is 3.2 People.
What is the Average Household Size in Cleveland
Average Household Size in Cleveland is 2.7 People.
How Large is the Labor Force in Cleveland?
There are 3,073 People in the Labor Forcein in Cleveland.
What is the Percentage of People in the Labor Force in Cleveland?
50.2% of People are in the Labor Force in Cleveland.
What is the Unemployment Rate in Cleveland?
Unemployment Rate in Cleveland is 2.4%.