Zavala County, TX Map & Demographics
Zavala County Map
Zavala County Overview
$20,409
PER CAPITA INCOME
$52,679
AVG FAMILY INCOME
$49,243
AVG HOUSEHOLD INCOME
44.3%
WAGE / INCOME GAP [ % ]
55.7¢/ $1
WAGE / INCOME GAP [ $ ]
$9,198
FAMILY INCOME DEFICIT
0.40
INEQUALITY / GINI INDEX
9,700
TOTAL POPULATION
5,101
MALE POPULATION
4,599
FEMALE POPULATION
110.92
MALES / 100 FEMALES
90.16
FEMALES / 100 MALES
33.2
MEDIAN AGE
3.1
AVG FAMILY SIZE
2.8
AVG HOUSEHOLD SIZE
4,046
LABOR FORCE [ PEOPLE ]
55.3%
PERCENT IN LABOR FORCE
5.8%
UNEMPLOYMENT RATE
Zavala County Area Codes
Income in Zavala County
Income Overview in Zavala County
Per Capita Income in Zavala County is $20,409, while median incomes of families and households are $52,679 and $49,243 respectively.
| Characteristic | Number | Measure |
| Per Capita Income | 9,700 | $20,409 |
| Median Family Income | 2,744 | $52,679 |
| Mean Family Income | 2,744 | $63,936 |
| Median Household Income | 3,427 | $49,243 |
| Mean Household Income | 3,427 | $60,004 |
| Income Deficit | 2,744 | $9,198 |
| Wage / Income Gap (%) | 9,700 | 44.29% |
| Wage / Income Gap ($) | 9,700 | 55.71¢ per $1 |
| Gini / Inequality Index | 9,700 | 0.40 |
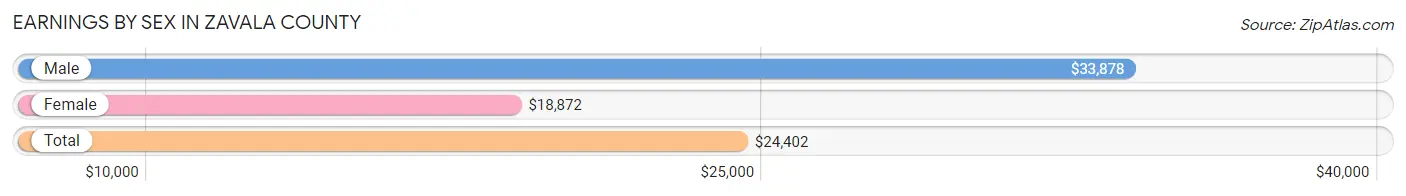
Earnings by Sex in Zavala County
Average Earnings in Zavala County are $24,402, $33,878 for men and $18,872 for women, a difference of 44.3%.
| Sex | Number | Average Earnings |
| Male | 2,453 (56.3%) | $33,878 |
| Female | 1,905 (43.7%) | $18,872 |
| Total | 4,358 (100.0%) | $24,402 |
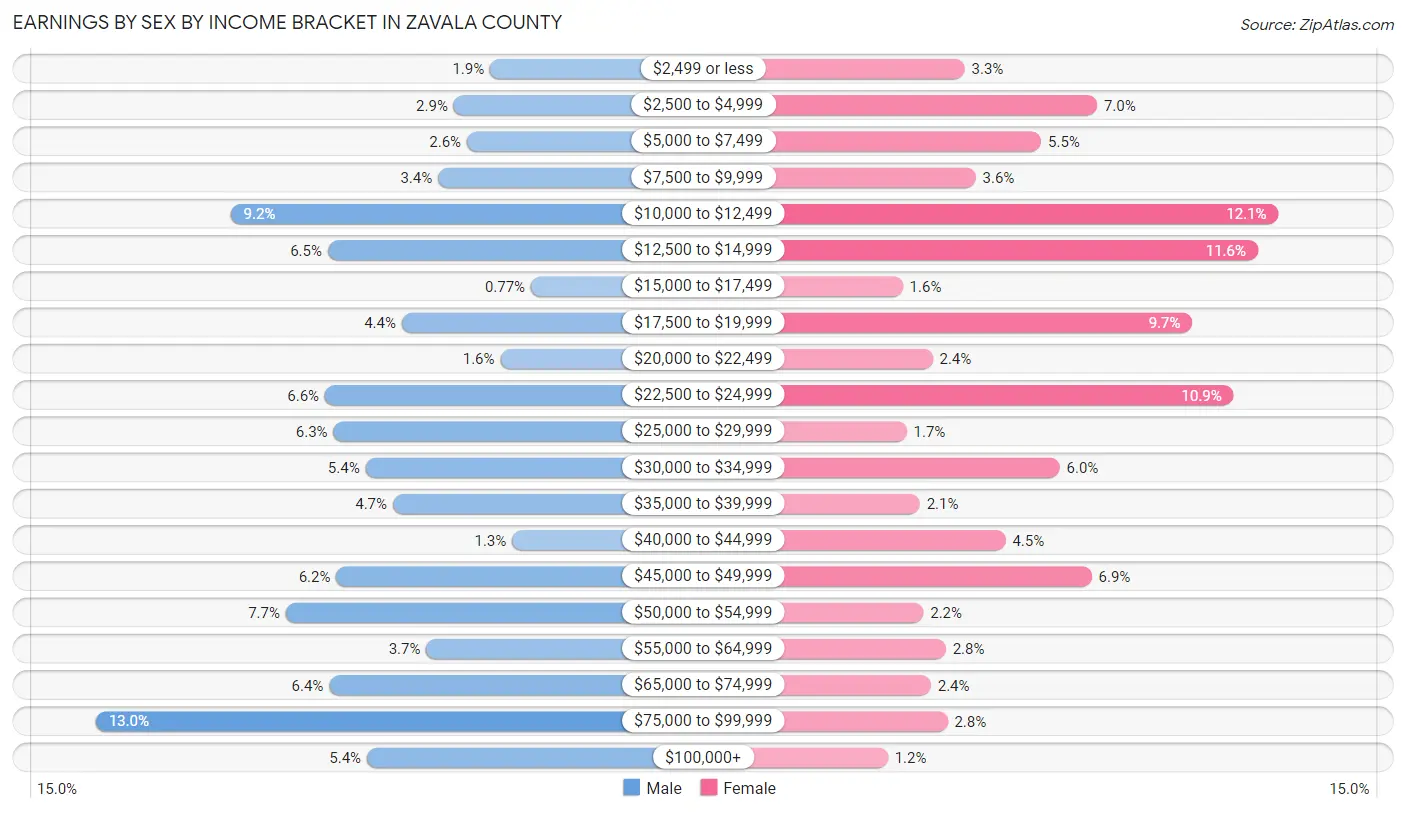
Earnings by Sex by Income Bracket in Zavala County
The most common earnings brackets in Zavala County are $75,000 to $99,999 for men (319 | 13.0%) and $10,000 to $12,499 for women (231 | 12.1%).
| Income | Male | Female |
| $2,499 or less | 47 (1.9%) | 63 (3.3%) |
| $2,500 to $4,999 | 72 (2.9%) | 134 (7.0%) |
| $5,000 to $7,499 | 63 (2.6%) | 104 (5.5%) |
| $7,500 to $9,999 | 83 (3.4%) | 69 (3.6%) |
| $10,000 to $12,499 | 226 (9.2%) | 231 (12.1%) |
| $12,500 to $14,999 | 159 (6.5%) | 220 (11.6%) |
| $15,000 to $17,499 | 19 (0.8%) | 30 (1.6%) |
| $17,500 to $19,999 | 108 (4.4%) | 185 (9.7%) |
| $20,000 to $22,499 | 40 (1.6%) | 46 (2.4%) |
| $22,500 to $24,999 | 161 (6.6%) | 207 (10.9%) |
| $25,000 to $29,999 | 155 (6.3%) | 32 (1.7%) |
| $30,000 to $34,999 | 133 (5.4%) | 114 (6.0%) |
| $35,000 to $39,999 | 114 (4.6%) | 39 (2.1%) |
| $40,000 to $44,999 | 32 (1.3%) | 85 (4.5%) |
| $45,000 to $49,999 | 153 (6.2%) | 131 (6.9%) |
| $50,000 to $54,999 | 188 (7.7%) | 41 (2.1%) |
| $55,000 to $64,999 | 91 (3.7%) | 53 (2.8%) |
| $65,000 to $74,999 | 158 (6.4%) | 45 (2.4%) |
| $75,000 to $99,999 | 319 (13.0%) | 54 (2.8%) |
| $100,000+ | 132 (5.4%) | 22 (1.1%) |
| Total | 2,453 (100.0%) | 1,905 (100.0%) |
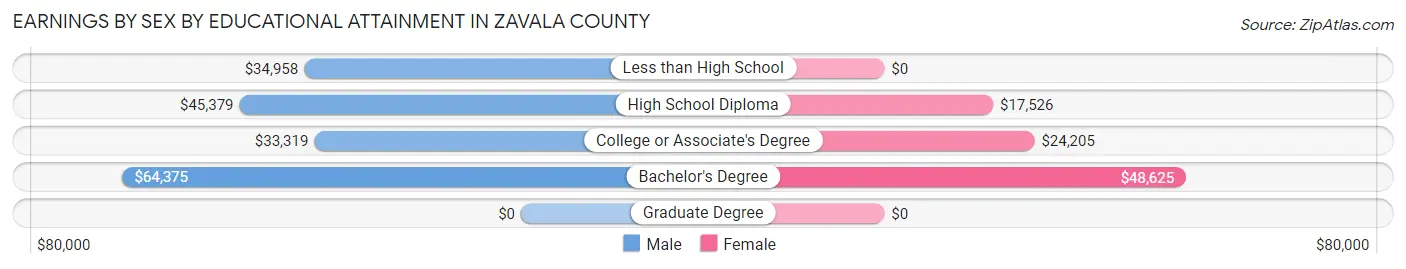
Earnings by Sex by Educational Attainment in Zavala County
Average earnings in Zavala County are $45,066 for men and $22,609 for women, a difference of 49.8%. Men with an educational attainment of bachelor's degree enjoy the highest average annual earnings of $64,375, while those with college or associate's degree education earn the least with $33,319. Women with an educational attainment of bachelor's degree earn the most with the average annual earnings of $48,625, while those with high school diploma education have the smallest earnings of $17,526.
| Educational Attainment | Male Income | Female Income |
| Less than High School | $34,958 | $0 |
| High School Diploma | $45,379 | $17,526 |
| College or Associate's Degree | $33,319 | $24,205 |
| Bachelor's Degree | $64,375 | $48,625 |
| Graduate Degree | - | - |
| Total | $45,066 | $22,609 |
Family Income in Zavala County
Family Income Brackets in Zavala County
According to the Zavala County family income data, there are 513 families falling into the $35,000 to $49,999 income range, which is the most common income bracket and makes up 18.7% of all families. Conversely, the $150,000 to $199,999 income bracket is the least frequent group with only 41 families (1.5%) belonging to this category.
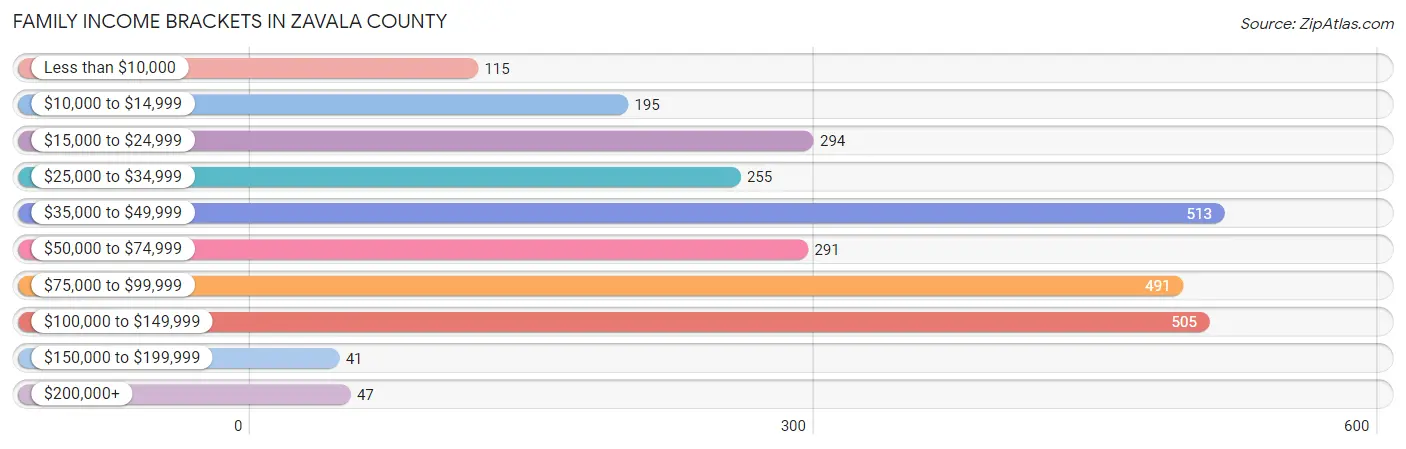
| Income Bracket | # Families | % Families |
| Less than $10,000 | 115 | 4.2% |
| $10,000 to $14,999 | 195 | 7.1% |
| $15,000 to $24,999 | 294 | 10.7% |
| $25,000 to $34,999 | 255 | 9.3% |
| $35,000 to $49,999 | 513 | 18.7% |
| $50,000 to $74,999 | 291 | 10.6% |
| $75,000 to $99,999 | 491 | 17.9% |
| $100,000 to $149,999 | 505 | 18.4% |
| $150,000 to $199,999 | 41 | 1.5% |
| $200,000+ | 47 | 1.7% |
Family Income by Famaliy Size in Zavala County
4-person families (323 | 11.8%) account for the highest median family income in Zavala County with $95,497 per family, while 2-person families (1,255 | 45.7%) have the highest median income of $26,562 per family member.
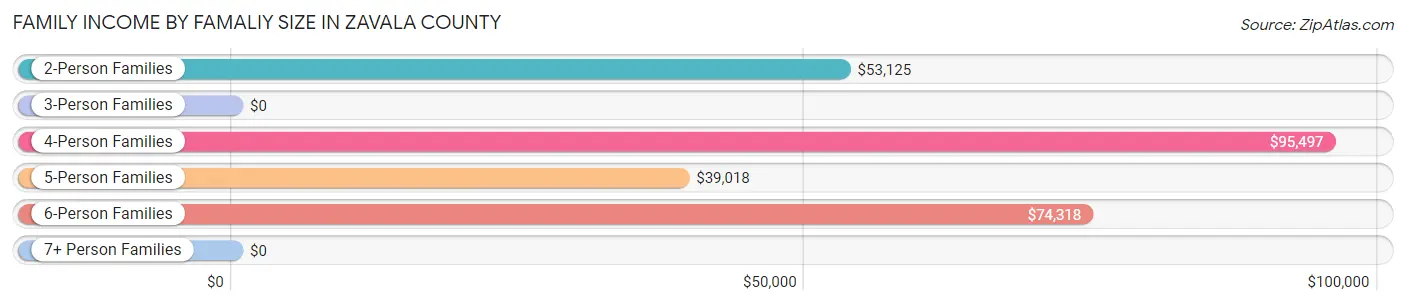
| Income Bracket | # Families | Median Income |
| 2-Person Families | 1,255 (45.7%) | $53,125 |
| 3-Person Families | 675 (24.6%) | $0 |
| 4-Person Families | 323 (11.8%) | $95,497 |
| 5-Person Families | 396 (14.4%) | $39,018 |
| 6-Person Families | 64 (2.3%) | $74,318 |
| 7+ Person Families | 31 (1.1%) | $0 |
| Total | 2,744 (100.0%) | $52,679 |
Family Income by Number of Earners in Zavala County
The median family income in Zavala County is $52,679, with families comprising 3+ earners (115) having the highest median family income of $91,442, while families with 1 earner (1,136) have the lowest median family income of $31,417, accounting for 4.2% and 41.4% of families, respectively.
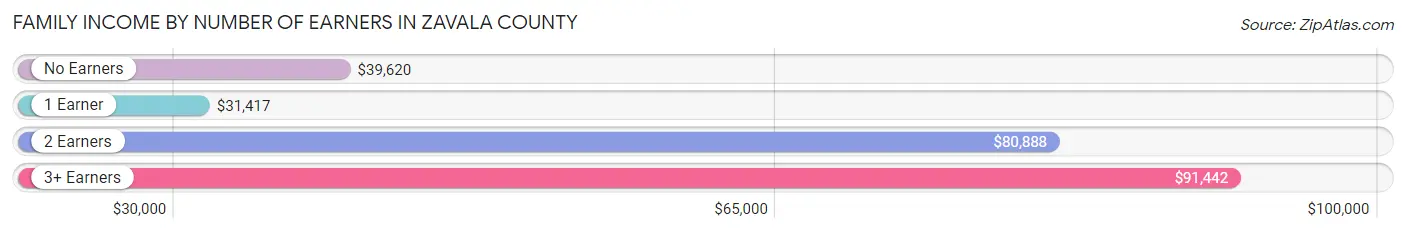
| Number of Earners | # Families | Median Income |
| No Earners | 441 (16.1%) | $39,620 |
| 1 Earner | 1,136 (41.4%) | $31,417 |
| 2 Earners | 1,052 (38.3%) | $80,888 |
| 3+ Earners | 115 (4.2%) | $91,442 |
| Total | 2,744 (100.0%) | $52,679 |
Household Income in Zavala County
Household Income Brackets in Zavala County
With 596 households falling in the category, the $35,000 to $49,999 income range is the most frequent in Zavala County, accounting for 17.4% of all households. In contrast, only 41 households (1.2%) fall into the $150,000 to $199,999 income bracket, making it the least populous group.
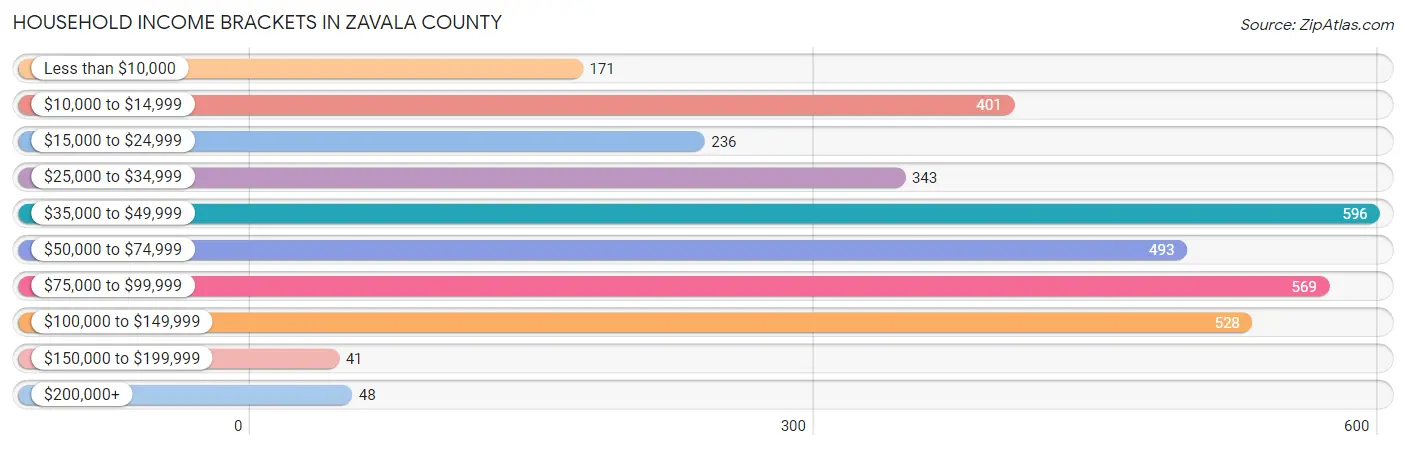
| Income Bracket | # Households | % Households |
| Less than $10,000 | 171 | 5.0% |
| $10,000 to $14,999 | 401 | 11.7% |
| $15,000 to $24,999 | 236 | 6.9% |
| $25,000 to $34,999 | 343 | 10.0% |
| $35,000 to $49,999 | 596 | 17.4% |
| $50,000 to $74,999 | 493 | 14.4% |
| $75,000 to $99,999 | 569 | 16.6% |
| $100,000 to $149,999 | 528 | 15.4% |
| $150,000 to $199,999 | 41 | 1.2% |
| $200,000+ | 48 | 1.4% |
Household Income by Householder Age in Zavala County
The median household income in Zavala County is $49,243, with the highest median household income of $67,295 found in the 45 to 64 years age bracket for the primary householder. A total of 857 households (25.0%) fall into this category. Meanwhile, the 15 to 24 years age bracket for the primary householder has the lowest median household income of $37,829, with 329 households (9.6%) in this group.
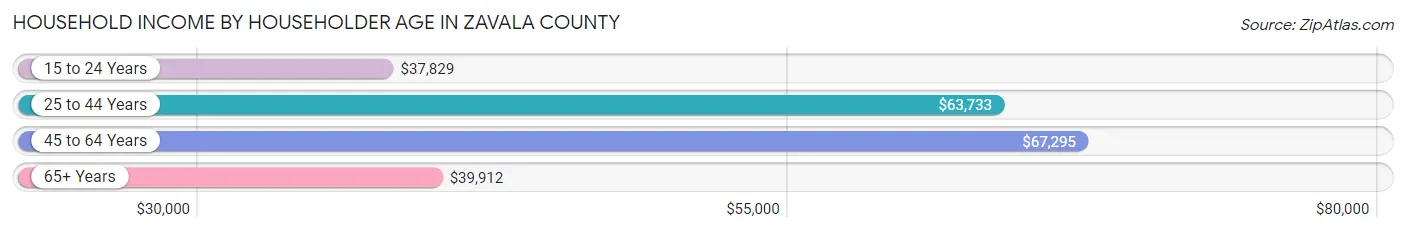
| Income Bracket | # Households | Median Income |
| 15 to 24 Years | 329 (9.6%) | $37,829 |
| 25 to 44 Years | 1,214 (35.4%) | $63,733 |
| 45 to 64 Years | 857 (25.0%) | $67,295 |
| 65+ Years | 1,027 (30.0%) | $39,912 |
| Total | 3,427 (100.0%) | $49,243 |
Poverty in Zavala County
Income Below Poverty by Sex and Age in Zavala County
With 28.3% poverty level for males and 33.9% for females among the residents of Zavala County, 5 year old males and 12 to 14 year old females are the most vulnerable to poverty, with 119 males (86.9%) and 514 females (96.1%) in their respective age groups living below the poverty level.
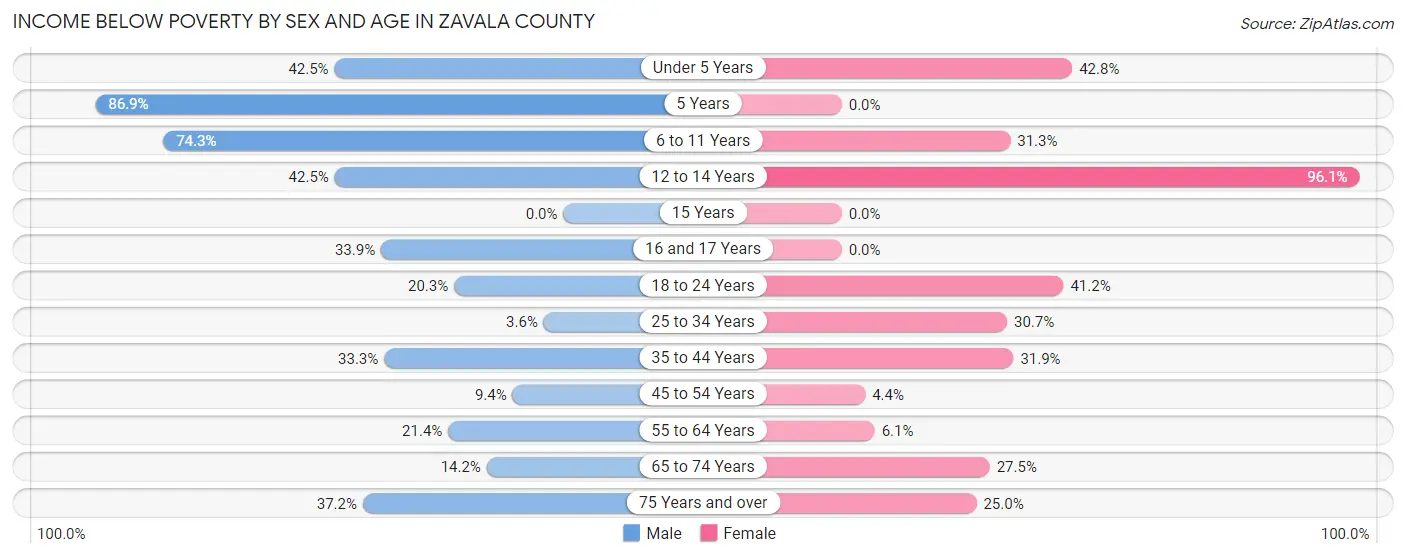
| Age Bracket | Male | Female |
| Under 5 Years | 164 (42.5%) | 133 (42.8%) |
| 5 Years | 119 (86.9%) | 0 (0.0%) |
| 6 to 11 Years | 332 (74.3%) | 71 (31.3%) |
| 12 to 14 Years | 104 (42.4%) | 514 (96.1%) |
| 15 Years | 0 (0.0%) | 0 (0.0%) |
| 16 and 17 Years | 109 (33.9%) | 0 (0.0%) |
| 18 to 24 Years | 102 (20.3%) | 207 (41.1%) |
| 25 to 34 Years | 25 (3.6%) | 177 (30.7%) |
| 35 to 44 Years | 185 (33.3%) | 194 (31.9%) |
| 45 to 54 Years | 48 (9.4%) | 17 (4.3%) |
| 55 to 64 Years | 93 (21.4%) | 28 (6.1%) |
| 65 to 74 Years | 79 (14.2%) | 145 (27.5%) |
| 75 Years and over | 67 (37.2%) | 74 (25.0%) |
| Total | 1,427 (28.3%) | 1,560 (33.9%) |
Income Above Poverty by Sex and Age in Zavala County
According to the poverty statistics in Zavala County, males aged 15 years and females aged 5 years are the age groups that are most secure financially, with 100.0% of males and 100.0% of females in these age groups living above the poverty line.
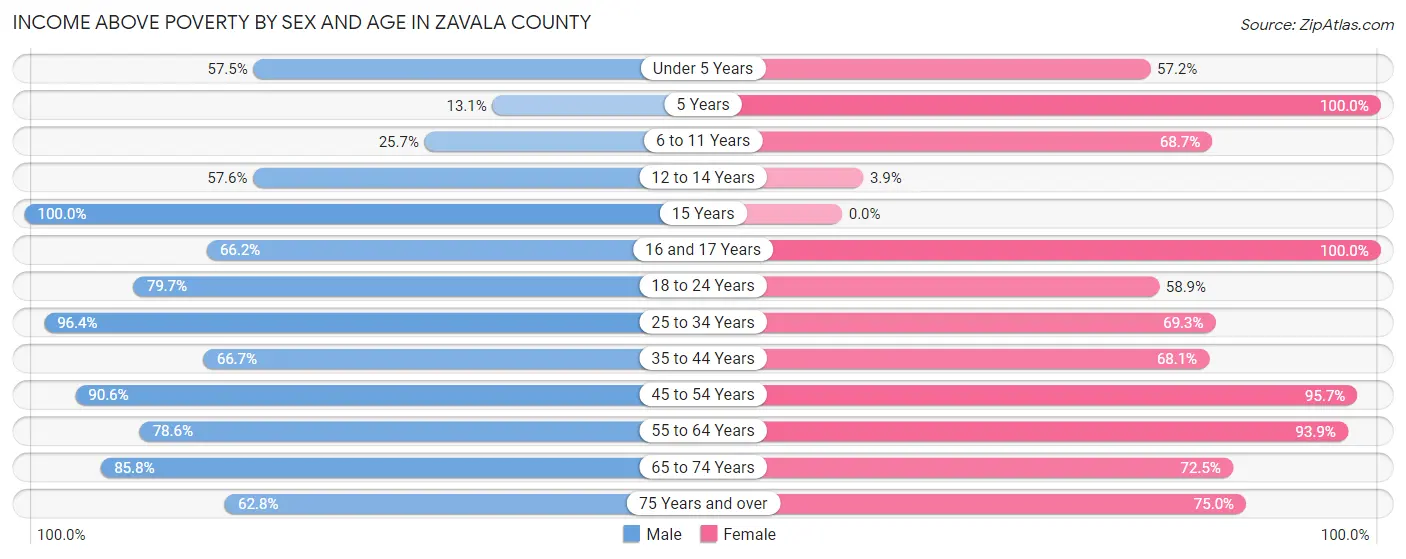
| Age Bracket | Male | Female |
| Under 5 Years | 222 (57.5%) | 178 (57.2%) |
| 5 Years | 18 (13.1%) | 23 (100.0%) |
| 6 to 11 Years | 115 (25.7%) | 156 (68.7%) |
| 12 to 14 Years | 141 (57.6%) | 21 (3.9%) |
| 15 Years | 73 (100.0%) | 0 (0.0%) |
| 16 and 17 Years | 213 (66.1%) | 141 (100.0%) |
| 18 to 24 Years | 401 (79.7%) | 296 (58.9%) |
| 25 to 34 Years | 662 (96.4%) | 400 (69.3%) |
| 35 to 44 Years | 371 (66.7%) | 415 (68.1%) |
| 45 to 54 Years | 461 (90.6%) | 374 (95.7%) |
| 55 to 64 Years | 342 (78.6%) | 430 (93.9%) |
| 65 to 74 Years | 476 (85.8%) | 383 (72.5%) |
| 75 Years and over | 113 (62.8%) | 222 (75.0%) |
| Total | 3,608 (71.7%) | 3,039 (66.1%) |
Income Below Poverty Among Married-Couple Families in Zavala County
The poverty statistics for married-couple families in Zavala County show that 5.3% or 82 of the total 1,557 families live below the poverty line. Families with no children have the highest poverty rate of 8.4%, comprising of 82 families. On the other hand, families with 1 or 2 children have the lowest poverty rate of 0.0%, which includes 0 families.
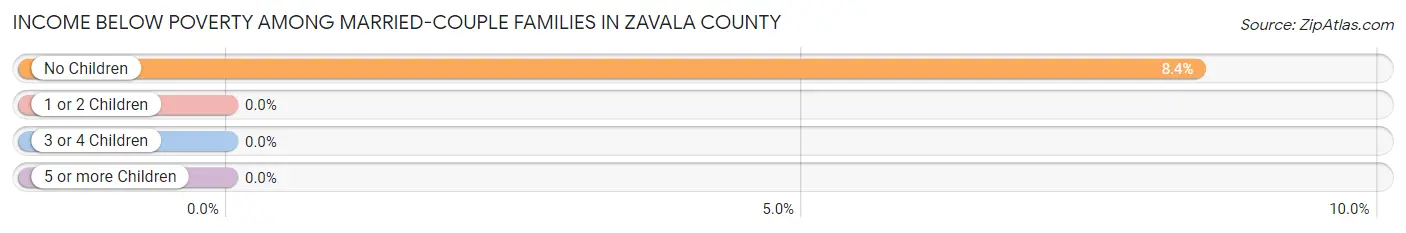
| Children | Above Poverty | Below Poverty |
| No Children | 892 (91.6%) | 82 (8.4%) |
| 1 or 2 Children | 456 (100.0%) | 0 (0.0%) |
| 3 or 4 Children | 114 (100.0%) | 0 (0.0%) |
| 5 or more Children | 13 (100.0%) | 0 (0.0%) |
| Total | 1,475 (94.7%) | 82 (5.3%) |
Income Below Poverty Among Single-Parent Households in Zavala County
According to the poverty data in Zavala County, 16.8% or 63 single-father households and 53.0% or 430 single-mother households are living below the poverty line. Among single-father households, those with 1 or 2 children have the highest poverty rate, with 37 households (24.7%) experiencing poverty. Likewise, among single-mother households, those with 5 or more children have the highest poverty rate, with 19 households (100.0%) falling below the poverty line.
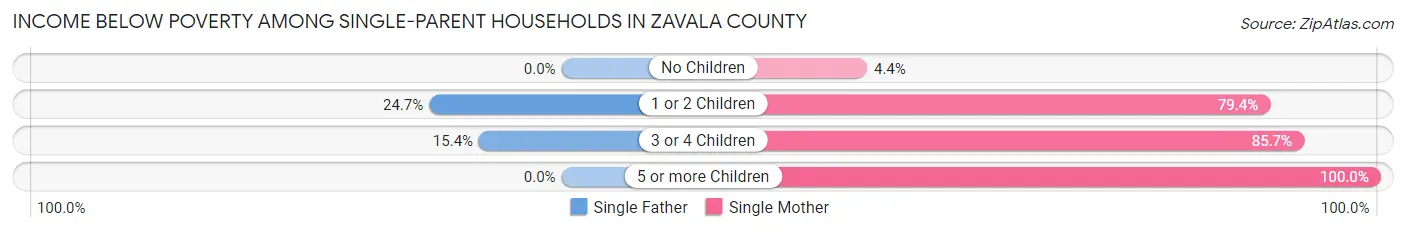
| Children | Single Father | Single Mother |
| No Children | 0 (0.0%) | 13 (4.3%) |
| 1 or 2 Children | 37 (24.7%) | 320 (79.4%) |
| 3 or 4 Children | 26 (15.4%) | 78 (85.7%) |
| 5 or more Children | 0 (0.0%) | 19 (100.0%) |
| Total | 63 (16.8%) | 430 (53.0%) |
Income Below Poverty Among Married-Couple vs Single-Parent Households in Zavala County
The poverty data for Zavala County shows that 82 of the married-couple family households (5.3%) and 493 of the single-parent households (41.5%) are living below the poverty level. Within the married-couple family households, those with no children have the highest poverty rate, with 82 households (8.4%) falling below the poverty line. Among the single-parent households, those with 5 or more children have the highest poverty rate, with 19 household (100.0%) living below poverty.
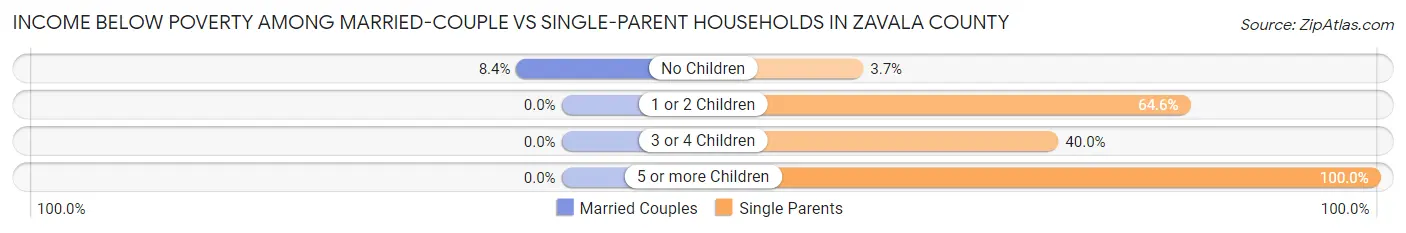
| Children | Married-Couple Families | Single-Parent Households |
| No Children | 82 (8.4%) | 13 (3.7%) |
| 1 or 2 Children | 0 (0.0%) | 357 (64.6%) |
| 3 or 4 Children | 0 (0.0%) | 104 (40.0%) |
| 5 or more Children | 0 (0.0%) | 19 (100.0%) |
| Total | 82 (5.3%) | 493 (41.5%) |
Race in Zavala County
The most populous races in Zavala County are Hispanic or Latino (9,099 | 93.8%), White / Caucasian (5,615 | 57.9%), and Two or more Races (3,525 | 36.3%).
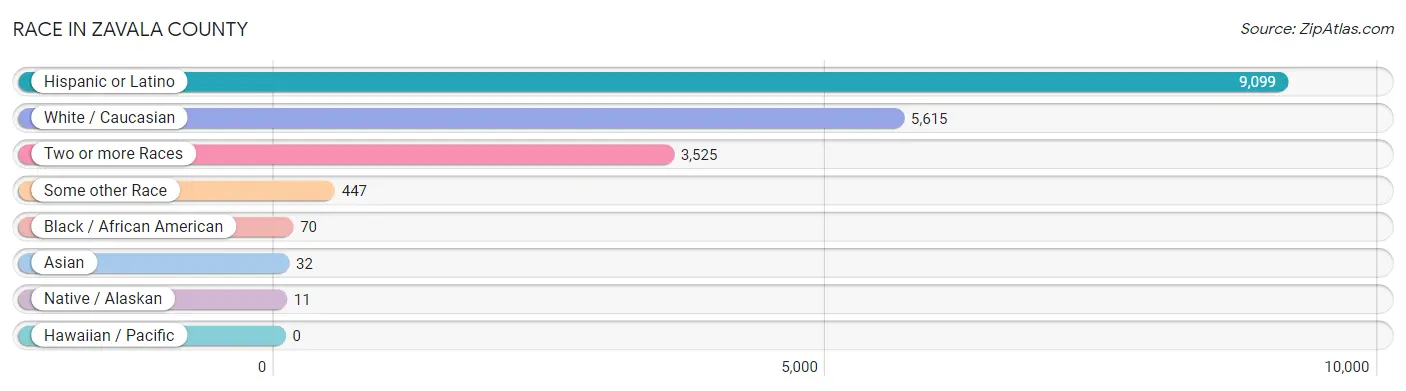
| Race | # Population | % Population |
| Asian | 32 | 0.3% |
| Black / African American | 70 | 0.7% |
| Hawaiian / Pacific | 0 | 0.0% |
| Hispanic or Latino | 9,099 | 93.8% |
| Native / Alaskan | 11 | 0.1% |
| White / Caucasian | 5,615 | 57.9% |
| Two or more Races | 3,525 | 36.3% |
| Some other Race | 447 | 4.6% |
| Total | 9,700 | 100.0% |
Ancestry in Zavala County
The most populous ancestries reported in Zavala County are Mexican (8,929 | 92.0%), American (210 | 2.2%), Irish (133 | 1.4%), Chilean (77 | 0.8%), and South American (77 | 0.8%), together accounting for 97.2% of all Zavala County residents.
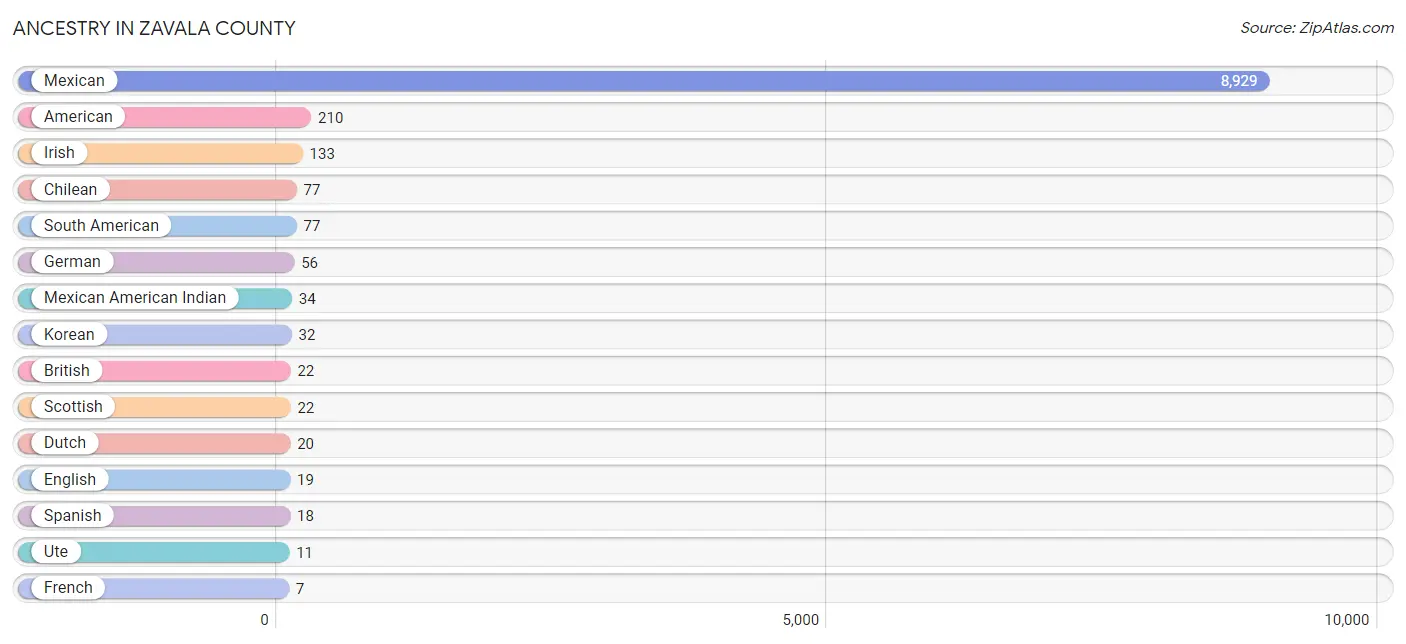
| Ancestry | # Population | % Population |
| American | 210 | 2.2% |
| British | 22 | 0.2% |
| Chilean | 77 | 0.8% |
| Cuban | 1 | 0.0% |
| Dutch | 20 | 0.2% |
| English | 19 | 0.2% |
| French | 7 | 0.1% |
| German | 56 | 0.6% |
| Irish | 133 | 1.4% |
| Korean | 32 | 0.3% |
| Mexican | 8,929 | 92.0% |
| Mexican American Indian | 34 | 0.4% |
| Scottish | 22 | 0.2% |
| South American | 77 | 0.8% |
| Spanish | 18 | 0.2% |
| Ute | 11 | 0.1% | View All 16 Rows |
Immigrants in Zavala County
The most numerous immigrant groups reported in Zavala County came from Latin America (706 | 7.3%), Central America (693 | 7.1%), Mexico (693 | 7.1%), Africa (22 | 0.2%), and South Africa (22 | 0.2%), together accounting for 22.0% of all Zavala County residents.
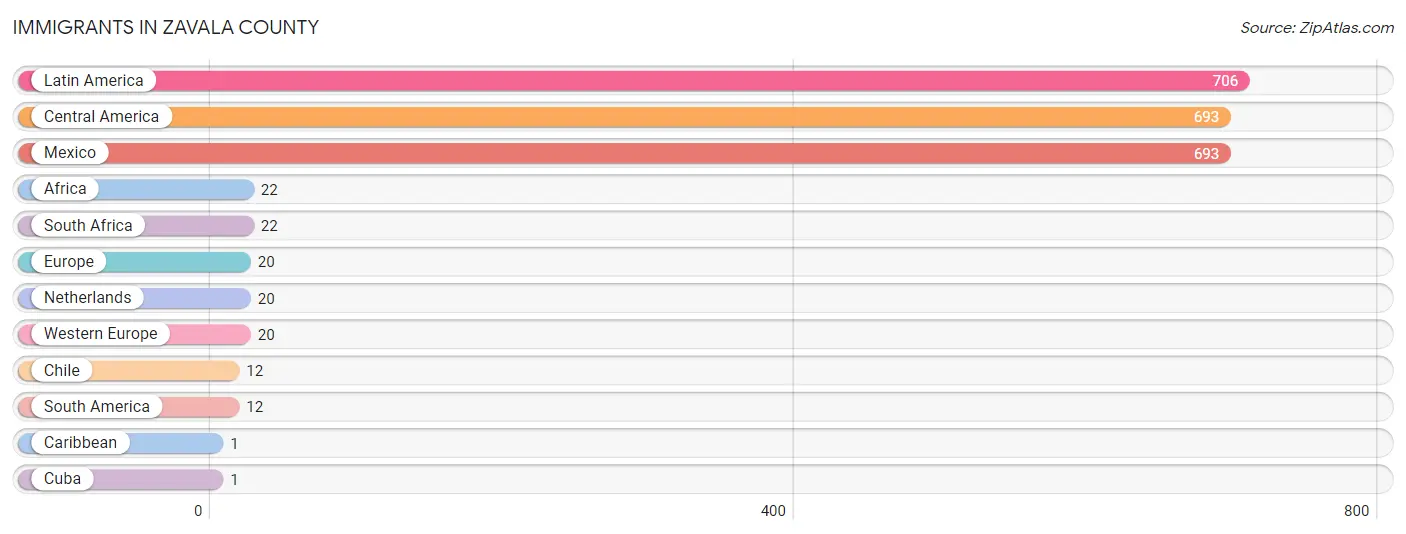
| Immigration Origin | # Population | % Population |
| Africa | 22 | 0.2% |
| Caribbean | 1 | 0.0% |
| Central America | 693 | 7.1% |
| Chile | 12 | 0.1% |
| Cuba | 1 | 0.0% |
| Europe | 20 | 0.2% |
| Latin America | 706 | 7.3% |
| Mexico | 693 | 7.1% |
| Netherlands | 20 | 0.2% |
| South Africa | 22 | 0.2% |
| South America | 12 | 0.1% |
| Western Europe | 20 | 0.2% | View All 12 Rows |
Sex and Age in Zavala County
Sex and Age in Zavala County
The most populous age groups in Zavala County are 5 to 9 Years (584 | 11.5%) for men and 10 to 14 Years (637 | 13.9%) for women.
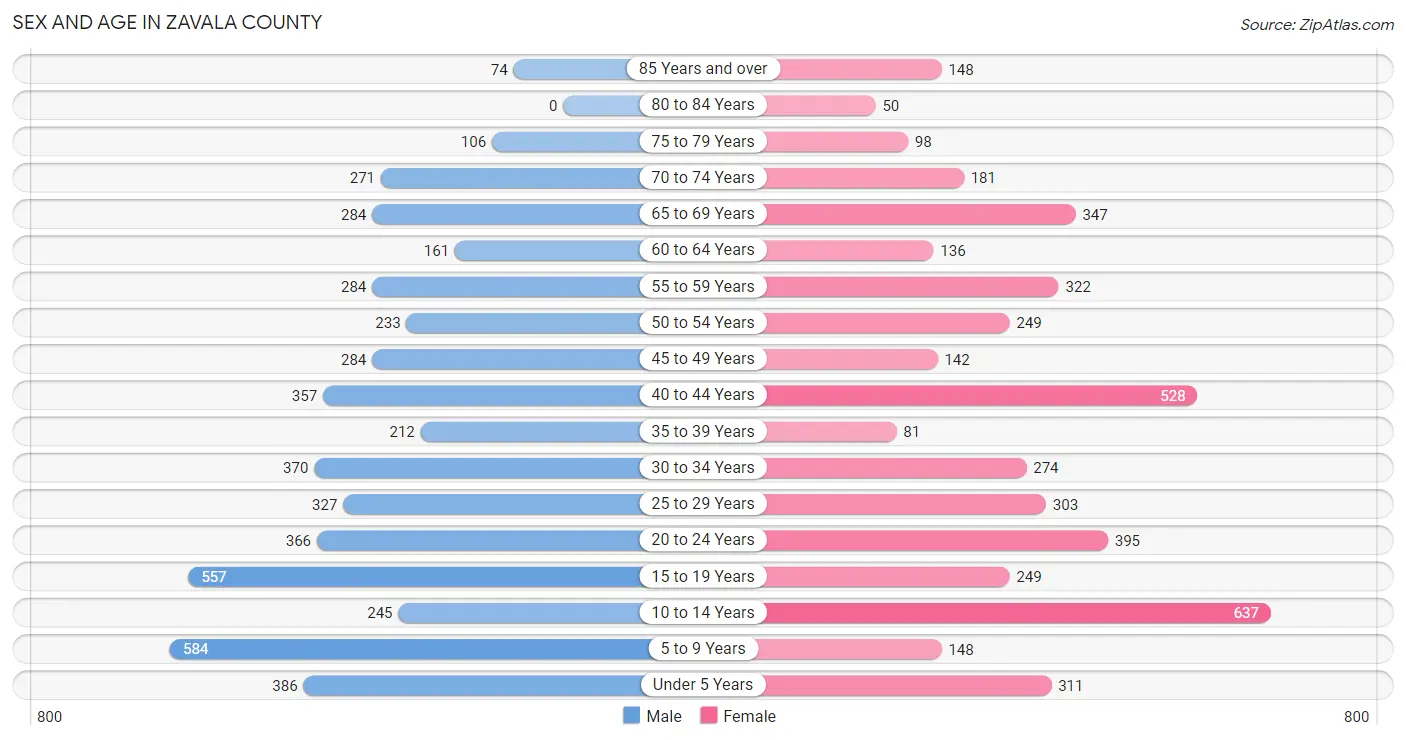
| Age Bracket | Male | Female |
| Under 5 Years | 386 (7.6%) | 311 (6.8%) |
| 5 to 9 Years | 584 (11.5%) | 148 (3.2%) |
| 10 to 14 Years | 245 (4.8%) | 637 (13.9%) |
| 15 to 19 Years | 557 (10.9%) | 249 (5.4%) |
| 20 to 24 Years | 366 (7.2%) | 395 (8.6%) |
| 25 to 29 Years | 327 (6.4%) | 303 (6.6%) |
| 30 to 34 Years | 370 (7.2%) | 274 (6.0%) |
| 35 to 39 Years | 212 (4.2%) | 81 (1.8%) |
| 40 to 44 Years | 357 (7.0%) | 528 (11.5%) |
| 45 to 49 Years | 284 (5.6%) | 142 (3.1%) |
| 50 to 54 Years | 233 (4.6%) | 249 (5.4%) |
| 55 to 59 Years | 284 (5.6%) | 322 (7.0%) |
| 60 to 64 Years | 161 (3.2%) | 136 (3.0%) |
| 65 to 69 Years | 284 (5.6%) | 347 (7.5%) |
| 70 to 74 Years | 271 (5.3%) | 181 (3.9%) |
| 75 to 79 Years | 106 (2.1%) | 98 (2.1%) |
| 80 to 84 Years | 0 (0.0%) | 50 (1.1%) |
| 85 Years and over | 74 (1.5%) | 148 (3.2%) |
| Total | 5,101 (100.0%) | 4,599 (100.0%) |
Families and Households in Zavala County
Median Family Size in Zavala County
The median family size in Zavala County is 3.10 persons per family, with single female/mother families (812 | 29.6%) accounting for the largest median family size of 3.56 persons per family. On the other hand, married-couple families (1,557 | 56.7%) represent the smallest median family size with 2.88 persons per family.
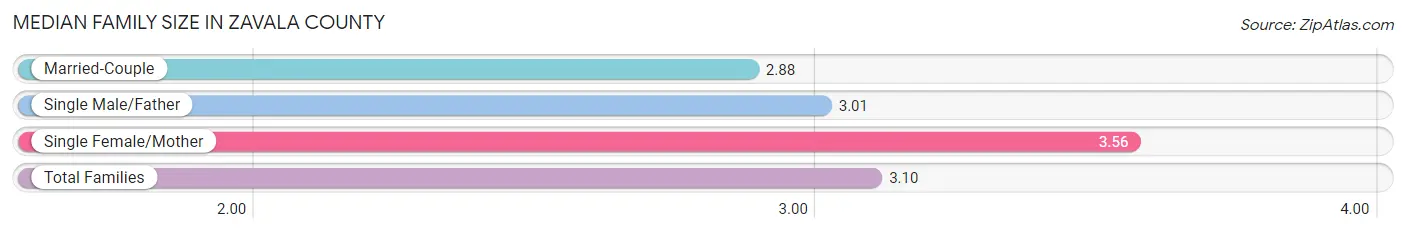
| Family Type | # Families | Family Size |
| Married-Couple | 1,557 (56.7%) | 2.88 |
| Single Male/Father | 375 (13.7%) | 3.01 |
| Single Female/Mother | 812 (29.6%) | 3.56 |
| Total Families | 2,744 (100.0%) | 3.10 |
Median Household Size in Zavala County
The median household size in Zavala County is 2.81 persons per household, with single female/mother households (812 | 23.7%) accounting for the largest median household size of 3.95 persons per household. non-family households (683 | 19.9%) represent the smallest median household size with 1.13 persons per household.
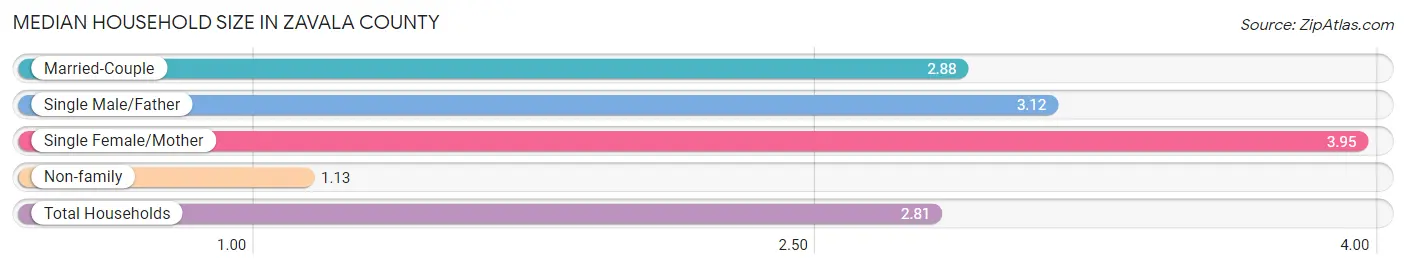
| Household Type | # Households | Household Size |
| Married-Couple | 1,557 (45.4%) | 2.88 |
| Single Male/Father | 375 (10.9%) | 3.12 |
| Single Female/Mother | 812 (23.7%) | 3.95 |
| Non-family | 683 (19.9%) | 1.13 |
| Total Households | 3,427 (100.0%) | 2.81 |
Household Size by Marriage Status in Zavala County
Out of a total of 3,427 households in Zavala County, 2,744 (80.1%) are family households, while 683 (19.9%) are nonfamily households. The most numerous type of family households are 2-person households, comprising 1,039, and the most common type of nonfamily households are 1-person households, comprising 569.
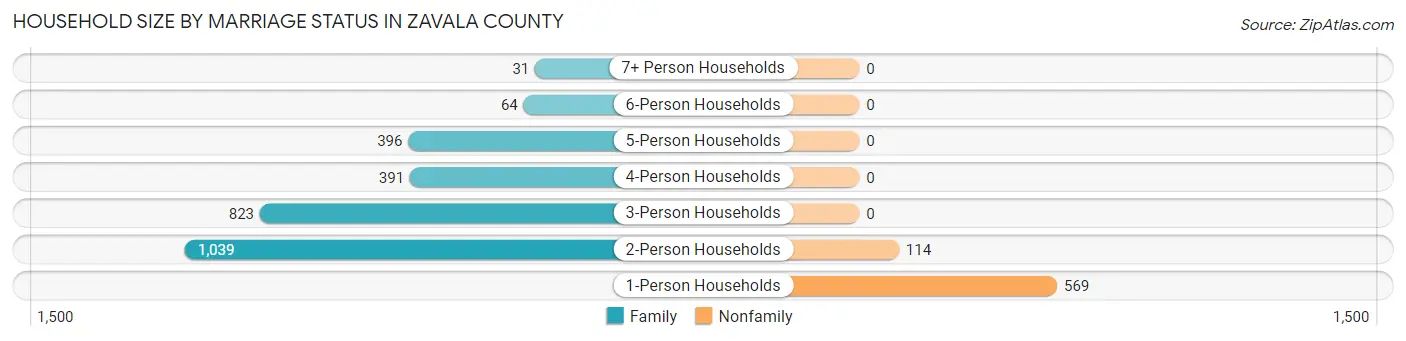
| Household Size | Family Households | Nonfamily Households |
| 1-Person Households | - | 569 (16.6%) |
| 2-Person Households | 1,039 (30.3%) | 114 (3.3%) |
| 3-Person Households | 823 (24.0%) | 0 (0.0%) |
| 4-Person Households | 391 (11.4%) | 0 (0.0%) |
| 5-Person Households | 396 (11.6%) | 0 (0.0%) |
| 6-Person Households | 64 (1.9%) | 0 (0.0%) |
| 7+ Person Households | 31 (0.9%) | 0 (0.0%) |
| Total | 2,744 (80.1%) | 683 (19.9%) |
Female Fertility in Zavala County
Fertility by Age in Zavala County
Average fertility rate in Zavala County is 40.0 births per 1,000 women. Women in the age bracket of 35 to 50 years have the highest fertility rate with 90.0 births per 1,000 women. Women in the age bracket of 35 to 50 years acount for 88.7% of all women with births.
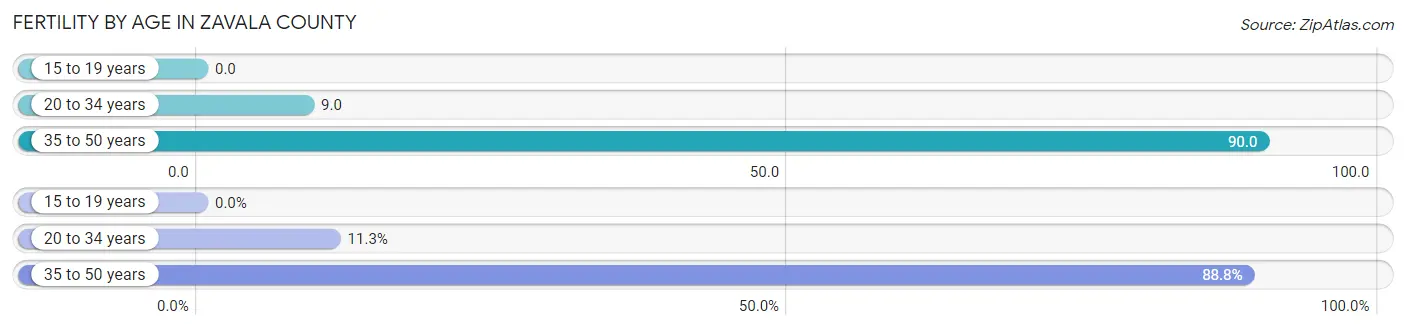
| Age Bracket | Women with Births | Births / 1,000 Women |
| 15 to 19 years | 0 (0.0%) | 0.0 |
| 20 to 34 years | 9 (11.3%) | 9.0 |
| 35 to 50 years | 71 (88.7%) | 90.0 |
| Total | 80 (100.0%) | 40.0 |
Fertility by Age by Marriage Status in Zavala County
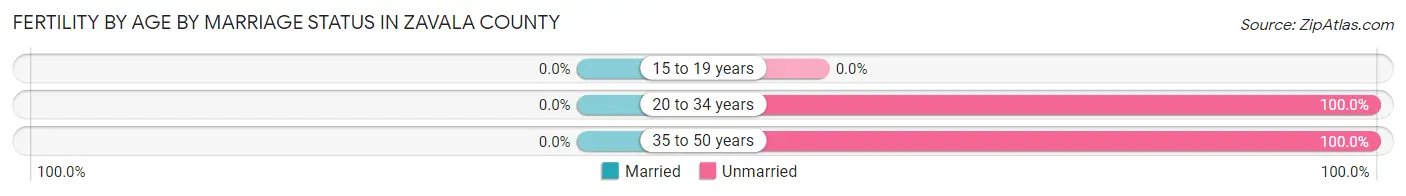
| Age Bracket | Married | Unmarried |
| 15 to 19 years | 0 (0.0%) | 0 (0.0%) |
| 20 to 34 years | 0 (0.0%) | 9 (100.0%) |
| 35 to 50 years | 0 (0.0%) | 71 (100.0%) |
| Total | 0 (0.0%) | 80 (100.0%) |
Fertility by Education in Zavala County
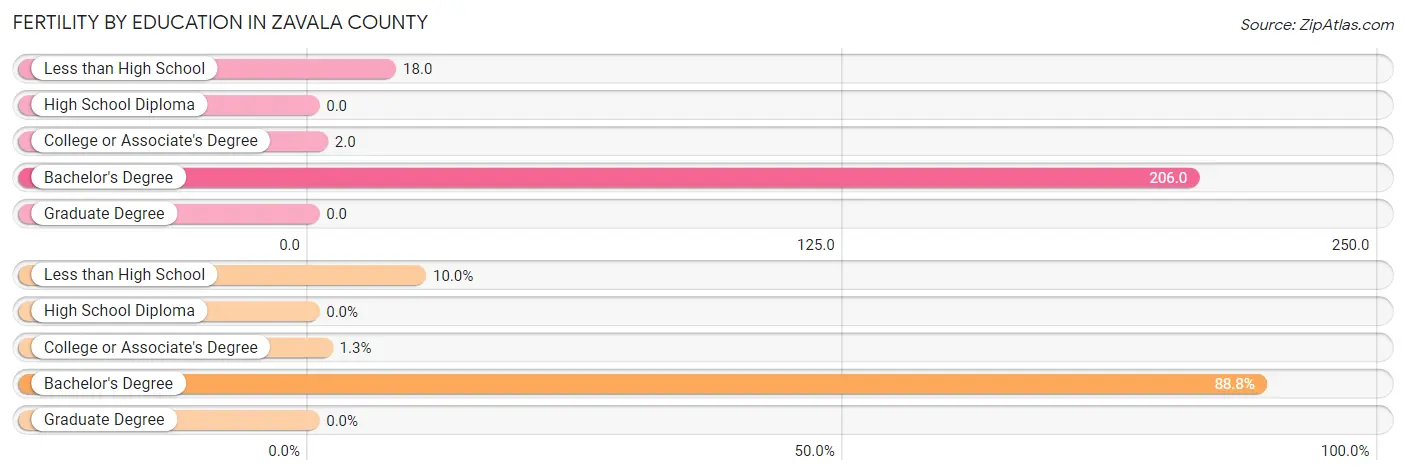
| Educational Attainment | Women with Births | Births / 1,000 Women |
| Less than High School | 8 (10.0%) | 18.0 |
| High School Diploma | 0 (0.0%) | 0.0 |
| College or Associate's Degree | 1 (1.3%) | 2.0 |
| Bachelor's Degree | 71 (88.7%) | 206.0 |
| Graduate Degree | 0 (0.0%) | 0.0 |
| Total | 80 (100.0%) | 40.0 |
Fertility by Education by Marriage Status in Zavala County
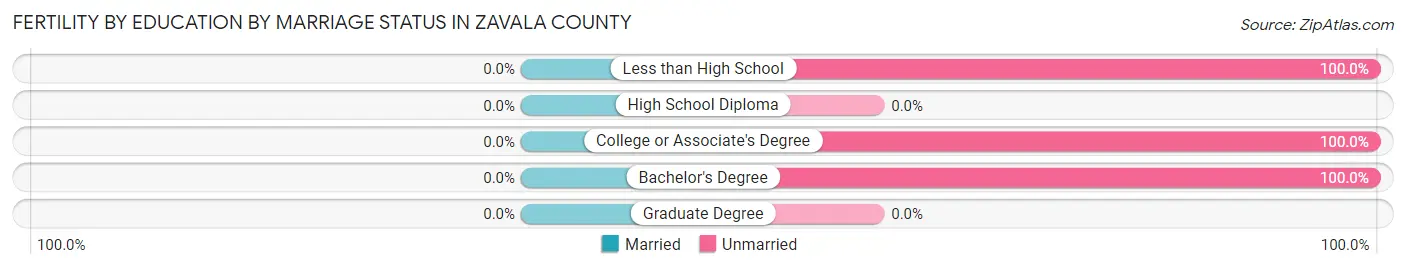
| Educational Attainment | Married | Unmarried |
| Less than High School | 0 (0.0%) | 8 (100.0%) |
| High School Diploma | 0 (0.0%) | 0 (0.0%) |
| College or Associate's Degree | 0 (0.0%) | 1 (100.0%) |
| Bachelor's Degree | 0 (0.0%) | 71 (100.0%) |
| Graduate Degree | 0 (0.0%) | 0 (0.0%) |
| Total | 0 (0.0%) | 80 (100.0%) |
Employment Characteristics in Zavala County
Employment by Class of Employer in Zavala County
Among the 3,612 employed individuals in Zavala County, private company employees (2,190 | 60.6%), local government employees (439 | 12.1%), and self-employed (not incorporated) (430 | 11.9%) make up the most common classes of employment.
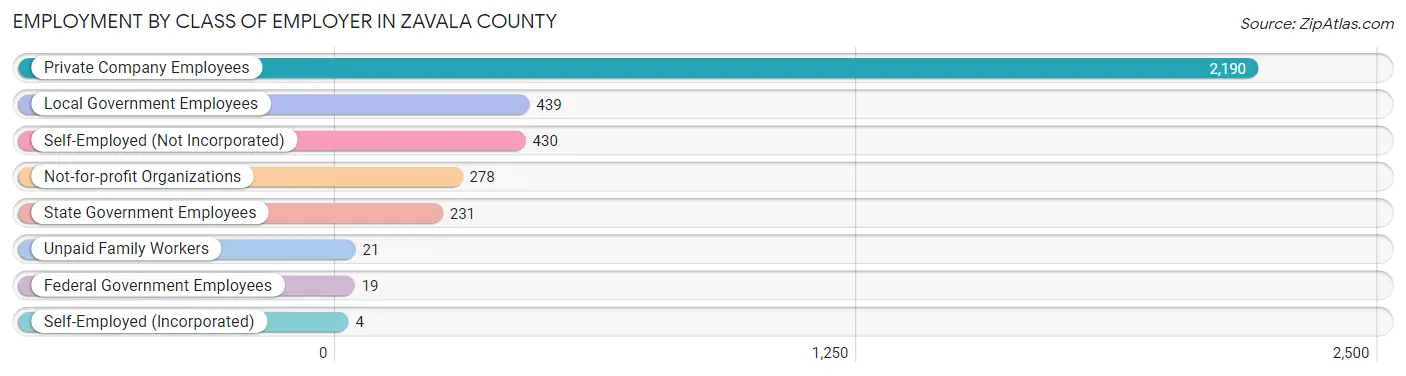
| Employer Class | # Employees | % Employees |
| Private Company Employees | 2,190 | 60.6% |
| Self-Employed (Incorporated) | 4 | 0.1% |
| Self-Employed (Not Incorporated) | 430 | 11.9% |
| Not-for-profit Organizations | 278 | 7.7% |
| Local Government Employees | 439 | 12.1% |
| State Government Employees | 231 | 6.4% |
| Federal Government Employees | 19 | 0.5% |
| Unpaid Family Workers | 21 | 0.6% |
| Total | 3,612 | 100.0% |
Employment Status by Age in Zavala County
According to the labor force statistics for Zavala County, out of the total population over 16 years of age (7,316), 55.3% or 4,046 individuals are in the labor force, with 5.8% or 235 of them unemployed. The age group with the highest labor force participation rate is 30 to 34 years, with 93.6% or 603 individuals in the labor force. Within the labor force, the 20 to 24 years age range has the highest percentage of unemployed individuals, with 33.0% or 180 of them being unemployed.
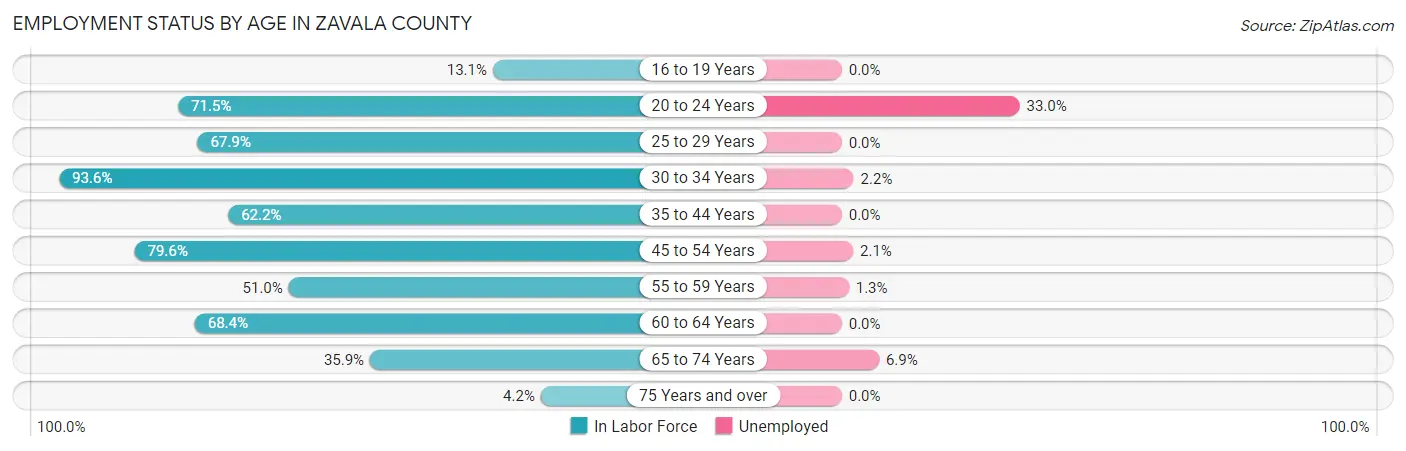
| Age Bracket | In Labor Force | Unemployed |
| 16 to 19 Years | 96 (13.1%) | 0 (0.0%) |
| 20 to 24 Years | 544 (71.5%) | 180 (33.0%) |
| 25 to 29 Years | 428 (67.9%) | 0 (0.0%) |
| 30 to 34 Years | 603 (93.6%) | 13 (2.2%) |
| 35 to 44 Years | 733 (62.2%) | 0 (0.0%) |
| 45 to 54 Years | 723 (79.6%) | 15 (2.1%) |
| 55 to 59 Years | 309 (51.0%) | 4 (1.3%) |
| 60 to 64 Years | 203 (68.4%) | 0 (0.0%) |
| 65 to 74 Years | 389 (35.9%) | 27 (6.9%) |
| 75 Years and over | 20 (4.2%) | 0 (0.0%) |
| Total | 4,046 (55.3%) | 235 (5.8%) |
Employment Status by Educational Attainment in Zavala County
According to labor force statistics for Zavala County, 70.3% of individuals (2,997) out of the total population between 25 and 64 years of age (4,263) are in the labor force, with 1.1% or 33 of them being unemployed. The group with the highest labor force participation rate are those with the educational attainment of bachelor's degree or higher, with 93.7% or 606 individuals in the labor force. Within the labor force, individuals with college / associate degree education have the highest percentage of unemployment, with 1.5% or 17 of them being unemployed.
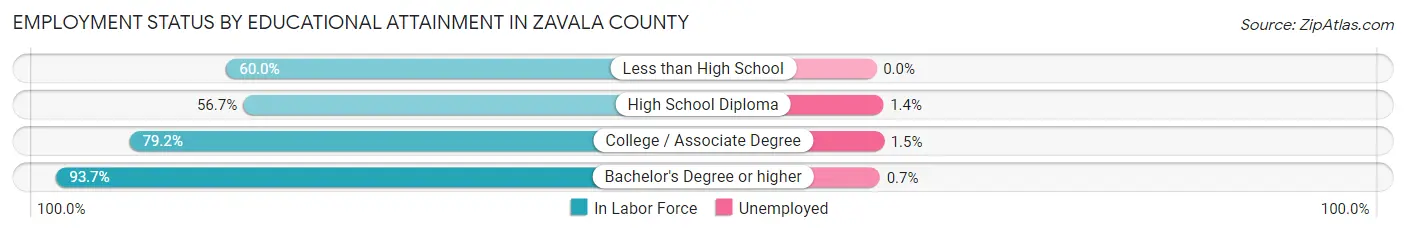
| Educational Attainment | In Labor Force | Unemployed |
| Less than High School | 517 (60.0%) | 0 (0.0%) |
| High School Diploma | 769 (56.7%) | 19 (1.4%) |
| College / Associate Degree | 1,107 (79.2%) | 21 (1.5%) |
| Bachelor's Degree or higher | 606 (93.7%) | 5 (0.7%) |
| Total | 2,997 (70.3%) | 47 (1.1%) |
Employment Occupations by Sex in Zavala County
Management, Business, Science and Arts Occupations
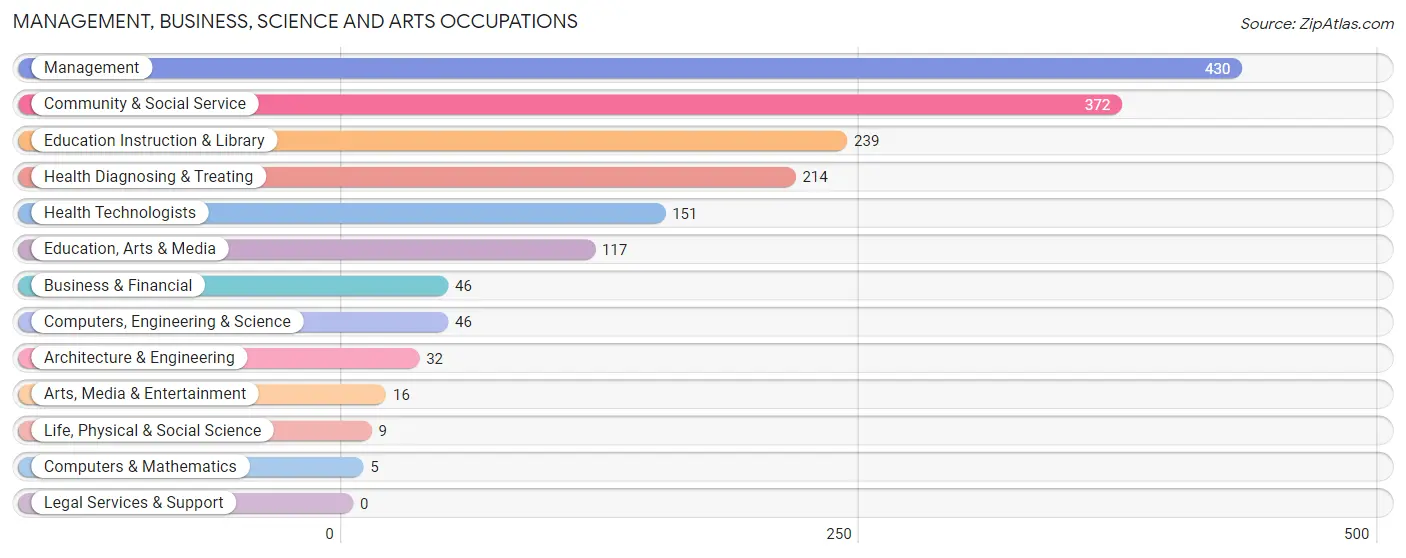
The most common Management, Business, Science and Arts occupations in Zavala County are Management (430 | 11.3%), Community & Social Service (372 | 9.8%), Education Instruction & Library (239 | 6.3%), Health Diagnosing & Treating (214 | 5.6%), and Health Technologists (151 | 4.0%).
Management, Business, Science and Arts Occupations by Sex
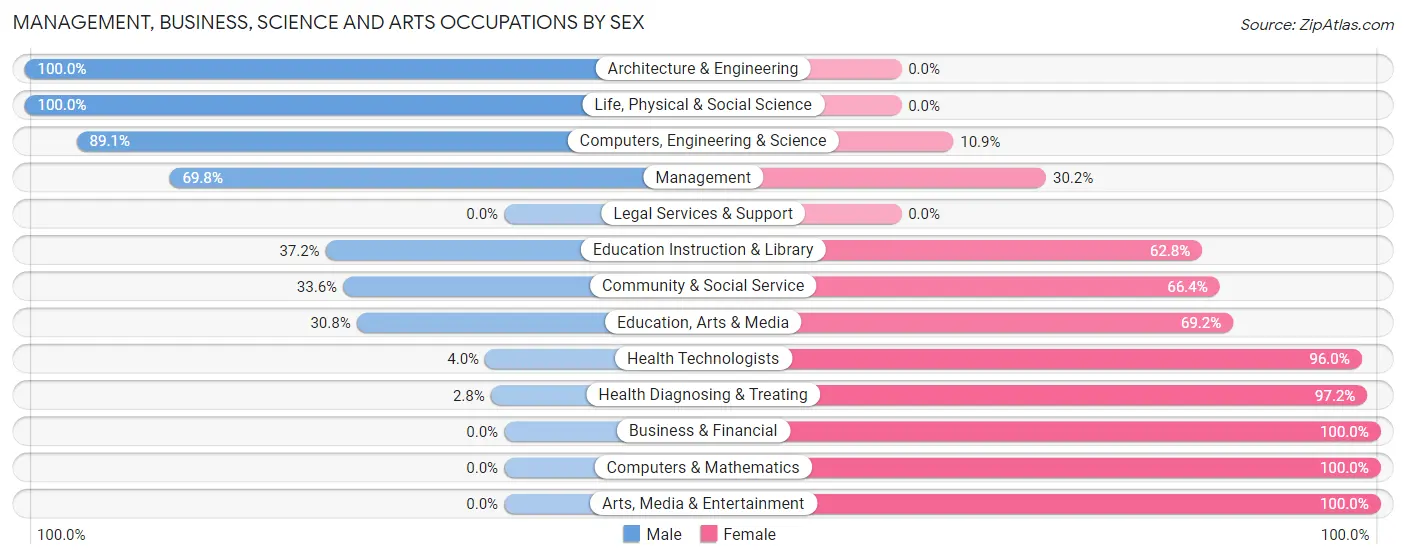
Within the Management, Business, Science and Arts occupations in Zavala County, the most male-oriented occupations are Architecture & Engineering (100.0%), Life, Physical & Social Science (100.0%), and Computers, Engineering & Science (89.1%), while the most female-oriented occupations are Business & Financial (100.0%), Computers & Mathematics (100.0%), and Arts, Media & Entertainment (100.0%).
| Occupation | Male | Female |
| Management | 300 (69.8%) | 130 (30.2%) |
| Business & Financial | 0 (0.0%) | 46 (100.0%) |
| Computers, Engineering & Science | 41 (89.1%) | 5 (10.9%) |
| Computers & Mathematics | 0 (0.0%) | 5 (100.0%) |
| Architecture & Engineering | 32 (100.0%) | 0 (0.0%) |
| Life, Physical & Social Science | 9 (100.0%) | 0 (0.0%) |
| Community & Social Service | 125 (33.6%) | 247 (66.4%) |
| Education, Arts & Media | 36 (30.8%) | 81 (69.2%) |
| Legal Services & Support | 0 (0.0%) | 0 (0.0%) |
| Education Instruction & Library | 89 (37.2%) | 150 (62.8%) |
| Arts, Media & Entertainment | 0 (0.0%) | 16 (100.0%) |
| Health Diagnosing & Treating | 6 (2.8%) | 208 (97.2%) |
| Health Technologists | 6 (4.0%) | 145 (96.0%) |
| Total (Category) | 472 (42.6%) | 636 (57.4%) |
| Total (Overall) | 2,217 (58.4%) | 1,580 (41.6%) |
Services Occupations
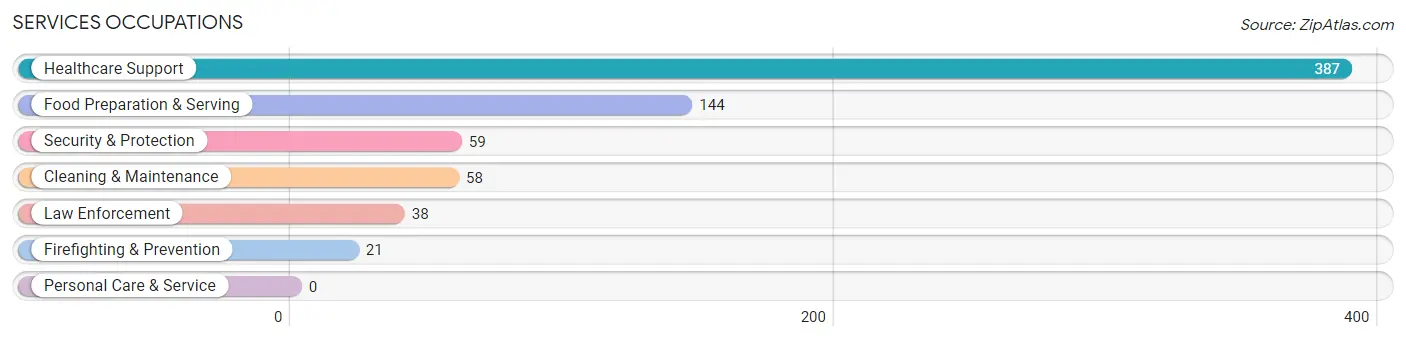
The most common Services occupations in Zavala County are Healthcare Support (387 | 10.2%), Food Preparation & Serving (144 | 3.8%), Security & Protection (59 | 1.5%), Cleaning & Maintenance (58 | 1.5%), and Law Enforcement (38 | 1.0%).
Services Occupations by Sex
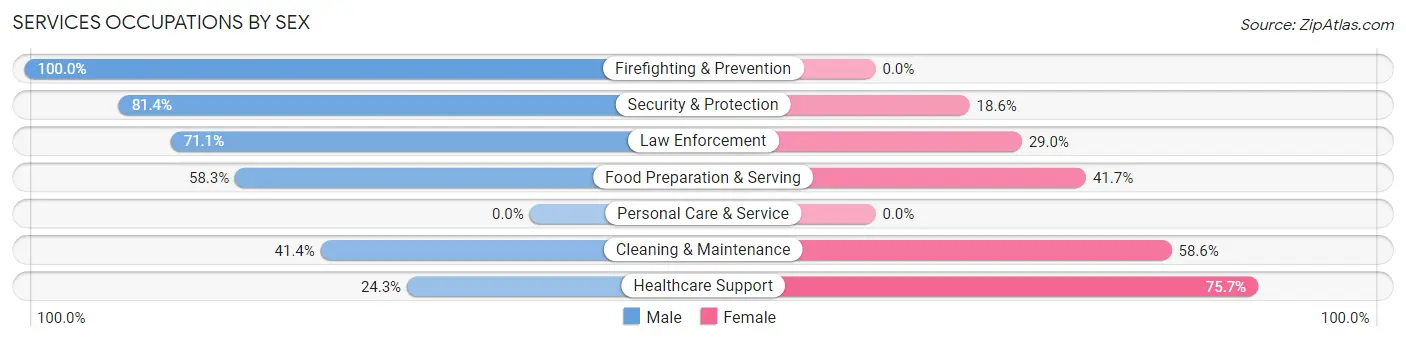
Within the Services occupations in Zavala County, the most male-oriented occupations are Firefighting & Prevention (100.0%), Security & Protection (81.4%), and Law Enforcement (71.1%), while the most female-oriented occupations are Healthcare Support (75.7%), Cleaning & Maintenance (58.6%), and Food Preparation & Serving (41.7%).
| Occupation | Male | Female |
| Healthcare Support | 94 (24.3%) | 293 (75.7%) |
| Security & Protection | 48 (81.4%) | 11 (18.6%) |
| Firefighting & Prevention | 21 (100.0%) | 0 (0.0%) |
| Law Enforcement | 27 (71.1%) | 11 (28.9%) |
| Food Preparation & Serving | 84 (58.3%) | 60 (41.7%) |
| Cleaning & Maintenance | 24 (41.4%) | 34 (58.6%) |
| Personal Care & Service | 0 (0.0%) | 0 (0.0%) |
| Total (Category) | 250 (38.6%) | 398 (61.4%) |
| Total (Overall) | 2,217 (58.4%) | 1,580 (41.6%) |
Sales and Office Occupations
The most common Sales and Office occupations in Zavala County are Office & Administration (360 | 9.5%), and Sales & Related (251 | 6.6%).

Sales and Office Occupations by Sex

| Occupation | Male | Female |
| Sales & Related | 99 (39.4%) | 152 (60.6%) |
| Office & Administration | 46 (12.8%) | 314 (87.2%) |
| Total (Category) | 145 (23.7%) | 466 (76.3%) |
| Total (Overall) | 2,217 (58.4%) | 1,580 (41.6%) |
Natural Resources, Construction and Maintenance Occupations
The most common Natural Resources, Construction and Maintenance occupations in Zavala County are Construction & Extraction (409 | 10.8%), Installation, Maintenance & Repair (304 | 8.0%), and Farming, Fishing & Forestry (101 | 2.7%).
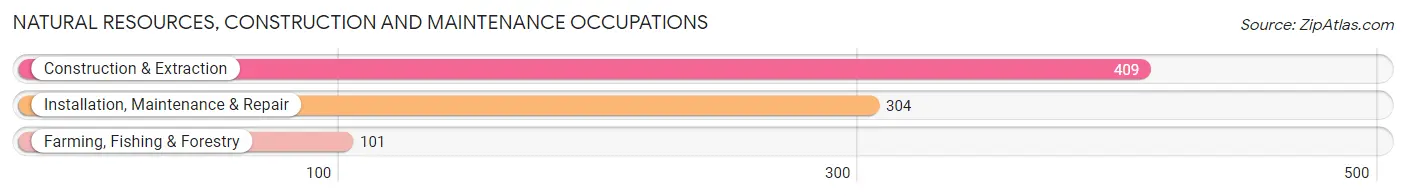
Natural Resources, Construction and Maintenance Occupations by Sex
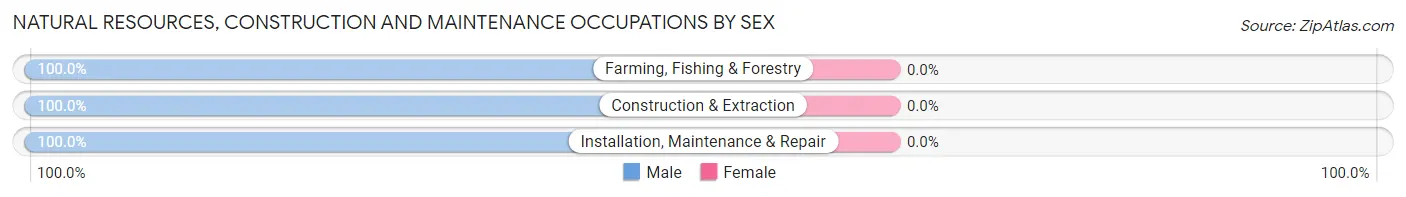
| Occupation | Male | Female |
| Farming, Fishing & Forestry | 101 (100.0%) | 0 (0.0%) |
| Construction & Extraction | 409 (100.0%) | 0 (0.0%) |
| Installation, Maintenance & Repair | 304 (100.0%) | 0 (0.0%) |
| Total (Category) | 814 (100.0%) | 0 (0.0%) |
| Total (Overall) | 2,217 (58.4%) | 1,580 (41.6%) |
Production, Transportation and Moving Occupations
The most common Production, Transportation and Moving occupations in Zavala County are Material Moving (326 | 8.6%), Transportation (172 | 4.5%), and Production (118 | 3.1%).
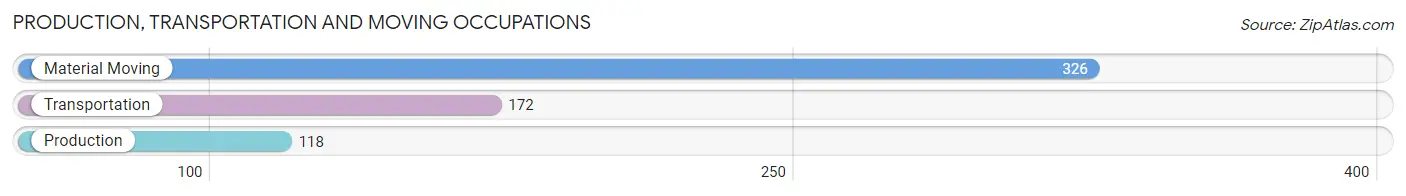
Production, Transportation and Moving Occupations by Sex
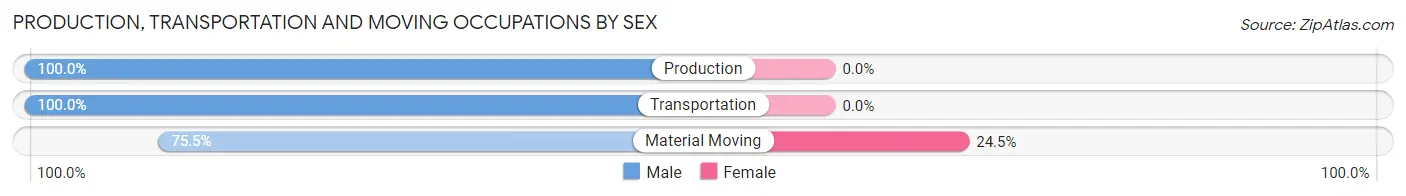
| Occupation | Male | Female |
| Production | 118 (100.0%) | 0 (0.0%) |
| Transportation | 172 (100.0%) | 0 (0.0%) |
| Material Moving | 246 (75.5%) | 80 (24.5%) |
| Total (Category) | 536 (87.0%) | 80 (13.0%) |
| Total (Overall) | 2,217 (58.4%) | 1,580 (41.6%) |
Employment Industries by Sex in Zavala County
Employment Industries in Zavala County
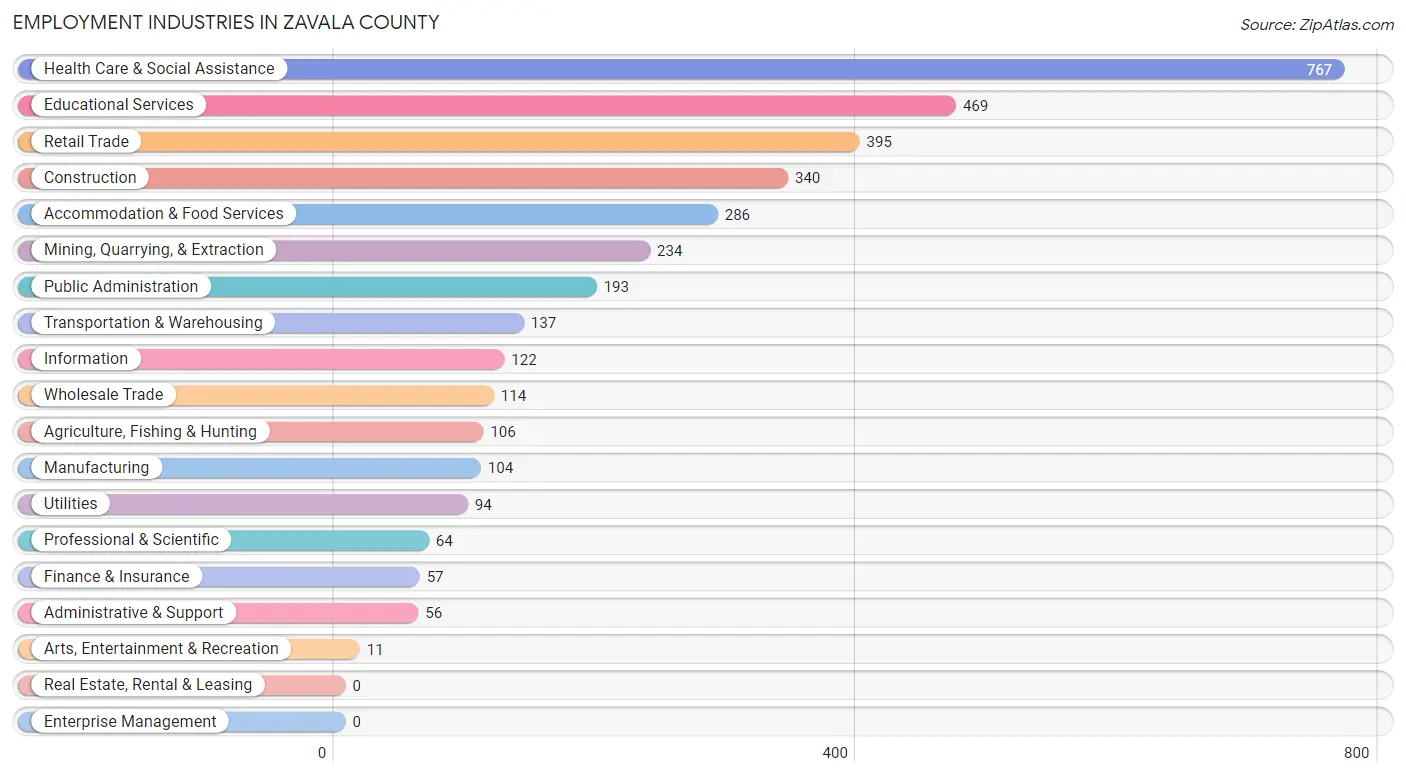
The major employment industries in Zavala County include Health Care & Social Assistance (767 | 20.2%), Educational Services (469 | 12.3%), Retail Trade (395 | 10.4%), Construction (340 | 8.9%), and Accommodation & Food Services (286 | 7.5%).
Employment Industries by Sex in Zavala County
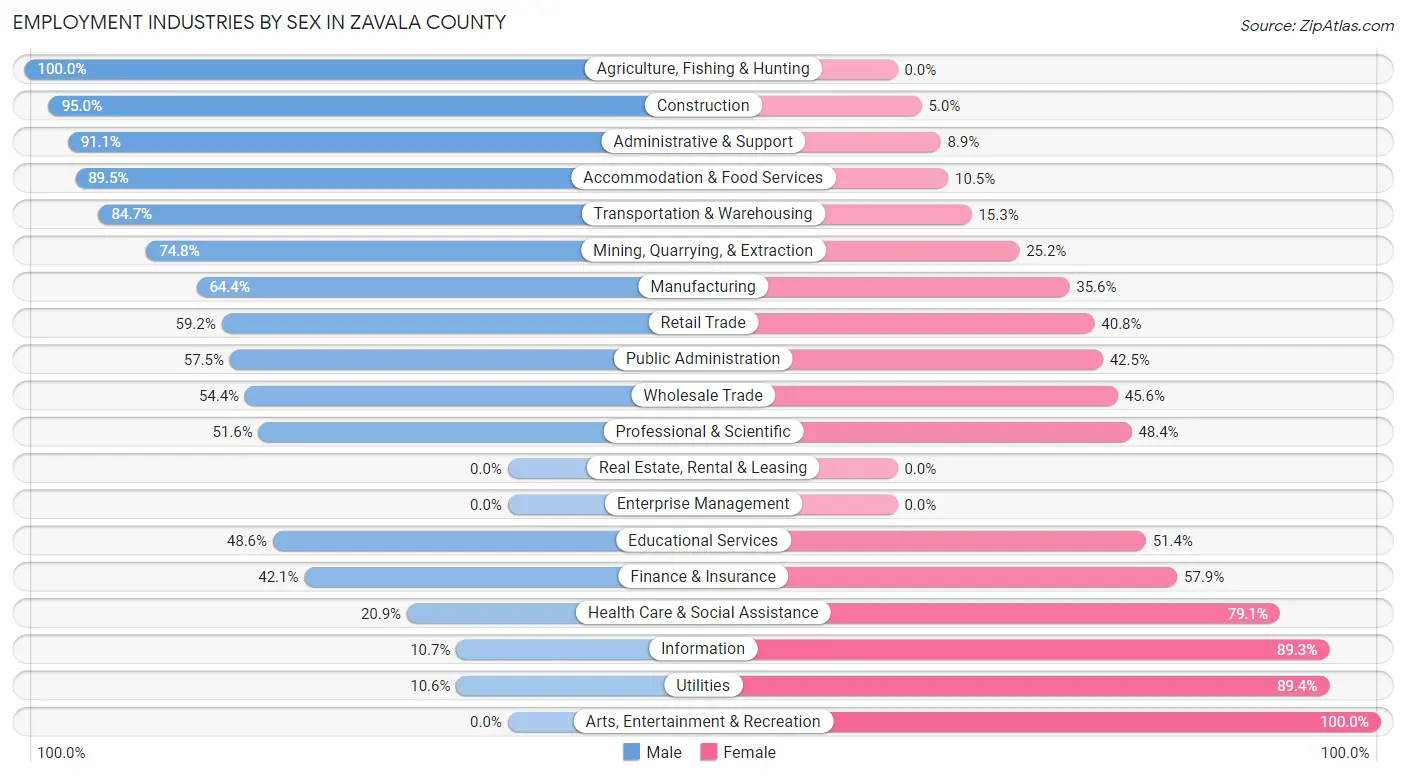
The Zavala County industries that see more men than women are Agriculture, Fishing & Hunting (100.0%), Construction (95.0%), and Administrative & Support (91.1%), whereas the industries that tend to have a higher number of women are Arts, Entertainment & Recreation (100.0%), Utilities (89.4%), and Information (89.3%).
| Industry | Male | Female |
| Agriculture, Fishing & Hunting | 106 (100.0%) | 0 (0.0%) |
| Mining, Quarrying, & Extraction | 175 (74.8%) | 59 (25.2%) |
| Construction | 323 (95.0%) | 17 (5.0%) |
| Manufacturing | 67 (64.4%) | 37 (35.6%) |
| Wholesale Trade | 62 (54.4%) | 52 (45.6%) |
| Retail Trade | 234 (59.2%) | 161 (40.8%) |
| Transportation & Warehousing | 116 (84.7%) | 21 (15.3%) |
| Utilities | 10 (10.6%) | 84 (89.4%) |
| Information | 13 (10.7%) | 109 (89.3%) |
| Finance & Insurance | 24 (42.1%) | 33 (57.9%) |
| Real Estate, Rental & Leasing | 0 (0.0%) | 0 (0.0%) |
| Professional & Scientific | 33 (51.6%) | 31 (48.4%) |
| Enterprise Management | 0 (0.0%) | 0 (0.0%) |
| Administrative & Support | 51 (91.1%) | 5 (8.9%) |
| Educational Services | 228 (48.6%) | 241 (51.4%) |
| Health Care & Social Assistance | 160 (20.9%) | 607 (79.1%) |
| Arts, Entertainment & Recreation | 0 (0.0%) | 11 (100.0%) |
| Accommodation & Food Services | 256 (89.5%) | 30 (10.5%) |
| Public Administration | 111 (57.5%) | 82 (42.5%) |
| Total | 2,217 (58.4%) | 1,580 (41.6%) |
Education in Zavala County
School Enrollment in Zavala County
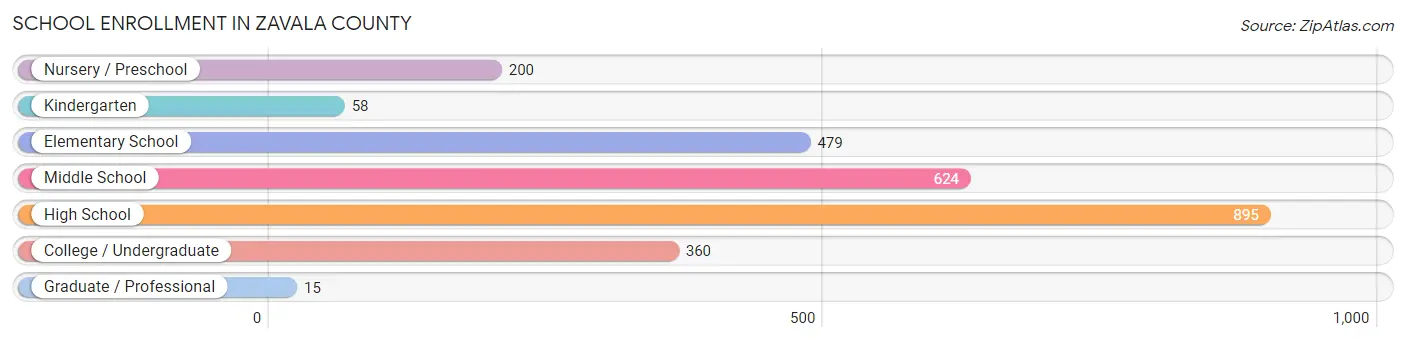
The most common levels of schooling among the 2,631 students in Zavala County are high school (895 | 34.0%), middle school (624 | 23.7%), and elementary school (479 | 18.2%).
| School Level | # Students | % Students |
| Nursery / Preschool | 200 | 7.6% |
| Kindergarten | 58 | 2.2% |
| Elementary School | 479 | 18.2% |
| Middle School | 624 | 23.7% |
| High School | 895 | 34.0% |
| College / Undergraduate | 360 | 13.7% |
| Graduate / Professional | 15 | 0.6% |
| Total | 2,631 | 100.0% |
School Enrollment by Age by Funding Source in Zavala County
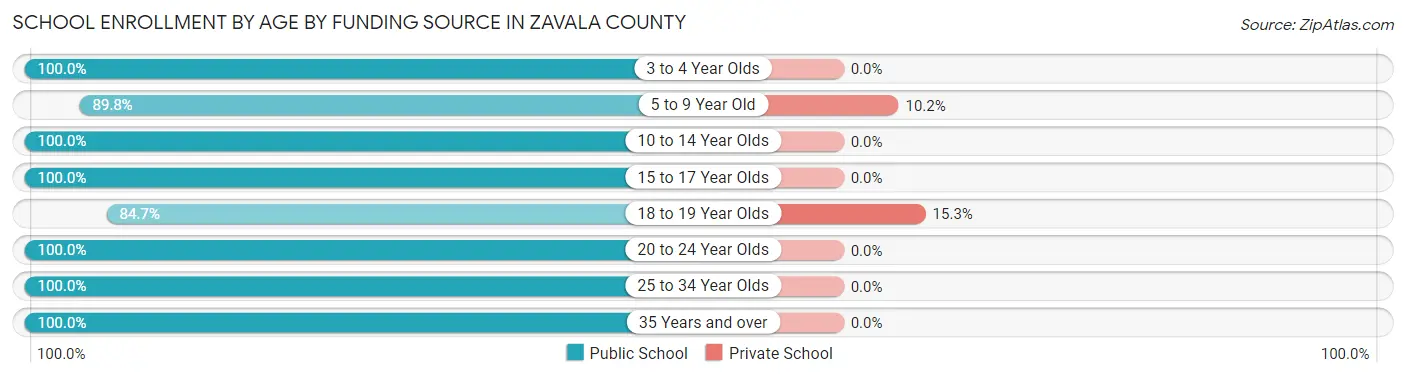
Out of a total of 2,631 students who are enrolled in schools in Zavala County, 100 (3.8%) attend a private institution, while the remaining 2,531 (96.2%) are enrolled in public schools. The age group of 18 to 19 year olds has the highest likelihood of being enrolled in private schools, with 31 (15.3% in the age bracket) enrolled. Conversely, the age group of 3 to 4 year olds has the lowest likelihood of being enrolled in a private school, with 66 (100.0% in the age bracket) attending a public institution.
| Age Bracket | Public School | Private School |
| 3 to 4 Year Olds | 66 (100.0%) | 0 (0.0%) |
| 5 to 9 Year Old | 606 (89.8%) | 69 (10.2%) |
| 10 to 14 Year Olds | 849 (100.0%) | 0 (0.0%) |
| 15 to 17 Year Olds | 536 (100.0%) | 0 (0.0%) |
| 18 to 19 Year Olds | 172 (84.7%) | 31 (15.3%) |
| 20 to 24 Year Olds | 224 (100.0%) | 0 (0.0%) |
| 25 to 34 Year Olds | 55 (100.0%) | 0 (0.0%) |
| 35 Years and over | 23 (100.0%) | 0 (0.0%) |
| Total | 2,531 (96.2%) | 100 (3.8%) |
Educational Attainment by Field of Study in Zavala County
Education (277 | 34.6%), science & technology (210 | 26.2%), computers & mathematics (98 | 12.2%), social sciences (67 | 8.4%), and business (63 | 7.9%) are the most common fields of study among 801 individuals in Zavala County who have obtained a bachelor's degree or higher.
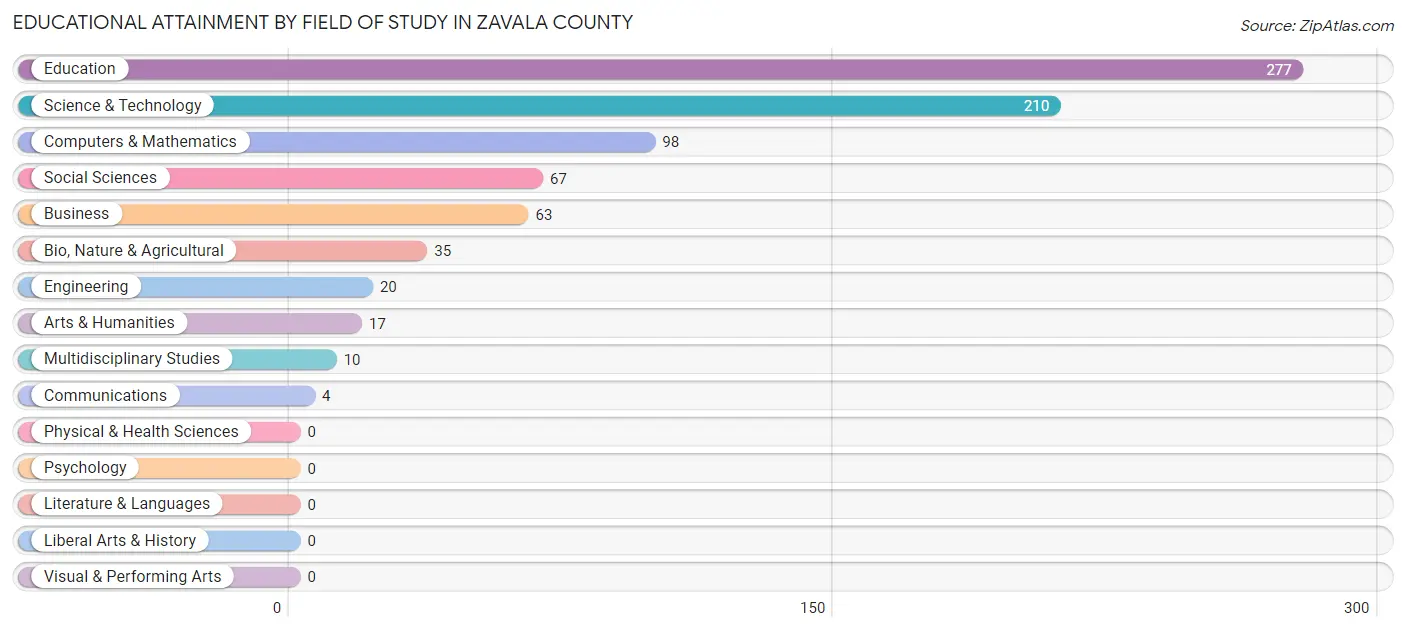
| Field of Study | # Graduates | % Graduates |
| Computers & Mathematics | 98 | 12.2% |
| Bio, Nature & Agricultural | 35 | 4.4% |
| Physical & Health Sciences | 0 | 0.0% |
| Psychology | 0 | 0.0% |
| Social Sciences | 67 | 8.4% |
| Engineering | 20 | 2.5% |
| Multidisciplinary Studies | 10 | 1.3% |
| Science & Technology | 210 | 26.2% |
| Business | 63 | 7.9% |
| Education | 277 | 34.6% |
| Literature & Languages | 0 | 0.0% |
| Liberal Arts & History | 0 | 0.0% |
| Visual & Performing Arts | 0 | 0.0% |
| Communications | 4 | 0.5% |
| Arts & Humanities | 17 | 2.1% |
| Total | 801 | 100.0% |
Transportation & Commute in Zavala County
Vehicle Availability by Sex in Zavala County
The most prevalent vehicle ownership categories in Zavala County are males with 2 vehicles (759, accounting for 36.8%) and females with 2 vehicles (551, making up 49.0%).
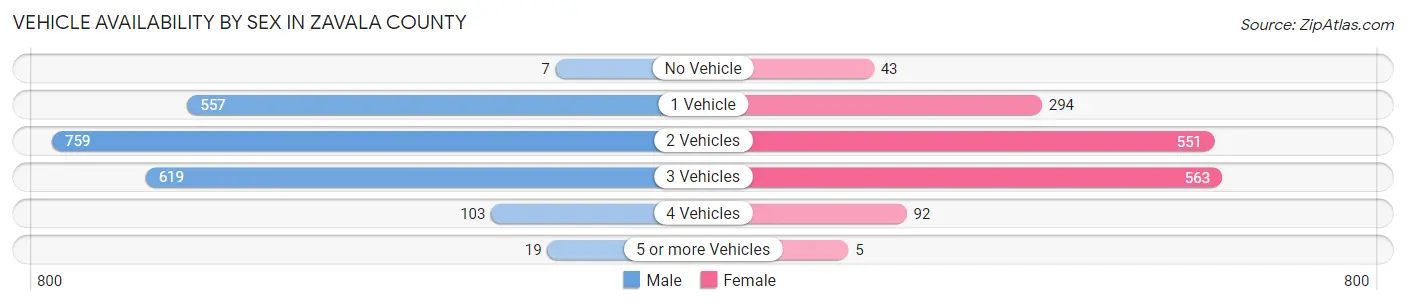
| Vehicles Available | Male | Female |
| No Vehicle | 7 (0.3%) | 43 (2.8%) |
| 1 Vehicle | 557 (27.0%) | 294 (19.0%) |
| 2 Vehicles | 759 (36.8%) | 551 (35.6%) |
| 3 Vehicles | 619 (30.0%) | 563 (36.4%) |
| 4 Vehicles | 103 (5.0%) | 92 (5.9%) |
| 5 or more Vehicles | 19 (0.9%) | 5 (0.3%) |
| Total | 2,064 (100.0%) | 1,548 (100.0%) |
Commute Time in Zavala County
The most frequently occuring commute durations in Zavala County are 5 to 9 minutes (747 commuters, 21.5%), 10 to 14 minutes (646 commuters, 18.6%), and 15 to 19 minutes (484 commuters, 13.9%).
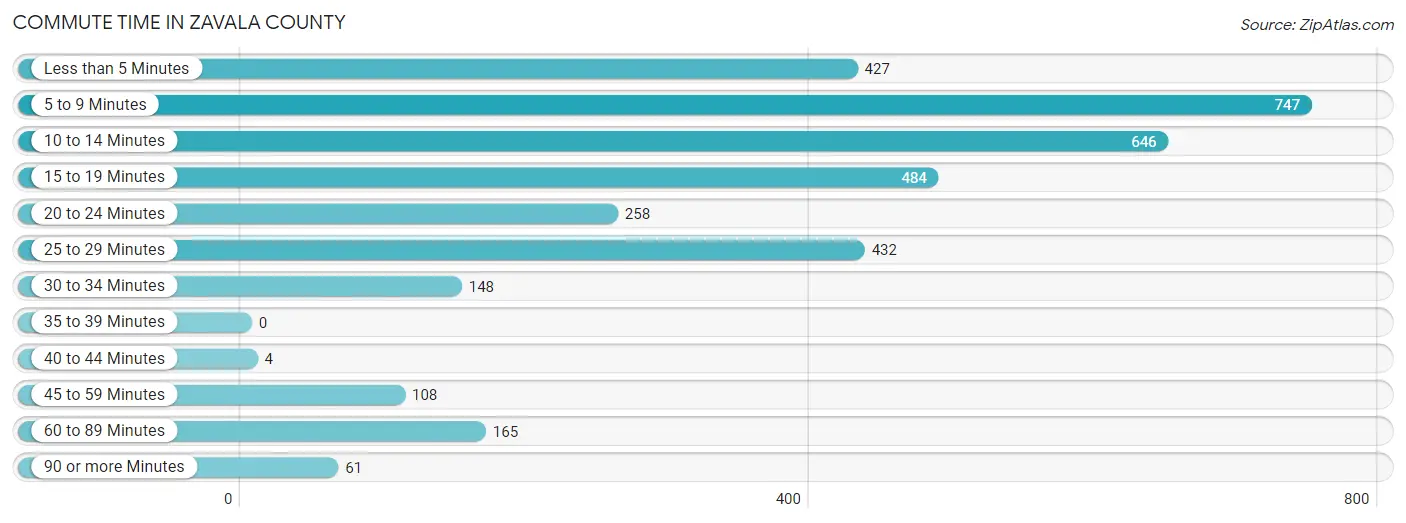
| Commute Time | # Commuters | % Commuters |
| Less than 5 Minutes | 427 | 12.3% |
| 5 to 9 Minutes | 747 | 21.5% |
| 10 to 14 Minutes | 646 | 18.6% |
| 15 to 19 Minutes | 484 | 13.9% |
| 20 to 24 Minutes | 258 | 7.4% |
| 25 to 29 Minutes | 432 | 12.4% |
| 30 to 34 Minutes | 148 | 4.3% |
| 35 to 39 Minutes | 0 | 0.0% |
| 40 to 44 Minutes | 4 | 0.1% |
| 45 to 59 Minutes | 108 | 3.1% |
| 60 to 89 Minutes | 165 | 4.7% |
| 90 or more Minutes | 61 | 1.8% |
Commute Time by Sex in Zavala County
The most common commute times in Zavala County are 10 to 14 minutes (401 commuters, 19.7%) for males and 5 to 9 minutes (449 commuters, 31.0%) for females.
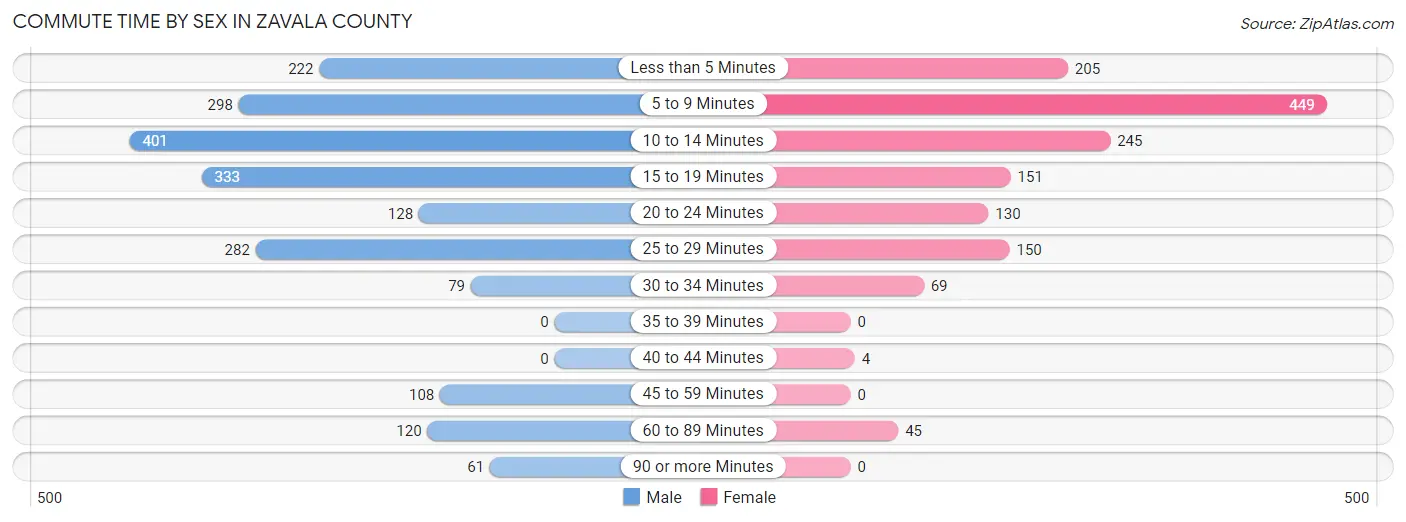
| Commute Time | Male | Female |
| Less than 5 Minutes | 222 (10.9%) | 205 (14.2%) |
| 5 to 9 Minutes | 298 (14.7%) | 449 (31.0%) |
| 10 to 14 Minutes | 401 (19.7%) | 245 (16.9%) |
| 15 to 19 Minutes | 333 (16.4%) | 151 (10.4%) |
| 20 to 24 Minutes | 128 (6.3%) | 130 (9.0%) |
| 25 to 29 Minutes | 282 (13.9%) | 150 (10.4%) |
| 30 to 34 Minutes | 79 (3.9%) | 69 (4.8%) |
| 35 to 39 Minutes | 0 (0.0%) | 0 (0.0%) |
| 40 to 44 Minutes | 0 (0.0%) | 4 (0.3%) |
| 45 to 59 Minutes | 108 (5.3%) | 0 (0.0%) |
| 60 to 89 Minutes | 120 (5.9%) | 45 (3.1%) |
| 90 or more Minutes | 61 (3.0%) | 0 (0.0%) |
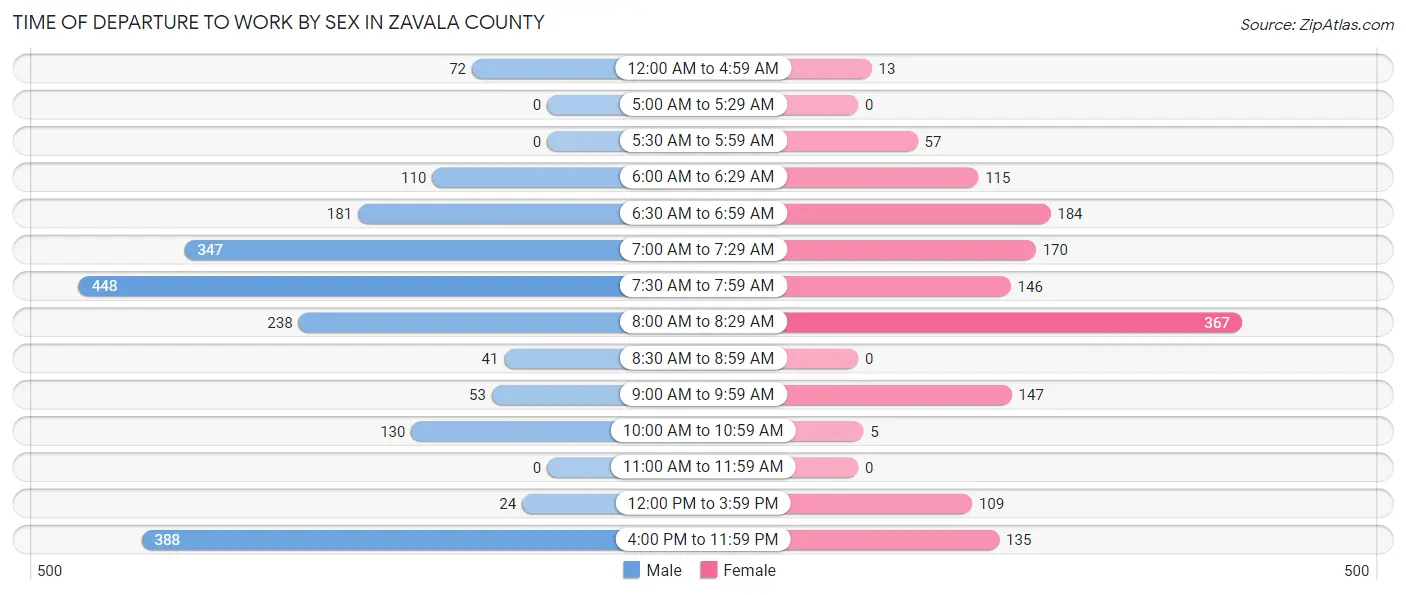
Time of Departure to Work by Sex in Zavala County
The most frequent times of departure to work in Zavala County are 7:30 AM to 7:59 AM (448, 22.1%) for males and 8:00 AM to 8:29 AM (367, 25.4%) for females.
| Time of Departure | Male | Female |
| 12:00 AM to 4:59 AM | 72 (3.5%) | 13 (0.9%) |
| 5:00 AM to 5:29 AM | 0 (0.0%) | 0 (0.0%) |
| 5:30 AM to 5:59 AM | 0 (0.0%) | 57 (3.9%) |
| 6:00 AM to 6:29 AM | 110 (5.4%) | 115 (7.9%) |
| 6:30 AM to 6:59 AM | 181 (8.9%) | 184 (12.7%) |
| 7:00 AM to 7:29 AM | 347 (17.1%) | 170 (11.7%) |
| 7:30 AM to 7:59 AM | 448 (22.1%) | 146 (10.1%) |
| 8:00 AM to 8:29 AM | 238 (11.7%) | 367 (25.4%) |
| 8:30 AM to 8:59 AM | 41 (2.0%) | 0 (0.0%) |
| 9:00 AM to 9:59 AM | 53 (2.6%) | 147 (10.2%) |
| 10:00 AM to 10:59 AM | 130 (6.4%) | 5 (0.4%) |
| 11:00 AM to 11:59 AM | 0 (0.0%) | 0 (0.0%) |
| 12:00 PM to 3:59 PM | 24 (1.2%) | 109 (7.5%) |
| 4:00 PM to 11:59 PM | 388 (19.1%) | 135 (9.3%) |
| Total | 2,032 (100.0%) | 1,448 (100.0%) |
Housing Occupancy in Zavala County
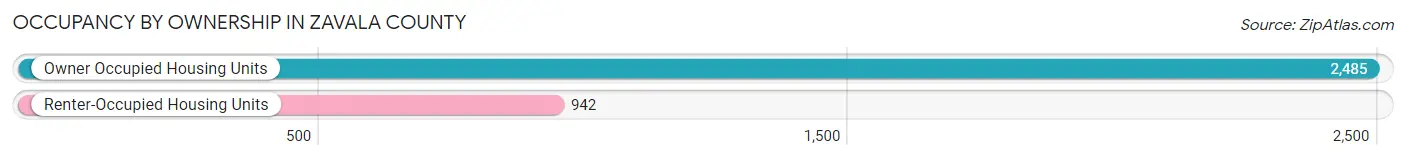
Occupancy by Ownership in Zavala County
Of the total 3,427 dwellings in Zavala County, owner-occupied units account for 2,485 (72.5%), while renter-occupied units make up 942 (27.5%).
| Occupancy | # Housing Units | % Housing Units |
| Owner Occupied Housing Units | 2,485 | 72.5% |
| Renter-Occupied Housing Units | 942 | 27.5% |
| Total Occupied Housing Units | 3,427 | 100.0% |
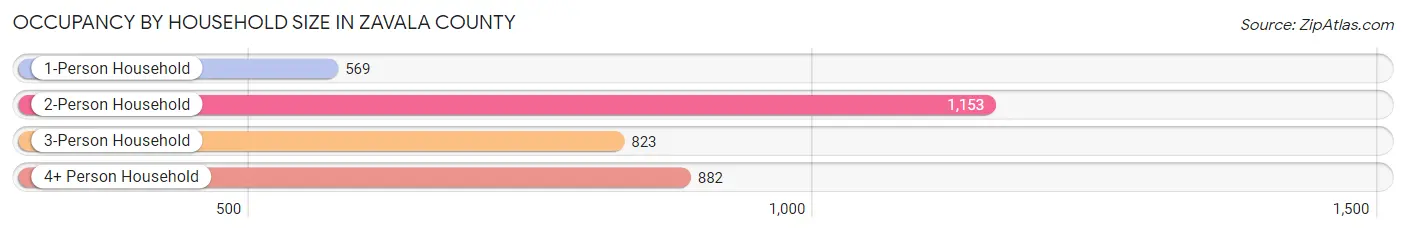
Occupancy by Household Size in Zavala County
| Household Size | # Housing Units | % Housing Units |
| 1-Person Household | 569 | 16.6% |
| 2-Person Household | 1,153 | 33.6% |
| 3-Person Household | 823 | 24.0% |
| 4+ Person Household | 882 | 25.7% |
| Total Housing Units | 3,427 | 100.0% |
Occupancy by Ownership by Household Size in Zavala County
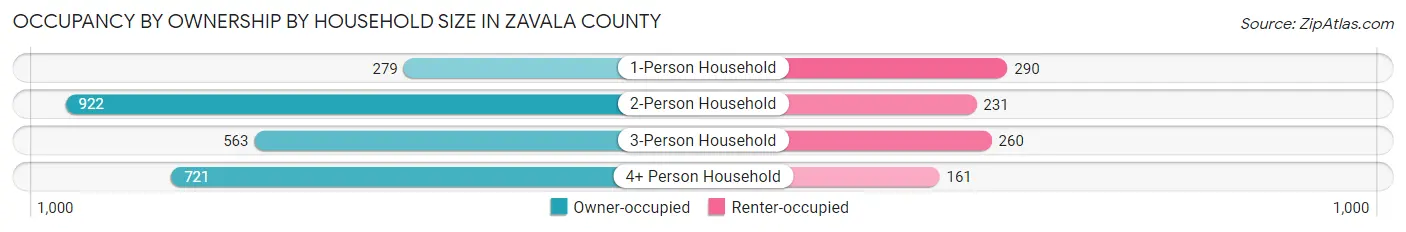
| Household Size | Owner-occupied | Renter-occupied |
| 1-Person Household | 279 (49.0%) | 290 (51.0%) |
| 2-Person Household | 922 (80.0%) | 231 (20.0%) |
| 3-Person Household | 563 (68.4%) | 260 (31.6%) |
| 4+ Person Household | 721 (81.8%) | 161 (18.2%) |
| Total Housing Units | 2,485 (72.5%) | 942 (27.5%) |
Occupancy by Educational Attainment in Zavala County
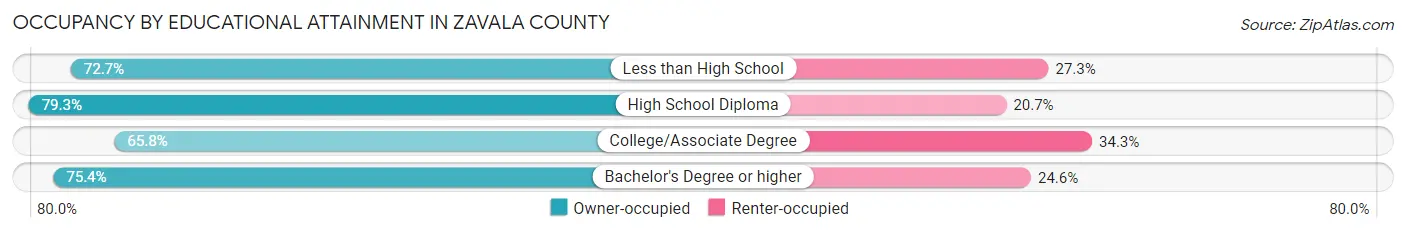
| Household Size | Owner-occupied | Renter-occupied |
| Less than High School | 590 (72.7%) | 222 (27.3%) |
| High School Diploma | 795 (79.3%) | 207 (20.7%) |
| College/Associate Degree | 793 (65.7%) | 413 (34.3%) |
| Bachelor's Degree or higher | 307 (75.4%) | 100 (24.6%) |
Occupancy by Age of Householder in Zavala County
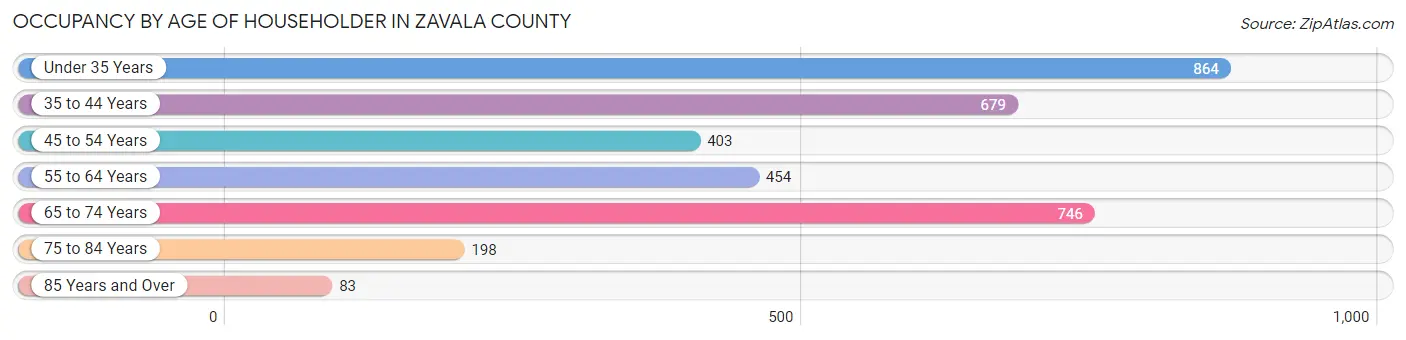
| Age Bracket | # Households | % Households |
| Under 35 Years | 864 | 25.2% |
| 35 to 44 Years | 679 | 19.8% |
| 45 to 54 Years | 403 | 11.8% |
| 55 to 64 Years | 454 | 13.3% |
| 65 to 74 Years | 746 | 21.8% |
| 75 to 84 Years | 198 | 5.8% |
| 85 Years and Over | 83 | 2.4% |
| Total | 3,427 | 100.0% |
Housing Finances in Zavala County
Median Income by Occupancy in Zavala County
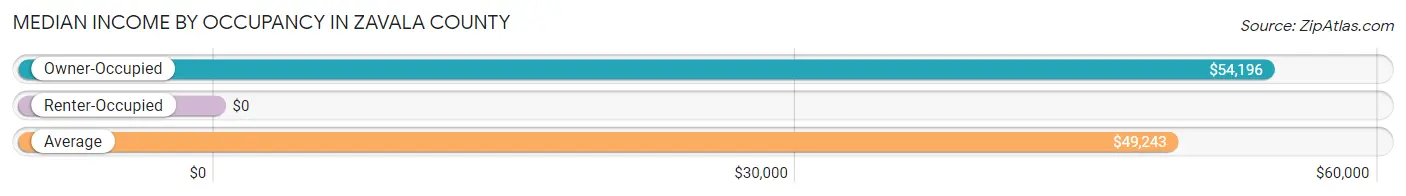
| Occupancy Type | # Households | Median Income |
| Owner-Occupied | 2,485 (72.5%) | $54,196 |
| Renter-Occupied | 942 (27.5%) | $0 |
| Average | 3,427 (100.0%) | $49,243 |
Occupancy by Householder Income Bracket in Zavala County
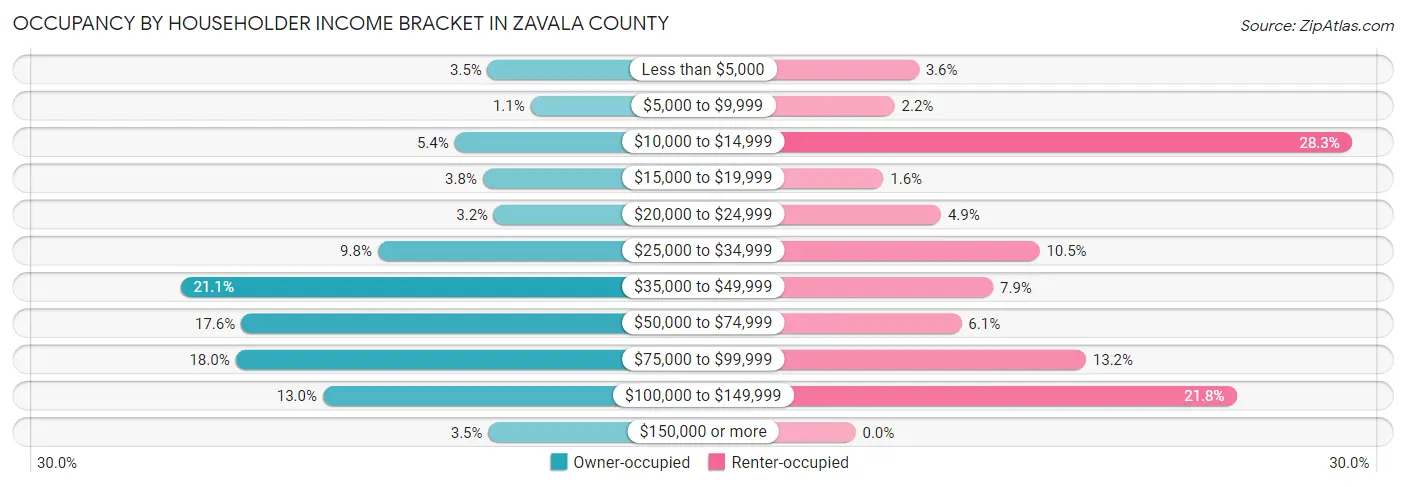
| Income Bracket | Owner-occupied | Renter-occupied |
| Less than $5,000 | 88 (3.5%) | 34 (3.6%) |
| $5,000 to $9,999 | 27 (1.1%) | 21 (2.2%) |
| $10,000 to $14,999 | 135 (5.4%) | 267 (28.3%) |
| $15,000 to $19,999 | 95 (3.8%) | 15 (1.6%) |
| $20,000 to $24,999 | 79 (3.2%) | 46 (4.9%) |
| $25,000 to $34,999 | 244 (9.8%) | 99 (10.5%) |
| $35,000 to $49,999 | 524 (21.1%) | 74 (7.9%) |
| $50,000 to $74,999 | 438 (17.6%) | 57 (6.0%) |
| $75,000 to $99,999 | 446 (17.9%) | 124 (13.2%) |
| $100,000 to $149,999 | 322 (13.0%) | 205 (21.8%) |
| $150,000 or more | 87 (3.5%) | 0 (0.0%) |
| Total | 2,485 (100.0%) | 942 (100.0%) |
Monthly Housing Cost Tiers in Zavala County
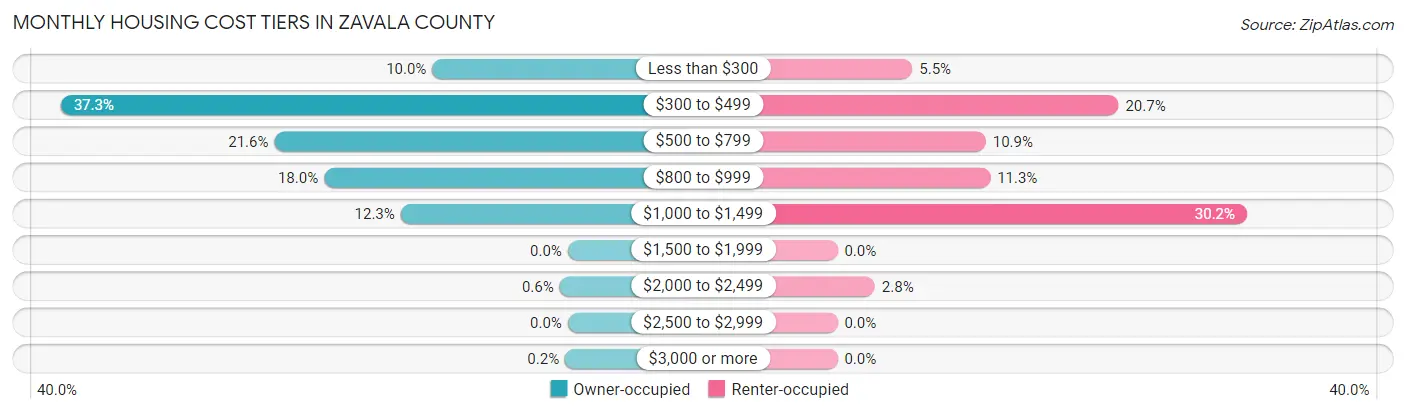
| Monthly Cost | Owner-occupied | Renter-occupied |
| Less than $300 | 248 (10.0%) | 52 (5.5%) |
| $300 to $499 | 928 (37.3%) | 195 (20.7%) |
| $500 to $799 | 537 (21.6%) | 103 (10.9%) |
| $800 to $999 | 446 (17.9%) | 106 (11.3%) |
| $1,000 to $1,499 | 306 (12.3%) | 284 (30.1%) |
| $1,500 to $1,999 | 0 (0.0%) | 0 (0.0%) |
| $2,000 to $2,499 | 15 (0.6%) | 26 (2.8%) |
| $2,500 to $2,999 | 0 (0.0%) | 0 (0.0%) |
| $3,000 or more | 5 (0.2%) | 0 (0.0%) |
| Total | 2,485 (100.0%) | 942 (100.0%) |
Physical Housing Characteristics in Zavala County
Housing Structures in Zavala County
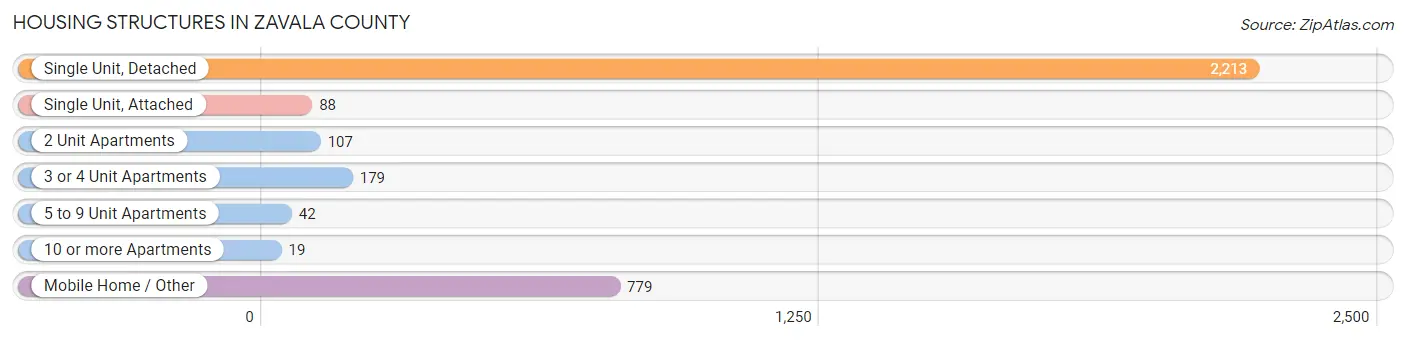
| Structure Type | # Housing Units | % Housing Units |
| Single Unit, Detached | 2,213 | 64.6% |
| Single Unit, Attached | 88 | 2.6% |
| 2 Unit Apartments | 107 | 3.1% |
| 3 or 4 Unit Apartments | 179 | 5.2% |
| 5 to 9 Unit Apartments | 42 | 1.2% |
| 10 or more Apartments | 19 | 0.5% |
| Mobile Home / Other | 779 | 22.7% |
| Total | 3,427 | 100.0% |
Housing Structures by Occupancy in Zavala County
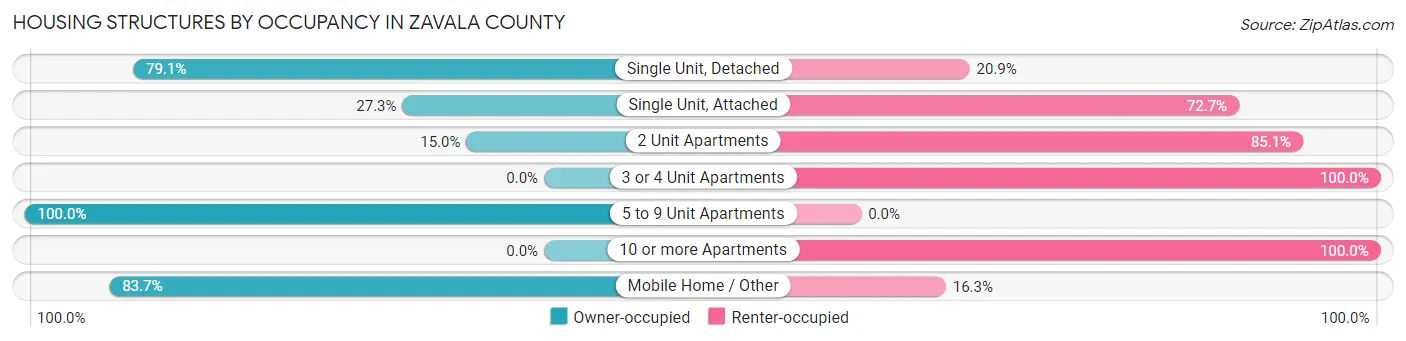
| Structure Type | Owner-occupied | Renter-occupied |
| Single Unit, Detached | 1,751 (79.1%) | 462 (20.9%) |
| Single Unit, Attached | 24 (27.3%) | 64 (72.7%) |
| 2 Unit Apartments | 16 (14.9%) | 91 (85.1%) |
| 3 or 4 Unit Apartments | 0 (0.0%) | 179 (100.0%) |
| 5 to 9 Unit Apartments | 42 (100.0%) | 0 (0.0%) |
| 10 or more Apartments | 0 (0.0%) | 19 (100.0%) |
| Mobile Home / Other | 652 (83.7%) | 127 (16.3%) |
| Total | 2,485 (72.5%) | 942 (27.5%) |
Housing Structures by Number of Rooms in Zavala County
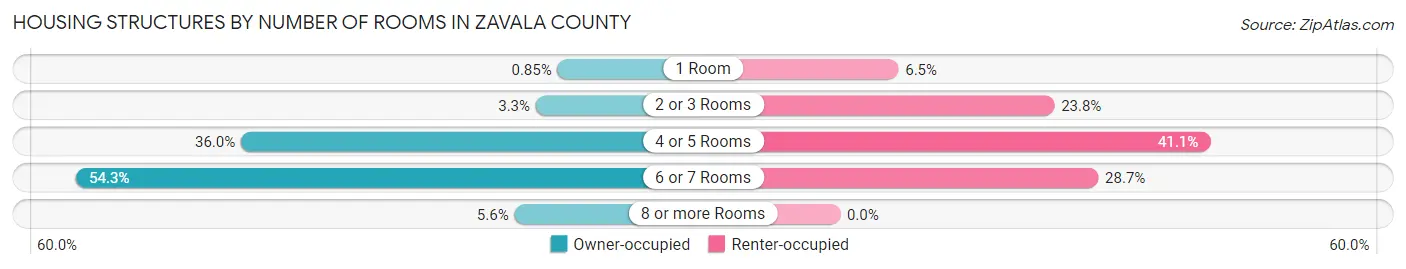
| Number of Rooms | Owner-occupied | Renter-occupied |
| 1 Room | 21 (0.9%) | 61 (6.5%) |
| 2 or 3 Rooms | 81 (3.3%) | 224 (23.8%) |
| 4 or 5 Rooms | 894 (36.0%) | 387 (41.1%) |
| 6 or 7 Rooms | 1,349 (54.3%) | 270 (28.7%) |
| 8 or more Rooms | 140 (5.6%) | 0 (0.0%) |
| Total | 2,485 (100.0%) | 942 (100.0%) |
Housing Structure by Heating Type in Zavala County
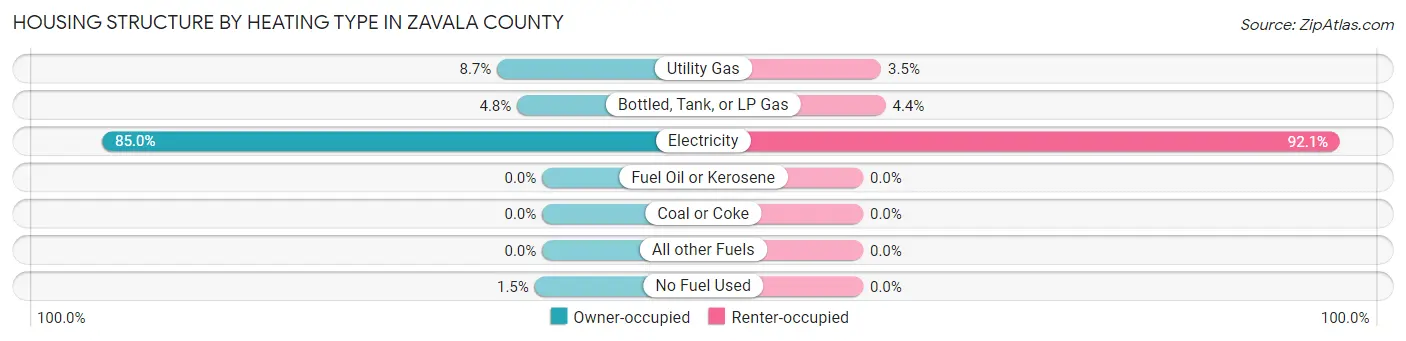
| Heating Type | Owner-occupied | Renter-occupied |
| Utility Gas | 216 (8.7%) | 33 (3.5%) |
| Bottled, Tank, or LP Gas | 120 (4.8%) | 41 (4.3%) |
| Electricity | 2,113 (85.0%) | 868 (92.1%) |
| Fuel Oil or Kerosene | 0 (0.0%) | 0 (0.0%) |
| Coal or Coke | 0 (0.0%) | 0 (0.0%) |
| All other Fuels | 0 (0.0%) | 0 (0.0%) |
| No Fuel Used | 36 (1.5%) | 0 (0.0%) |
| Total | 2,485 (100.0%) | 942 (100.0%) |
Household Vehicle Usage in Zavala County
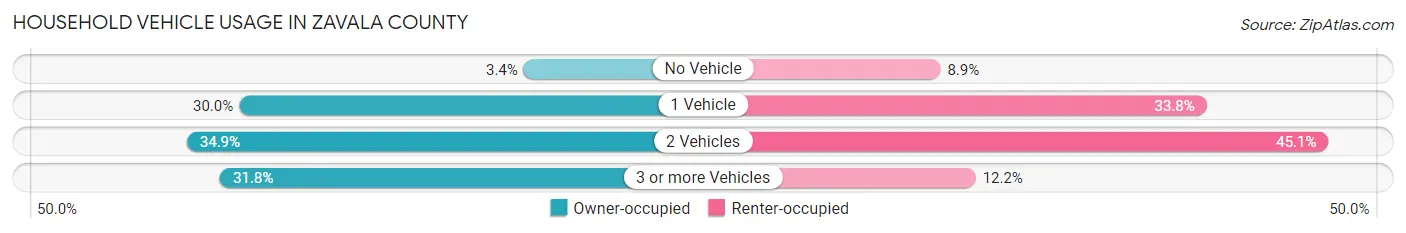
| Vehicles per Household | Owner-occupied | Renter-occupied |
| No Vehicle | 85 (3.4%) | 84 (8.9%) |
| 1 Vehicle | 745 (30.0%) | 318 (33.8%) |
| 2 Vehicles | 866 (34.8%) | 425 (45.1%) |
| 3 or more Vehicles | 789 (31.8%) | 115 (12.2%) |
| Total | 2,485 (100.0%) | 942 (100.0%) |
Real Estate & Mortgages in Zavala County
Real Estate and Mortgage Overview in Zavala County
| Characteristic | Without Mortgage | With Mortgage |
| Housing Units | 1,957 | 528 |
| Median Property Value | $73,400 | $88,000 |
| Median Household Income | $59,708 | $5 |
| Monthly Housing Costs | $448 | $5 |
| Real Estate Taxes | $892 | $0 |
Property Value by Mortgage Status in Zavala County
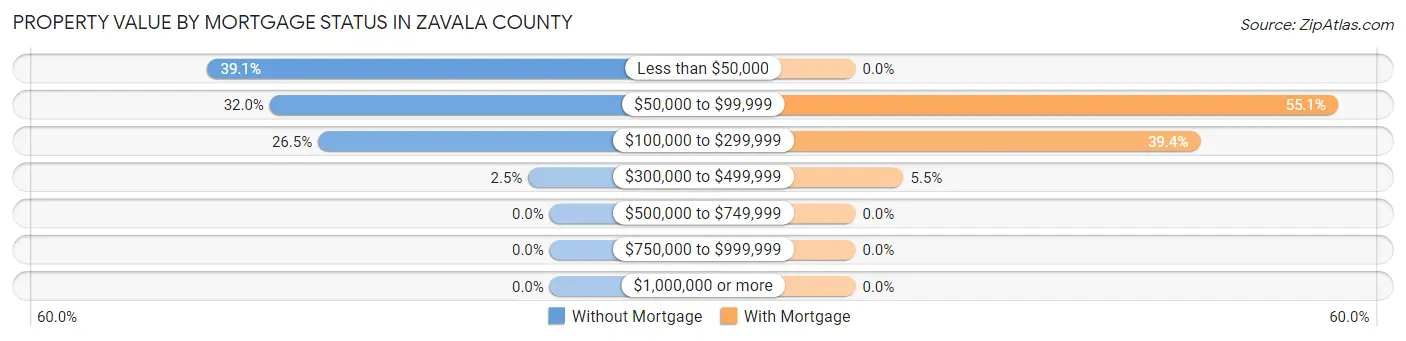
| Property Value | Without Mortgage | With Mortgage |
| Less than $50,000 | 765 (39.1%) | 0 (0.0%) |
| $50,000 to $99,999 | 626 (32.0%) | 291 (55.1%) |
| $100,000 to $299,999 | 518 (26.5%) | 208 (39.4%) |
| $300,000 to $499,999 | 48 (2.5%) | 29 (5.5%) |
| $500,000 to $749,999 | 0 (0.0%) | 0 (0.0%) |
| $750,000 to $999,999 | 0 (0.0%) | 0 (0.0%) |
| $1,000,000 or more | 0 (0.0%) | 0 (0.0%) |
| Total | 1,957 (100.0%) | 528 (100.0%) |
Household Income by Mortgage Status in Zavala County
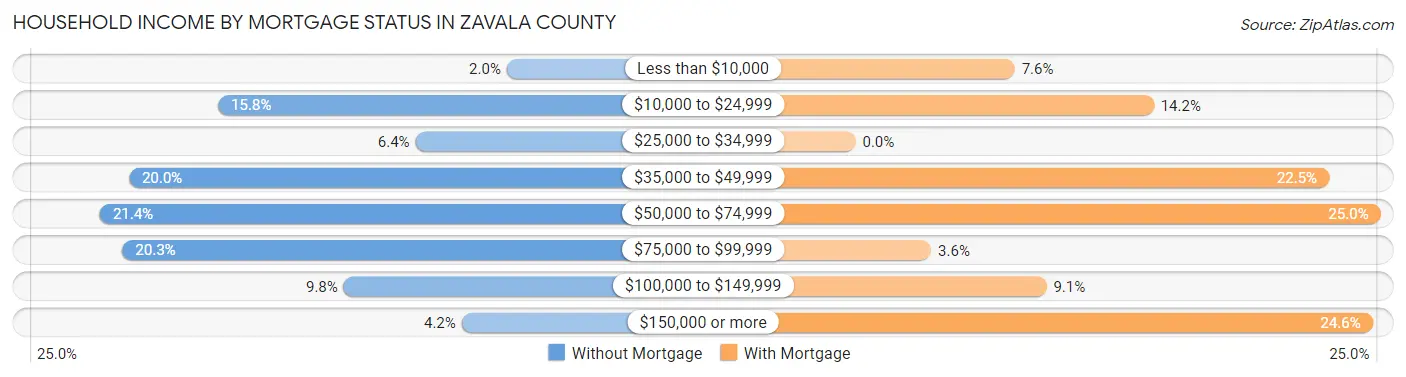
| Household Income | Without Mortgage | With Mortgage |
| Less than $10,000 | 40 (2.0%) | 40 (7.6%) |
| $10,000 to $24,999 | 309 (15.8%) | 75 (14.2%) |
| $25,000 to $34,999 | 125 (6.4%) | 0 (0.0%) |
| $35,000 to $49,999 | 392 (20.0%) | 119 (22.5%) |
| $50,000 to $74,999 | 419 (21.4%) | 132 (25.0%) |
| $75,000 to $99,999 | 398 (20.3%) | 19 (3.6%) |
| $100,000 to $149,999 | 192 (9.8%) | 48 (9.1%) |
| $150,000 or more | 82 (4.2%) | 130 (24.6%) |
| Total | 1,957 (100.0%) | 528 (100.0%) |
Property Value to Household Income Ratio in Zavala County
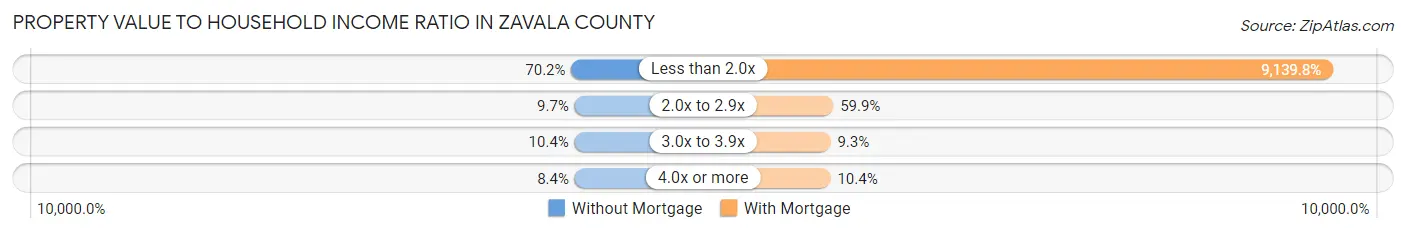
| Value-to-Income Ratio | Without Mortgage | With Mortgage |
| Less than 2.0x | 1,374 (70.2%) | 48,258 (9,139.8%) |
| 2.0x to 2.9x | 190 (9.7%) | 316 (59.9%) |
| 3.0x to 3.9x | 203 (10.4%) | 49 (9.3%) |
| 4.0x or more | 165 (8.4%) | 55 (10.4%) |
| Total | 1,957 (100.0%) | 528 (100.0%) |
Real Estate Taxes by Mortgage Status in Zavala County
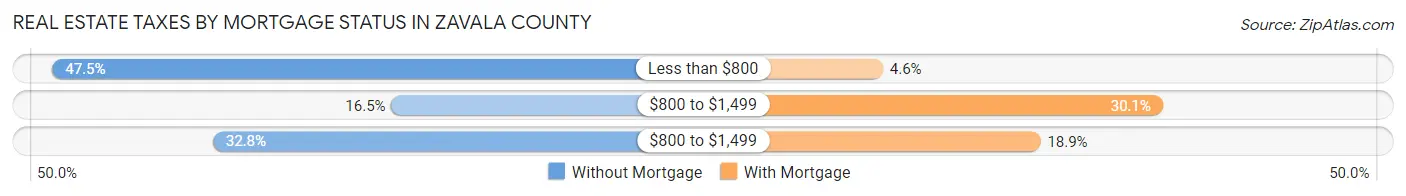
| Property Taxes | Without Mortgage | With Mortgage |
| Less than $800 | 929 (47.5%) | 24 (4.5%) |
| $800 to $1,499 | 323 (16.5%) | 159 (30.1%) |
| $800 to $1,499 | 642 (32.8%) | 100 (18.9%) |
| Total | 1,957 (100.0%) | 528 (100.0%) |
Health & Disability in Zavala County
Health Insurance Coverage by Age in Zavala County
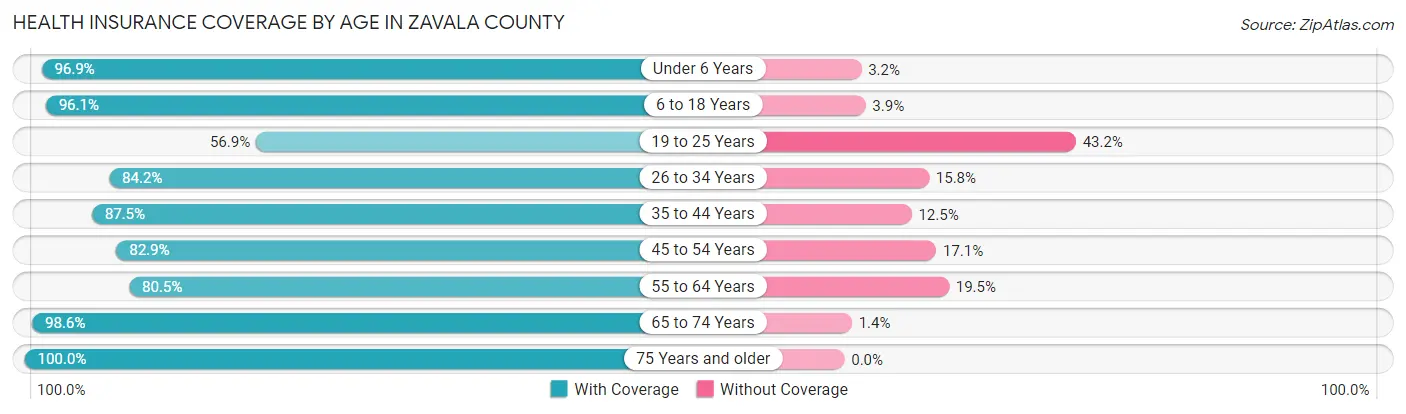
| Age Bracket | With Coverage | Without Coverage |
| Under 6 Years | 830 (96.9%) | 27 (3.2%) |
| 6 to 18 Years | 2,075 (96.1%) | 85 (3.9%) |
| 19 to 25 Years | 498 (56.9%) | 378 (43.1%) |
| 26 to 34 Years | 1,015 (84.2%) | 190 (15.8%) |
| 35 to 44 Years | 1,019 (87.5%) | 146 (12.5%) |
| 45 to 54 Years | 746 (82.9%) | 154 (17.1%) |
| 55 to 64 Years | 719 (80.5%) | 174 (19.5%) |
| 65 to 74 Years | 1,068 (98.6%) | 15 (1.4%) |
| 75 Years and older | 476 (100.0%) | 0 (0.0%) |
| Total | 8,446 (87.8%) | 1,169 (12.2%) |
Health Insurance Coverage by Citizenship Status in Zavala County
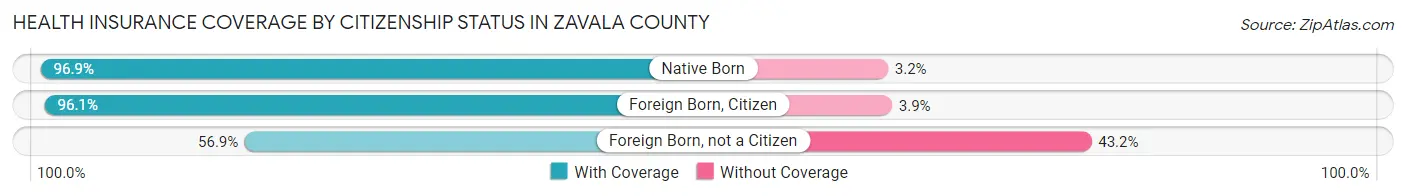
| Citizenship Status | With Coverage | Without Coverage |
| Native Born | 830 (96.9%) | 27 (3.2%) |
| Foreign Born, Citizen | 2,075 (96.1%) | 85 (3.9%) |
| Foreign Born, not a Citizen | 498 (56.9%) | 378 (43.1%) |
Health Insurance Coverage by Household Income in Zavala County
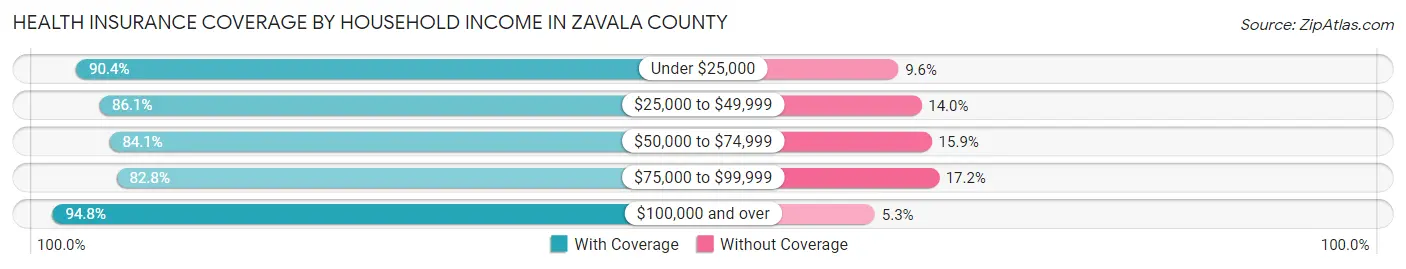
| Household Income | With Coverage | Without Coverage |
| Under $25,000 | 1,838 (90.4%) | 196 (9.6%) |
| $25,000 to $49,999 | 2,658 (86.1%) | 431 (14.0%) |
| $50,000 to $74,999 | 1,248 (84.1%) | 236 (15.9%) |
| $75,000 to $99,999 | 1,024 (82.8%) | 213 (17.2%) |
| $100,000 and over | 1,678 (94.8%) | 93 (5.2%) |
Public vs Private Health Insurance Coverage by Age in Zavala County
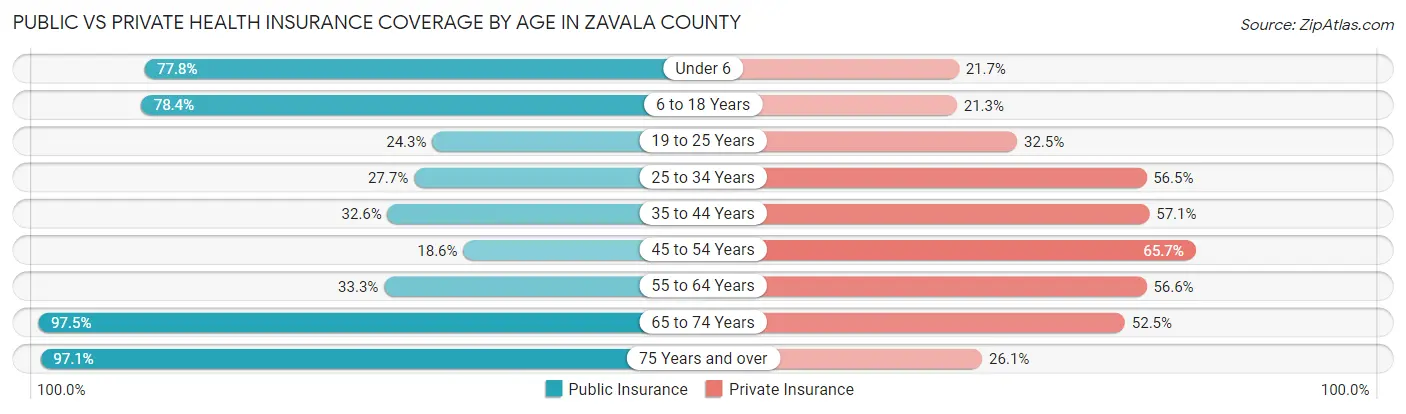
| Age Bracket | Public Insurance | Private Insurance |
| Under 6 | 667 (77.8%) | 186 (21.7%) |
| 6 to 18 Years | 1,694 (78.4%) | 461 (21.3%) |
| 19 to 25 Years | 213 (24.3%) | 285 (32.5%) |
| 25 to 34 Years | 334 (27.7%) | 681 (56.5%) |
| 35 to 44 Years | 380 (32.6%) | 665 (57.1%) |
| 45 to 54 Years | 167 (18.6%) | 591 (65.7%) |
| 55 to 64 Years | 297 (33.3%) | 505 (56.6%) |
| 65 to 74 Years | 1,056 (97.5%) | 569 (52.5%) |
| 75 Years and over | 462 (97.1%) | 124 (26.1%) |
| Total | 5,270 (54.8%) | 4,067 (42.3%) |
Disability Status by Sex by Age in Zavala County
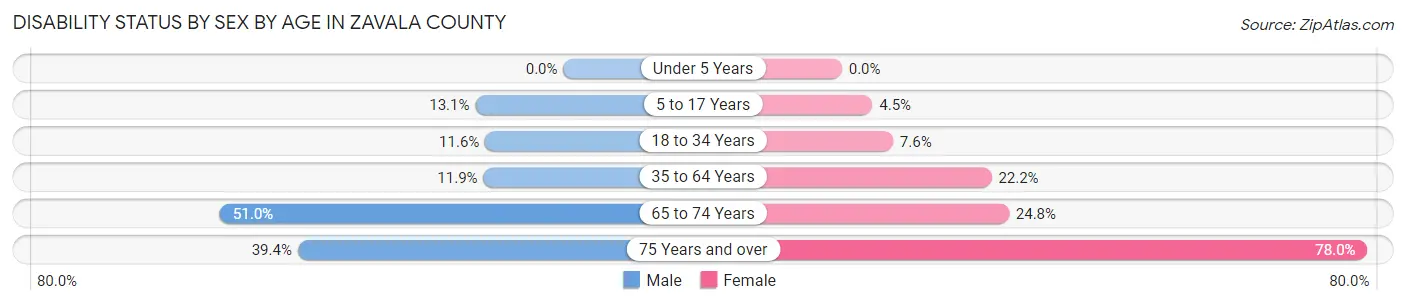
| Age Bracket | Male | Female |
| Under 5 Years | 0 (0.0%) | 0 (0.0%) |
| 5 to 17 Years | 160 (13.1%) | 42 (4.5%) |
| 18 to 34 Years | 136 (11.6%) | 82 (7.6%) |
| 35 to 64 Years | 178 (11.9%) | 324 (22.2%) |
| 65 to 74 Years | 283 (51.0%) | 131 (24.8%) |
| 75 Years and over | 71 (39.4%) | 231 (78.0%) |
Disability Class by Sex by Age in Zavala County
Disability Class: Hearing Difficulty
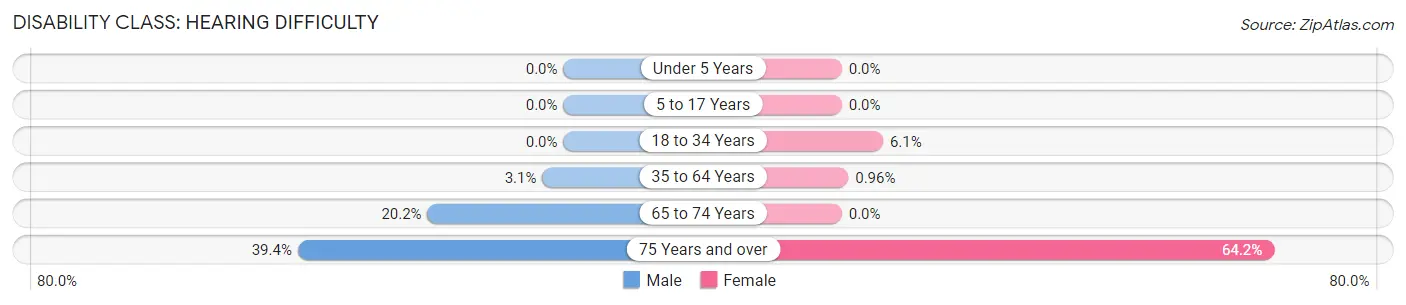
| Age Bracket | Male | Female |
| Under 5 Years | 0 (0.0%) | 0 (0.0%) |
| 5 to 17 Years | 0 (0.0%) | 0 (0.0%) |
| 18 to 34 Years | 0 (0.0%) | 66 (6.1%) |
| 35 to 64 Years | 47 (3.1%) | 14 (1.0%) |
| 65 to 74 Years | 112 (20.2%) | 0 (0.0%) |
| 75 Years and over | 71 (39.4%) | 190 (64.2%) |
Disability Class: Vision Difficulty
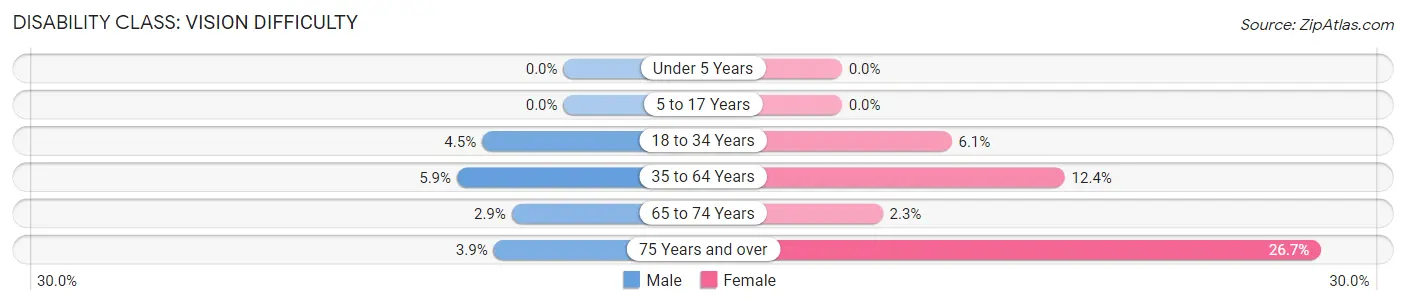
| Age Bracket | Male | Female |
| Under 5 Years | 0 (0.0%) | 0 (0.0%) |
| 5 to 17 Years | 0 (0.0%) | 0 (0.0%) |
| 18 to 34 Years | 53 (4.5%) | 66 (6.1%) |
| 35 to 64 Years | 89 (5.9%) | 181 (12.4%) |
| 65 to 74 Years | 16 (2.9%) | 12 (2.3%) |
| 75 Years and over | 7 (3.9%) | 79 (26.7%) |
Disability Class: Cognitive Difficulty
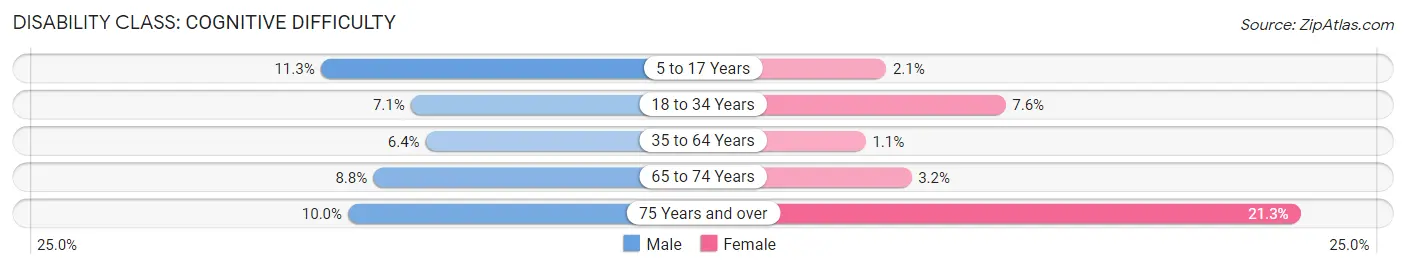
| Age Bracket | Male | Female |
| 5 to 17 Years | 138 (11.3%) | 19 (2.1%) |
| 18 to 34 Years | 83 (7.1%) | 82 (7.6%) |
| 35 to 64 Years | 96 (6.4%) | 16 (1.1%) |
| 65 to 74 Years | 49 (8.8%) | 17 (3.2%) |
| 75 Years and over | 18 (10.0%) | 63 (21.3%) |
Disability Class: Ambulatory Difficulty
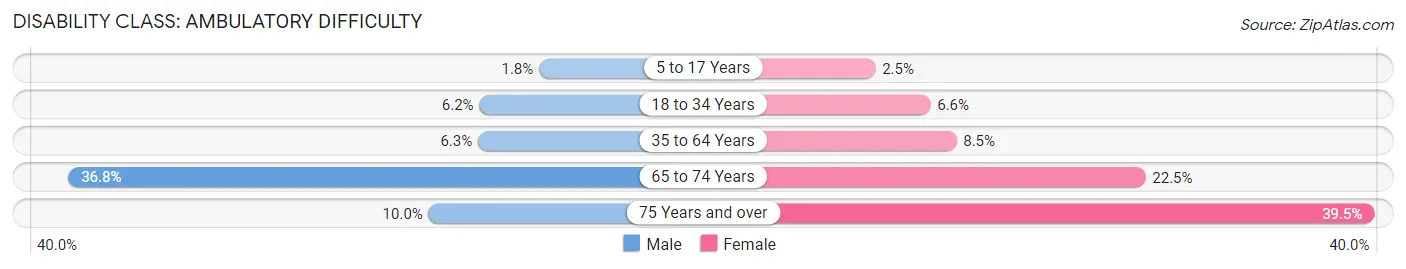
| Age Bracket | Male | Female |
| 5 to 17 Years | 22 (1.8%) | 23 (2.5%) |
| 18 to 34 Years | 73 (6.2%) | 71 (6.6%) |
| 35 to 64 Years | 95 (6.3%) | 124 (8.5%) |
| 65 to 74 Years | 204 (36.8%) | 119 (22.5%) |
| 75 Years and over | 18 (10.0%) | 117 (39.5%) |
Disability Class: Self-Care Difficulty
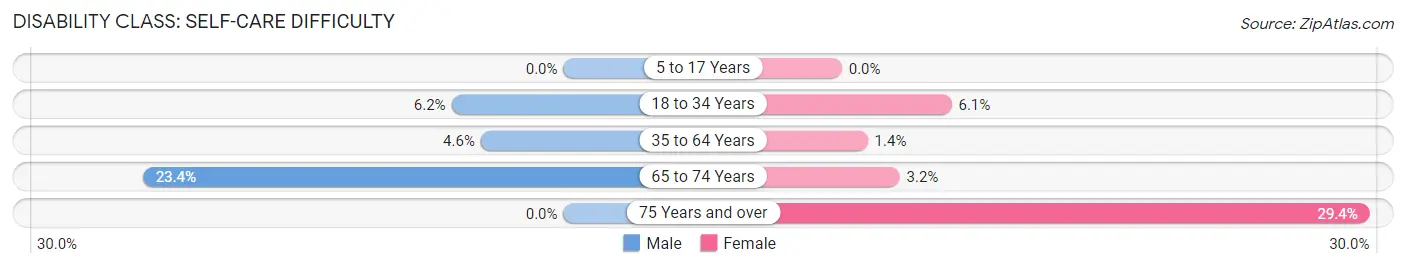
| Age Bracket | Male | Female |
| 5 to 17 Years | 0 (0.0%) | 0 (0.0%) |
| 18 to 34 Years | 73 (6.2%) | 66 (6.1%) |
| 35 to 64 Years | 69 (4.6%) | 21 (1.4%) |
| 65 to 74 Years | 130 (23.4%) | 17 (3.2%) |
| 75 Years and over | 0 (0.0%) | 87 (29.4%) |
Technology Access in Zavala County
Computing Device Access in Zavala County
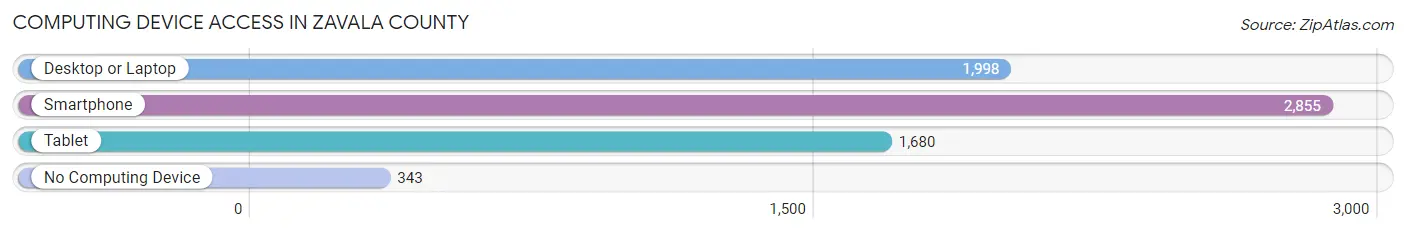
| Device Type | # Households | % Households |
| Desktop or Laptop | 1,998 | 58.3% |
| Smartphone | 2,855 | 83.3% |
| Tablet | 1,680 | 49.0% |
| No Computing Device | 343 | 10.0% |
| Total | 3,427 | 100.0% |
Internet Access in Zavala County
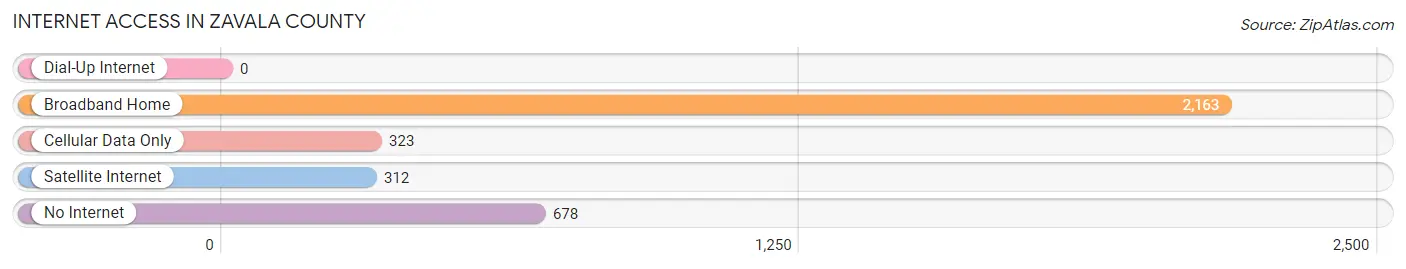
| Internet Type | # Households | % Households |
| Dial-Up Internet | 0 | 0.0% |
| Broadband Home | 2,163 | 63.1% |
| Cellular Data Only | 323 | 9.4% |
| Satellite Internet | 312 | 9.1% |
| No Internet | 678 | 19.8% |
| Total | 3,427 | 100.0% |
Zavala County Summary
Zavala County is located in the southern part of Texas, in the United States. It is bordered by Maverick County to the north, Dimmit County to the east, La Salle County to the south, and Uvalde County to the west. The county seat is Crystal City, and the largest city is Carrizo Springs. The county was named after Lorenzo de Zavala, a Mexican politician and signer of the Texas Declaration of Independence.
Geography
Zavala County covers an area of 1,058 square miles, making it the second-smallest county in Texas. The terrain is mostly flat, with some rolling hills in the northern part of the county. The county is drained by the Nueces River and its tributaries, including the Frio River, the Nueces River, and the San Miguel River. The county is located in the Edwards Plateau region of Texas, and is home to several species of wildlife, including white-tailed deer, javelina, and wild turkeys.
The climate of Zavala County is semi-arid, with hot summers and mild winters. The average annual temperature is 68°F, and the average annual precipitation is 22 inches.
Demographics
As of the 2010 census, the population of Zavala County was 11,677. The population density was 11 people per square mile. The racial makeup of the county was 79.3% White, 0.7% African American, 0.5% Native American, 0.2% Asian, 0.1% Pacific Islander, 17.3% from other races, and 2.0% from two or more races. Hispanic or Latino of any race were 81.2% of the population.
The median income for a household in the county was $25,921, and the median income for a family was $30,917. The per capita income for the county was $12,845. About 24.2% of the population was below the poverty line.
Economy
The economy of Zavala County is largely based on agriculture. The county is home to several large farms, which produce cotton, corn, sorghum, and wheat. The county is also home to several oil and gas fields, which produce crude oil and natural gas.
The county is home to several manufacturing companies, including a steel mill, a plastics plant, and a food processing plant. The county is also home to several retail stores, restaurants, and other businesses.
History
Zavala County was established in 1858, and was named after Lorenzo de Zavala, a Mexican politician and signer of the Texas Declaration of Independence. The county was originally part of Maverick County, but was split off in 1858.
The county was largely populated by ranchers and farmers, and the economy was based on agriculture. The county was also home to several oil and gas fields, which were developed in the early 20th century.
In the 1950s, the county began to experience a population boom, as people moved to the area to take advantage of the booming oil and gas industry. The population continued to grow throughout the 1960s and 1970s, and the county experienced an economic boom.
In the 1980s, the county began to experience an economic downturn, as the oil and gas industry began to decline. The population also began to decline, as people moved away in search of better economic opportunities.
Today, the county is still largely rural, and the economy is still largely based on agriculture. The county is also home to several manufacturing companies, and the population is slowly beginning to grow again.
Common Questions
What is Per Capita Income in Zavala County?
Per Capita income in Zavala County is $20,409.
What is the Median Family Income in Zavala County?
Median Family Income in Zavala County is $52,679.
What is the Median Household income in Zavala County?
Median Household Income in Zavala County is $49,243.
What is Income or Wage Gap in Zavala County?
Income or Wage Gap in Zavala County is 44.3%.
Women in Zavala County earn 55.7 cents for every dollar earned by a man.
What is Family Income Deficit in Zavala County?
Family Income Deficit in Zavala County is $9,198.
Families that are below poverty line in Zavala County earn $9,198 less on average than the poverty threshold level.
What is Inequality or Gini Index in Zavala County?
Inequality or Gini Index in Zavala County is 0.40.
What is the Total Population of Zavala County?
Total Population of Zavala County is 9,700.
What is the Total Male Population of Zavala County?
Total Male Population of Zavala County is 5,101.
What is the Total Female Population of Zavala County?
Total Female Population of Zavala County is 4,599.
What is the Ratio of Males per 100 Females in Zavala County?
There are 110.92 Males per 100 Females in Zavala County.
What is the Ratio of Females per 100 Males in Zavala County?
There are 90.16 Females per 100 Males in Zavala County.
What is the Median Population Age in Zavala County?
Median Population Age in Zavala County is 33.2 Years.
What is the Average Family Size in Zavala County
Average Family Size in Zavala County is 3.1 People.
What is the Average Household Size in Zavala County
Average Household Size in Zavala County is 2.8 People.
How Large is the Labor Force in Zavala County?
There are 4,046 People in the Labor Forcein in Zavala County.
What is the Percentage of People in the Labor Force in Zavala County?
55.3% of People are in the Labor Force in Zavala County.
What is the Unemployment Rate in Zavala County?
Unemployment Rate in Zavala County is 5.8%.