Zapata County, TX Map & Demographics
Zapata County Overview
$19,139
PER CAPITA INCOME
$39,146
AVG FAMILY INCOME
$35,061
AVG HOUSEHOLD INCOME
33.3%
WAGE / INCOME GAP [ % ]
66.7¢/ $1
WAGE / INCOME GAP [ $ ]
$16,011
FAMILY INCOME DEFICIT
0.52
INEQUALITY / GINI INDEX
13,896
TOTAL POPULATION
6,953
MALE POPULATION
6,943
FEMALE POPULATION
100.14
MALES / 100 FEMALES
99.86
FEMALES / 100 MALES
30.9
MEDIAN AGE
3.7
AVG FAMILY SIZE
3.0
AVG HOUSEHOLD SIZE
5,266
LABOR FORCE [ PEOPLE ]
53.7%
PERCENT IN LABOR FORCE
8.1%
UNEMPLOYMENT RATE
Zapata County Area Codes
Income in Zapata County
Income Overview in Zapata County
Per Capita Income in Zapata County is $19,139, while median incomes of families and households are $39,146 and $35,061 respectively.
| Characteristic | Number | Measure |
| Per Capita Income | 13,896 | $19,139 |
| Median Family Income | 3,135 | $39,146 |
| Mean Family Income | 3,135 | $65,308 |
| Median Household Income | 4,580 | $35,061 |
| Mean Household Income | 4,580 | $56,419 |
| Income Deficit | 3,135 | $16,011 |
| Wage / Income Gap (%) | 13,896 | 33.32% |
| Wage / Income Gap ($) | 13,896 | 66.68¢ per $1 |
| Gini / Inequality Index | 13,896 | 0.52 |
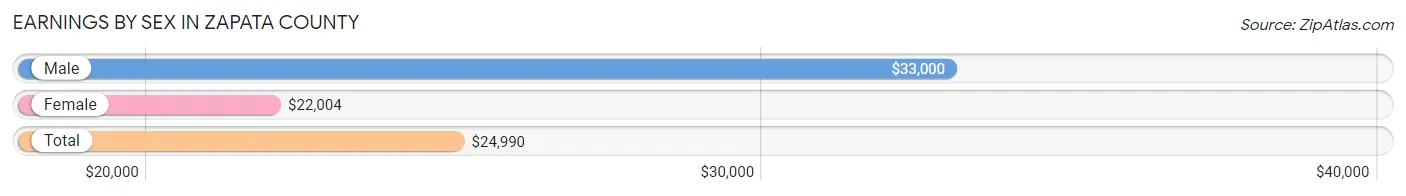
Earnings by Sex in Zapata County
Average Earnings in Zapata County are $24,990, $33,000 for men and $22,004 for women, a difference of 33.3%.
| Sex | Number | Average Earnings |
| Male | 2,984 (55.5%) | $33,000 |
| Female | 2,396 (44.5%) | $22,004 |
| Total | 5,380 (100.0%) | $24,990 |
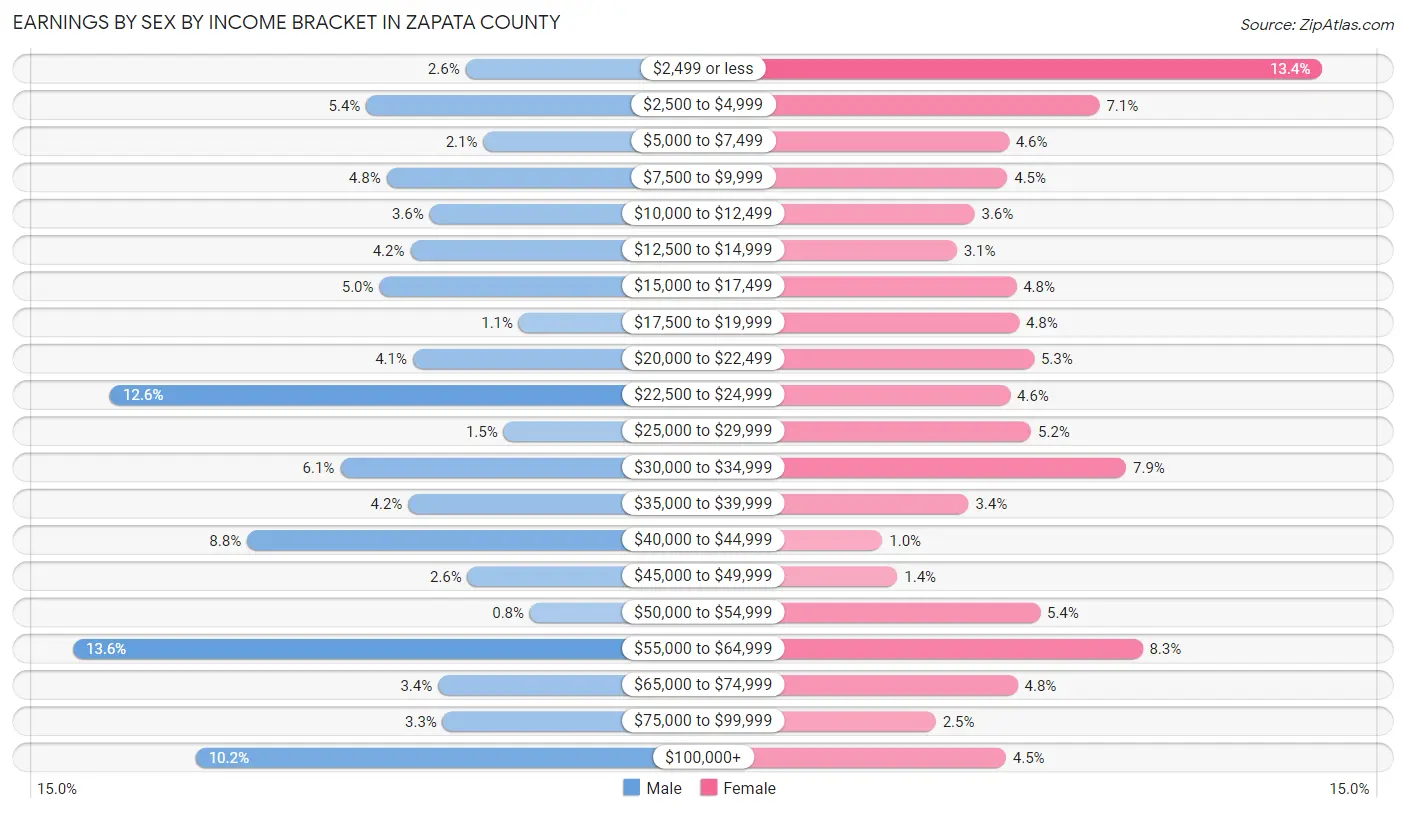
Earnings by Sex by Income Bracket in Zapata County
The most common earnings brackets in Zapata County are $55,000 to $64,999 for men (407 | 13.6%) and $2,499 or less for women (320 | 13.4%).
| Income | Male | Female |
| $2,499 or less | 78 (2.6%) | 320 (13.4%) |
| $2,500 to $4,999 | 161 (5.4%) | 170 (7.1%) |
| $5,000 to $7,499 | 63 (2.1%) | 109 (4.5%) |
| $7,500 to $9,999 | 144 (4.8%) | 108 (4.5%) |
| $10,000 to $12,499 | 108 (3.6%) | 86 (3.6%) |
| $12,500 to $14,999 | 124 (4.2%) | 74 (3.1%) |
| $15,000 to $17,499 | 150 (5.0%) | 114 (4.8%) |
| $17,500 to $19,999 | 33 (1.1%) | 116 (4.8%) |
| $20,000 to $22,499 | 122 (4.1%) | 126 (5.3%) |
| $22,500 to $24,999 | 376 (12.6%) | 110 (4.6%) |
| $25,000 to $29,999 | 46 (1.5%) | 124 (5.2%) |
| $30,000 to $34,999 | 183 (6.1%) | 188 (7.9%) |
| $35,000 to $39,999 | 126 (4.2%) | 82 (3.4%) |
| $40,000 to $44,999 | 261 (8.7%) | 24 (1.0%) |
| $45,000 to $49,999 | 76 (2.5%) | 34 (1.4%) |
| $50,000 to $54,999 | 24 (0.8%) | 130 (5.4%) |
| $55,000 to $64,999 | 407 (13.6%) | 199 (8.3%) |
| $65,000 to $74,999 | 101 (3.4%) | 115 (4.8%) |
| $75,000 to $99,999 | 97 (3.3%) | 60 (2.5%) |
| $100,000+ | 304 (10.2%) | 107 (4.5%) |
| Total | 2,984 (100.0%) | 2,396 (100.0%) |
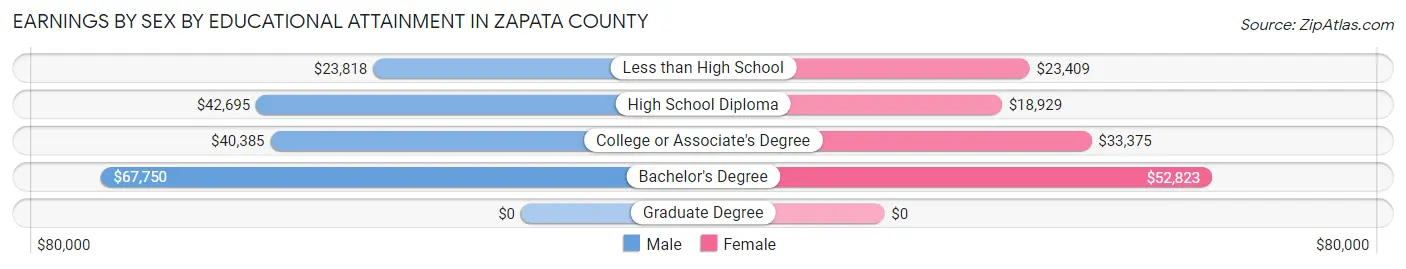
Earnings by Sex by Educational Attainment in Zapata County
Average earnings in Zapata County are $34,229 for men and $24,977 for women, a difference of 27.0%. Men with an educational attainment of bachelor's degree enjoy the highest average annual earnings of $67,750, while those with less than high school education earn the least with $23,818. Women with an educational attainment of bachelor's degree earn the most with the average annual earnings of $52,823, while those with high school diploma education have the smallest earnings of $18,929.
| Educational Attainment | Male Income | Female Income |
| Less than High School | $23,818 | $23,409 |
| High School Diploma | $42,695 | $18,929 |
| College or Associate's Degree | $40,385 | $33,375 |
| Bachelor's Degree | $67,750 | $52,823 |
| Graduate Degree | - | - |
| Total | $34,229 | $24,977 |
Family Income in Zapata County
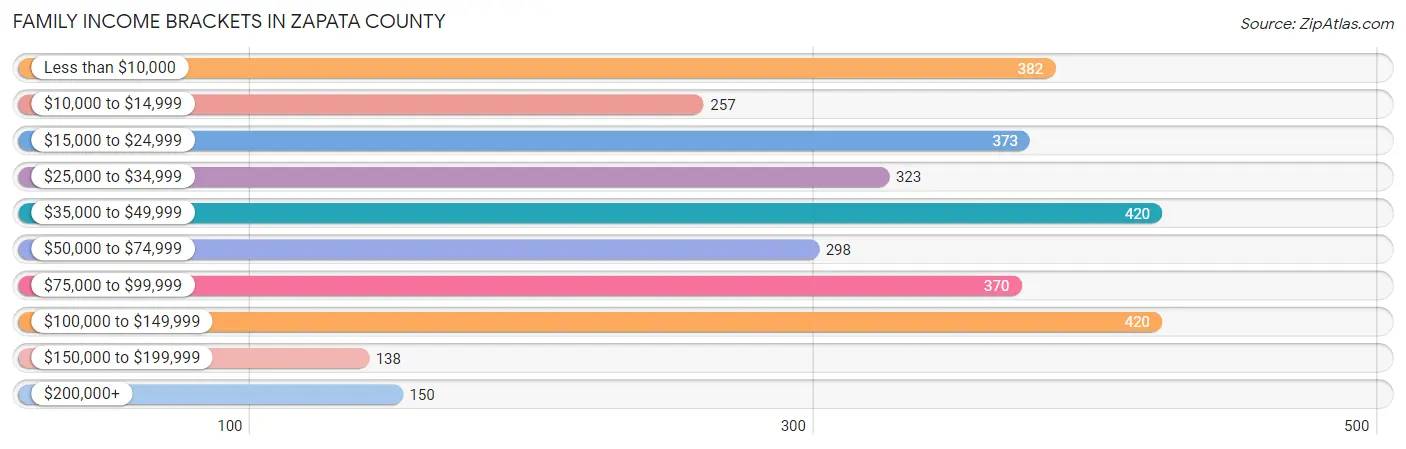
Family Income Brackets in Zapata County
According to the Zapata County family income data, there are 420 families falling into the $35,000 to $49,999 income range, which is the most common income bracket and makes up 13.4% of all families. Conversely, the $150,000 to $199,999 income bracket is the least frequent group with only 138 families (4.4%) belonging to this category.
| Income Bracket | # Families | % Families |
| Less than $10,000 | 382 | 12.2% |
| $10,000 to $14,999 | 257 | 8.2% |
| $15,000 to $24,999 | 373 | 11.9% |
| $25,000 to $34,999 | 323 | 10.3% |
| $35,000 to $49,999 | 420 | 13.4% |
| $50,000 to $74,999 | 298 | 9.5% |
| $75,000 to $99,999 | 370 | 11.8% |
| $100,000 to $149,999 | 420 | 13.4% |
| $150,000 to $199,999 | 138 | 4.4% |
| $200,000+ | 150 | 4.8% |
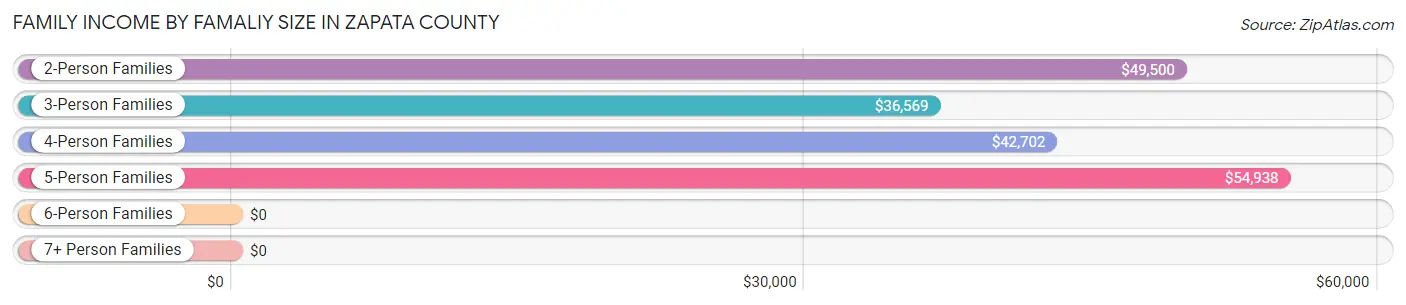
Family Income by Famaliy Size in Zapata County
5-person families (425 | 13.6%) account for the highest median family income in Zapata County with $54,938 per family, while 2-person families (1,122 | 35.8%) have the highest median income of $24,750 per family member.
| Income Bracket | # Families | Median Income |
| 2-Person Families | 1,122 (35.8%) | $49,500 |
| 3-Person Families | 700 (22.3%) | $36,569 |
| 4-Person Families | 553 (17.6%) | $42,702 |
| 5-Person Families | 425 (13.6%) | $54,938 |
| 6-Person Families | 196 (6.2%) | $0 |
| 7+ Person Families | 139 (4.4%) | $0 |
| Total | 3,135 (100.0%) | $39,146 |
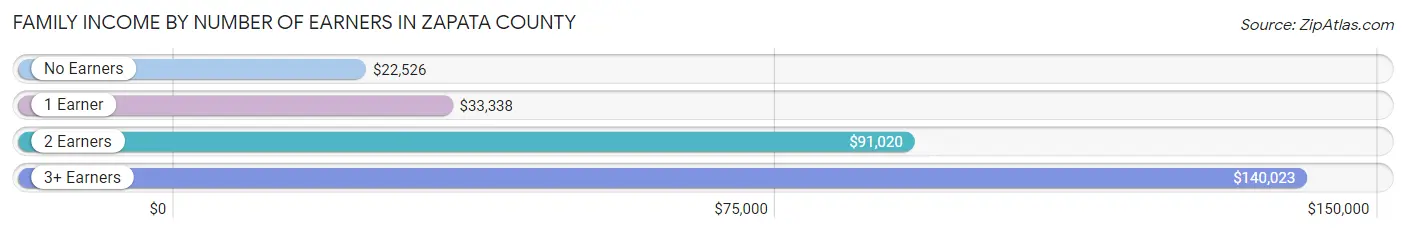
Family Income by Number of Earners in Zapata County
The median family income in Zapata County is $39,146, with families comprising 3+ earners (159) having the highest median family income of $140,023, while families with no earners (519) have the lowest median family income of $22,526, accounting for 5.1% and 16.6% of families, respectively.
| Number of Earners | # Families | Median Income |
| No Earners | 519 (16.6%) | $22,526 |
| 1 Earner | 1,415 (45.1%) | $33,338 |
| 2 Earners | 1,042 (33.2%) | $91,020 |
| 3+ Earners | 159 (5.1%) | $140,023 |
| Total | 3,135 (100.0%) | $39,146 |
Household Income in Zapata County
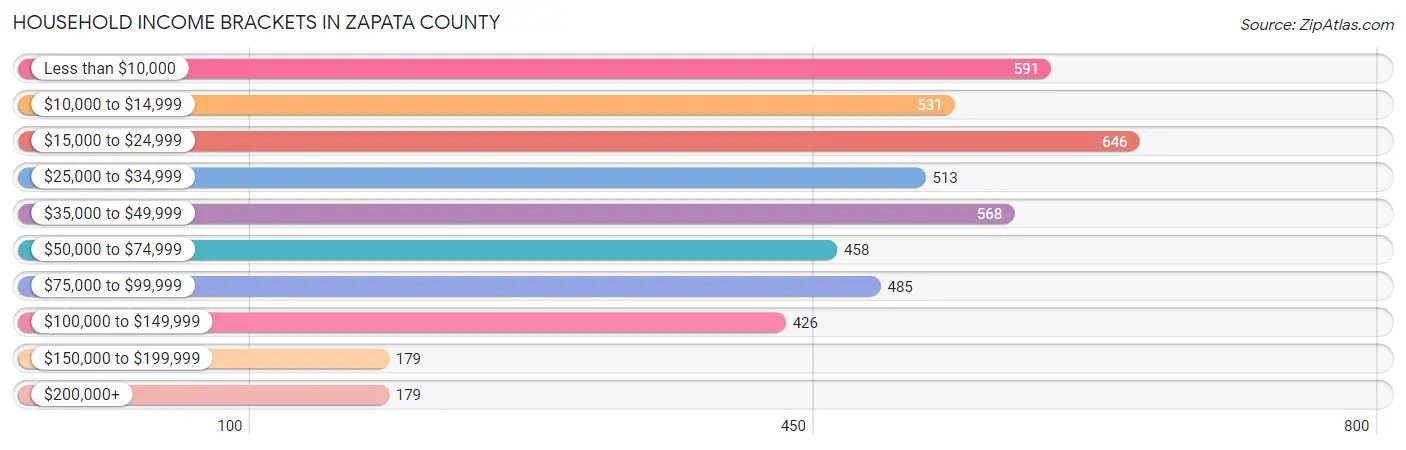
Household Income Brackets in Zapata County
With 646 households falling in the category, the $15,000 to $24,999 income range is the most frequent in Zapata County, accounting for 14.1% of all households. In contrast, only 179 households (3.9%) fall into the $150,000 to $199,999 income bracket, making it the least populous group.
| Income Bracket | # Households | % Households |
| Less than $10,000 | 591 | 12.9% |
| $10,000 to $14,999 | 531 | 11.6% |
| $15,000 to $24,999 | 646 | 14.1% |
| $25,000 to $34,999 | 513 | 11.2% |
| $35,000 to $49,999 | 568 | 12.4% |
| $50,000 to $74,999 | 458 | 10.0% |
| $75,000 to $99,999 | 485 | 10.6% |
| $100,000 to $149,999 | 426 | 9.3% |
| $150,000 to $199,999 | 179 | 3.9% |
| $200,000+ | 179 | 3.9% |
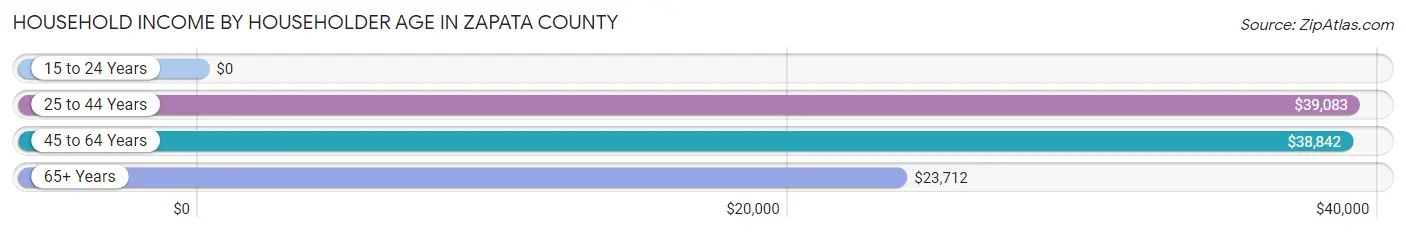
Household Income by Householder Age in Zapata County
The median household income in Zapata County is $35,061, with the highest median household income of $39,083 found in the 25 to 44 years age bracket for the primary householder. A total of 1,318 households (28.8%) fall into this category. Meanwhile, the 15 to 24 years age bracket for the primary householder has the lowest median household income of $0, with 474 households (10.3%) in this group.
| Income Bracket | # Households | Median Income |
| 15 to 24 Years | 474 (10.3%) | $0 |
| 25 to 44 Years | 1,318 (28.8%) | $39,083 |
| 45 to 64 Years | 1,452 (31.7%) | $38,842 |
| 65+ Years | 1,336 (29.2%) | $23,712 |
| Total | 4,580 (100.0%) | $35,061 |
Poverty in Zapata County
Income Below Poverty by Sex and Age in Zapata County
With 34.9% poverty level for males and 39.4% for females among the residents of Zapata County, 6 to 11 year old males and 18 to 24 year old females are the most vulnerable to poverty, with 622 males (67.5%) and 403 females (57.7%) in their respective age groups living below the poverty level.
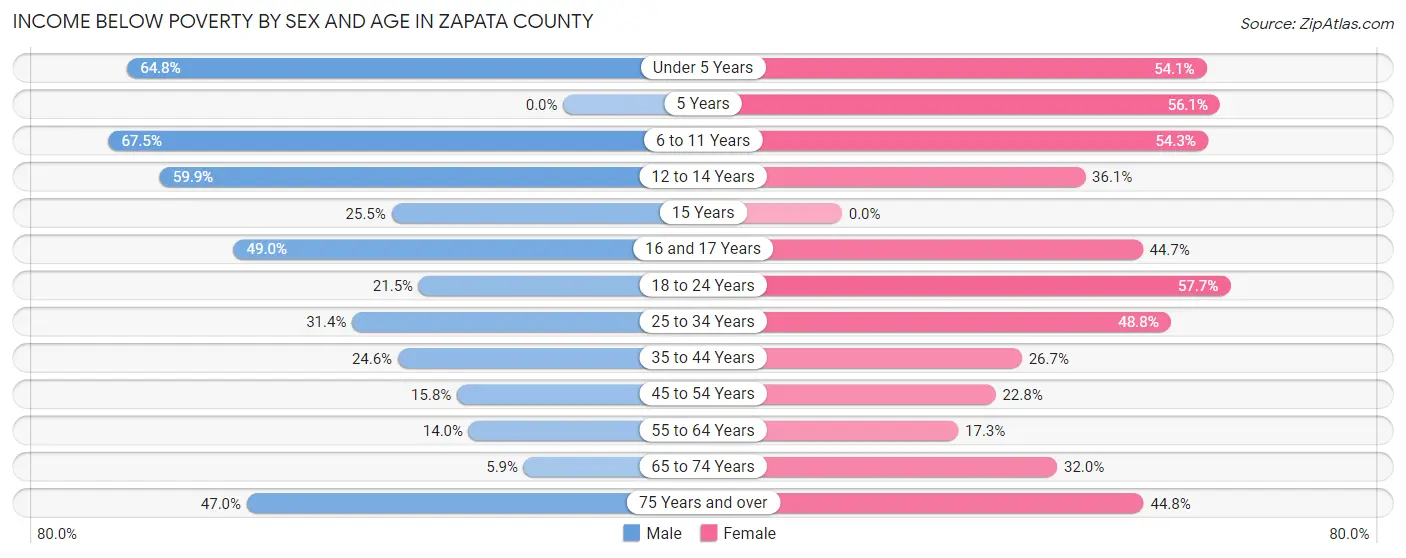
| Age Bracket | Male | Female |
| Under 5 Years | 371 (64.7%) | 295 (54.1%) |
| 5 Years | 0 (0.0%) | 87 (56.1%) |
| 6 to 11 Years | 622 (67.5%) | 421 (54.3%) |
| 12 to 14 Years | 236 (59.9%) | 112 (36.1%) |
| 15 Years | 51 (25.5%) | 0 (0.0%) |
| 16 and 17 Years | 93 (48.9%) | 113 (44.7%) |
| 18 to 24 Years | 160 (21.4%) | 403 (57.7%) |
| 25 to 34 Years | 269 (31.4%) | 410 (48.8%) |
| 35 to 44 Years | 195 (24.6%) | 233 (26.7%) |
| 45 to 54 Years | 102 (15.8%) | 181 (22.8%) |
| 55 to 64 Years | 78 (14.0%) | 100 (17.3%) |
| 65 to 74 Years | 29 (5.9%) | 178 (32.0%) |
| 75 Years and over | 180 (47.0%) | 190 (44.8%) |
| Total | 2,386 (34.9%) | 2,723 (39.4%) |
Income Above Poverty by Sex and Age in Zapata County
According to the poverty statistics in Zapata County, males aged 5 years and females aged 15 years are the age groups that are most secure financially, with 100.0% of males and 100.0% of females in these age groups living above the poverty line.
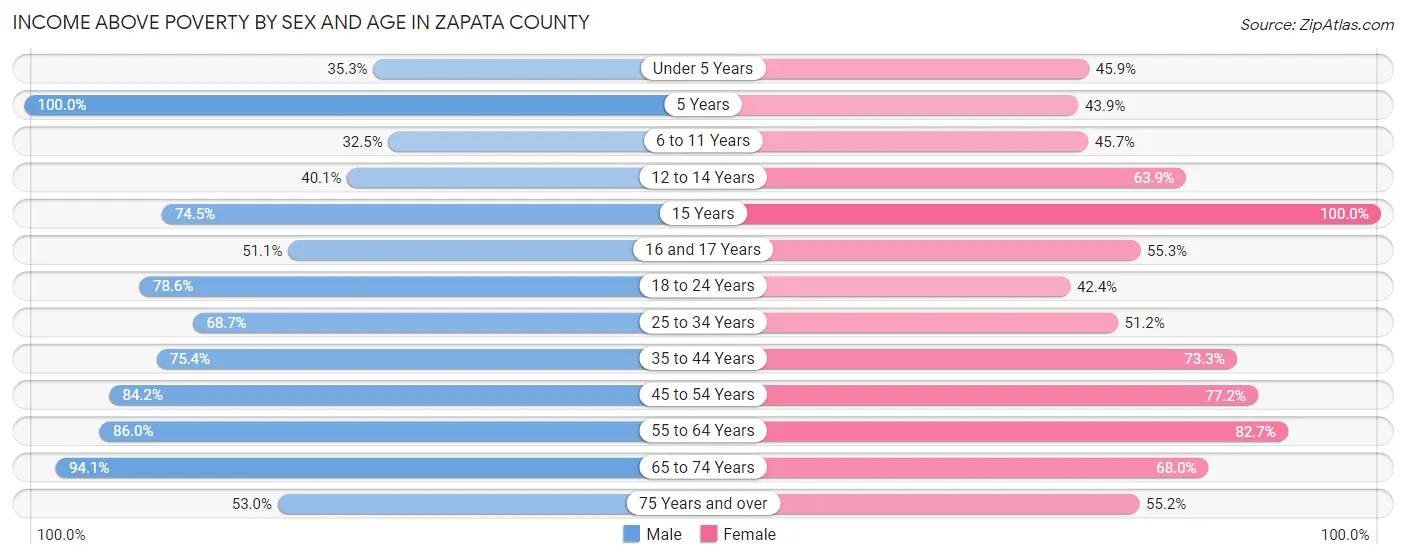
| Age Bracket | Male | Female |
| Under 5 Years | 202 (35.2%) | 250 (45.9%) |
| 5 Years | 78 (100.0%) | 68 (43.9%) |
| 6 to 11 Years | 299 (32.5%) | 354 (45.7%) |
| 12 to 14 Years | 158 (40.1%) | 198 (63.9%) |
| 15 Years | 149 (74.5%) | 102 (100.0%) |
| 16 and 17 Years | 97 (51.0%) | 140 (55.3%) |
| 18 to 24 Years | 586 (78.5%) | 296 (42.3%) |
| 25 to 34 Years | 589 (68.6%) | 430 (51.2%) |
| 35 to 44 Years | 599 (75.4%) | 639 (73.3%) |
| 45 to 54 Years | 545 (84.2%) | 612 (77.2%) |
| 55 to 64 Years | 478 (86.0%) | 479 (82.7%) |
| 65 to 74 Years | 466 (94.1%) | 379 (68.0%) |
| 75 Years and over | 203 (53.0%) | 234 (55.2%) |
| Total | 4,449 (65.1%) | 4,181 (60.6%) |
Income Below Poverty Among Married-Couple Families in Zapata County
The poverty statistics for married-couple families in Zapata County show that 17.0% or 265 of the total 1,557 families live below the poverty line. Families with 3 or 4 children have the highest poverty rate of 24.0%, comprising of 95 families. On the other hand, families with no children have the lowest poverty rate of 8.2%, which includes 55 families.
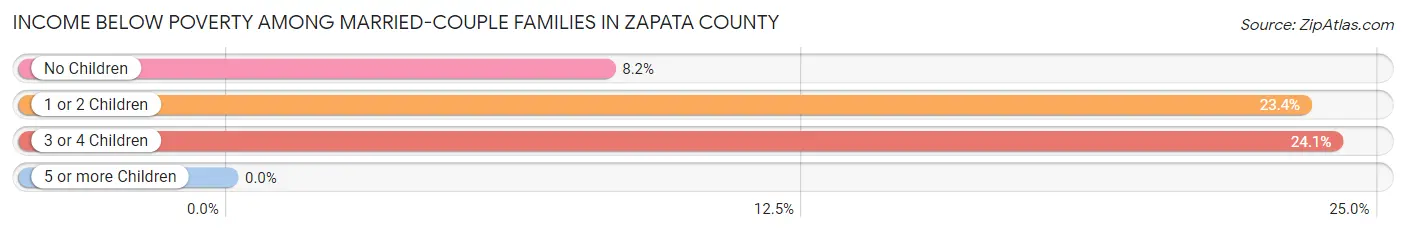
| Children | Above Poverty | Below Poverty |
| No Children | 615 (91.8%) | 55 (8.2%) |
| 1 or 2 Children | 377 (76.6%) | 115 (23.4%) |
| 3 or 4 Children | 300 (75.9%) | 95 (24.0%) |
| 5 or more Children | 0 (0.0%) | 0 (0.0%) |
| Total | 1,292 (83.0%) | 265 (17.0%) |
Income Below Poverty Among Single-Parent Households in Zapata County
According to the poverty data in Zapata County, 25.3% or 148 single-father households and 58.1% or 576 single-mother households are living below the poverty line. Among single-father households, those with 3 or 4 children have the highest poverty rate, with 25 households (100.0%) experiencing poverty. Likewise, among single-mother households, those with 1 or 2 children have the highest poverty rate, with 246 households (82.3%) falling below the poverty line.
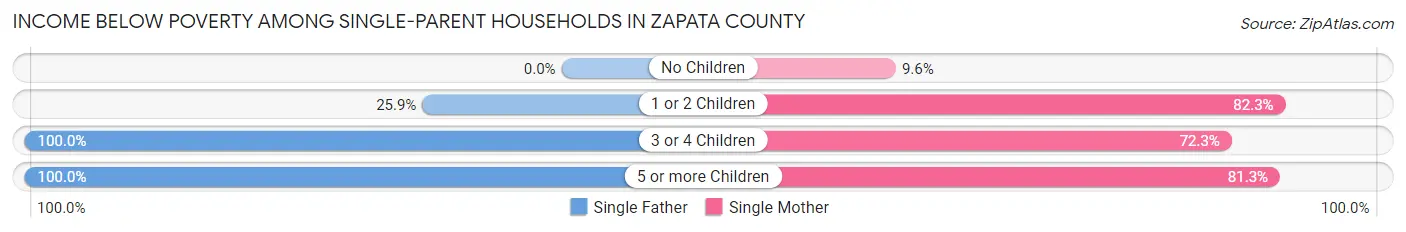
| Children | Single Father | Single Mother |
| No Children | 0 (0.0%) | 28 (9.6%) |
| 1 or 2 Children | 97 (25.9%) | 246 (82.3%) |
| 3 or 4 Children | 25 (100.0%) | 185 (72.3%) |
| 5 or more Children | 26 (100.0%) | 117 (81.2%) |
| Total | 148 (25.3%) | 576 (58.1%) |
Income Below Poverty Among Married-Couple vs Single-Parent Households in Zapata County
The poverty data for Zapata County shows that 265 of the married-couple family households (17.0%) and 724 of the single-parent households (45.9%) are living below the poverty level. Within the married-couple family households, those with 3 or 4 children have the highest poverty rate, with 95 households (24.0%) falling below the poverty line. Among the single-parent households, those with 5 or more children have the highest poverty rate, with 143 household (84.1%) living below poverty.
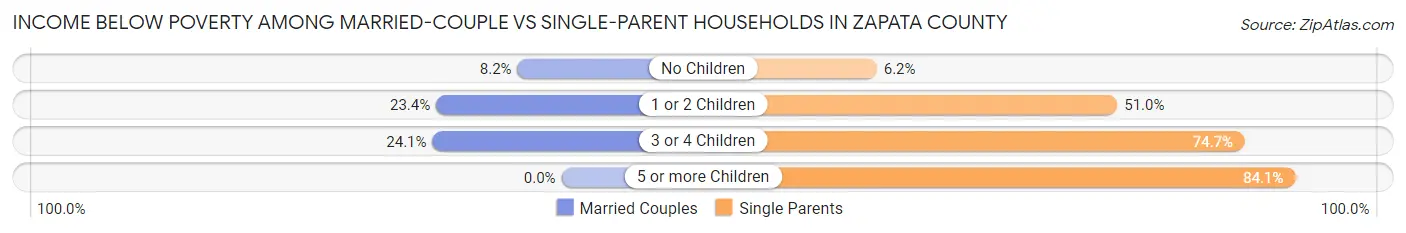
| Children | Married-Couple Families | Single-Parent Households |
| No Children | 55 (8.2%) | 28 (6.2%) |
| 1 or 2 Children | 115 (23.4%) | 343 (51.0%) |
| 3 or 4 Children | 95 (24.0%) | 210 (74.7%) |
| 5 or more Children | 0 (0.0%) | 143 (84.1%) |
| Total | 265 (17.0%) | 724 (45.9%) |
Race in Zapata County
The most populous races in Zapata County are Hispanic or Latino (13,157 | 94.7%), White / Caucasian (7,326 | 52.7%), and Two or more Races (5,321 | 38.3%).
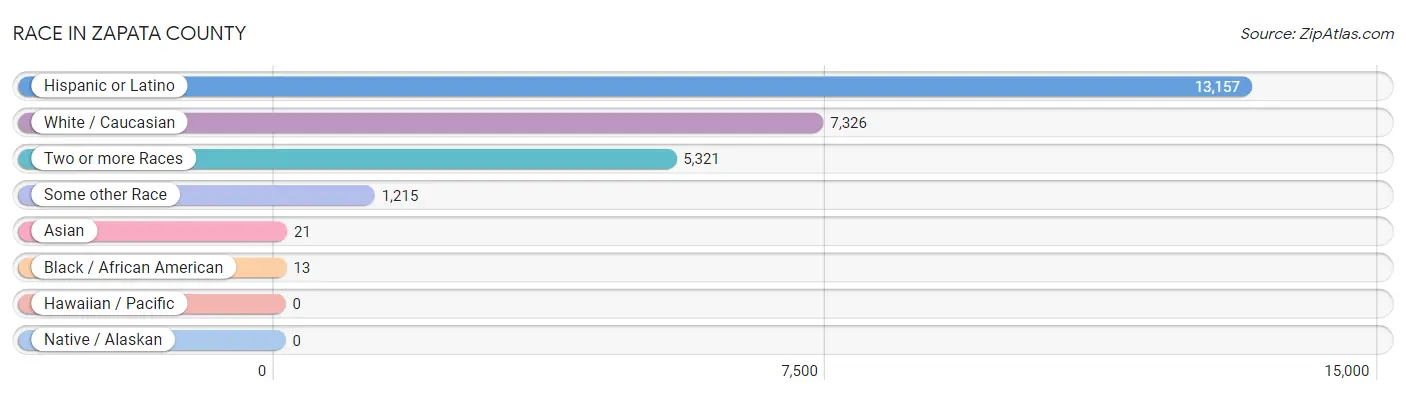
| Race | # Population | % Population |
| Asian | 21 | 0.2% |
| Black / African American | 13 | 0.1% |
| Hawaiian / Pacific | 0 | 0.0% |
| Hispanic or Latino | 13,157 | 94.7% |
| Native / Alaskan | 0 | 0.0% |
| White / Caucasian | 7,326 | 52.7% |
| Two or more Races | 5,321 | 38.3% |
| Some other Race | 1,215 | 8.7% |
| Total | 13,896 | 100.0% |
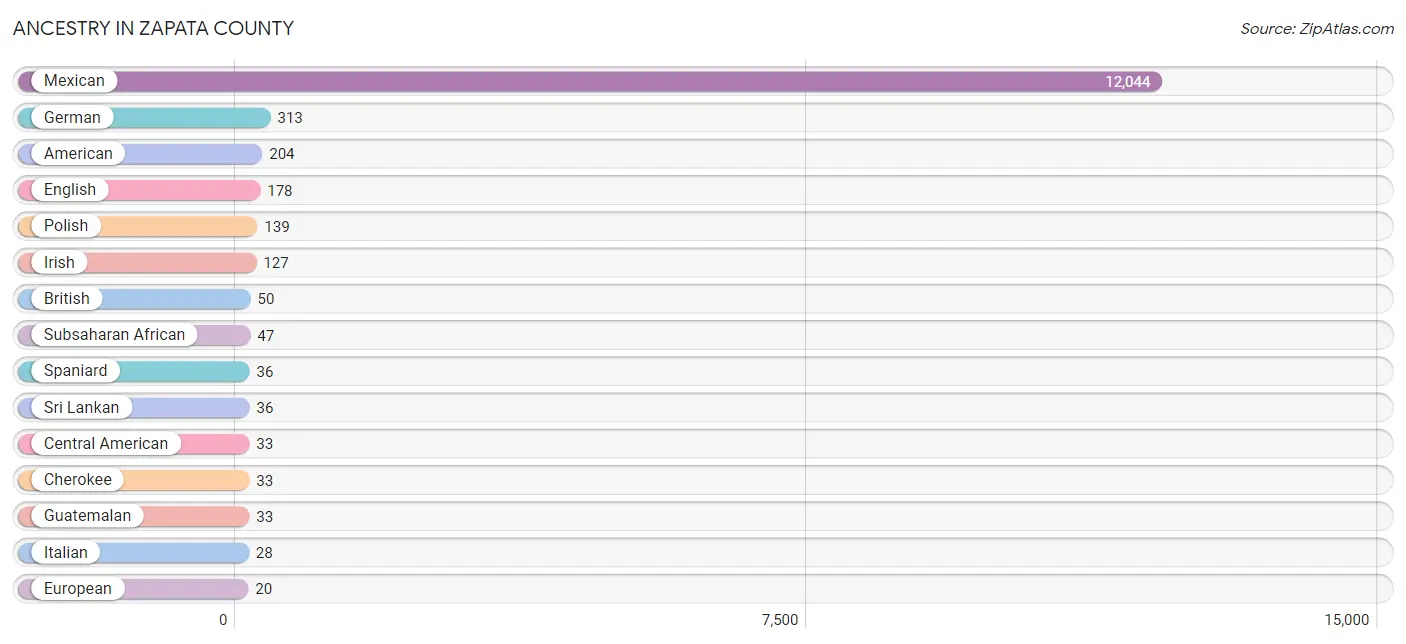
Ancestry in Zapata County
The most populous ancestries reported in Zapata County are Mexican (12,044 | 86.7%), German (313 | 2.2%), American (204 | 1.5%), English (178 | 1.3%), and Polish (139 | 1.0%), together accounting for 92.7% of all Zapata County residents.
| Ancestry | # Population | % Population |
| American | 204 | 1.5% |
| Apache | 2 | 0.0% |
| Austrian | 17 | 0.1% |
| British | 50 | 0.4% |
| Central American | 33 | 0.2% |
| Cherokee | 33 | 0.2% |
| Cuban | 3 | 0.0% |
| Czech | 10 | 0.1% |
| Dutch | 8 | 0.1% |
| Eastern European | 14 | 0.1% |
| English | 178 | 1.3% |
| European | 20 | 0.1% |
| French | 5 | 0.0% |
| German | 313 | 2.2% |
| Guatemalan | 33 | 0.2% |
| Irish | 127 | 0.9% |
| Italian | 28 | 0.2% |
| Mexican | 12,044 | 86.7% |
| Norwegian | 3 | 0.0% |
| Polish | 139 | 1.0% |
| Portuguese | 3 | 0.0% |
| Puerto Rican | 3 | 0.0% |
| Spaniard | 36 | 0.3% |
| Sri Lankan | 36 | 0.3% |
| Subsaharan African | 47 | 0.3% |
| Swedish | 3 | 0.0% | View All 26 Rows |
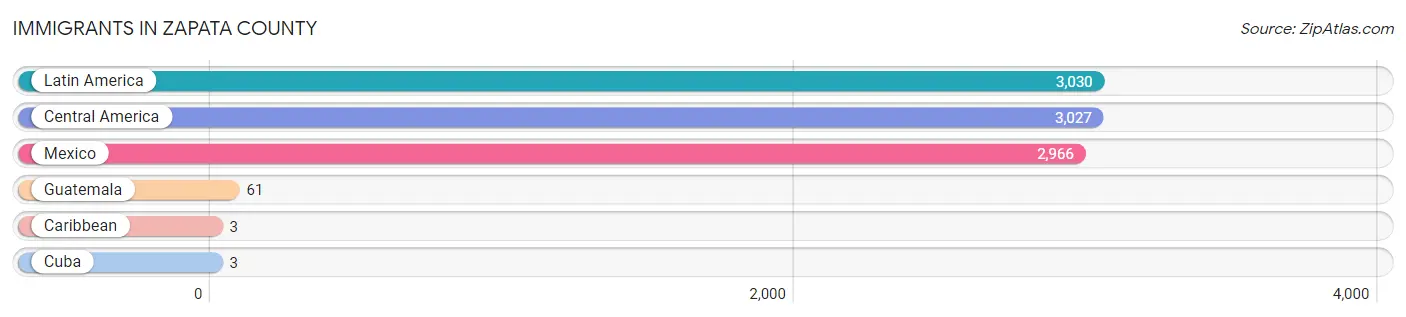
Immigrants in Zapata County
The most numerous immigrant groups reported in Zapata County came from Latin America (3,030 | 21.8%), Central America (3,027 | 21.8%), Mexico (2,966 | 21.3%), Guatemala (61 | 0.4%), and Caribbean (3 | 0.0%), together accounting for 65.4% of all Zapata County residents.
| Immigration Origin | # Population | % Population |
| Caribbean | 3 | 0.0% |
| Central America | 3,027 | 21.8% |
| Cuba | 3 | 0.0% |
| Guatemala | 61 | 0.4% |
| Latin America | 3,030 | 21.8% |
| Mexico | 2,966 | 21.3% | View All 6 Rows |
Sex and Age in Zapata County
Sex and Age in Zapata County
The most populous age groups in Zapata County are 5 to 9 Years (774 | 11.1%) for men and 10 to 14 Years (698 | 10.1%) for women.
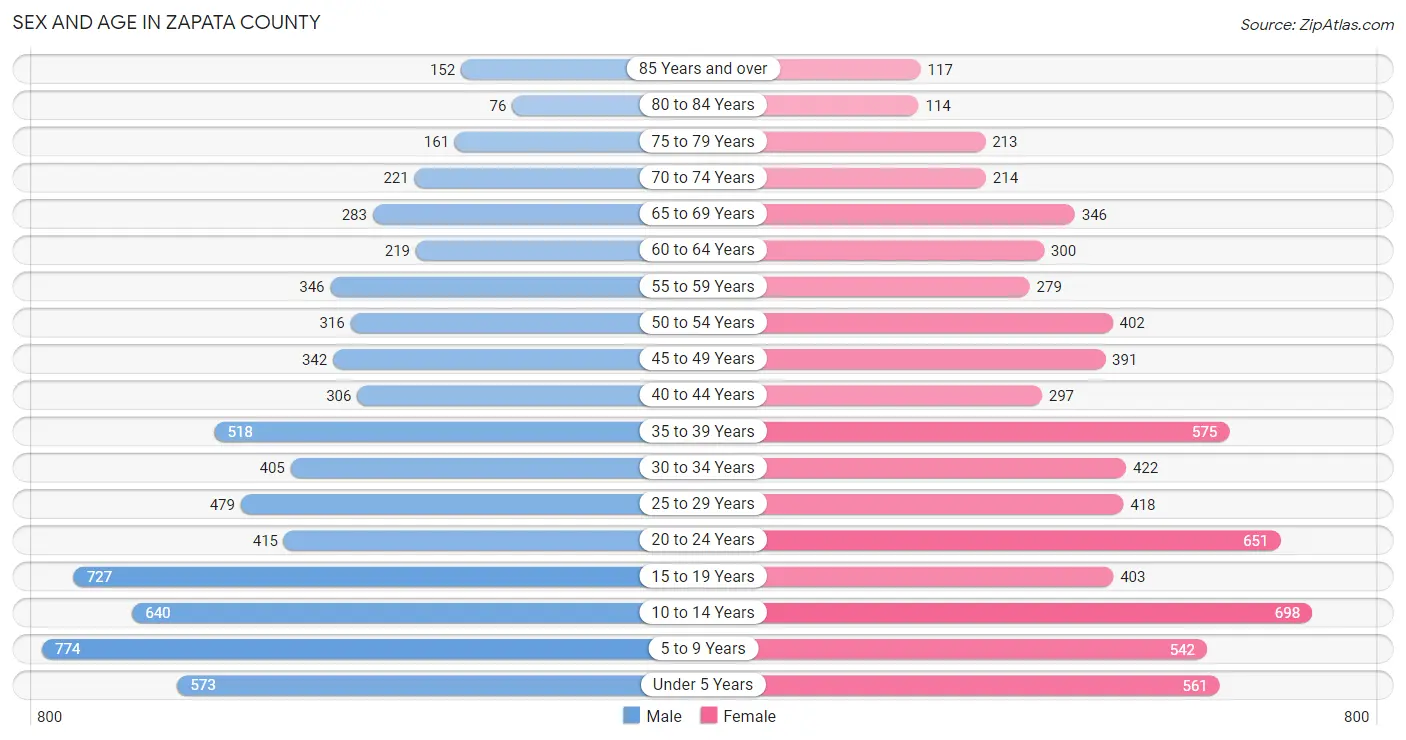
| Age Bracket | Male | Female |
| Under 5 Years | 573 (8.2%) | 561 (8.1%) |
| 5 to 9 Years | 774 (11.1%) | 542 (7.8%) |
| 10 to 14 Years | 640 (9.2%) | 698 (10.1%) |
| 15 to 19 Years | 727 (10.5%) | 403 (5.8%) |
| 20 to 24 Years | 415 (6.0%) | 651 (9.4%) |
| 25 to 29 Years | 479 (6.9%) | 418 (6.0%) |
| 30 to 34 Years | 405 (5.8%) | 422 (6.1%) |
| 35 to 39 Years | 518 (7.4%) | 575 (8.3%) |
| 40 to 44 Years | 306 (4.4%) | 297 (4.3%) |
| 45 to 49 Years | 342 (4.9%) | 391 (5.6%) |
| 50 to 54 Years | 316 (4.5%) | 402 (5.8%) |
| 55 to 59 Years | 346 (5.0%) | 279 (4.0%) |
| 60 to 64 Years | 219 (3.2%) | 300 (4.3%) |
| 65 to 69 Years | 283 (4.1%) | 346 (5.0%) |
| 70 to 74 Years | 221 (3.2%) | 214 (3.1%) |
| 75 to 79 Years | 161 (2.3%) | 213 (3.1%) |
| 80 to 84 Years | 76 (1.1%) | 114 (1.6%) |
| 85 Years and over | 152 (2.2%) | 117 (1.7%) |
| Total | 6,953 (100.0%) | 6,943 (100.0%) |
Families and Households in Zapata County
Median Family Size in Zapata County
The median family size in Zapata County is 3.67 persons per family, with single female/mother families (992 | 31.6%) accounting for the largest median family size of 3.89 persons per family. On the other hand, single male/father families (586 | 18.7%) represent the smallest median family size with 3.26 persons per family.
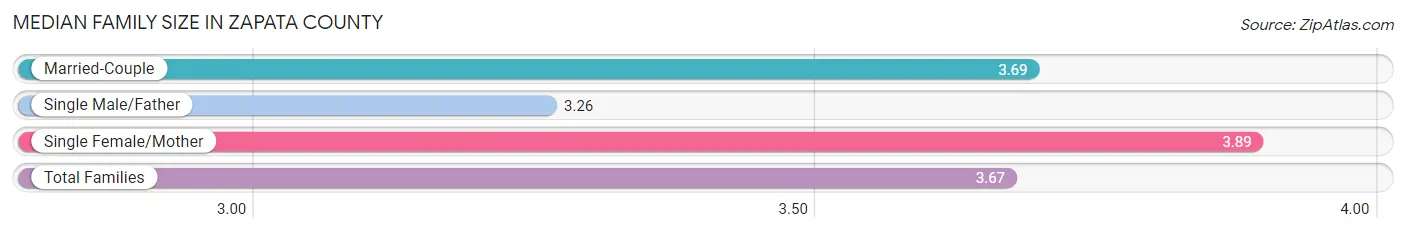
| Family Type | # Families | Family Size |
| Married-Couple | 1,557 (49.7%) | 3.69 |
| Single Male/Father | 586 (18.7%) | 3.26 |
| Single Female/Mother | 992 (31.6%) | 3.89 |
| Total Families | 3,135 (100.0%) | 3.67 |
Median Household Size in Zapata County
The median household size in Zapata County is 3.01 persons per household, with single female/mother households (992 | 21.7%) accounting for the largest median household size of 4.27 persons per household. non-family households (1,445 | 31.6%) represent the smallest median household size with 1.11 persons per household.
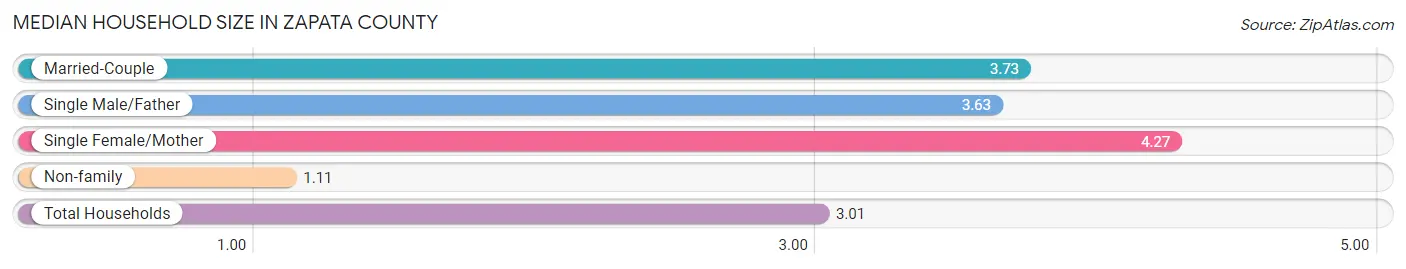
| Household Type | # Households | Household Size |
| Married-Couple | 1,557 (34.0%) | 3.73 |
| Single Male/Father | 586 (12.8%) | 3.63 |
| Single Female/Mother | 992 (21.7%) | 4.27 |
| Non-family | 1,445 (31.6%) | 1.11 |
| Total Households | 4,580 (100.0%) | 3.01 |
Household Size by Marriage Status in Zapata County
Out of a total of 4,580 households in Zapata County, 3,135 (68.4%) are family households, while 1,445 (31.6%) are nonfamily households. The most numerous type of family households are 2-person households, comprising 969, and the most common type of nonfamily households are 1-person households, comprising 1,302.
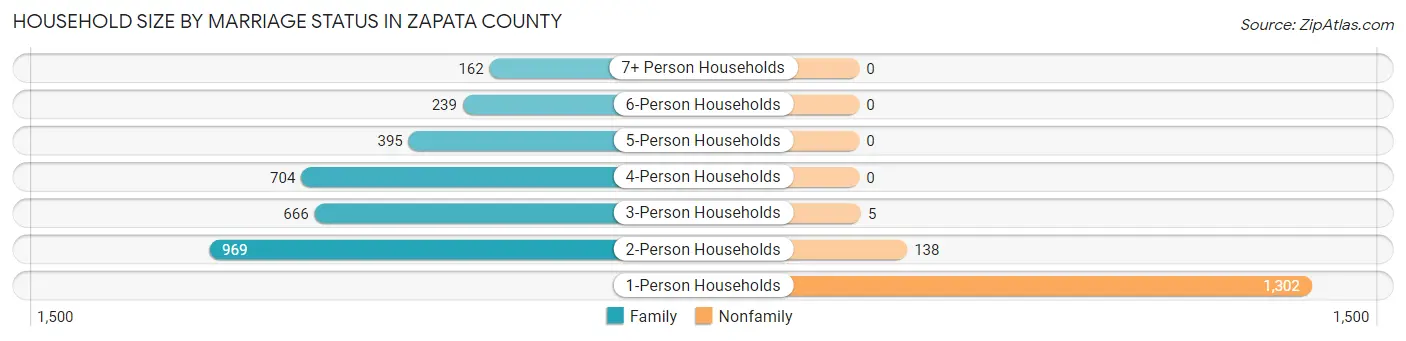
| Household Size | Family Households | Nonfamily Households |
| 1-Person Households | - | 1,302 (28.4%) |
| 2-Person Households | 969 (21.2%) | 138 (3.0%) |
| 3-Person Households | 666 (14.5%) | 5 (0.1%) |
| 4-Person Households | 704 (15.4%) | 0 (0.0%) |
| 5-Person Households | 395 (8.6%) | 0 (0.0%) |
| 6-Person Households | 239 (5.2%) | 0 (0.0%) |
| 7+ Person Households | 162 (3.5%) | 0 (0.0%) |
| Total | 3,135 (68.4%) | 1,445 (31.6%) |
Female Fertility in Zapata County
Fertility by Age in Zapata County
Average fertility rate in Zapata County is 89.0 births per 1,000 women. Women in the age bracket of 20 to 34 years have the highest fertility rate with 193.0 births per 1,000 women. Women in the age bracket of 20 to 34 years acount for 100.0% of all women with births.
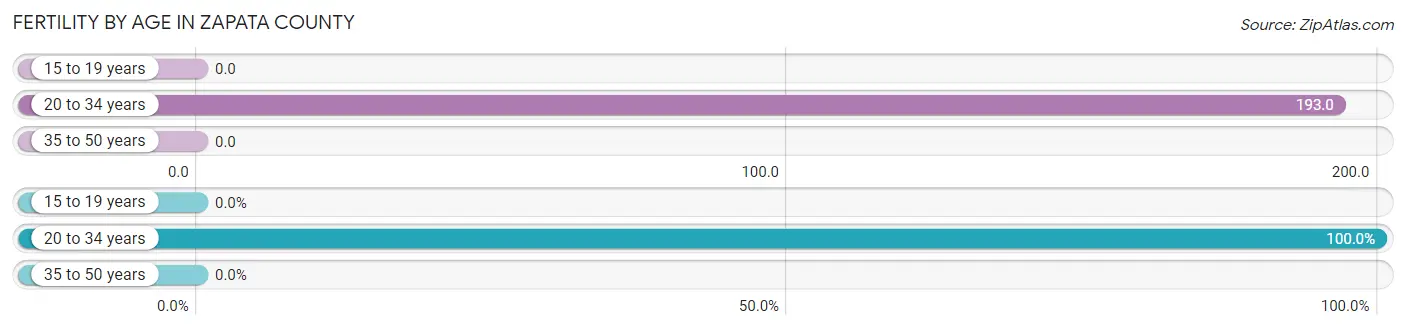
| Age Bracket | Women with Births | Births / 1,000 Women |
| 15 to 19 years | 0 (0.0%) | 0.0 |
| 20 to 34 years | 288 (100.0%) | 193.0 |
| 35 to 50 years | 0 (0.0%) | 0.0 |
| Total | 288 (100.0%) | 89.0 |
Fertility by Age by Marriage Status in Zapata County
19.4% of women with births (288) in Zapata County are married. The highest percentage of unmarried women with births falls into 20 to 34 years age bracket with 80.6% of them unmarried at the time of birth, while the lowest percentage of unmarried women with births belong to 20 to 34 years age bracket with 80.6% of them unmarried.
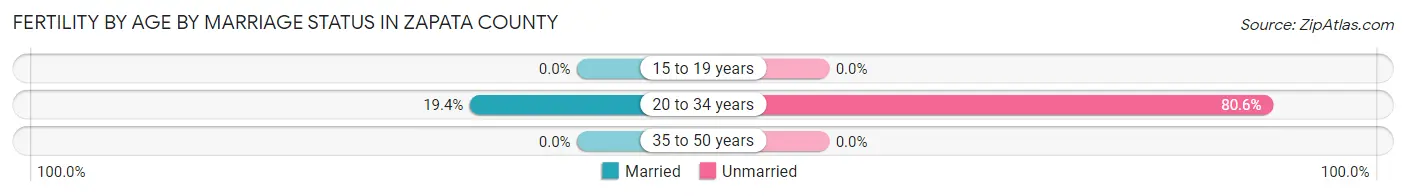
| Age Bracket | Married | Unmarried |
| 15 to 19 years | 0 (0.0%) | 0 (0.0%) |
| 20 to 34 years | 56 (19.4%) | 232 (80.6%) |
| 35 to 50 years | 0 (0.0%) | 0 (0.0%) |
| Total | 56 (19.4%) | 232 (80.6%) |
Fertility by Education in Zapata County
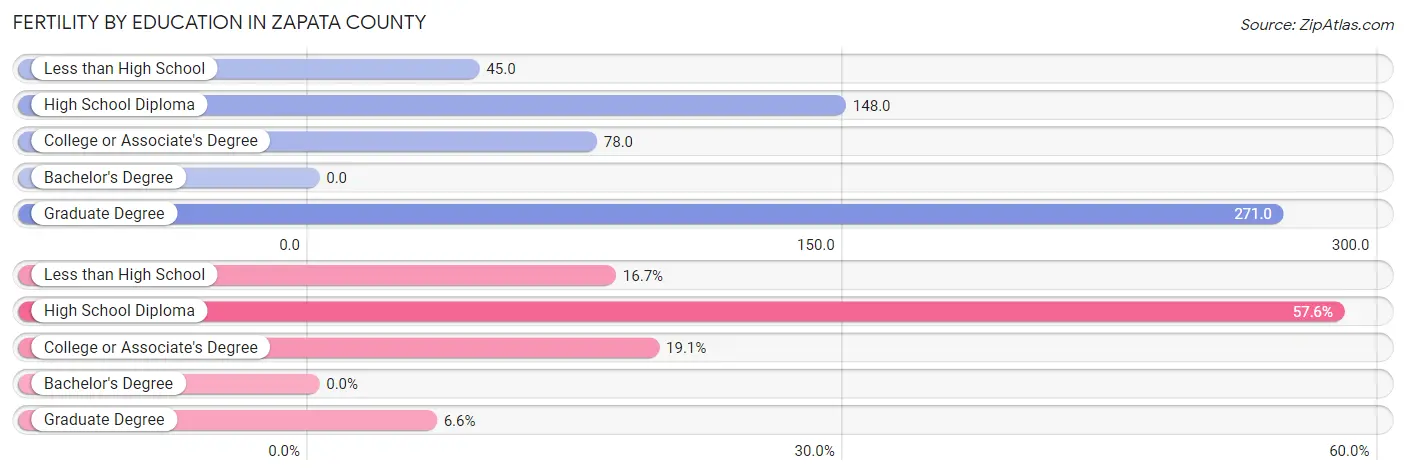
| Educational Attainment | Women with Births | Births / 1,000 Women |
| Less than High School | 48 (16.7%) | 45.0 |
| High School Diploma | 166 (57.6%) | 148.0 |
| College or Associate's Degree | 55 (19.1%) | 78.0 |
| Bachelor's Degree | 0 (0.0%) | 0.0 |
| Graduate Degree | 19 (6.6%) | 271.0 |
| Total | 288 (100.0%) | 89.0 |
Fertility by Education by Marriage Status in Zapata County
80.6% of women with births in Zapata County are unmarried. Women with the educational attainment of college or associate's degree are most likely to be married with 67.3% of them married at childbirth, while women with the educational attainment of high school diploma are least likely to be married with 100.0% of them unmarried at childbirth.
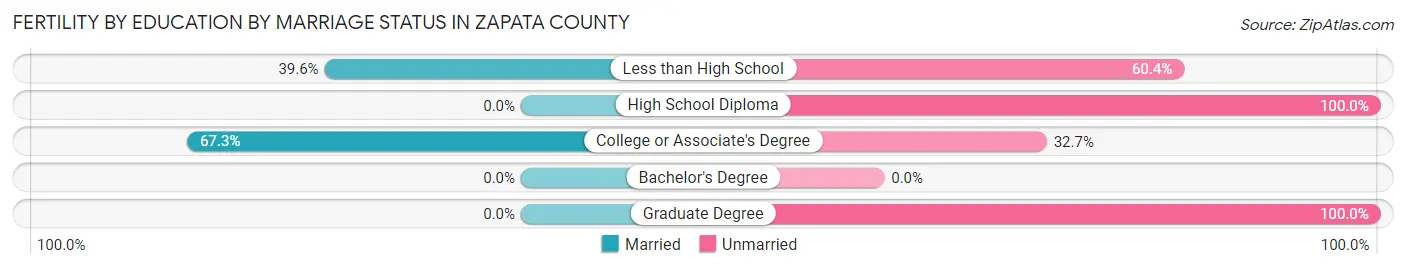
| Educational Attainment | Married | Unmarried |
| Less than High School | 19 (39.6%) | 29 (60.4%) |
| High School Diploma | 0 (0.0%) | 166 (100.0%) |
| College or Associate's Degree | 37 (67.3%) | 18 (32.7%) |
| Bachelor's Degree | 0 (0.0%) | 0 (0.0%) |
| Graduate Degree | 0 (0.0%) | 19 (100.0%) |
| Total | 56 (19.4%) | 232 (80.6%) |
Employment Characteristics in Zapata County
Employment by Class of Employer in Zapata County
Among the 4,669 employed individuals in Zapata County, private company employees (2,758 | 59.1%), self-employed (not incorporated) (592 | 12.7%), and local government employees (563 | 12.1%) make up the most common classes of employment.
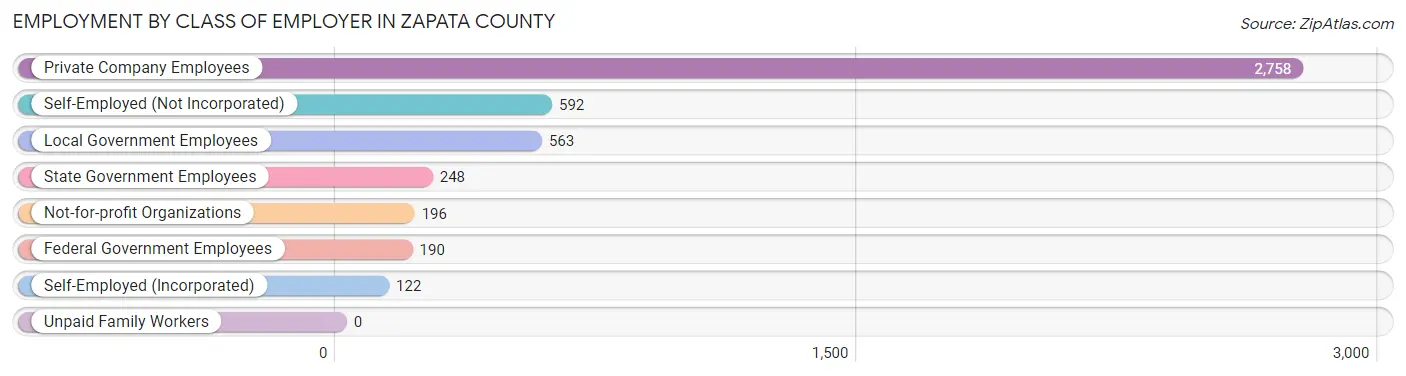
| Employer Class | # Employees | % Employees |
| Private Company Employees | 2,758 | 59.1% |
| Self-Employed (Incorporated) | 122 | 2.6% |
| Self-Employed (Not Incorporated) | 592 | 12.7% |
| Not-for-profit Organizations | 196 | 4.2% |
| Local Government Employees | 563 | 12.1% |
| State Government Employees | 248 | 5.3% |
| Federal Government Employees | 190 | 4.1% |
| Unpaid Family Workers | 0 | 0.0% |
| Total | 4,669 | 100.0% |
Employment Status by Age in Zapata County
According to the labor force statistics for Zapata County, out of the total population over 16 years of age (9,806), 53.7% or 5,266 individuals are in the labor force, with 8.1% or 427 of them unemployed. The age group with the highest labor force participation rate is 25 to 29 years, with 81.0% or 727 individuals in the labor force. Within the labor force, the 16 to 19 years age range has the highest percentage of unemployed individuals, with 73.6% or 145 of them being unemployed.
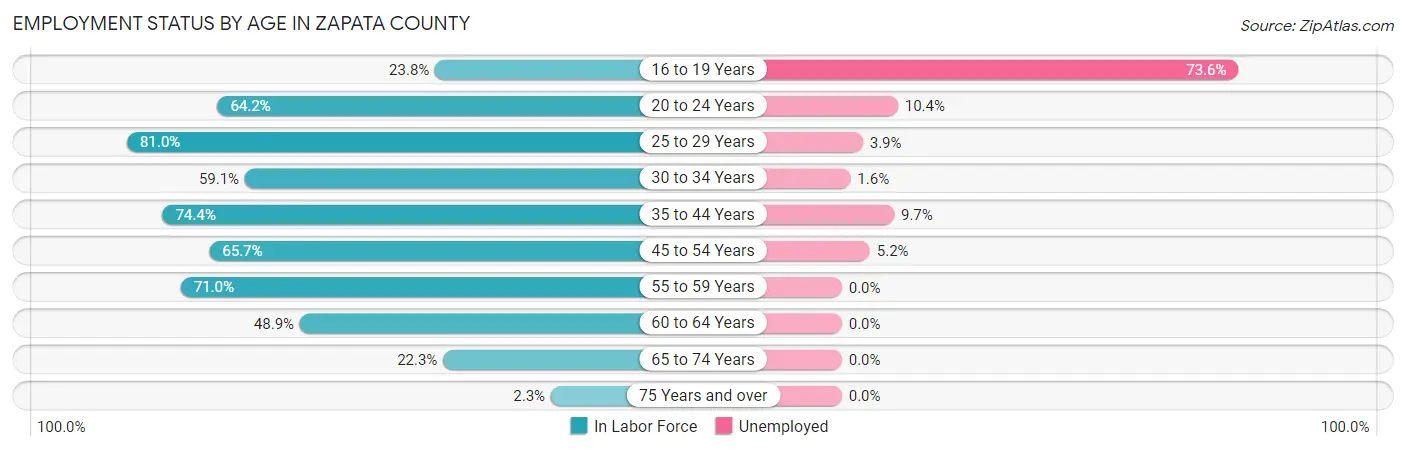
| Age Bracket | In Labor Force | Unemployed |
| 16 to 19 Years | 197 (23.8%) | 145 (73.6%) |
| 20 to 24 Years | 684 (64.2%) | 71 (10.4%) |
| 25 to 29 Years | 727 (81.0%) | 28 (3.9%) |
| 30 to 34 Years | 489 (59.1%) | 8 (1.6%) |
| 35 to 44 Years | 1,262 (74.4%) | 122 (9.7%) |
| 45 to 54 Years | 953 (65.7%) | 50 (5.2%) |
| 55 to 59 Years | 444 (71.0%) | 0 (0.0%) |
| 60 to 64 Years | 254 (48.9%) | 0 (0.0%) |
| 65 to 74 Years | 237 (22.3%) | 0 (0.0%) |
| 75 Years and over | 19 (2.3%) | 0 (0.0%) |
| Total | 5,266 (53.7%) | 427 (8.1%) |
Employment Status by Educational Attainment in Zapata County
According to labor force statistics for Zapata County, 68.7% of individuals (4,132) out of the total population between 25 and 64 years of age (6,015) are in the labor force, with 5.0% or 207 of them being unemployed. The group with the highest labor force participation rate are those with the educational attainment of college / associate degree, with 86.0% or 1,400 individuals in the labor force. Within the labor force, individuals with high school diploma education have the highest percentage of unemployment, with 10.2% or 113 of them being unemployed.
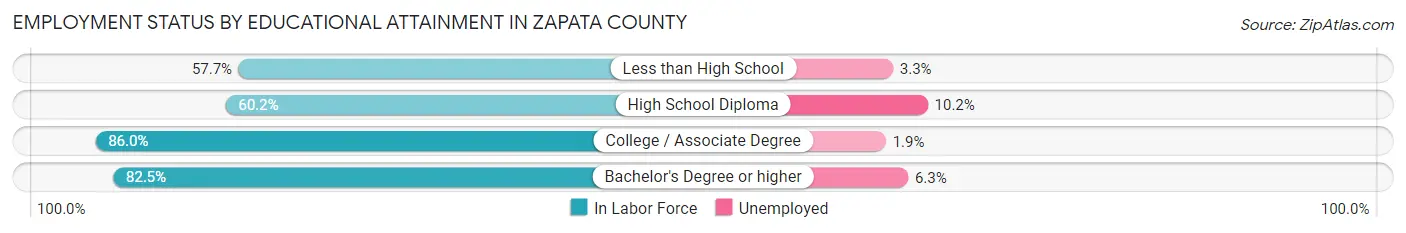
| Educational Attainment | In Labor Force | Unemployed |
| Less than High School | 1,118 (57.7%) | 64 (3.3%) |
| High School Diploma | 1,106 (60.2%) | 187 (10.2%) |
| College / Associate Degree | 1,400 (86.0%) | 31 (1.9%) |
| Bachelor's Degree or higher | 505 (82.5%) | 39 (6.3%) |
| Total | 4,132 (68.7%) | 301 (5.0%) |
Employment Occupations by Sex in Zapata County
Management, Business, Science and Arts Occupations
The most common Management, Business, Science and Arts occupations in Zapata County are Community & Social Service (388 | 8.0%), Education Instruction & Library (320 | 6.6%), Business & Financial (230 | 4.8%), Health Diagnosing & Treating (219 | 4.5%), and Management (188 | 3.9%).
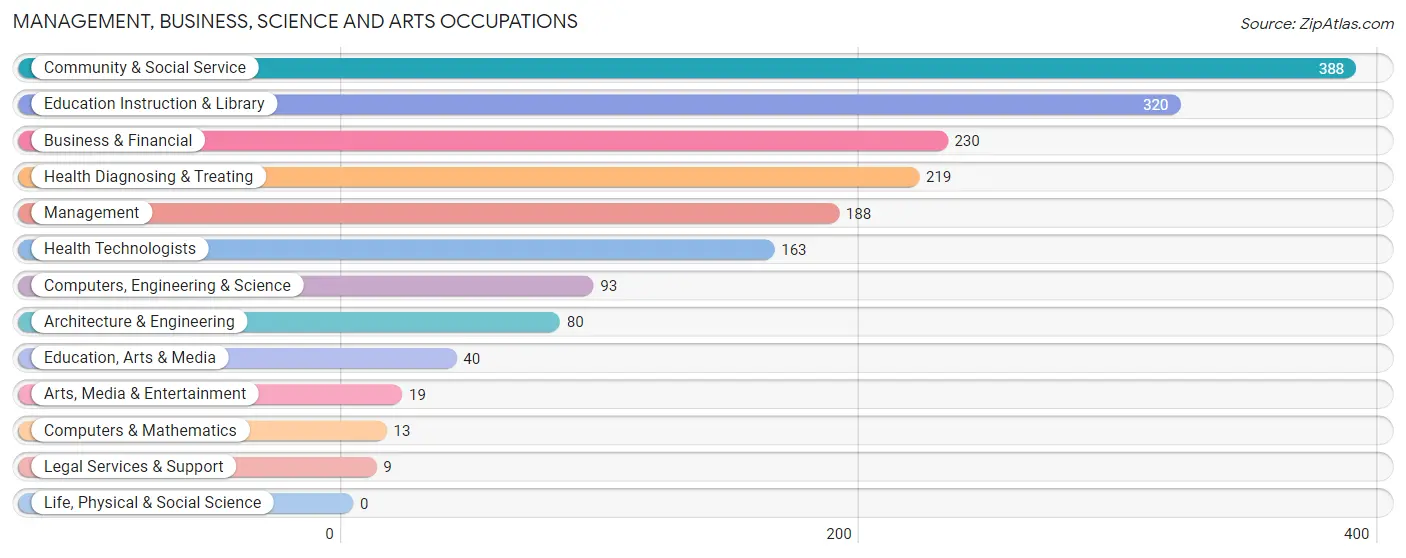
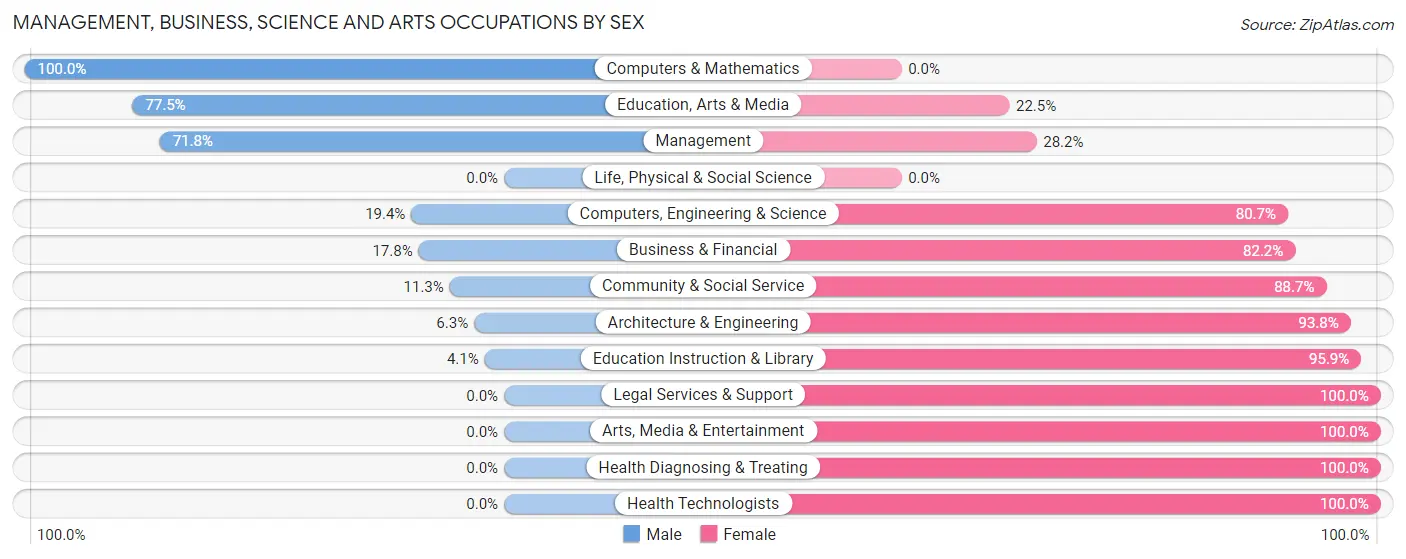
Management, Business, Science and Arts Occupations by Sex
Within the Management, Business, Science and Arts occupations in Zapata County, the most male-oriented occupations are Computers & Mathematics (100.0%), Education, Arts & Media (77.5%), and Management (71.8%), while the most female-oriented occupations are Legal Services & Support (100.0%), Arts, Media & Entertainment (100.0%), and Health Diagnosing & Treating (100.0%).
| Occupation | Male | Female |
| Management | 135 (71.8%) | 53 (28.2%) |
| Business & Financial | 41 (17.8%) | 189 (82.2%) |
| Computers, Engineering & Science | 18 (19.4%) | 75 (80.6%) |
| Computers & Mathematics | 13 (100.0%) | 0 (0.0%) |
| Architecture & Engineering | 5 (6.2%) | 75 (93.8%) |
| Life, Physical & Social Science | 0 (0.0%) | 0 (0.0%) |
| Community & Social Service | 44 (11.3%) | 344 (88.7%) |
| Education, Arts & Media | 31 (77.5%) | 9 (22.5%) |
| Legal Services & Support | 0 (0.0%) | 9 (100.0%) |
| Education Instruction & Library | 13 (4.1%) | 307 (95.9%) |
| Arts, Media & Entertainment | 0 (0.0%) | 19 (100.0%) |
| Health Diagnosing & Treating | 0 (0.0%) | 219 (100.0%) |
| Health Technologists | 0 (0.0%) | 163 (100.0%) |
| Total (Category) | 238 (21.3%) | 880 (78.7%) |
| Total (Overall) | 2,672 (55.2%) | 2,171 (44.8%) |
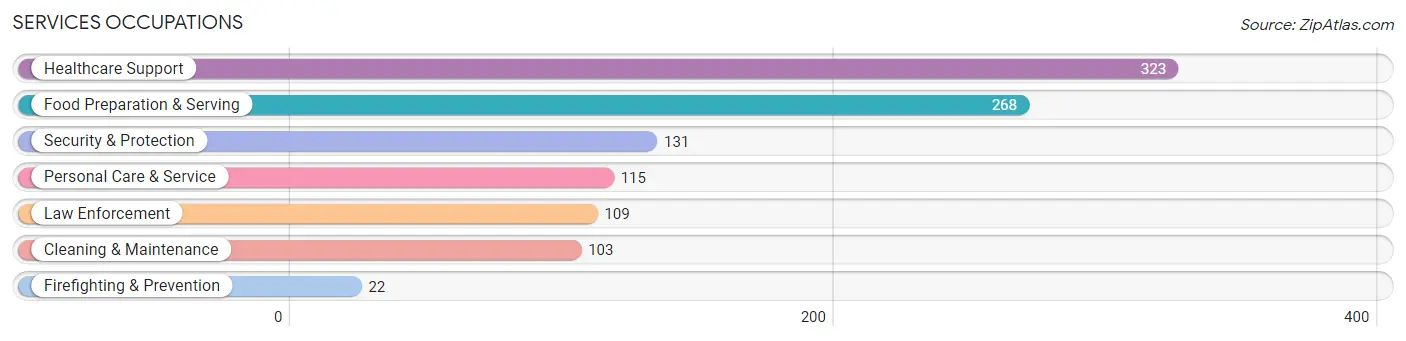
Services Occupations
The most common Services occupations in Zapata County are Healthcare Support (323 | 6.7%), Food Preparation & Serving (268 | 5.5%), Security & Protection (131 | 2.7%), Personal Care & Service (115 | 2.4%), and Law Enforcement (109 | 2.2%).
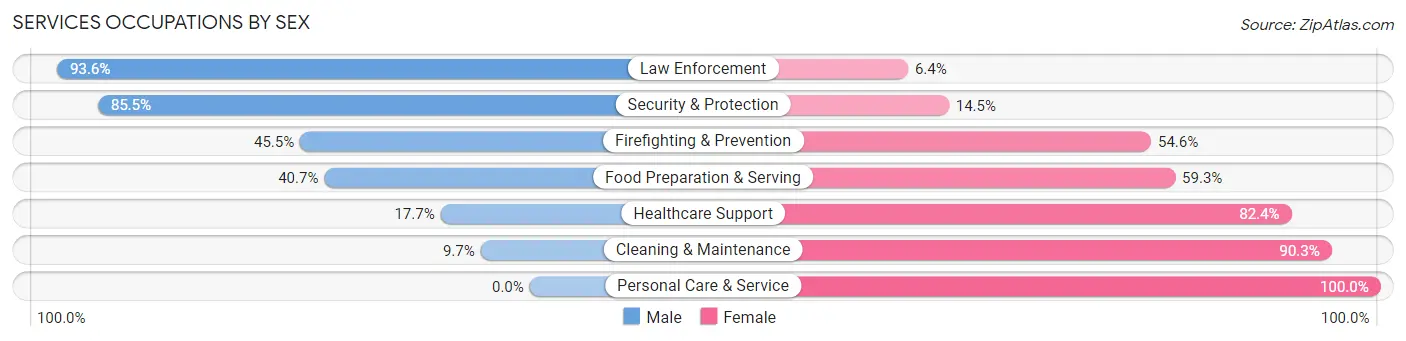
Services Occupations by Sex
Within the Services occupations in Zapata County, the most male-oriented occupations are Law Enforcement (93.6%), Security & Protection (85.5%), and Firefighting & Prevention (45.5%), while the most female-oriented occupations are Personal Care & Service (100.0%), Cleaning & Maintenance (90.3%), and Healthcare Support (82.4%).
| Occupation | Male | Female |
| Healthcare Support | 57 (17.6%) | 266 (82.4%) |
| Security & Protection | 112 (85.5%) | 19 (14.5%) |
| Firefighting & Prevention | 10 (45.5%) | 12 (54.5%) |
| Law Enforcement | 102 (93.6%) | 7 (6.4%) |
| Food Preparation & Serving | 109 (40.7%) | 159 (59.3%) |
| Cleaning & Maintenance | 10 (9.7%) | 93 (90.3%) |
| Personal Care & Service | 0 (0.0%) | 115 (100.0%) |
| Total (Category) | 288 (30.6%) | 652 (69.4%) |
| Total (Overall) | 2,672 (55.2%) | 2,171 (44.8%) |
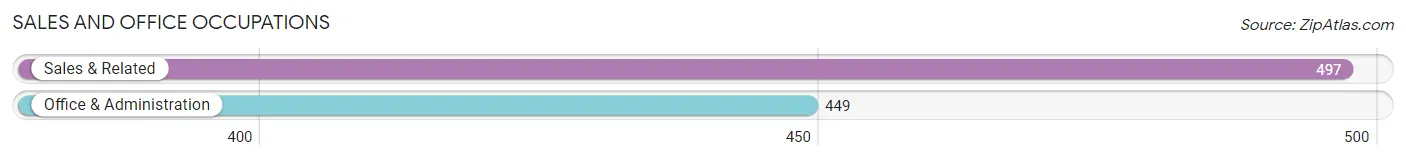
Sales and Office Occupations
The most common Sales and Office occupations in Zapata County are Sales & Related (497 | 10.3%), and Office & Administration (449 | 9.3%).
Sales and Office Occupations by Sex
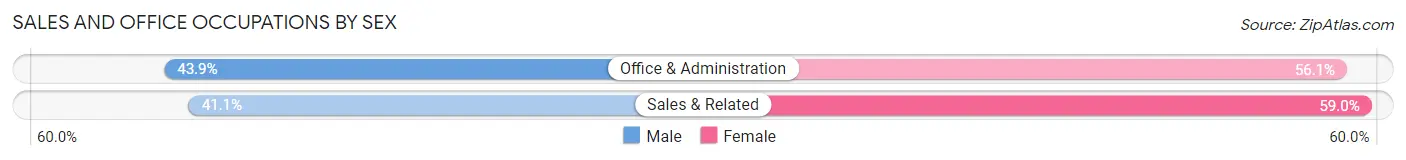
| Occupation | Male | Female |
| Sales & Related | 204 (41.0%) | 293 (59.0%) |
| Office & Administration | 197 (43.9%) | 252 (56.1%) |
| Total (Category) | 401 (42.4%) | 545 (57.6%) |
| Total (Overall) | 2,672 (55.2%) | 2,171 (44.8%) |
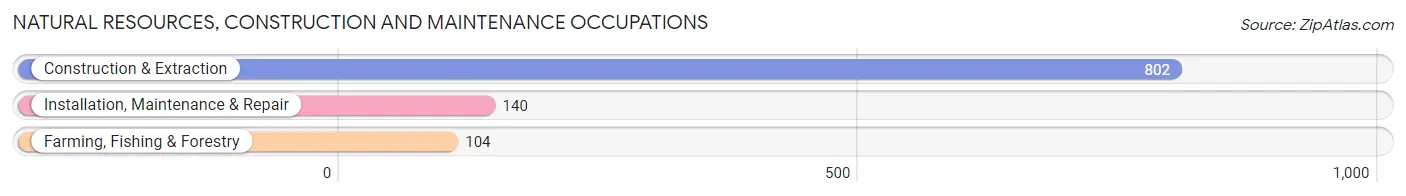
Natural Resources, Construction and Maintenance Occupations
The most common Natural Resources, Construction and Maintenance occupations in Zapata County are Construction & Extraction (802 | 16.6%), Installation, Maintenance & Repair (140 | 2.9%), and Farming, Fishing & Forestry (104 | 2.1%).
Natural Resources, Construction and Maintenance Occupations by Sex
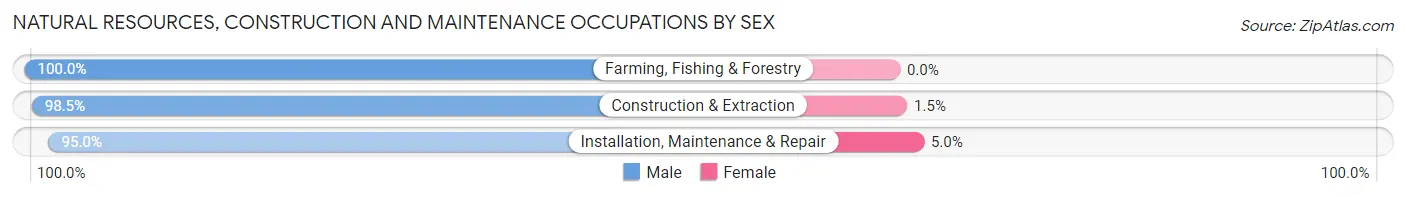
| Occupation | Male | Female |
| Farming, Fishing & Forestry | 104 (100.0%) | 0 (0.0%) |
| Construction & Extraction | 790 (98.5%) | 12 (1.5%) |
| Installation, Maintenance & Repair | 133 (95.0%) | 7 (5.0%) |
| Total (Category) | 1,027 (98.2%) | 19 (1.8%) |
| Total (Overall) | 2,672 (55.2%) | 2,171 (44.8%) |
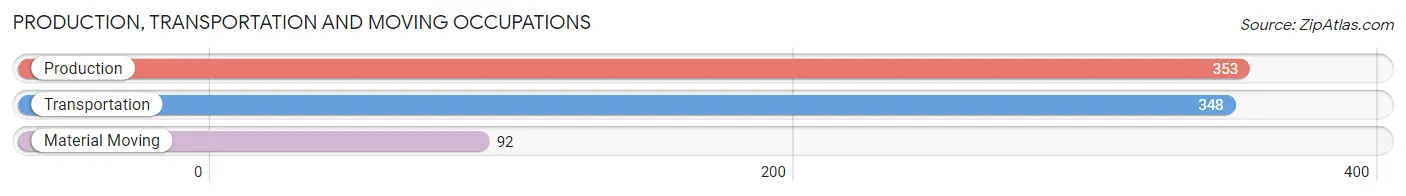
Production, Transportation and Moving Occupations
The most common Production, Transportation and Moving occupations in Zapata County are Production (353 | 7.3%), Transportation (348 | 7.2%), and Material Moving (92 | 1.9%).
Production, Transportation and Moving Occupations by Sex
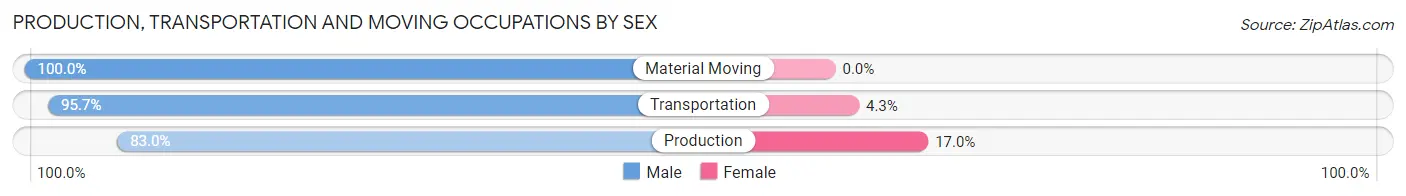
| Occupation | Male | Female |
| Production | 293 (83.0%) | 60 (17.0%) |
| Transportation | 333 (95.7%) | 15 (4.3%) |
| Material Moving | 92 (100.0%) | 0 (0.0%) |
| Total (Category) | 718 (90.5%) | 75 (9.5%) |
| Total (Overall) | 2,672 (55.2%) | 2,171 (44.8%) |
Employment Industries by Sex in Zapata County
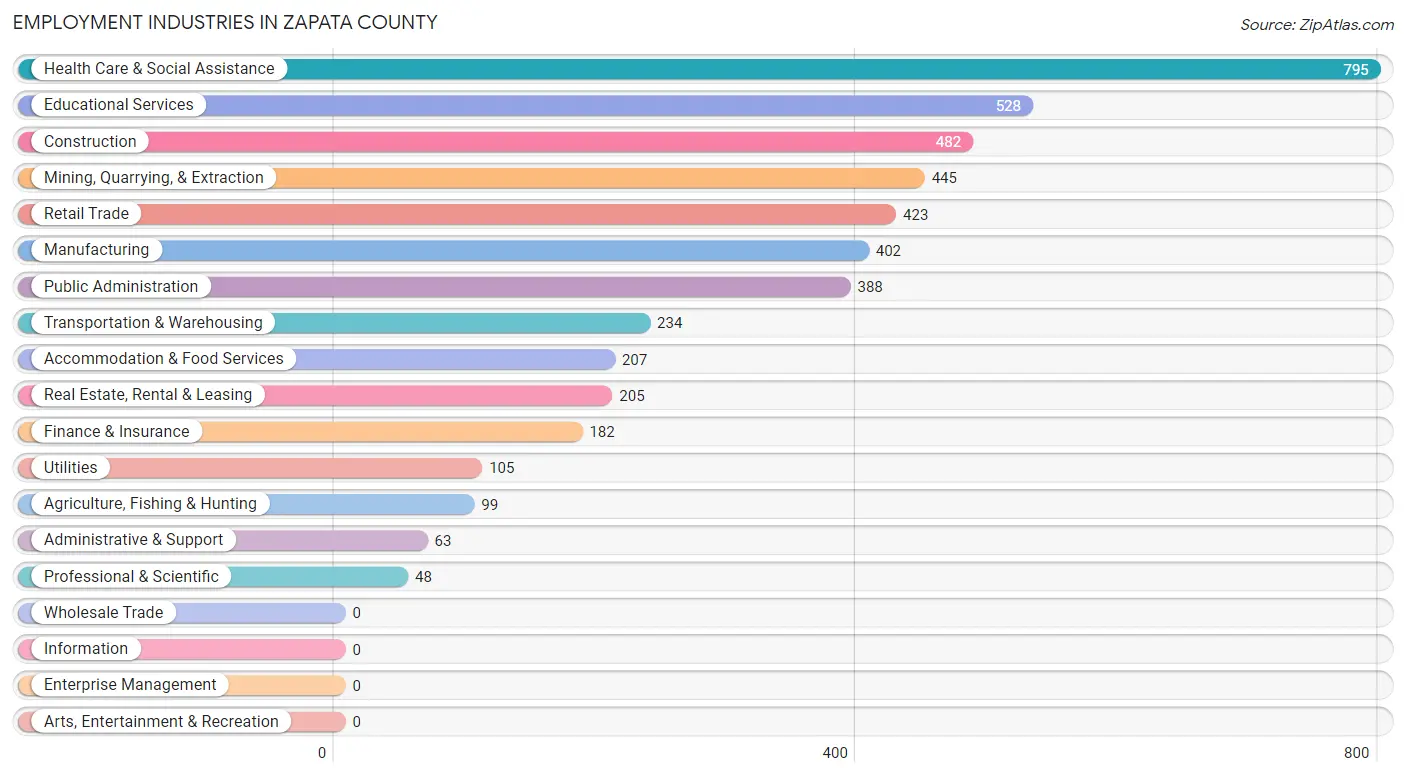
Employment Industries in Zapata County
The major employment industries in Zapata County include Health Care & Social Assistance (795 | 16.4%), Educational Services (528 | 10.9%), Construction (482 | 10.0%), Mining, Quarrying, & Extraction (445 | 9.2%), and Retail Trade (423 | 8.7%).
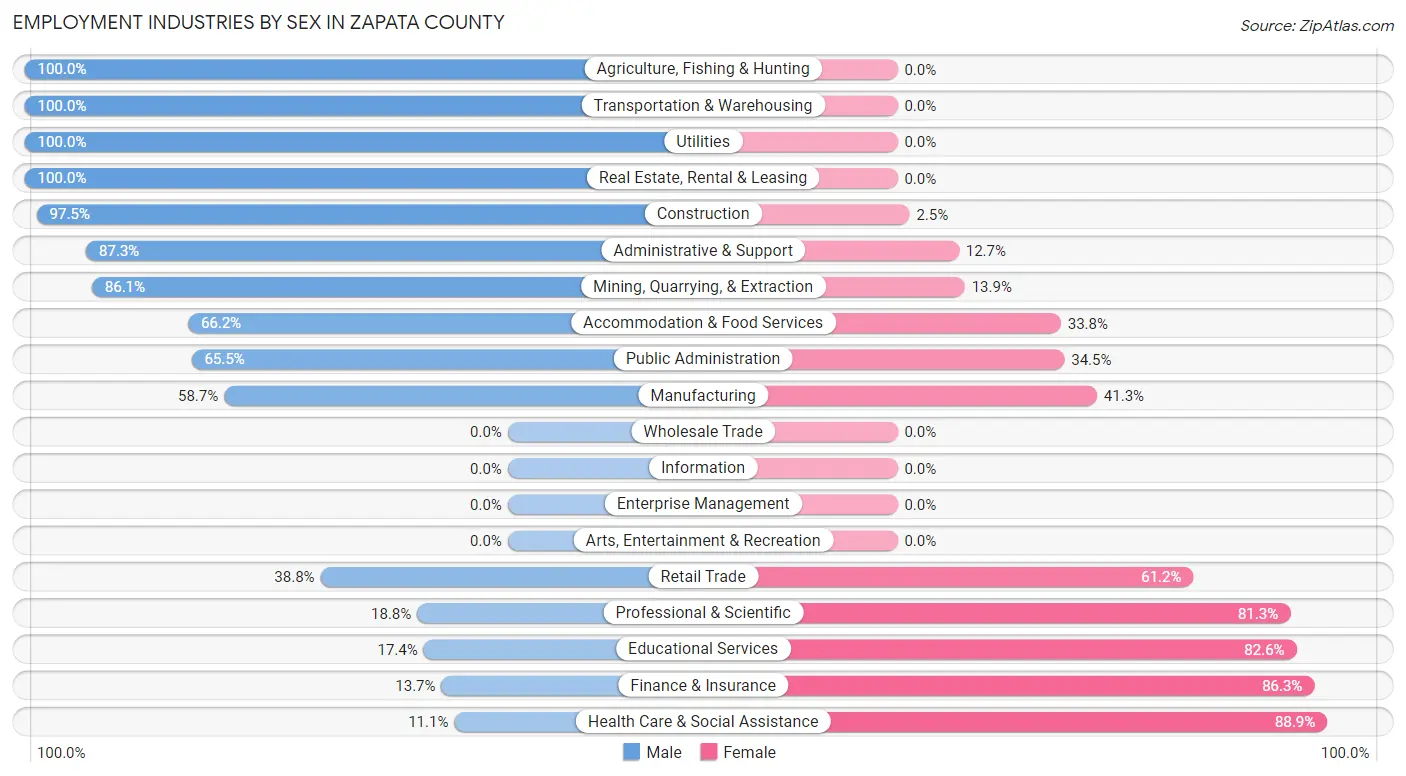
Employment Industries by Sex in Zapata County
The Zapata County industries that see more men than women are Agriculture, Fishing & Hunting (100.0%), Transportation & Warehousing (100.0%), and Utilities (100.0%), whereas the industries that tend to have a higher number of women are Health Care & Social Assistance (88.9%), Finance & Insurance (86.3%), and Educational Services (82.6%).
| Industry | Male | Female |
| Agriculture, Fishing & Hunting | 99 (100.0%) | 0 (0.0%) |
| Mining, Quarrying, & Extraction | 383 (86.1%) | 62 (13.9%) |
| Construction | 470 (97.5%) | 12 (2.5%) |
| Manufacturing | 236 (58.7%) | 166 (41.3%) |
| Wholesale Trade | 0 (0.0%) | 0 (0.0%) |
| Retail Trade | 164 (38.8%) | 259 (61.2%) |
| Transportation & Warehousing | 234 (100.0%) | 0 (0.0%) |
| Utilities | 105 (100.0%) | 0 (0.0%) |
| Information | 0 (0.0%) | 0 (0.0%) |
| Finance & Insurance | 25 (13.7%) | 157 (86.3%) |
| Real Estate, Rental & Leasing | 205 (100.0%) | 0 (0.0%) |
| Professional & Scientific | 9 (18.8%) | 39 (81.2%) |
| Enterprise Management | 0 (0.0%) | 0 (0.0%) |
| Administrative & Support | 55 (87.3%) | 8 (12.7%) |
| Educational Services | 92 (17.4%) | 436 (82.6%) |
| Health Care & Social Assistance | 88 (11.1%) | 707 (88.9%) |
| Arts, Entertainment & Recreation | 0 (0.0%) | 0 (0.0%) |
| Accommodation & Food Services | 137 (66.2%) | 70 (33.8%) |
| Public Administration | 254 (65.5%) | 134 (34.5%) |
| Total | 2,672 (55.2%) | 2,171 (44.8%) |
Education in Zapata County
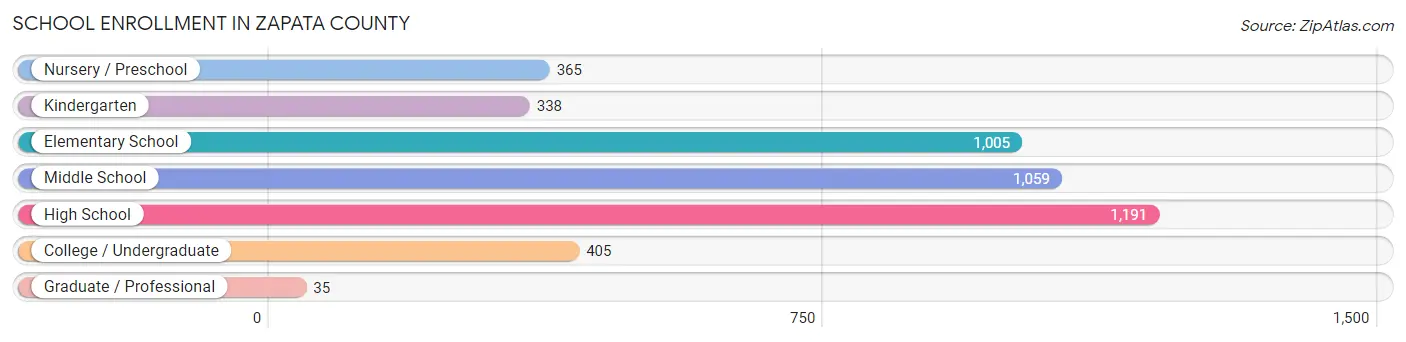
School Enrollment in Zapata County
The most common levels of schooling among the 4,398 students in Zapata County are high school (1,191 | 27.1%), middle school (1,059 | 24.1%), and elementary school (1,005 | 22.9%).
| School Level | # Students | % Students |
| Nursery / Preschool | 365 | 8.3% |
| Kindergarten | 338 | 7.7% |
| Elementary School | 1,005 | 22.9% |
| Middle School | 1,059 | 24.1% |
| High School | 1,191 | 27.1% |
| College / Undergraduate | 405 | 9.2% |
| Graduate / Professional | 35 | 0.8% |
| Total | 4,398 | 100.0% |
School Enrollment by Age by Funding Source in Zapata County
Out of a total of 4,398 students who are enrolled in schools in Zapata County, 40 (0.9%) attend a private institution, while the remaining 4,358 (99.1%) are enrolled in public schools. The age group of 10 to 14 year olds has the highest likelihood of being enrolled in private schools, with 39 (2.9% in the age bracket) enrolled. Conversely, the age group of 3 to 4 year olds has the lowest likelihood of being enrolled in a private school, with 336 (100.0% in the age bracket) attending a public institution.
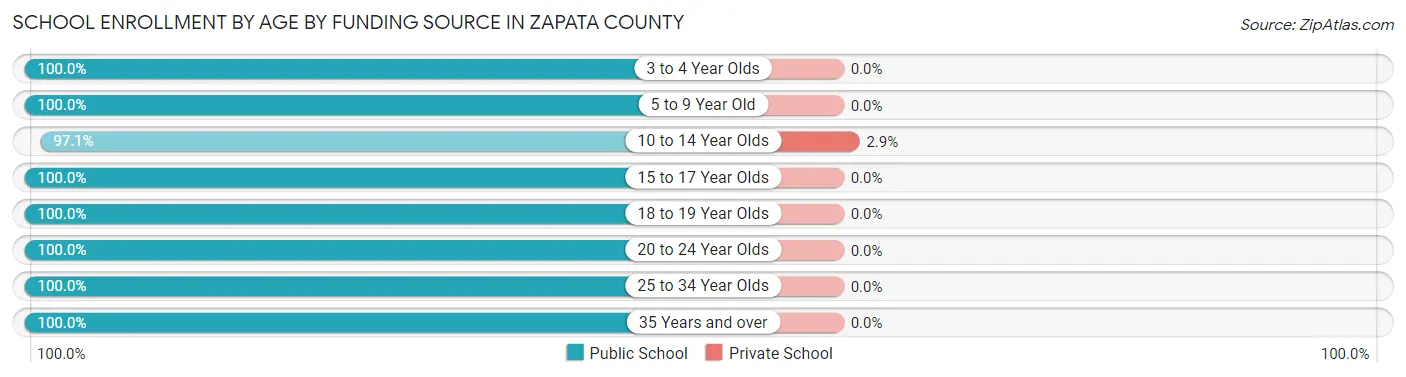
| Age Bracket | Public School | Private School |
| 3 to 4 Year Olds | 336 (100.0%) | 0 (0.0%) |
| 5 to 9 Year Old | 1,261 (100.0%) | 0 (0.0%) |
| 10 to 14 Year Olds | 1,286 (97.1%) | 39 (2.9%) |
| 15 to 17 Year Olds | 732 (100.0%) | 0 (0.0%) |
| 18 to 19 Year Olds | 318 (100.0%) | 0 (0.0%) |
| 20 to 24 Year Olds | 121 (100.0%) | 0 (0.0%) |
| 25 to 34 Year Olds | 240 (100.0%) | 0 (0.0%) |
| 35 Years and over | 65 (100.0%) | 0 (0.0%) |
| Total | 4,358 (99.1%) | 40 (0.9%) |
Educational Attainment by Field of Study in Zapata County
Education (304 | 33.0%), business (176 | 19.1%), science & technology (128 | 13.9%), bio, nature & agricultural (104 | 11.3%), and psychology (48 | 5.2%) are the most common fields of study among 921 individuals in Zapata County who have obtained a bachelor's degree or higher.
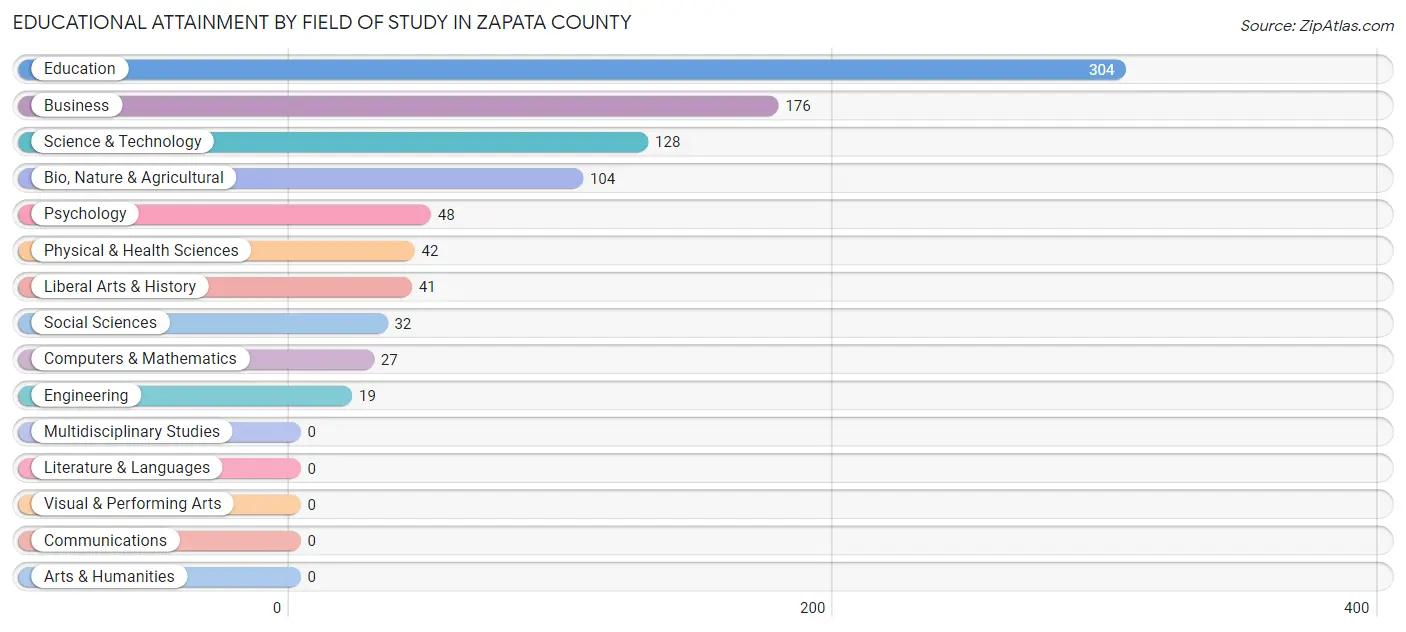
| Field of Study | # Graduates | % Graduates |
| Computers & Mathematics | 27 | 2.9% |
| Bio, Nature & Agricultural | 104 | 11.3% |
| Physical & Health Sciences | 42 | 4.6% |
| Psychology | 48 | 5.2% |
| Social Sciences | 32 | 3.5% |
| Engineering | 19 | 2.1% |
| Multidisciplinary Studies | 0 | 0.0% |
| Science & Technology | 128 | 13.9% |
| Business | 176 | 19.1% |
| Education | 304 | 33.0% |
| Literature & Languages | 0 | 0.0% |
| Liberal Arts & History | 41 | 4.4% |
| Visual & Performing Arts | 0 | 0.0% |
| Communications | 0 | 0.0% |
| Arts & Humanities | 0 | 0.0% |
| Total | 921 | 100.0% |
Transportation & Commute in Zapata County
Vehicle Availability by Sex in Zapata County
The most prevalent vehicle ownership categories in Zapata County are males with 2 vehicles (1,026, accounting for 39.4%) and females with 2 vehicles (976, making up 49.7%).
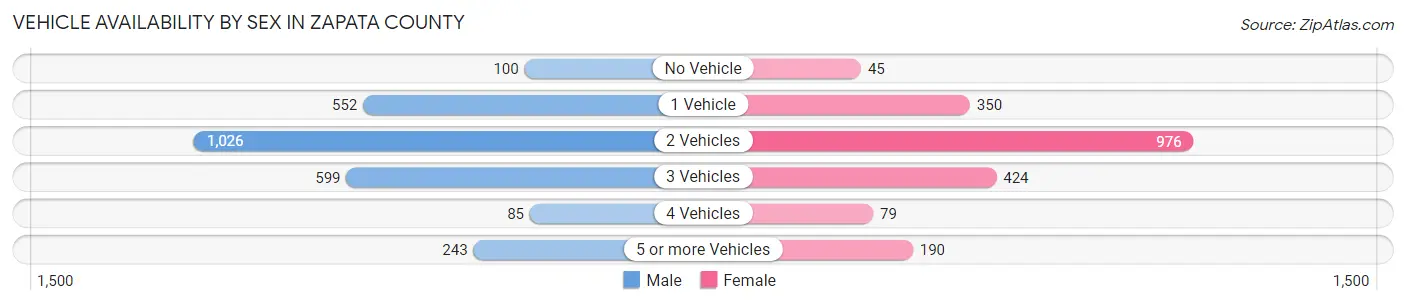
| Vehicles Available | Male | Female |
| No Vehicle | 100 (3.8%) | 45 (2.2%) |
| 1 Vehicle | 552 (21.2%) | 350 (17.0%) |
| 2 Vehicles | 1,026 (39.4%) | 976 (47.3%) |
| 3 Vehicles | 599 (23.0%) | 424 (20.5%) |
| 4 Vehicles | 85 (3.3%) | 79 (3.8%) |
| 5 or more Vehicles | 243 (9.3%) | 190 (9.2%) |
| Total | 2,605 (100.0%) | 2,064 (100.0%) |
Commute Time in Zapata County
The most frequently occuring commute durations in Zapata County are 5 to 9 minutes (1,211 commuters, 27.8%), 10 to 14 minutes (1,162 commuters, 26.7%), and 15 to 19 minutes (523 commuters, 12.0%).
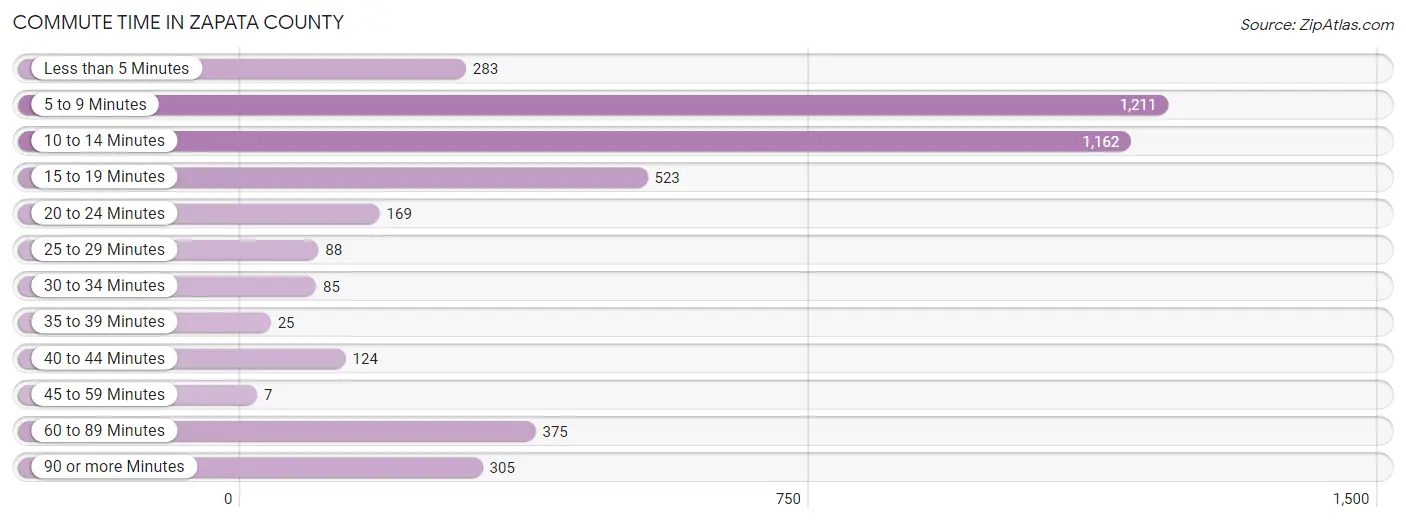
| Commute Time | # Commuters | % Commuters |
| Less than 5 Minutes | 283 | 6.5% |
| 5 to 9 Minutes | 1,211 | 27.8% |
| 10 to 14 Minutes | 1,162 | 26.7% |
| 15 to 19 Minutes | 523 | 12.0% |
| 20 to 24 Minutes | 169 | 3.9% |
| 25 to 29 Minutes | 88 | 2.0% |
| 30 to 34 Minutes | 85 | 1.9% |
| 35 to 39 Minutes | 25 | 0.6% |
| 40 to 44 Minutes | 124 | 2.9% |
| 45 to 59 Minutes | 7 | 0.2% |
| 60 to 89 Minutes | 375 | 8.6% |
| 90 or more Minutes | 305 | 7.0% |
Commute Time by Sex in Zapata County
The most common commute times in Zapata County are 10 to 14 minutes (651 commuters, 26.9%) for males and 5 to 9 minutes (741 commuters, 38.3%) for females.
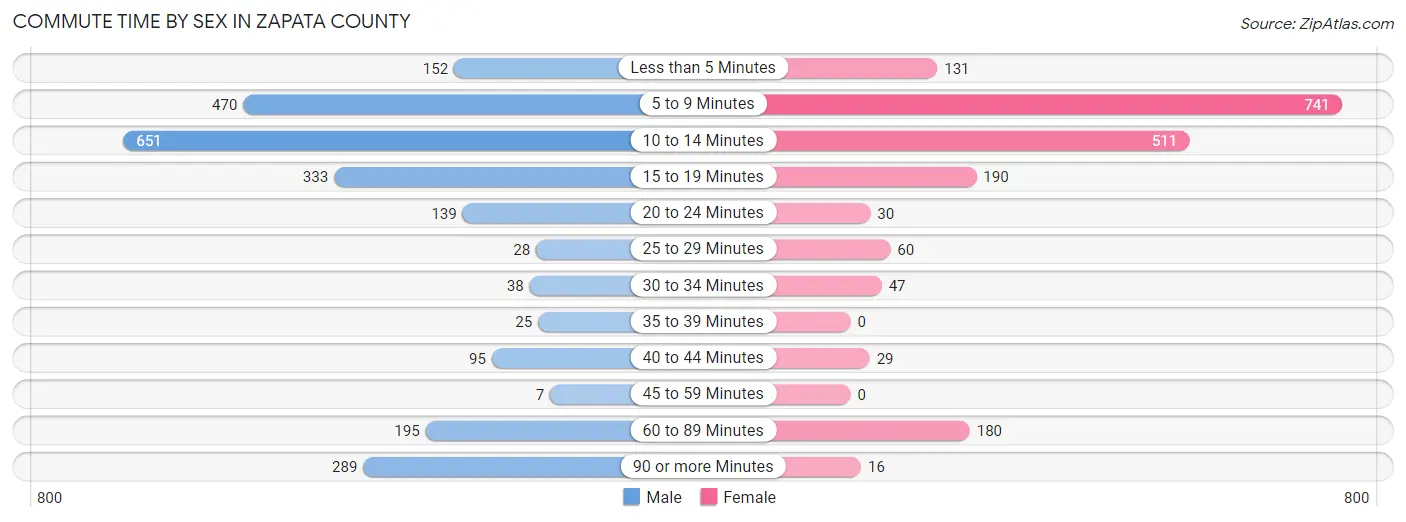
| Commute Time | Male | Female |
| Less than 5 Minutes | 152 (6.3%) | 131 (6.8%) |
| 5 to 9 Minutes | 470 (19.4%) | 741 (38.3%) |
| 10 to 14 Minutes | 651 (26.9%) | 511 (26.4%) |
| 15 to 19 Minutes | 333 (13.8%) | 190 (9.8%) |
| 20 to 24 Minutes | 139 (5.7%) | 30 (1.5%) |
| 25 to 29 Minutes | 28 (1.2%) | 60 (3.1%) |
| 30 to 34 Minutes | 38 (1.6%) | 47 (2.4%) |
| 35 to 39 Minutes | 25 (1.0%) | 0 (0.0%) |
| 40 to 44 Minutes | 95 (3.9%) | 29 (1.5%) |
| 45 to 59 Minutes | 7 (0.3%) | 0 (0.0%) |
| 60 to 89 Minutes | 195 (8.1%) | 180 (9.3%) |
| 90 or more Minutes | 289 (11.9%) | 16 (0.8%) |
Time of Departure to Work by Sex in Zapata County
The most frequent times of departure to work in Zapata County are 6:00 AM to 6:29 AM (329, 13.6%) for males and 7:30 AM to 7:59 AM (469, 24.2%) for females.
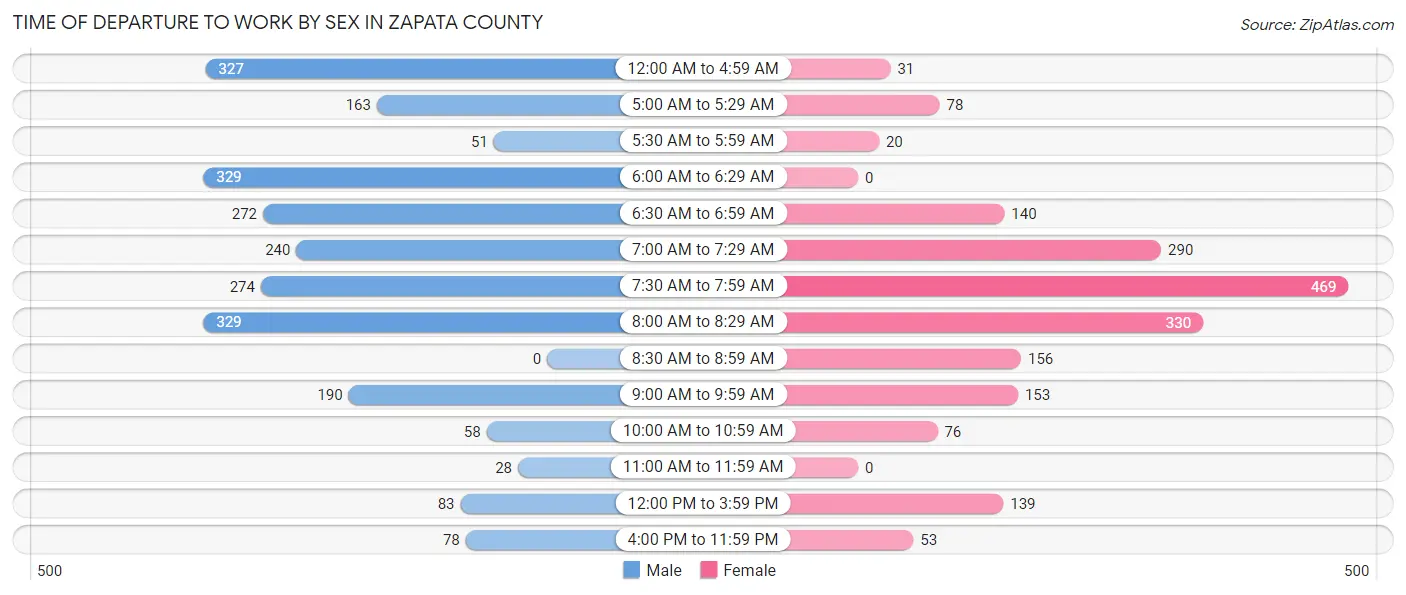
| Time of Departure | Male | Female |
| 12:00 AM to 4:59 AM | 327 (13.5%) | 31 (1.6%) |
| 5:00 AM to 5:29 AM | 163 (6.7%) | 78 (4.0%) |
| 5:30 AM to 5:59 AM | 51 (2.1%) | 20 (1.0%) |
| 6:00 AM to 6:29 AM | 329 (13.6%) | 0 (0.0%) |
| 6:30 AM to 6:59 AM | 272 (11.2%) | 140 (7.2%) |
| 7:00 AM to 7:29 AM | 240 (9.9%) | 290 (15.0%) |
| 7:30 AM to 7:59 AM | 274 (11.3%) | 469 (24.2%) |
| 8:00 AM to 8:29 AM | 329 (13.6%) | 330 (17.1%) |
| 8:30 AM to 8:59 AM | 0 (0.0%) | 156 (8.1%) |
| 9:00 AM to 9:59 AM | 190 (7.8%) | 153 (7.9%) |
| 10:00 AM to 10:59 AM | 58 (2.4%) | 76 (3.9%) |
| 11:00 AM to 11:59 AM | 28 (1.2%) | 0 (0.0%) |
| 12:00 PM to 3:59 PM | 83 (3.4%) | 139 (7.2%) |
| 4:00 PM to 11:59 PM | 78 (3.2%) | 53 (2.7%) |
| Total | 2,422 (100.0%) | 1,935 (100.0%) |
Housing Occupancy in Zapata County
Occupancy by Ownership in Zapata County
Of the total 4,580 dwellings in Zapata County, owner-occupied units account for 3,413 (74.5%), while renter-occupied units make up 1,167 (25.5%).
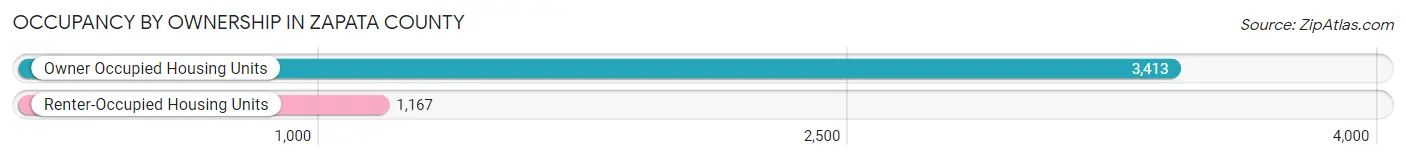
| Occupancy | # Housing Units | % Housing Units |
| Owner Occupied Housing Units | 3,413 | 74.5% |
| Renter-Occupied Housing Units | 1,167 | 25.5% |
| Total Occupied Housing Units | 4,580 | 100.0% |
Occupancy by Household Size in Zapata County
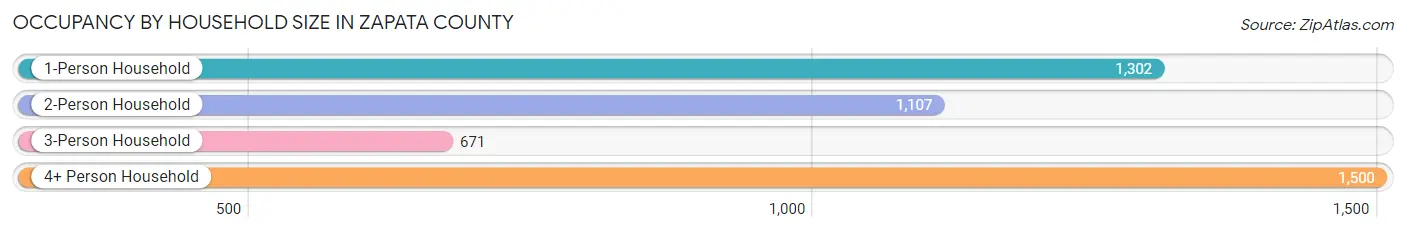
| Household Size | # Housing Units | % Housing Units |
| 1-Person Household | 1,302 | 28.4% |
| 2-Person Household | 1,107 | 24.2% |
| 3-Person Household | 671 | 14.6% |
| 4+ Person Household | 1,500 | 32.8% |
| Total Housing Units | 4,580 | 100.0% |
Occupancy by Ownership by Household Size in Zapata County
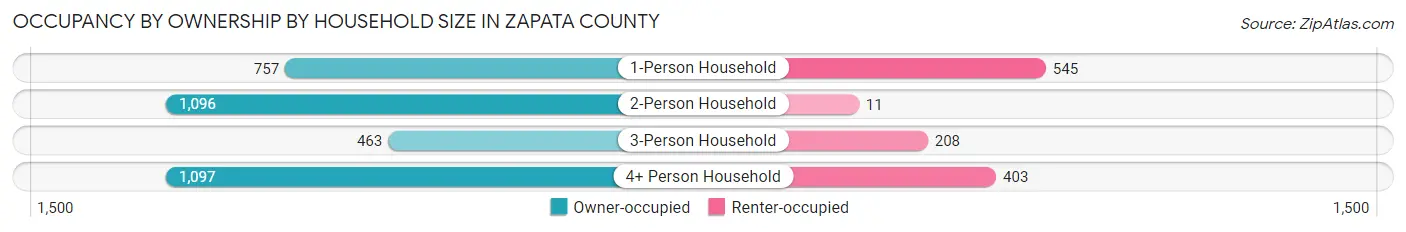
| Household Size | Owner-occupied | Renter-occupied |
| 1-Person Household | 757 (58.1%) | 545 (41.9%) |
| 2-Person Household | 1,096 (99.0%) | 11 (1.0%) |
| 3-Person Household | 463 (69.0%) | 208 (31.0%) |
| 4+ Person Household | 1,097 (73.1%) | 403 (26.9%) |
| Total Housing Units | 3,413 (74.5%) | 1,167 (25.5%) |
Occupancy by Educational Attainment in Zapata County
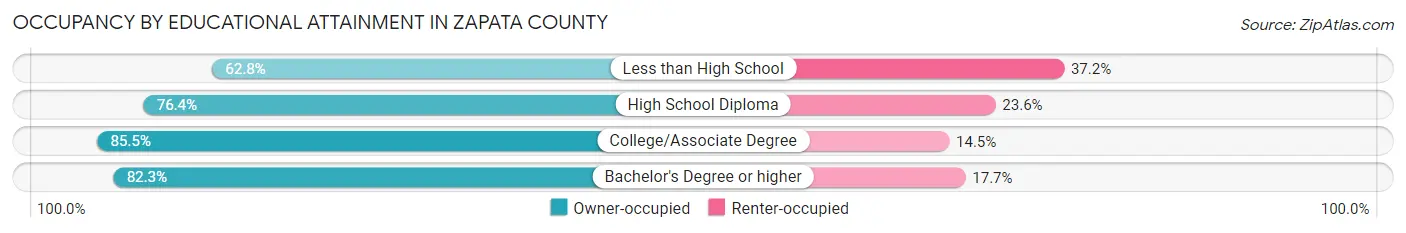
| Household Size | Owner-occupied | Renter-occupied |
| Less than High School | 981 (62.8%) | 582 (37.2%) |
| High School Diploma | 1,079 (76.4%) | 334 (23.6%) |
| College/Associate Degree | 864 (85.5%) | 146 (14.5%) |
| Bachelor's Degree or higher | 489 (82.3%) | 105 (17.7%) |
Occupancy by Age of Householder in Zapata County
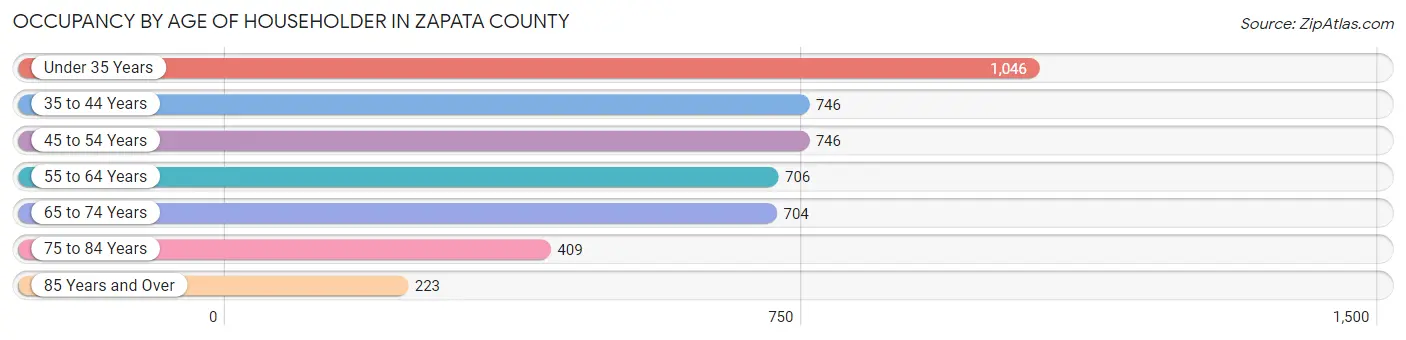
| Age Bracket | # Households | % Households |
| Under 35 Years | 1,046 | 22.8% |
| 35 to 44 Years | 746 | 16.3% |
| 45 to 54 Years | 746 | 16.3% |
| 55 to 64 Years | 706 | 15.4% |
| 65 to 74 Years | 704 | 15.4% |
| 75 to 84 Years | 409 | 8.9% |
| 85 Years and Over | 223 | 4.9% |
| Total | 4,580 | 100.0% |
Housing Finances in Zapata County
Median Income by Occupancy in Zapata County
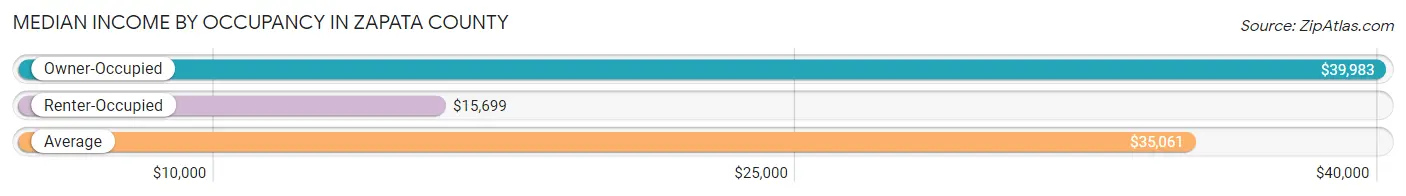
| Occupancy Type | # Households | Median Income |
| Owner-Occupied | 3,413 (74.5%) | $39,983 |
| Renter-Occupied | 1,167 (25.5%) | $15,699 |
| Average | 4,580 (100.0%) | $35,061 |
Occupancy by Householder Income Bracket in Zapata County
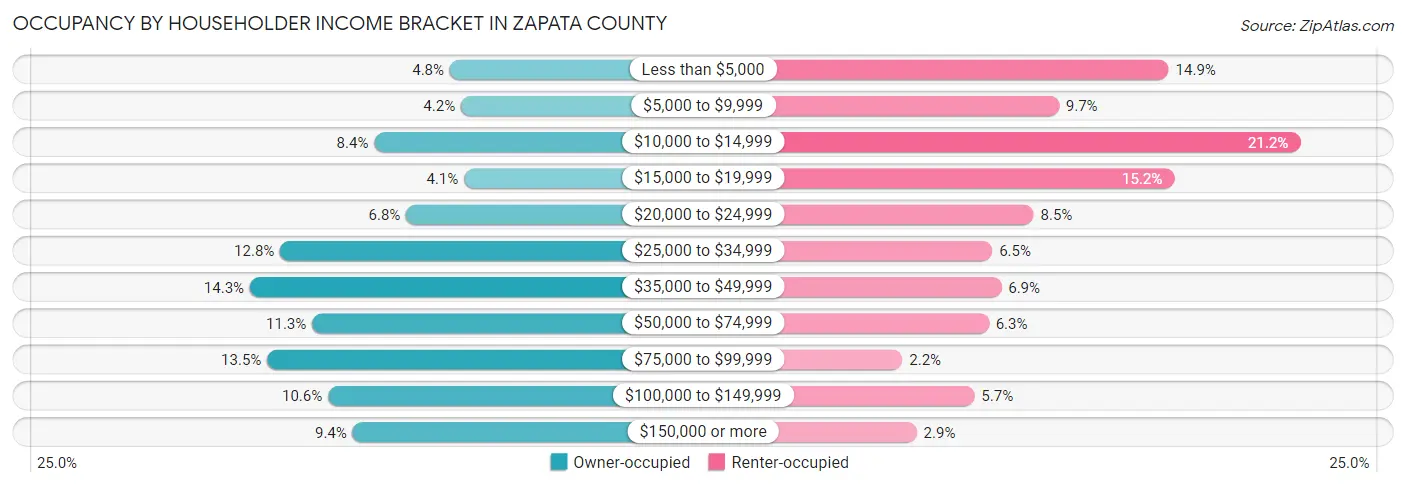
| Income Bracket | Owner-occupied | Renter-occupied |
| Less than $5,000 | 162 (4.8%) | 174 (14.9%) |
| $5,000 to $9,999 | 144 (4.2%) | 113 (9.7%) |
| $10,000 to $14,999 | 285 (8.4%) | 247 (21.2%) |
| $15,000 to $19,999 | 139 (4.1%) | 177 (15.2%) |
| $20,000 to $24,999 | 233 (6.8%) | 99 (8.5%) |
| $25,000 to $34,999 | 438 (12.8%) | 76 (6.5%) |
| $35,000 to $49,999 | 487 (14.3%) | 81 (6.9%) |
| $50,000 to $74,999 | 386 (11.3%) | 74 (6.3%) |
| $75,000 to $99,999 | 459 (13.5%) | 26 (2.2%) |
| $100,000 to $149,999 | 360 (10.5%) | 66 (5.7%) |
| $150,000 or more | 320 (9.4%) | 34 (2.9%) |
| Total | 3,413 (100.0%) | 1,167 (100.0%) |
Monthly Housing Cost Tiers in Zapata County
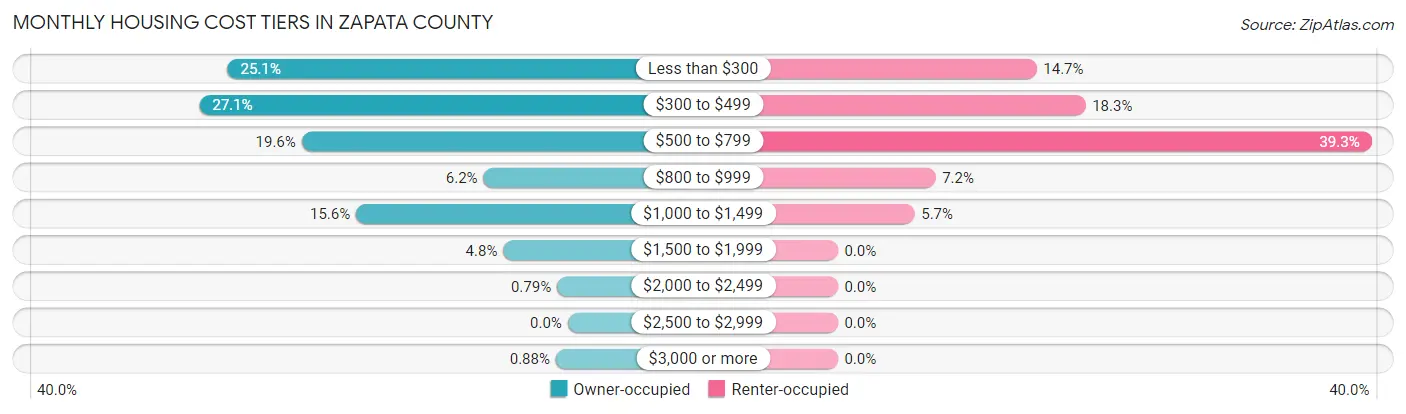
| Monthly Cost | Owner-occupied | Renter-occupied |
| Less than $300 | 855 (25.1%) | 171 (14.6%) |
| $300 to $499 | 926 (27.1%) | 213 (18.2%) |
| $500 to $799 | 669 (19.6%) | 459 (39.3%) |
| $800 to $999 | 212 (6.2%) | 84 (7.2%) |
| $1,000 to $1,499 | 532 (15.6%) | 66 (5.7%) |
| $1,500 to $1,999 | 162 (4.8%) | 0 (0.0%) |
| $2,000 to $2,499 | 27 (0.8%) | 0 (0.0%) |
| $2,500 to $2,999 | 0 (0.0%) | 0 (0.0%) |
| $3,000 or more | 30 (0.9%) | 0 (0.0%) |
| Total | 3,413 (100.0%) | 1,167 (100.0%) |
Physical Housing Characteristics in Zapata County
Housing Structures in Zapata County
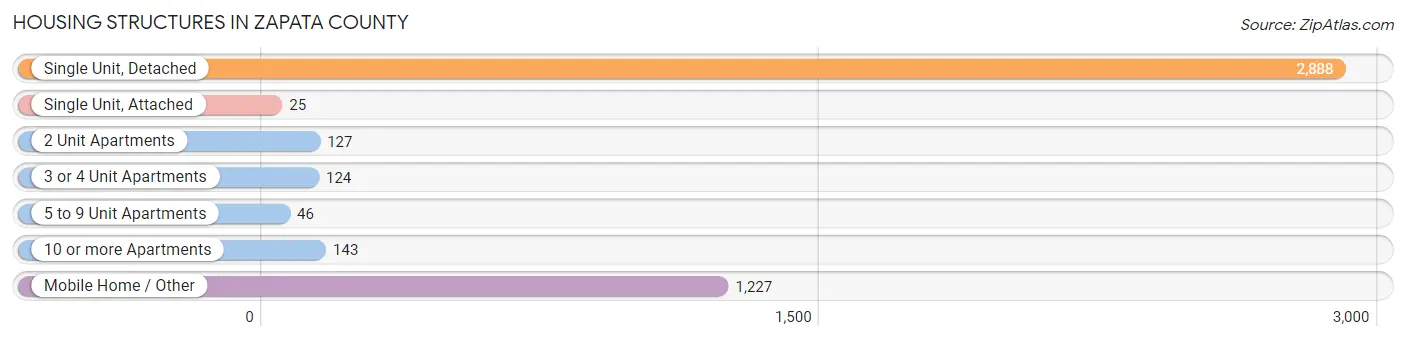
| Structure Type | # Housing Units | % Housing Units |
| Single Unit, Detached | 2,888 | 63.1% |
| Single Unit, Attached | 25 | 0.5% |
| 2 Unit Apartments | 127 | 2.8% |
| 3 or 4 Unit Apartments | 124 | 2.7% |
| 5 to 9 Unit Apartments | 46 | 1.0% |
| 10 or more Apartments | 143 | 3.1% |
| Mobile Home / Other | 1,227 | 26.8% |
| Total | 4,580 | 100.0% |
Housing Structures by Occupancy in Zapata County
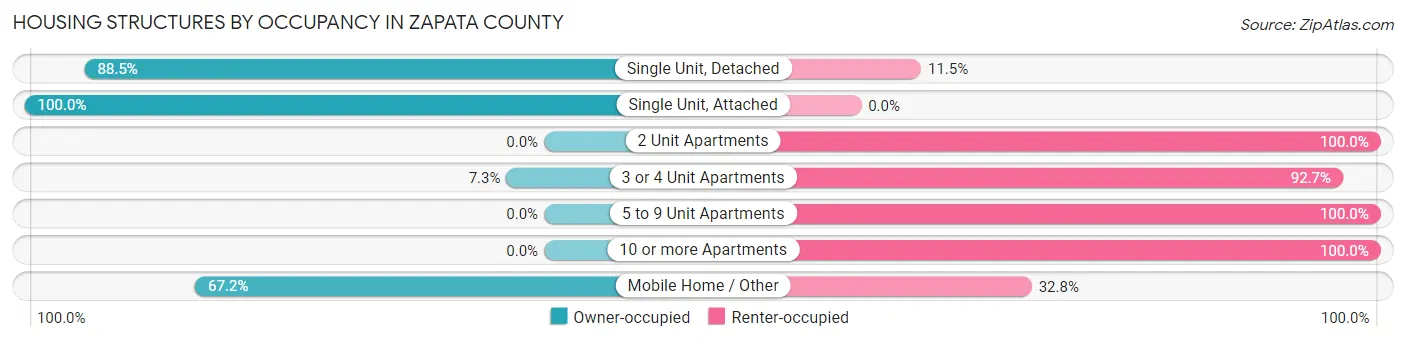
| Structure Type | Owner-occupied | Renter-occupied |
| Single Unit, Detached | 2,555 (88.5%) | 333 (11.5%) |
| Single Unit, Attached | 25 (100.0%) | 0 (0.0%) |
| 2 Unit Apartments | 0 (0.0%) | 127 (100.0%) |
| 3 or 4 Unit Apartments | 9 (7.3%) | 115 (92.7%) |
| 5 to 9 Unit Apartments | 0 (0.0%) | 46 (100.0%) |
| 10 or more Apartments | 0 (0.0%) | 143 (100.0%) |
| Mobile Home / Other | 824 (67.2%) | 403 (32.8%) |
| Total | 3,413 (74.5%) | 1,167 (25.5%) |
Housing Structures by Number of Rooms in Zapata County
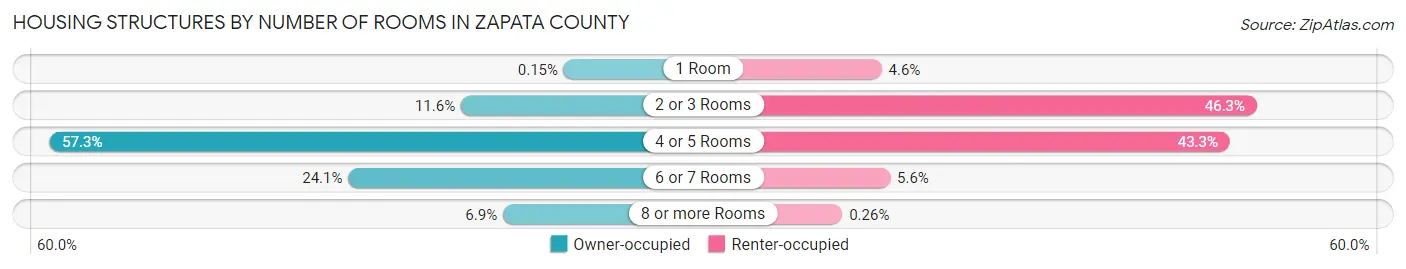
| Number of Rooms | Owner-occupied | Renter-occupied |
| 1 Room | 5 (0.2%) | 54 (4.6%) |
| 2 or 3 Rooms | 395 (11.6%) | 540 (46.3%) |
| 4 or 5 Rooms | 1,955 (57.3%) | 505 (43.3%) |
| 6 or 7 Rooms | 822 (24.1%) | 65 (5.6%) |
| 8 or more Rooms | 236 (6.9%) | 3 (0.3%) |
| Total | 3,413 (100.0%) | 1,167 (100.0%) |
Housing Structure by Heating Type in Zapata County
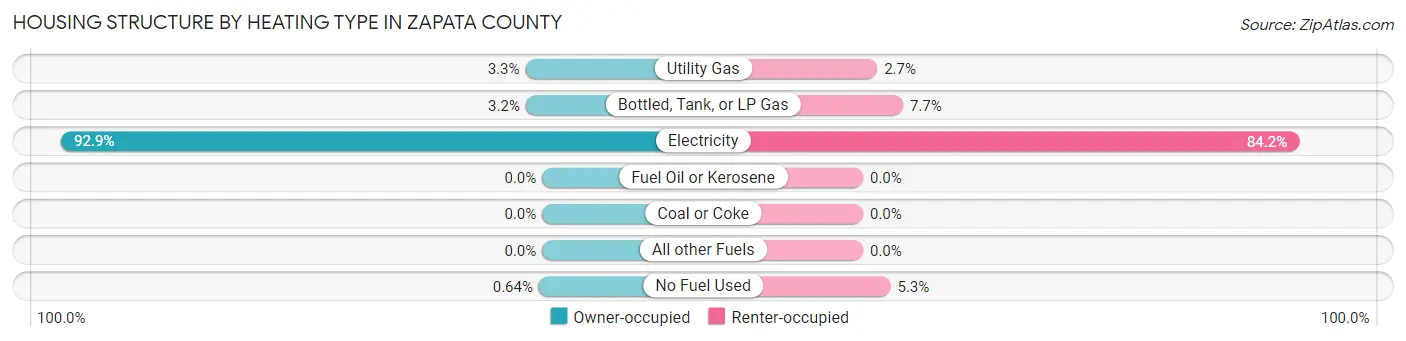
| Heating Type | Owner-occupied | Renter-occupied |
| Utility Gas | 111 (3.3%) | 32 (2.7%) |
| Bottled, Tank, or LP Gas | 108 (3.2%) | 90 (7.7%) |
| Electricity | 3,172 (92.9%) | 983 (84.2%) |
| Fuel Oil or Kerosene | 0 (0.0%) | 0 (0.0%) |
| Coal or Coke | 0 (0.0%) | 0 (0.0%) |
| All other Fuels | 0 (0.0%) | 0 (0.0%) |
| No Fuel Used | 22 (0.6%) | 62 (5.3%) |
| Total | 3,413 (100.0%) | 1,167 (100.0%) |
Household Vehicle Usage in Zapata County
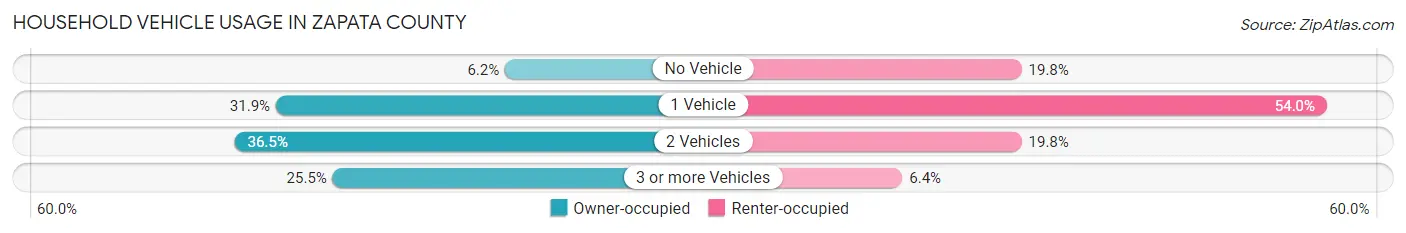
| Vehicles per Household | Owner-occupied | Renter-occupied |
| No Vehicle | 211 (6.2%) | 231 (19.8%) |
| 1 Vehicle | 1,087 (31.9%) | 630 (54.0%) |
| 2 Vehicles | 1,245 (36.5%) | 231 (19.8%) |
| 3 or more Vehicles | 870 (25.5%) | 75 (6.4%) |
| Total | 3,413 (100.0%) | 1,167 (100.0%) |
Real Estate & Mortgages in Zapata County
Real Estate and Mortgage Overview in Zapata County
| Characteristic | Without Mortgage | With Mortgage |
| Housing Units | 2,404 | 1,009 |
| Median Property Value | $76,500 | $133,000 |
| Median Household Income | $36,420 | $146 |
| Monthly Housing Costs | $362 | $30 |
| Real Estate Taxes | $599 | $0 |
Property Value by Mortgage Status in Zapata County
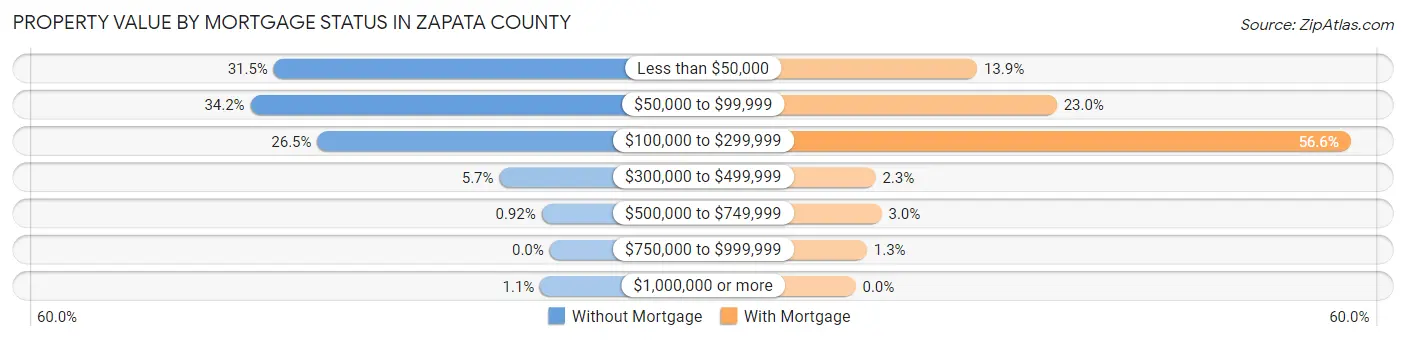
| Property Value | Without Mortgage | With Mortgage |
| Less than $50,000 | 758 (31.5%) | 140 (13.9%) |
| $50,000 to $99,999 | 822 (34.2%) | 232 (23.0%) |
| $100,000 to $299,999 | 638 (26.5%) | 571 (56.6%) |
| $300,000 to $499,999 | 138 (5.7%) | 23 (2.3%) |
| $500,000 to $749,999 | 22 (0.9%) | 30 (3.0%) |
| $750,000 to $999,999 | 0 (0.0%) | 13 (1.3%) |
| $1,000,000 or more | 26 (1.1%) | 0 (0.0%) |
| Total | 2,404 (100.0%) | 1,009 (100.0%) |
Household Income by Mortgage Status in Zapata County
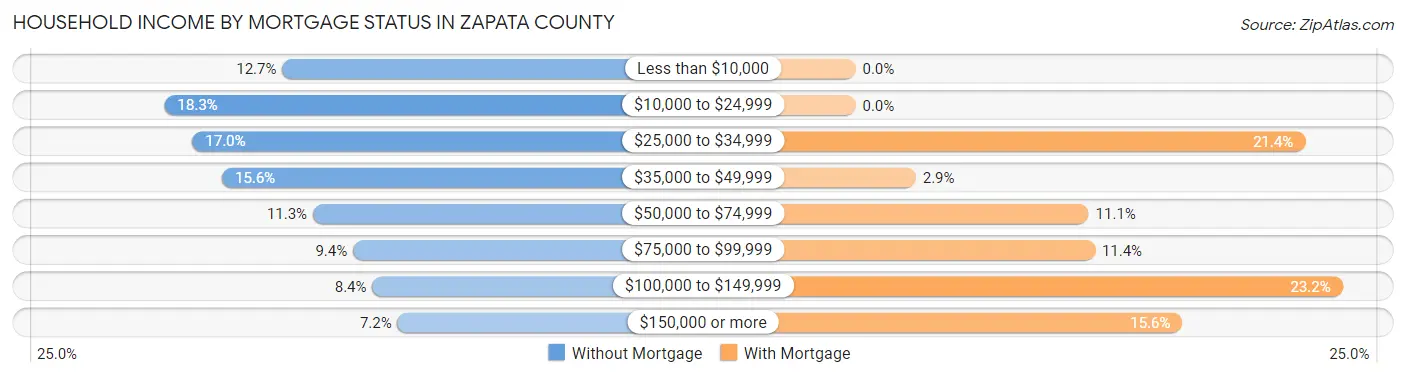
| Household Income | Without Mortgage | With Mortgage |
| Less than $10,000 | 306 (12.7%) | 0 (0.0%) |
| $10,000 to $24,999 | 441 (18.3%) | 0 (0.0%) |
| $25,000 to $34,999 | 409 (17.0%) | 216 (21.4%) |
| $35,000 to $49,999 | 375 (15.6%) | 29 (2.9%) |
| $50,000 to $74,999 | 271 (11.3%) | 112 (11.1%) |
| $75,000 to $99,999 | 225 (9.4%) | 115 (11.4%) |
| $100,000 to $149,999 | 203 (8.4%) | 234 (23.2%) |
| $150,000 or more | 174 (7.2%) | 157 (15.6%) |
| Total | 2,404 (100.0%) | 1,009 (100.0%) |
Property Value to Household Income Ratio in Zapata County
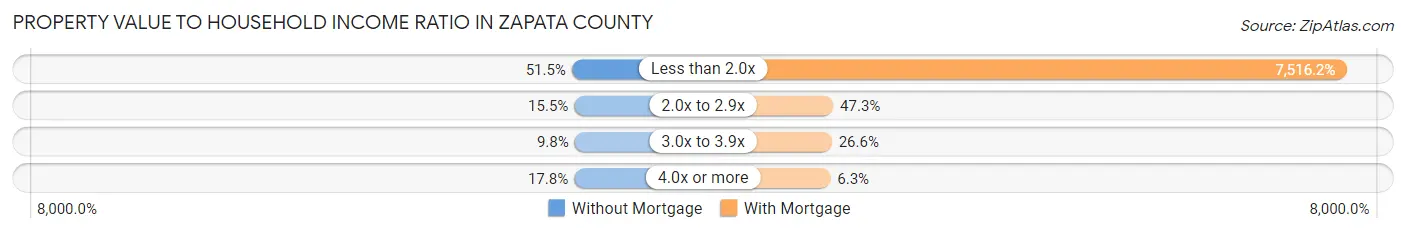
| Value-to-Income Ratio | Without Mortgage | With Mortgage |
| Less than 2.0x | 1,239 (51.5%) | 75,838 (7,516.2%) |
| 2.0x to 2.9x | 372 (15.5%) | 477 (47.3%) |
| 3.0x to 3.9x | 235 (9.8%) | 268 (26.6%) |
| 4.0x or more | 427 (17.8%) | 64 (6.3%) |
| Total | 2,404 (100.0%) | 1,009 (100.0%) |
Real Estate Taxes by Mortgage Status in Zapata County
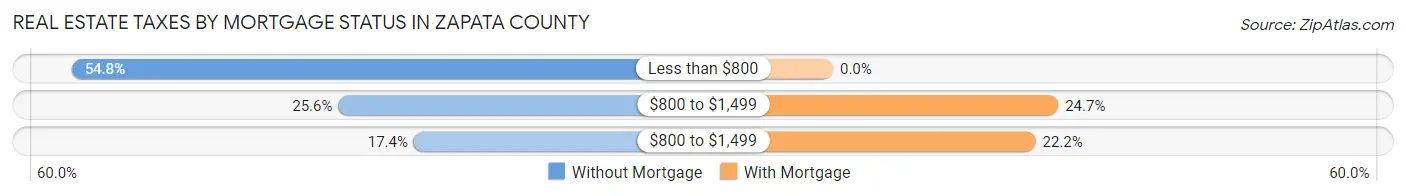
| Property Taxes | Without Mortgage | With Mortgage |
| Less than $800 | 1,318 (54.8%) | 0 (0.0%) |
| $800 to $1,499 | 616 (25.6%) | 249 (24.7%) |
| $800 to $1,499 | 417 (17.3%) | 224 (22.2%) |
| Total | 2,404 (100.0%) | 1,009 (100.0%) |
Health & Disability in Zapata County
Health Insurance Coverage by Age in Zapata County
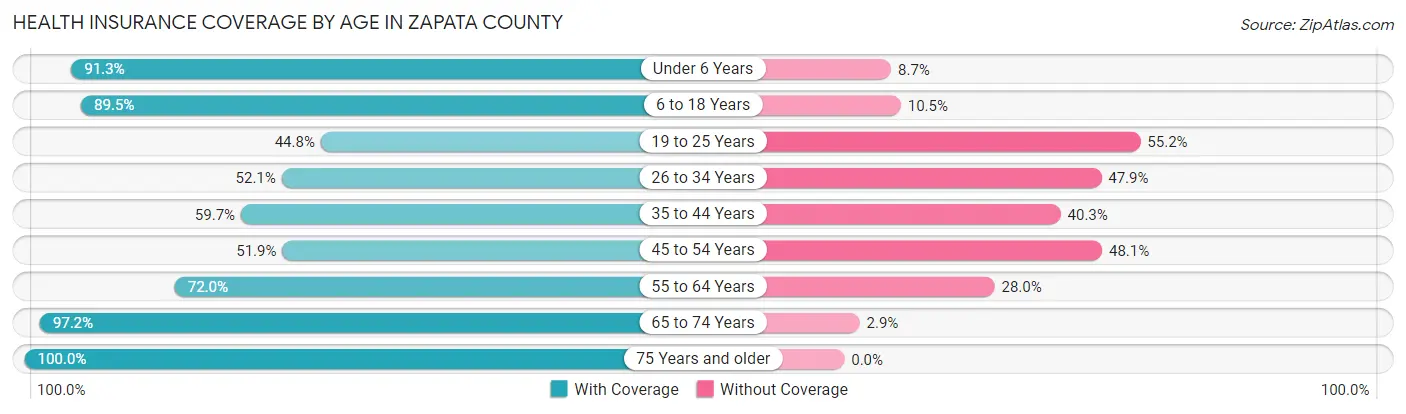
| Age Bracket | With Coverage | Without Coverage |
| Under 6 Years | 1,267 (91.3%) | 121 (8.7%) |
| 6 to 18 Years | 3,006 (89.5%) | 354 (10.5%) |
| 19 to 25 Years | 716 (44.8%) | 883 (55.2%) |
| 26 to 34 Years | 692 (52.1%) | 637 (47.9%) |
| 35 to 44 Years | 994 (59.7%) | 672 (40.3%) |
| 45 to 54 Years | 748 (51.9%) | 692 (48.1%) |
| 55 to 64 Years | 817 (72.0%) | 318 (28.0%) |
| 65 to 74 Years | 1,022 (97.2%) | 30 (2.9%) |
| 75 Years and older | 807 (100.0%) | 0 (0.0%) |
| Total | 10,069 (73.1%) | 3,707 (26.9%) |
Health Insurance Coverage by Citizenship Status in Zapata County
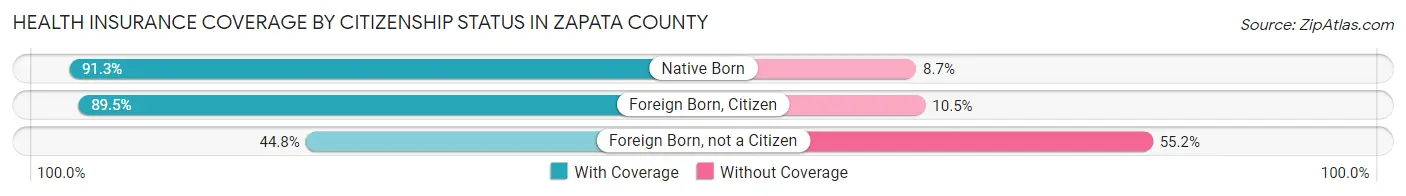
| Citizenship Status | With Coverage | Without Coverage |
| Native Born | 1,267 (91.3%) | 121 (8.7%) |
| Foreign Born, Citizen | 3,006 (89.5%) | 354 (10.5%) |
| Foreign Born, not a Citizen | 716 (44.8%) | 883 (55.2%) |
Health Insurance Coverage by Household Income in Zapata County
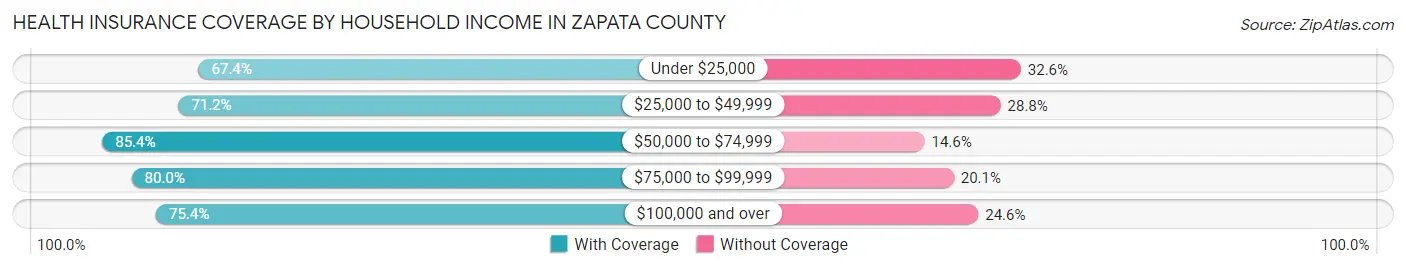
| Household Income | With Coverage | Without Coverage |
| Under $25,000 | 3,087 (67.4%) | 1,494 (32.6%) |
| $25,000 to $49,999 | 2,331 (71.2%) | 944 (28.8%) |
| $50,000 to $74,999 | 985 (85.4%) | 168 (14.6%) |
| $75,000 to $99,999 | 1,280 (79.9%) | 321 (20.1%) |
| $100,000 and over | 2,386 (75.4%) | 780 (24.6%) |
Public vs Private Health Insurance Coverage by Age in Zapata County
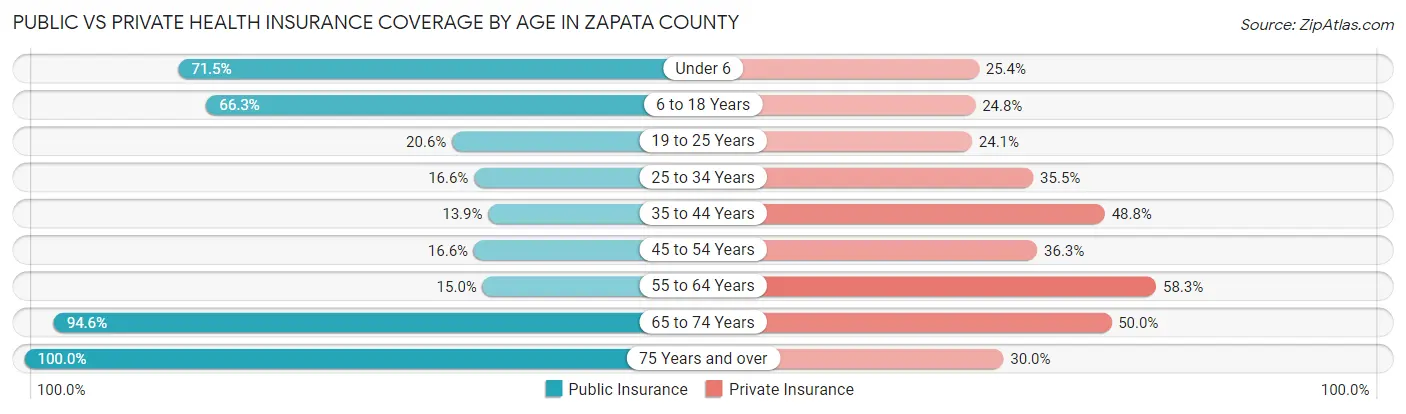
| Age Bracket | Public Insurance | Private Insurance |
| Under 6 | 992 (71.5%) | 353 (25.4%) |
| 6 to 18 Years | 2,226 (66.2%) | 832 (24.8%) |
| 19 to 25 Years | 330 (20.6%) | 386 (24.1%) |
| 25 to 34 Years | 220 (16.6%) | 472 (35.5%) |
| 35 to 44 Years | 232 (13.9%) | 813 (48.8%) |
| 45 to 54 Years | 239 (16.6%) | 522 (36.2%) |
| 55 to 64 Years | 170 (15.0%) | 662 (58.3%) |
| 65 to 74 Years | 995 (94.6%) | 526 (50.0%) |
| 75 Years and over | 807 (100.0%) | 242 (30.0%) |
| Total | 6,211 (45.1%) | 4,808 (34.9%) |
Disability Status by Sex by Age in Zapata County
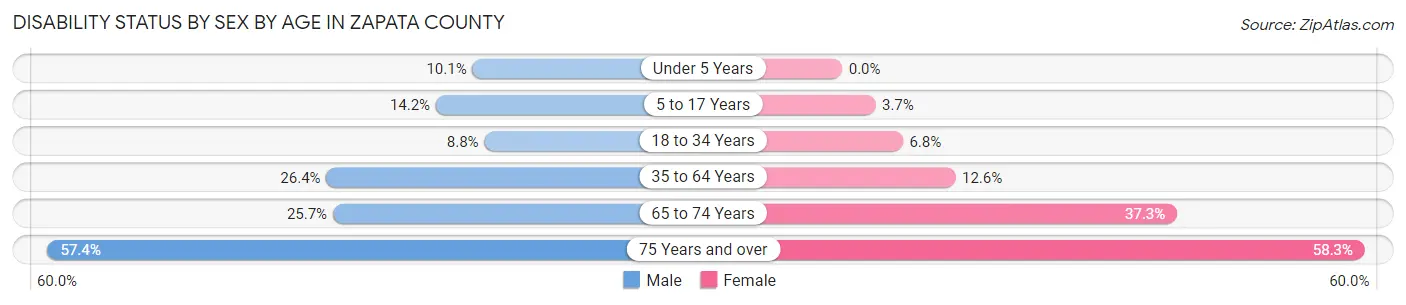
| Age Bracket | Male | Female |
| Under 5 Years | 58 (10.1%) | 0 (0.0%) |
| 5 to 17 Years | 256 (14.2%) | 59 (3.7%) |
| 18 to 34 Years | 141 (8.8%) | 104 (6.8%) |
| 35 to 64 Years | 527 (26.4%) | 283 (12.6%) |
| 65 to 74 Years | 127 (25.7%) | 208 (37.3%) |
| 75 Years and over | 220 (57.4%) | 247 (58.3%) |
Disability Class by Sex by Age in Zapata County
Disability Class: Hearing Difficulty
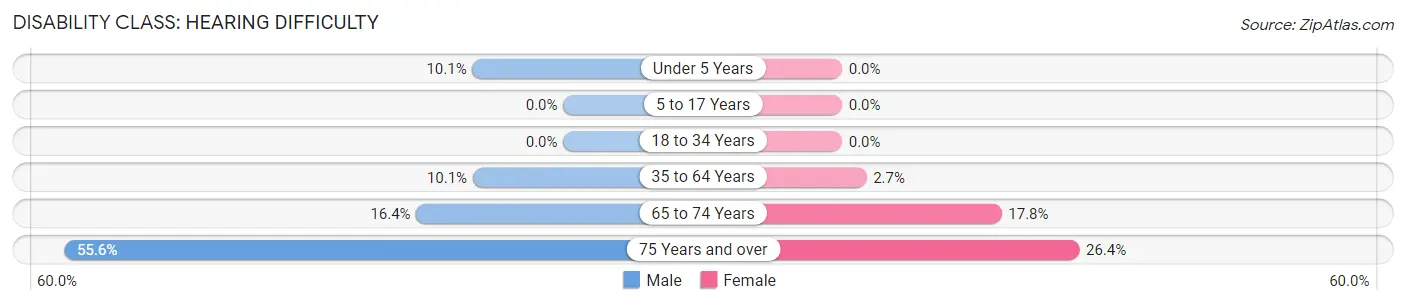
| Age Bracket | Male | Female |
| Under 5 Years | 58 (10.1%) | 0 (0.0%) |
| 5 to 17 Years | 0 (0.0%) | 0 (0.0%) |
| 18 to 34 Years | 0 (0.0%) | 0 (0.0%) |
| 35 to 64 Years | 201 (10.1%) | 61 (2.7%) |
| 65 to 74 Years | 81 (16.4%) | 99 (17.8%) |
| 75 Years and over | 213 (55.6%) | 112 (26.4%) |
Disability Class: Vision Difficulty

| Age Bracket | Male | Female |
| Under 5 Years | 0 (0.0%) | 0 (0.0%) |
| 5 to 17 Years | 0 (0.0%) | 0 (0.0%) |
| 18 to 34 Years | 82 (5.1%) | 0 (0.0%) |
| 35 to 64 Years | 191 (9.6%) | 55 (2.5%) |
| 65 to 74 Years | 73 (14.7%) | 42 (7.5%) |
| 75 Years and over | 112 (29.2%) | 26 (6.1%) |
Disability Class: Cognitive Difficulty
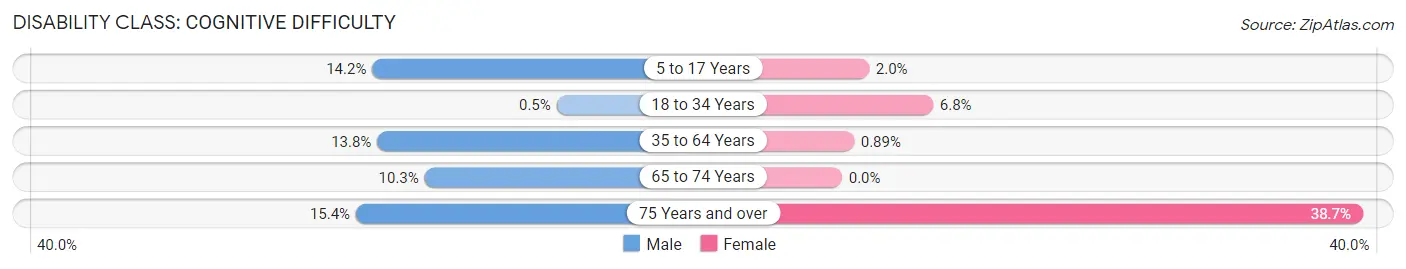
| Age Bracket | Male | Female |
| 5 to 17 Years | 256 (14.2%) | 32 (2.0%) |
| 18 to 34 Years | 8 (0.5%) | 104 (6.8%) |
| 35 to 64 Years | 276 (13.8%) | 20 (0.9%) |
| 65 to 74 Years | 51 (10.3%) | 0 (0.0%) |
| 75 Years and over | 59 (15.4%) | 164 (38.7%) |
Disability Class: Ambulatory Difficulty
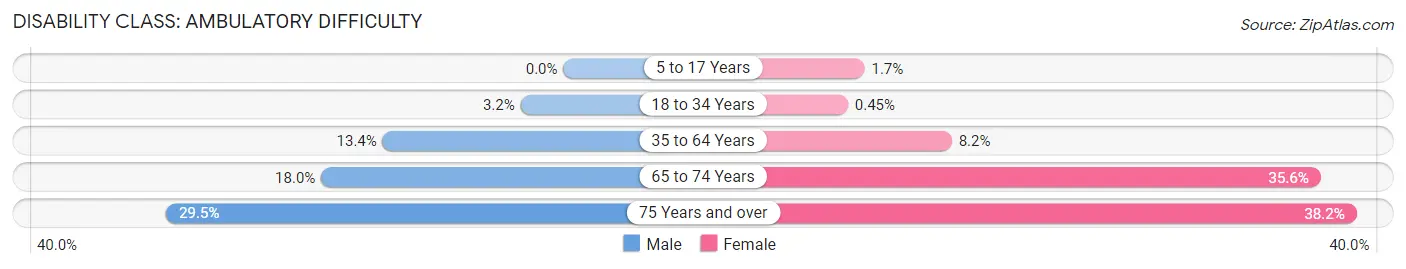
| Age Bracket | Male | Female |
| 5 to 17 Years | 0 (0.0%) | 27 (1.7%) |
| 18 to 34 Years | 51 (3.2%) | 7 (0.4%) |
| 35 to 64 Years | 268 (13.4%) | 183 (8.2%) |
| 65 to 74 Years | 89 (18.0%) | 198 (35.5%) |
| 75 Years and over | 113 (29.5%) | 162 (38.2%) |
Disability Class: Self-Care Difficulty
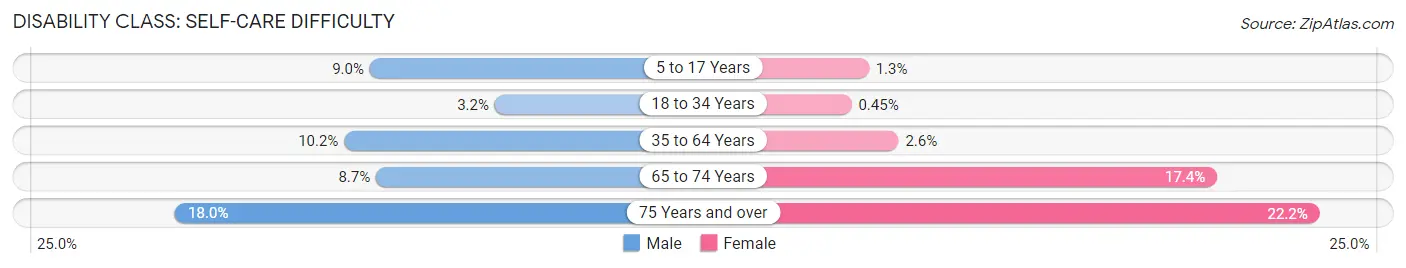
| Age Bracket | Male | Female |
| 5 to 17 Years | 162 (9.0%) | 20 (1.3%) |
| 18 to 34 Years | 51 (3.2%) | 7 (0.4%) |
| 35 to 64 Years | 203 (10.2%) | 59 (2.6%) |
| 65 to 74 Years | 43 (8.7%) | 97 (17.4%) |
| 75 Years and over | 69 (18.0%) | 94 (22.2%) |
Technology Access in Zapata County
Computing Device Access in Zapata County
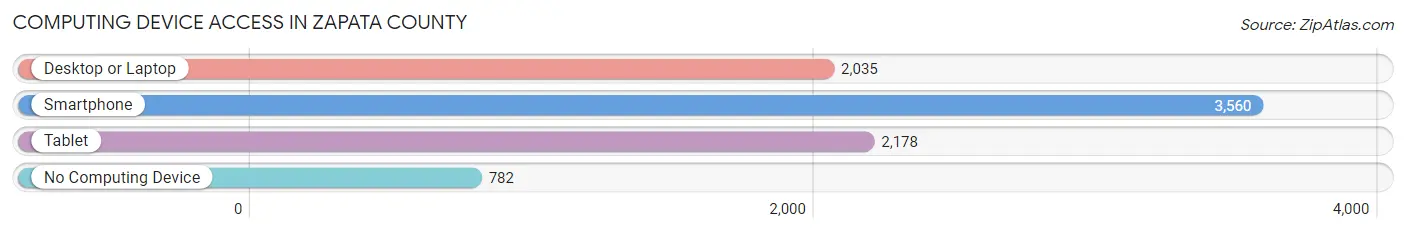
| Device Type | # Households | % Households |
| Desktop or Laptop | 2,035 | 44.4% |
| Smartphone | 3,560 | 77.7% |
| Tablet | 2,178 | 47.5% |
| No Computing Device | 782 | 17.1% |
| Total | 4,580 | 100.0% |
Internet Access in Zapata County
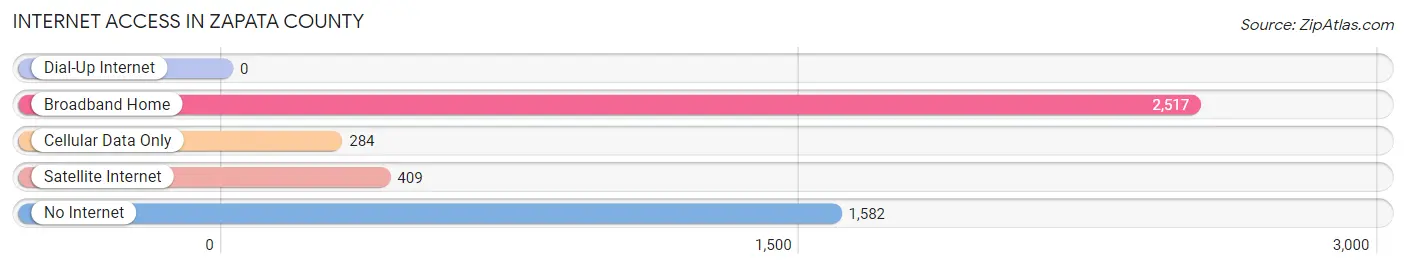
| Internet Type | # Households | % Households |
| Dial-Up Internet | 0 | 0.0% |
| Broadband Home | 2,517 | 55.0% |
| Cellular Data Only | 284 | 6.2% |
| Satellite Internet | 409 | 8.9% |
| No Internet | 1,582 | 34.5% |
| Total | 4,580 | 100.0% |
Zapata County Summary
Zapata County is located in the southernmost part of Texas, along the Rio Grande River. It is bordered by Starr County to the north, Webb County to the east, and Mexico to the south. The county seat is Zapata, and the county has a population of 14,418 as of the 2020 census.
History
The area that is now Zapata County was originally inhabited by the Coahuiltecan Indians. The first Europeans to explore the area were Spanish explorers in the late 1600s. In 1767, the Spanish established a mission in the area, which was later abandoned. In 1824, the area became part of the newly formed Mexican state of Tamaulipas.
In 1836, Texas declared its independence from Mexico and the area became part of the Republic of Texas. In 1848, the Treaty of Guadalupe Hidalgo established the Rio Grande as the border between the United States and Mexico. In 1858, Zapata County was established and named after the Mexican revolutionary leader Emiliano Zapata.
Geography
Zapata County is located in the southernmost part of Texas, along the Rio Grande River. It is bordered by Starr County to the north, Webb County to the east, and Mexico to the south. The county has a total area of 1,053 square miles, of which 1,049 square miles is land and 4.3 square miles is water. The terrain is mostly flat with some rolling hills. The climate is semi-arid with hot summers and mild winters.
Economy
The economy of Zapata County is largely based on agriculture and tourism. The county is home to several large ranches, which produce cattle, sheep, and goats. The county is also home to several large farms, which produce cotton, corn, sorghum, and wheat.
Tourism is an important part of the economy, with visitors coming to the area to enjoy the natural beauty of the Rio Grande River and the nearby Falcon State Park. The county is also home to several historical sites, including the Zapata County Courthouse and the Emiliano Zapata Monument.
Demographics
As of the 2020 census, the population of Zapata County was 14,418. The population is predominantly Hispanic, with 94.3% of the population identifying as Hispanic or Latino. The median household income is $31,945 and the median age is 28.7 years.
Conclusion
Zapata County is located in the southernmost part of Texas, along the Rio Grande River. It is bordered by Starr County to the north, Webb County to the east, and Mexico to the south. The county has a population of 14,418 as of the 2020 census. The economy of Zapata County is largely based on agriculture and tourism, with visitors coming to the area to enjoy the natural beauty of the Rio Grande River and the nearby Falcon State Park. The population is predominantly Hispanic, with 94.3% of the population identifying as Hispanic or Latino.
Common Questions
What is Per Capita Income in Zapata County?
Per Capita income in Zapata County is $19,139.
What is the Median Family Income in Zapata County?
Median Family Income in Zapata County is $39,146.
What is the Median Household income in Zapata County?
Median Household Income in Zapata County is $35,061.
What is Income or Wage Gap in Zapata County?
Income or Wage Gap in Zapata County is 33.3%.
Women in Zapata County earn 66.7 cents for every dollar earned by a man.
What is Family Income Deficit in Zapata County?
Family Income Deficit in Zapata County is $16,011.
Families that are below poverty line in Zapata County earn $16,011 less on average than the poverty threshold level.
What is Inequality or Gini Index in Zapata County?
Inequality or Gini Index in Zapata County is 0.52.
What is the Total Population of Zapata County?
Total Population of Zapata County is 13,896.
What is the Total Male Population of Zapata County?
Total Male Population of Zapata County is 6,953.
What is the Total Female Population of Zapata County?
Total Female Population of Zapata County is 6,943.
What is the Ratio of Males per 100 Females in Zapata County?
There are 100.14 Males per 100 Females in Zapata County.
What is the Ratio of Females per 100 Males in Zapata County?
There are 99.86 Females per 100 Males in Zapata County.
What is the Median Population Age in Zapata County?
Median Population Age in Zapata County is 30.9 Years.
What is the Average Family Size in Zapata County
Average Family Size in Zapata County is 3.7 People.
What is the Average Household Size in Zapata County
Average Household Size in Zapata County is 3.0 People.
How Large is the Labor Force in Zapata County?
There are 5,266 People in the Labor Forcein in Zapata County.
What is the Percentage of People in the Labor Force in Zapata County?
53.7% of People are in the Labor Force in Zapata County.
What is the Unemployment Rate in Zapata County?
Unemployment Rate in Zapata County is 8.1%.