Young County, TX Map & Demographics
Young County Map
Young County Overview
$35,039
PER CAPITA INCOME
$88,069
AVG FAMILY INCOME
$65,565
AVG HOUSEHOLD INCOME
48.5%
WAGE / INCOME GAP [ % ]
51.5¢/ $1
WAGE / INCOME GAP [ $ ]
0.45
INEQUALITY / GINI INDEX
17,903
TOTAL POPULATION
8,822
MALE POPULATION
9,081
FEMALE POPULATION
97.15
MALES / 100 FEMALES
102.94
FEMALES / 100 MALES
40.3
MEDIAN AGE
2.9
AVG FAMILY SIZE
2.3
AVG HOUSEHOLD SIZE
8,444
LABOR FORCE [ PEOPLE ]
59.6%
PERCENT IN LABOR FORCE
2.6%
UNEMPLOYMENT RATE
Young County Area Codes
Income in Young County
Income Overview in Young County
Per Capita Income in Young County is $35,039, while median incomes of families and households are $88,069 and $65,565 respectively.
| Characteristic | Number | Measure |
| Per Capita Income | 17,903 | $35,039 |
| Median Family Income | 4,936 | $88,069 |
| Mean Family Income | 4,936 | $101,590 |
| Median Household Income | 7,565 | $65,565 |
| Mean Household Income | 7,565 | $83,470 |
| Income Deficit | 4,936 | $0 |
| Wage / Income Gap (%) | 17,903 | 48.52% |
| Wage / Income Gap ($) | 17,903 | 51.48¢ per $1 |
| Gini / Inequality Index | 17,903 | 0.45 |
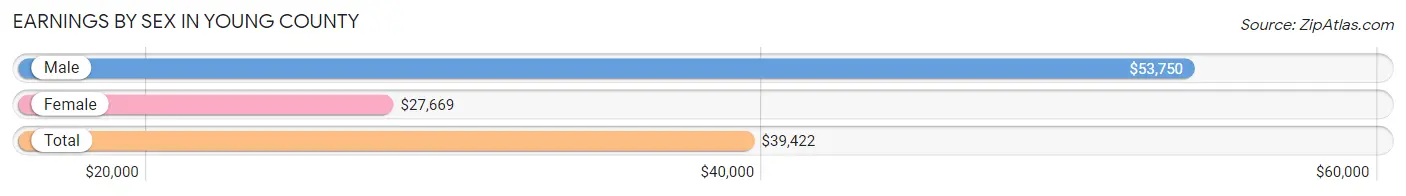
Earnings by Sex in Young County
Average Earnings in Young County are $39,422, $53,750 for men and $27,669 for women, a difference of 48.5%.
| Sex | Number | Average Earnings |
| Male | 5,039 (56.5%) | $53,750 |
| Female | 3,877 (43.5%) | $27,669 |
| Total | 8,916 (100.0%) | $39,422 |
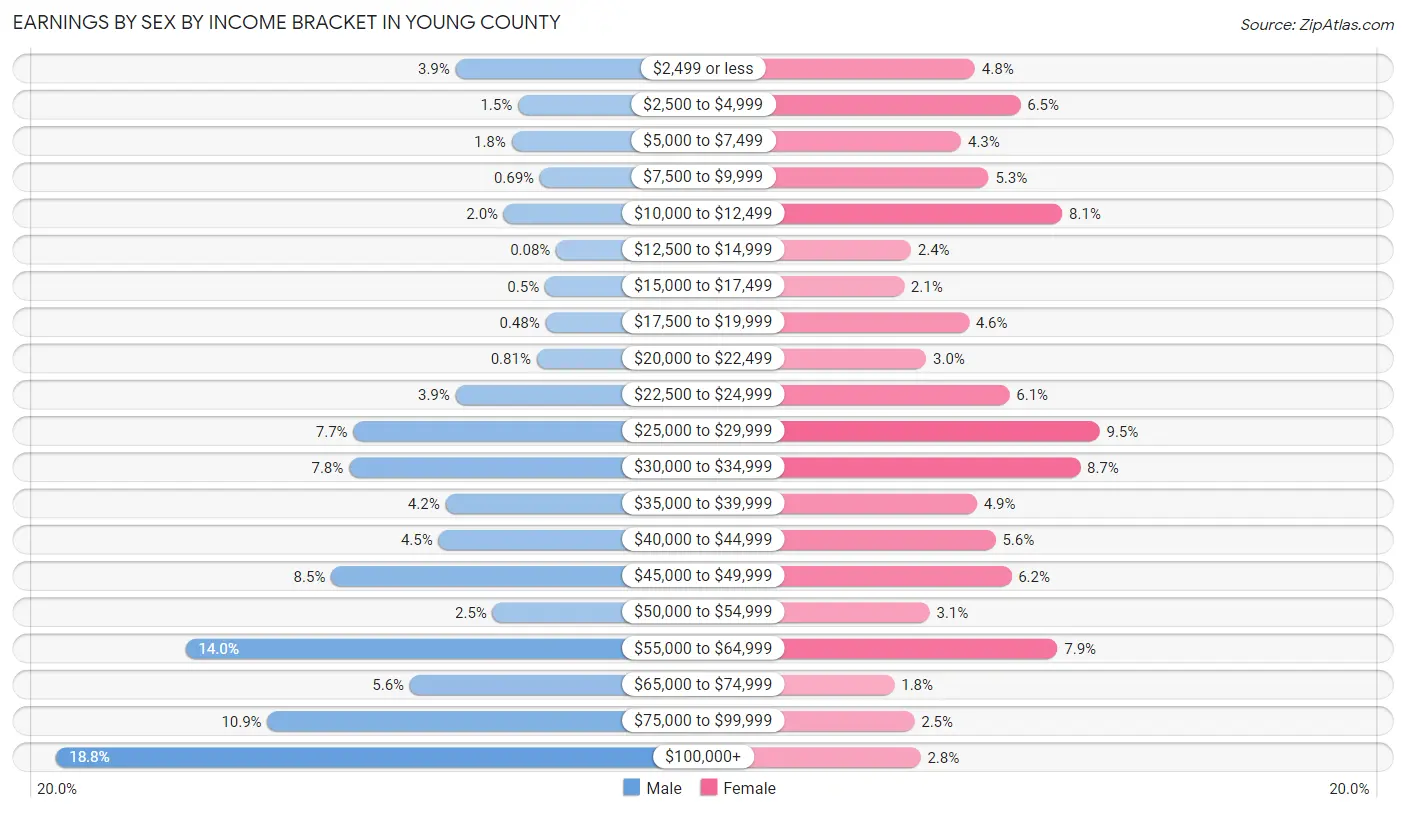
Earnings by Sex by Income Bracket in Young County
The most common earnings brackets in Young County are $100,000+ for men (948 | 18.8%) and $25,000 to $29,999 for women (367 | 9.5%).
| Income | Male | Female |
| $2,499 or less | 194 (3.8%) | 186 (4.8%) |
| $2,500 to $4,999 | 76 (1.5%) | 252 (6.5%) |
| $5,000 to $7,499 | 88 (1.8%) | 166 (4.3%) |
| $7,500 to $9,999 | 35 (0.7%) | 206 (5.3%) |
| $10,000 to $12,499 | 103 (2.0%) | 313 (8.1%) |
| $12,500 to $14,999 | 4 (0.1%) | 93 (2.4%) |
| $15,000 to $17,499 | 25 (0.5%) | 83 (2.1%) |
| $17,500 to $19,999 | 24 (0.5%) | 177 (4.6%) |
| $20,000 to $22,499 | 41 (0.8%) | 115 (3.0%) |
| $22,500 to $24,999 | 194 (3.8%) | 236 (6.1%) |
| $25,000 to $29,999 | 387 (7.7%) | 367 (9.5%) |
| $30,000 to $34,999 | 395 (7.8%) | 339 (8.7%) |
| $35,000 to $39,999 | 213 (4.2%) | 189 (4.9%) |
| $40,000 to $44,999 | 226 (4.5%) | 216 (5.6%) |
| $45,000 to $49,999 | 429 (8.5%) | 239 (6.2%) |
| $50,000 to $54,999 | 124 (2.5%) | 120 (3.1%) |
| $55,000 to $64,999 | 704 (14.0%) | 306 (7.9%) |
| $65,000 to $74,999 | 280 (5.6%) | 69 (1.8%) |
| $75,000 to $99,999 | 549 (10.9%) | 98 (2.5%) |
| $100,000+ | 948 (18.8%) | 107 (2.8%) |
| Total | 5,039 (100.0%) | 3,877 (100.0%) |
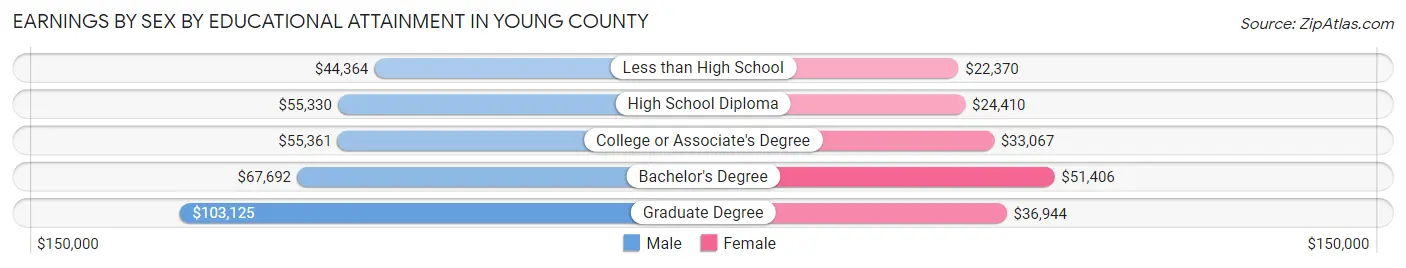
Earnings by Sex by Educational Attainment in Young County
Average earnings in Young County are $57,676 for men and $29,902 for women, a difference of 48.2%. Men with an educational attainment of graduate degree enjoy the highest average annual earnings of $103,125, while those with less than high school education earn the least with $44,364. Women with an educational attainment of bachelor's degree earn the most with the average annual earnings of $51,406, while those with less than high school education have the smallest earnings of $22,370.
| Educational Attainment | Male Income | Female Income |
| Less than High School | $44,364 | $22,370 |
| High School Diploma | $55,330 | $24,410 |
| College or Associate's Degree | $55,361 | $33,067 |
| Bachelor's Degree | $67,692 | $51,406 |
| Graduate Degree | $103,125 | $36,944 |
| Total | $57,676 | $29,902 |
Family Income in Young County
Family Income Brackets in Young County
According to the Young County family income data, there are 1,303 families falling into the $100,000 to $149,999 income range, which is the most common income bracket and makes up 26.4% of all families. Conversely, the $10,000 to $14,999 income bracket is the least frequent group with only 84 families (1.7%) belonging to this category.
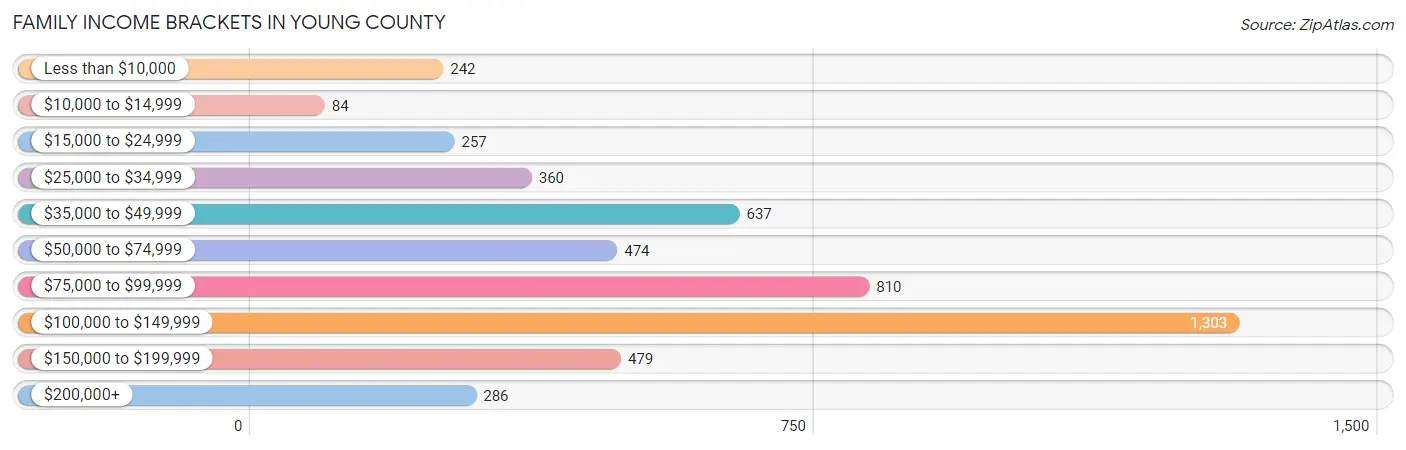
| Income Bracket | # Families | % Families |
| Less than $10,000 | 242 | 4.9% |
| $10,000 to $14,999 | 84 | 1.7% |
| $15,000 to $24,999 | 257 | 5.2% |
| $25,000 to $34,999 | 360 | 7.3% |
| $35,000 to $49,999 | 637 | 12.9% |
| $50,000 to $74,999 | 474 | 9.6% |
| $75,000 to $99,999 | 810 | 16.4% |
| $100,000 to $149,999 | 1,303 | 26.4% |
| $150,000 to $199,999 | 479 | 9.7% |
| $200,000+ | 286 | 5.8% |
Family Income by Famaliy Size in Young County
4-person families (873 | 17.7%) account for the highest median family income in Young County with $130,246 per family, while 2-person families (2,794 | 56.6%) have the highest median income of $39,461 per family member.
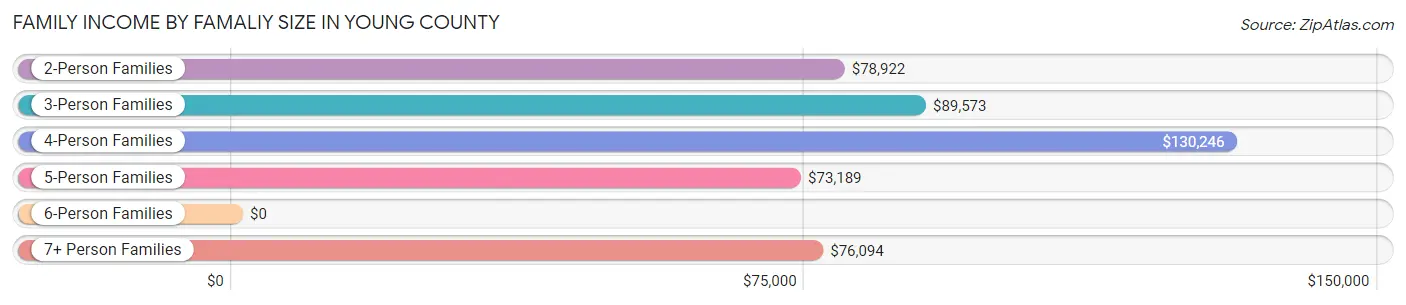
| Income Bracket | # Families | Median Income |
| 2-Person Families | 2,794 (56.6%) | $78,922 |
| 3-Person Families | 817 (16.6%) | $89,573 |
| 4-Person Families | 873 (17.7%) | $130,246 |
| 5-Person Families | 323 (6.5%) | $73,189 |
| 6-Person Families | 109 (2.2%) | $0 |
| 7+ Person Families | 20 (0.4%) | $76,094 |
| Total | 4,936 (100.0%) | $88,069 |
Family Income by Number of Earners in Young County
The median family income in Young County is $88,069, with families comprising 3+ earners (245) having the highest median family income of $129,612, while families with no earners (851) have the lowest median family income of $43,348, accounting for 5.0% and 17.2% of families, respectively.
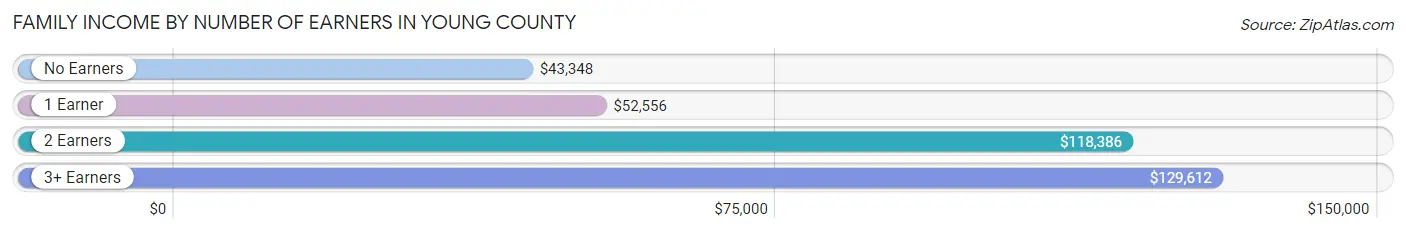
| Number of Earners | # Families | Median Income |
| No Earners | 851 (17.2%) | $43,348 |
| 1 Earner | 1,764 (35.7%) | $52,556 |
| 2 Earners | 2,076 (42.1%) | $118,386 |
| 3+ Earners | 245 (5.0%) | $129,612 |
| Total | 4,936 (100.0%) | $88,069 |
Household Income in Young County
Household Income Brackets in Young County
With 1,611 households falling in the category, the $100,000 to $149,999 income range is the most frequent in Young County, accounting for 21.3% of all households. In contrast, only 287 households (3.8%) fall into the $200,000+ income bracket, making it the least populous group.
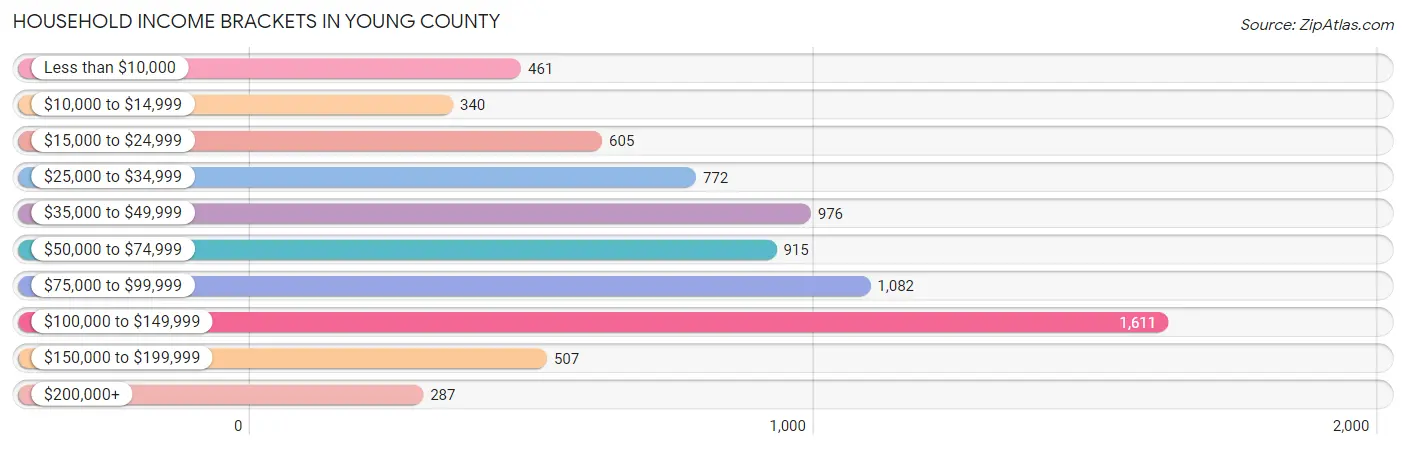
| Income Bracket | # Households | % Households |
| Less than $10,000 | 461 | 6.1% |
| $10,000 to $14,999 | 340 | 4.5% |
| $15,000 to $24,999 | 605 | 8.0% |
| $25,000 to $34,999 | 772 | 10.2% |
| $35,000 to $49,999 | 976 | 12.9% |
| $50,000 to $74,999 | 915 | 12.1% |
| $75,000 to $99,999 | 1,082 | 14.3% |
| $100,000 to $149,999 | 1,611 | 21.3% |
| $150,000 to $199,999 | 507 | 6.7% |
| $200,000+ | 287 | 3.8% |
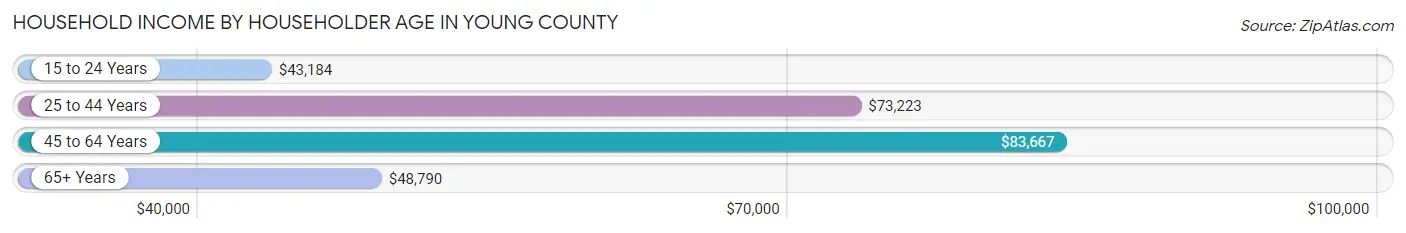
Household Income by Householder Age in Young County
The median household income in Young County is $65,565, with the highest median household income of $83,667 found in the 45 to 64 years age bracket for the primary householder. A total of 2,418 households (32.0%) fall into this category. Meanwhile, the 15 to 24 years age bracket for the primary householder has the lowest median household income of $43,184, with 529 households (7.0%) in this group.
| Income Bracket | # Households | Median Income |
| 15 to 24 Years | 529 (7.0%) | $43,184 |
| 25 to 44 Years | 2,284 (30.2%) | $73,223 |
| 45 to 64 Years | 2,418 (32.0%) | $83,667 |
| 65+ Years | 2,334 (30.8%) | $48,790 |
| Total | 7,565 (100.0%) | $65,565 |
Poverty in Young County
Income Below Poverty by Sex and Age in Young County
With 12.7% poverty level for males and 18.7% for females among the residents of Young County, 16 and 17 year old males and 5 year old females are the most vulnerable to poverty, with 77 males (45.8%) and 65 females (65.7%) in their respective age groups living below the poverty level.
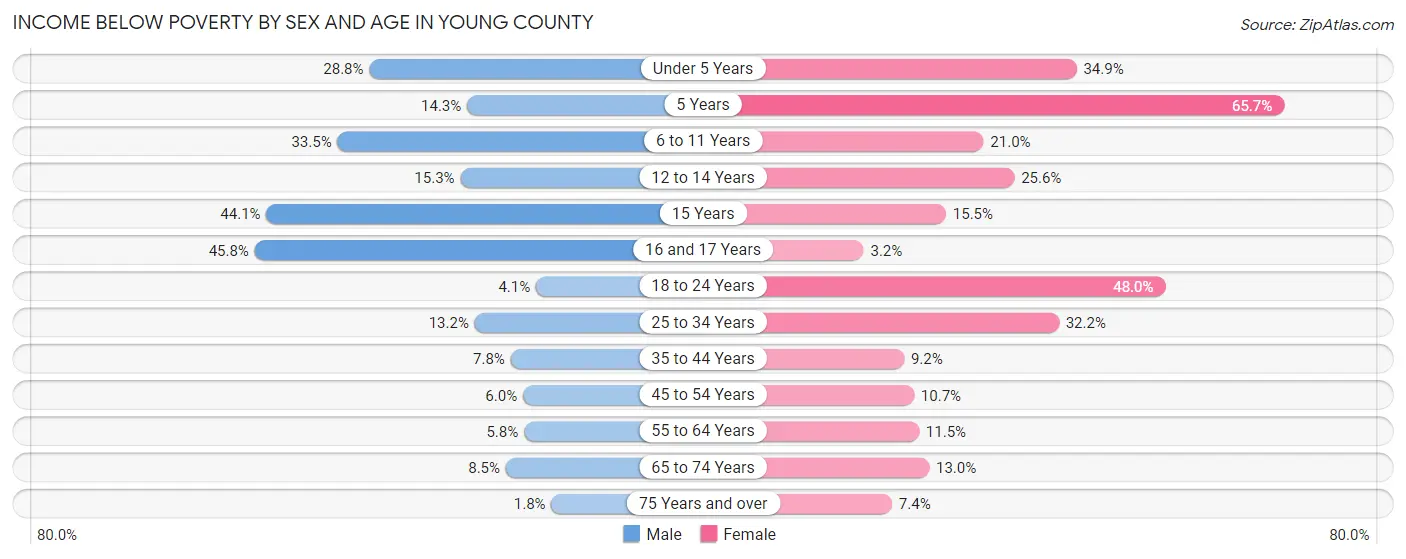
| Age Bracket | Male | Female |
| Under 5 Years | 157 (28.8%) | 153 (34.8%) |
| 5 Years | 14 (14.3%) | 65 (65.7%) |
| 6 to 11 Years | 271 (33.5%) | 155 (21.0%) |
| 12 to 14 Years | 50 (15.3%) | 107 (25.6%) |
| 15 Years | 56 (44.1%) | 17 (15.4%) |
| 16 and 17 Years | 77 (45.8%) | 12 (3.2%) |
| 18 to 24 Years | 25 (4.1%) | 280 (48.0%) |
| 25 to 34 Years | 149 (13.2%) | 335 (32.2%) |
| 35 to 44 Years | 76 (7.8%) | 97 (9.2%) |
| 45 to 54 Years | 63 (6.0%) | 113 (10.7%) |
| 55 to 64 Years | 71 (5.8%) | 123 (11.5%) |
| 65 to 74 Years | 84 (8.5%) | 149 (13.0%) |
| 75 Years and over | 12 (1.8%) | 56 (7.4%) |
| Total | 1,105 (12.7%) | 1,662 (18.7%) |
Income Above Poverty by Sex and Age in Young County
According to the poverty statistics in Young County, males aged 75 years and over and females aged 16 and 17 years are the age groups that are most secure financially, with 98.2% of males and 96.8% of females in these age groups living above the poverty line.
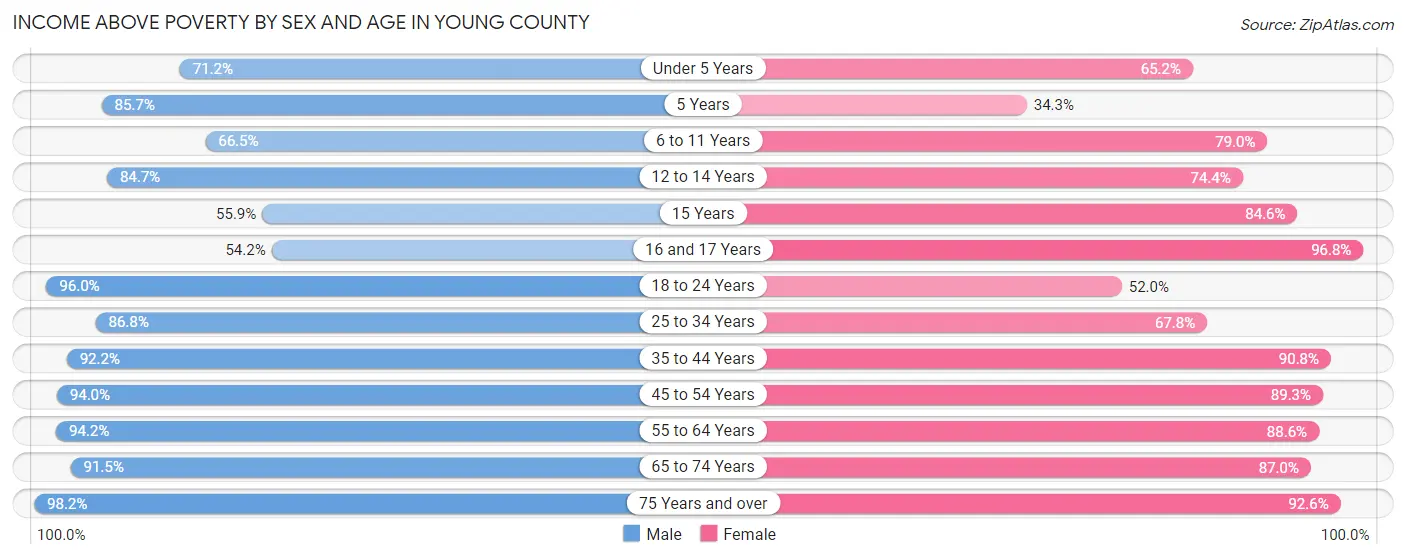
| Age Bracket | Male | Female |
| Under 5 Years | 388 (71.2%) | 286 (65.1%) |
| 5 Years | 84 (85.7%) | 34 (34.3%) |
| 6 to 11 Years | 537 (66.5%) | 582 (79.0%) |
| 12 to 14 Years | 277 (84.7%) | 311 (74.4%) |
| 15 Years | 71 (55.9%) | 93 (84.6%) |
| 16 and 17 Years | 91 (54.2%) | 360 (96.8%) |
| 18 to 24 Years | 593 (96.0%) | 303 (52.0%) |
| 25 to 34 Years | 983 (86.8%) | 705 (67.8%) |
| 35 to 44 Years | 896 (92.2%) | 954 (90.8%) |
| 45 to 54 Years | 988 (94.0%) | 942 (89.3%) |
| 55 to 64 Years | 1,145 (94.2%) | 951 (88.5%) |
| 65 to 74 Years | 900 (91.5%) | 1,001 (87.0%) |
| 75 Years and over | 667 (98.2%) | 697 (92.6%) |
| Total | 7,620 (87.3%) | 7,219 (81.3%) |
Income Below Poverty Among Married-Couple Families in Young County
The poverty statistics for married-couple families in Young County show that 5.1% or 189 of the total 3,741 families live below the poverty line. Families with 3 or 4 children have the highest poverty rate of 40.5%, comprising of 90 families. On the other hand, families with 5 or more children have the lowest poverty rate of 0.0%, which includes 0 families.
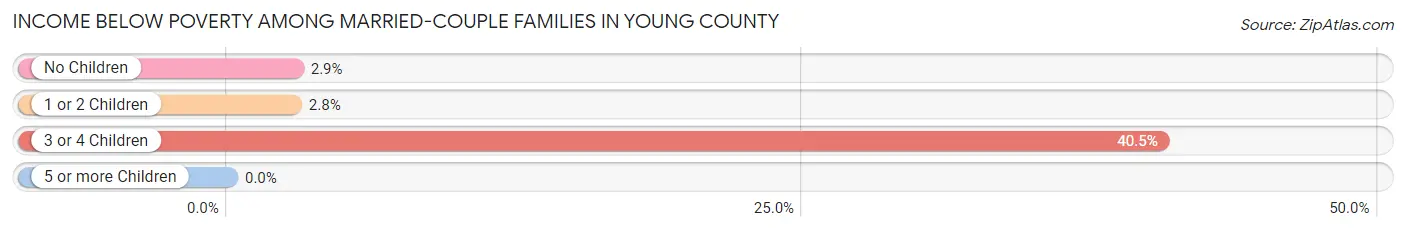
| Children | Above Poverty | Below Poverty |
| No Children | 2,211 (97.1%) | 65 (2.9%) |
| 1 or 2 Children | 1,189 (97.2%) | 34 (2.8%) |
| 3 or 4 Children | 132 (59.5%) | 90 (40.5%) |
| 5 or more Children | 20 (100.0%) | 0 (0.0%) |
| Total | 3,552 (95.0%) | 189 (5.1%) |
Income Below Poverty Among Single-Parent Households in Young County
According to the poverty data in Young County, 4.1% or 16 single-father households and 42.2% or 340 single-mother households are living below the poverty line. Among single-father households, those with 3 or 4 children have the highest poverty rate, with 12 households (100.0%) experiencing poverty. Likewise, among single-mother households, those with 3 or 4 children have the highest poverty rate, with 126 households (94.0%) falling below the poverty line.
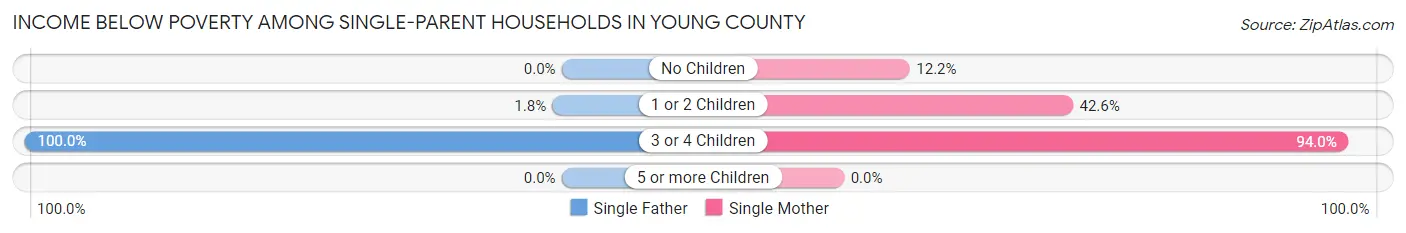
| Children | Single Father | Single Mother |
| No Children | 0 (0.0%) | 29 (12.2%) |
| 1 or 2 Children | 4 (1.8%) | 185 (42.6%) |
| 3 or 4 Children | 12 (100.0%) | 126 (94.0%) |
| 5 or more Children | 0 (0.0%) | 0 (0.0%) |
| Total | 16 (4.1%) | 340 (42.2%) |
Income Below Poverty Among Married-Couple vs Single-Parent Households in Young County
The poverty data for Young County shows that 189 of the married-couple family households (5.1%) and 356 of the single-parent households (29.8%) are living below the poverty level. Within the married-couple family households, those with 3 or 4 children have the highest poverty rate, with 90 households (40.5%) falling below the poverty line. Among the single-parent households, those with 3 or 4 children have the highest poverty rate, with 138 household (94.5%) living below poverty.
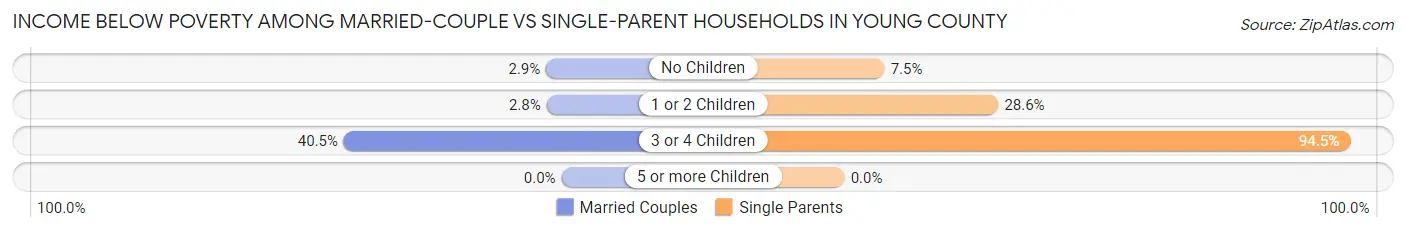
| Children | Married-Couple Families | Single-Parent Households |
| No Children | 65 (2.9%) | 29 (7.5%) |
| 1 or 2 Children | 34 (2.8%) | 189 (28.6%) |
| 3 or 4 Children | 90 (40.5%) | 138 (94.5%) |
| 5 or more Children | 0 (0.0%) | 0 (0.0%) |
| Total | 189 (5.1%) | 356 (29.8%) |
Race in Young County
The most populous races in Young County are White / Caucasian (15,798 | 88.2%), Hispanic or Latino (3,524 | 19.7%), and Two or more Races (1,204 | 6.7%).
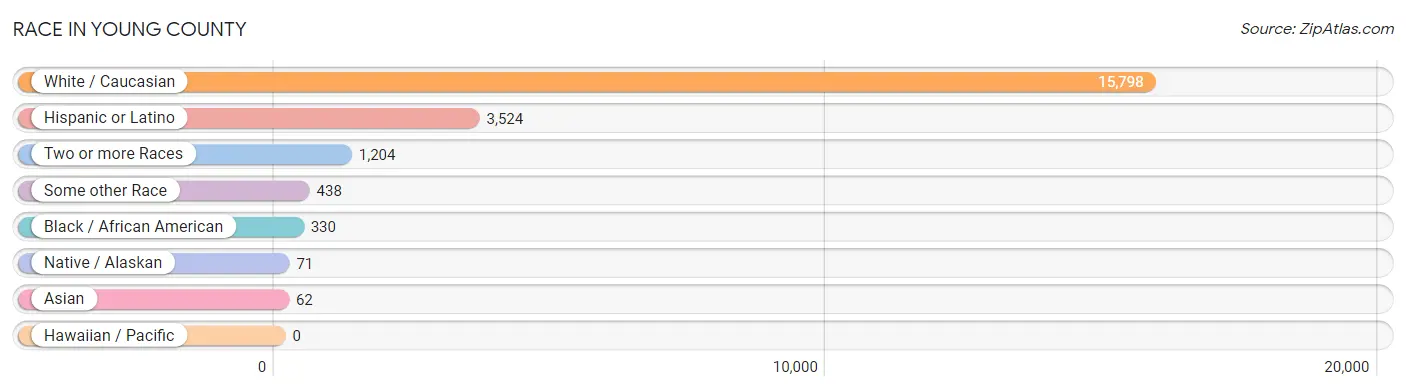
| Race | # Population | % Population |
| Asian | 62 | 0.4% |
| Black / African American | 330 | 1.8% |
| Hawaiian / Pacific | 0 | 0.0% |
| Hispanic or Latino | 3,524 | 19.7% |
| Native / Alaskan | 71 | 0.4% |
| White / Caucasian | 15,798 | 88.2% |
| Two or more Races | 1,204 | 6.7% |
| Some other Race | 438 | 2.5% |
| Total | 17,903 | 100.0% |
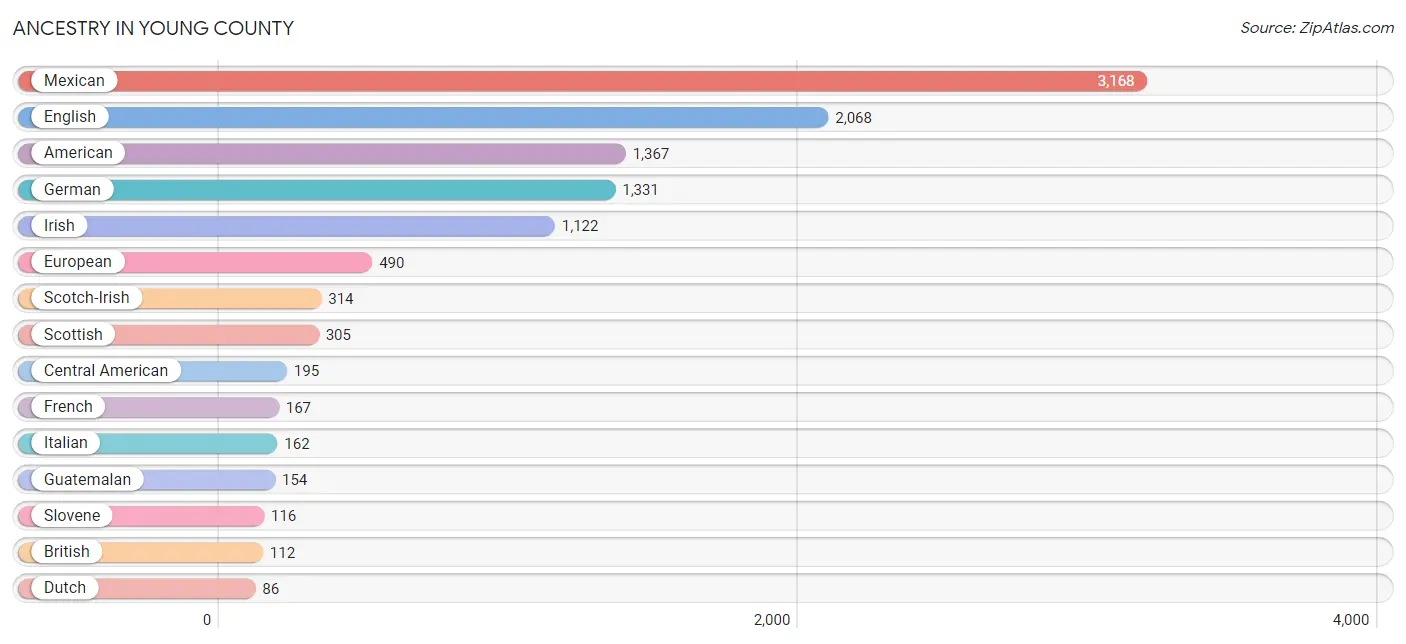
Ancestry in Young County
The most populous ancestries reported in Young County are Mexican (3,168 | 17.7%), English (2,068 | 11.6%), American (1,367 | 7.6%), German (1,331 | 7.4%), and Irish (1,122 | 6.3%), together accounting for 50.6% of all Young County residents.
| Ancestry | # Population | % Population |
| American | 1,367 | 7.6% |
| Blackfeet | 33 | 0.2% |
| British | 112 | 0.6% |
| Burmese | 13 | 0.1% |
| Canadian | 14 | 0.1% |
| Celtic | 22 | 0.1% |
| Central American | 195 | 1.1% |
| Cherokee | 47 | 0.3% |
| Choctaw | 60 | 0.3% |
| Comanche | 33 | 0.2% |
| Cuban | 20 | 0.1% |
| Czech | 60 | 0.3% |
| Danish | 20 | 0.1% |
| Dutch | 86 | 0.5% |
| Dutch West Indian | 5 | 0.0% |
| Eastern European | 4 | 0.0% |
| English | 2,068 | 11.6% |
| European | 490 | 2.7% |
| Finnish | 12 | 0.1% |
| French | 167 | 0.9% |
| German | 1,331 | 7.4% |
| Greek | 8 | 0.0% |
| Guatemalan | 154 | 0.9% |
| Honduran | 20 | 0.1% |
| Hungarian | 16 | 0.1% |
| Irish | 1,122 | 6.3% |
| Italian | 162 | 0.9% |
| Korean | 4 | 0.0% |
| Mexican | 3,168 | 17.7% |
| Norwegian | 86 | 0.5% |
| Polish | 45 | 0.3% |
| Salvadoran | 21 | 0.1% |
| Scotch-Irish | 314 | 1.8% |
| Scottish | 305 | 1.7% |
| Slovene | 116 | 0.6% |
| Spaniard | 24 | 0.1% |
| Spanish | 15 | 0.1% |
| Swedish | 17 | 0.1% |
| Swiss | 20 | 0.1% |
| Thai | 62 | 0.4% |
| Welsh | 5 | 0.0% | View All 41 Rows |
Immigrants in Young County
The most numerous immigrant groups reported in Young County came from Central America (1,187 | 6.6%), Latin America (1,187 | 6.6%), Mexico (1,109 | 6.2%), Europe (103 | 0.6%), and Northern Europe (89 | 0.5%), together accounting for 20.5% of all Young County residents.
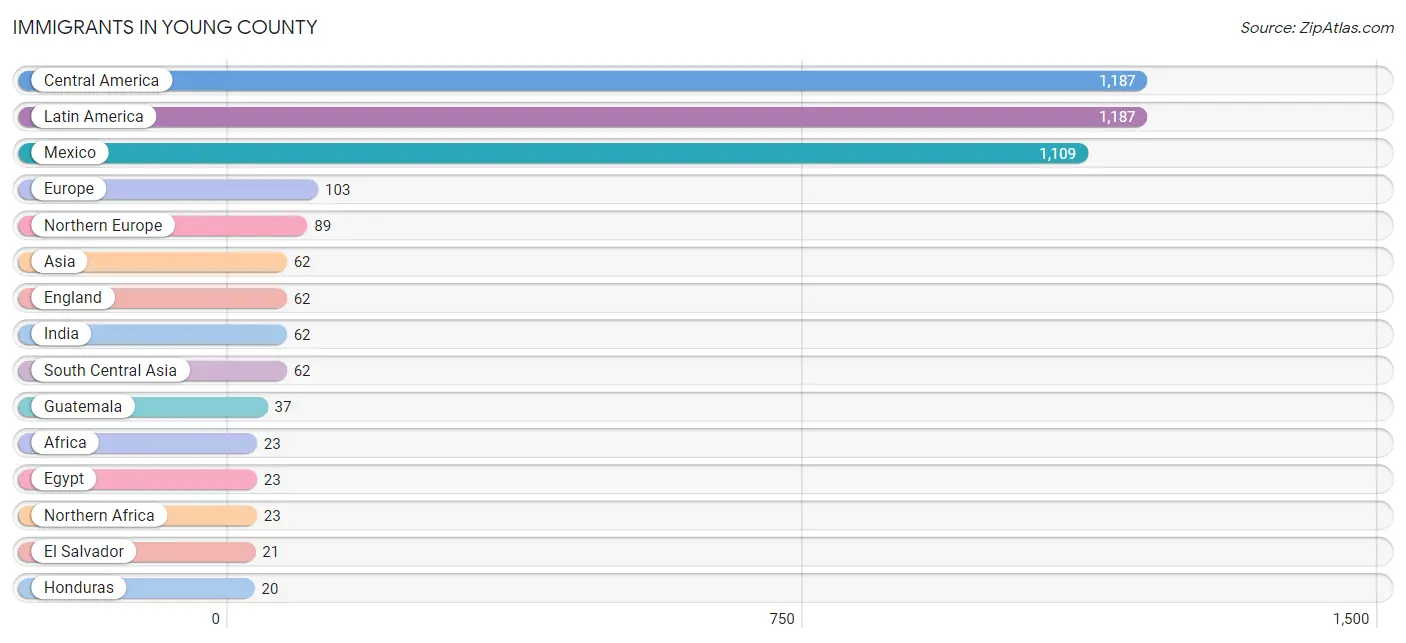
| Immigration Origin | # Population | % Population |
| Africa | 23 | 0.1% |
| Asia | 62 | 0.4% |
| Central America | 1,187 | 6.6% |
| Eastern Europe | 3 | 0.0% |
| Egypt | 23 | 0.1% |
| El Salvador | 21 | 0.1% |
| England | 62 | 0.4% |
| Europe | 103 | 0.6% |
| Germany | 11 | 0.1% |
| Guatemala | 37 | 0.2% |
| Honduras | 20 | 0.1% |
| India | 62 | 0.4% |
| Latin America | 1,187 | 6.6% |
| Mexico | 1,109 | 6.2% |
| Northern Africa | 23 | 0.1% |
| Northern Europe | 89 | 0.5% |
| Russia | 3 | 0.0% |
| Scotland | 18 | 0.1% |
| South Central Asia | 62 | 0.4% |
| Western Europe | 11 | 0.1% | View All 20 Rows |
Sex and Age in Young County
Sex and Age in Young County
The most populous age groups in Young County are 60 to 64 Years (731 | 8.3%) for men and 10 to 14 Years (712 | 7.8%) for women.
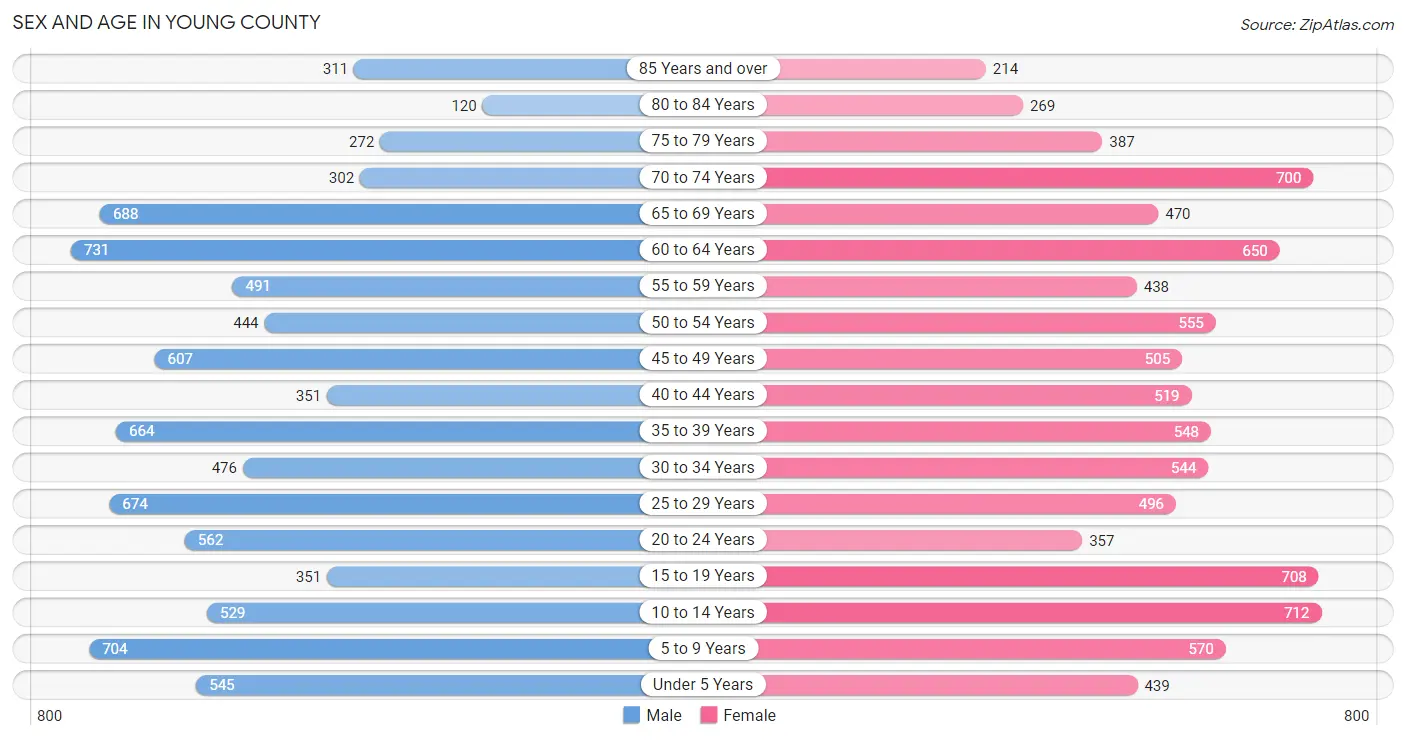
| Age Bracket | Male | Female |
| Under 5 Years | 545 (6.2%) | 439 (4.8%) |
| 5 to 9 Years | 704 (8.0%) | 570 (6.3%) |
| 10 to 14 Years | 529 (6.0%) | 712 (7.8%) |
| 15 to 19 Years | 351 (4.0%) | 708 (7.8%) |
| 20 to 24 Years | 562 (6.4%) | 357 (3.9%) |
| 25 to 29 Years | 674 (7.6%) | 496 (5.5%) |
| 30 to 34 Years | 476 (5.4%) | 544 (6.0%) |
| 35 to 39 Years | 664 (7.5%) | 548 (6.0%) |
| 40 to 44 Years | 351 (4.0%) | 519 (5.7%) |
| 45 to 49 Years | 607 (6.9%) | 505 (5.6%) |
| 50 to 54 Years | 444 (5.0%) | 555 (6.1%) |
| 55 to 59 Years | 491 (5.6%) | 438 (4.8%) |
| 60 to 64 Years | 731 (8.3%) | 650 (7.2%) |
| 65 to 69 Years | 688 (7.8%) | 470 (5.2%) |
| 70 to 74 Years | 302 (3.4%) | 700 (7.7%) |
| 75 to 79 Years | 272 (3.1%) | 387 (4.3%) |
| 80 to 84 Years | 120 (1.4%) | 269 (3.0%) |
| 85 Years and over | 311 (3.5%) | 214 (2.4%) |
| Total | 8,822 (100.0%) | 9,081 (100.0%) |
Families and Households in Young County
Median Family Size in Young County
The median family size in Young County is 2.85 persons per family, with married-couple families (3,741 | 75.8%) accounting for the largest median family size of 2.9 persons per family. On the other hand, single female/mother families (805 | 16.3%) represent the smallest median family size with 2.64 persons per family.
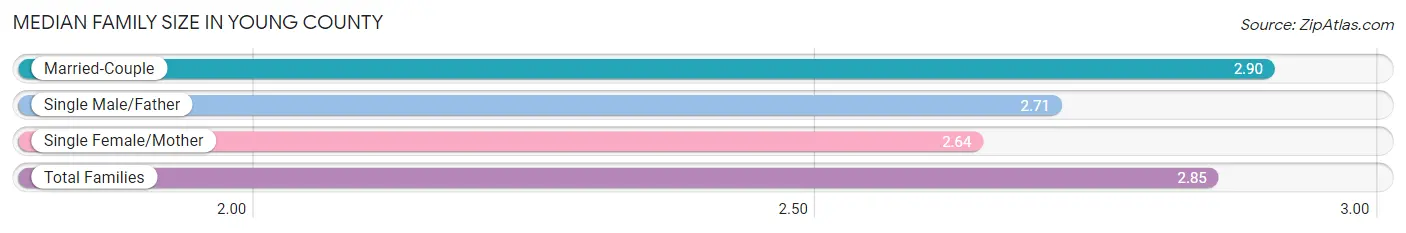
| Family Type | # Families | Family Size |
| Married-Couple | 3,741 (75.8%) | 2.90 |
| Single Male/Father | 390 (7.9%) | 2.71 |
| Single Female/Mother | 805 (16.3%) | 2.64 |
| Total Families | 4,936 (100.0%) | 2.85 |
Median Household Size in Young County
The median household size in Young County is 2.33 persons per household, with single male/father households (390 | 5.2%) accounting for the largest median household size of 3.22 persons per household. non-family households (2,629 | 34.7%) represent the smallest median household size with 1.17 persons per household.
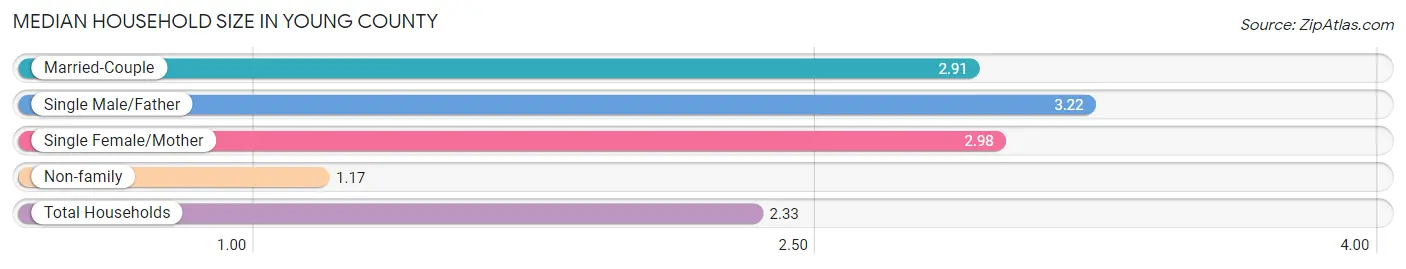
| Household Type | # Households | Household Size |
| Married-Couple | 3,741 (49.4%) | 2.91 |
| Single Male/Father | 390 (5.2%) | 3.22 |
| Single Female/Mother | 805 (10.6%) | 2.98 |
| Non-family | 2,629 (34.7%) | 1.17 |
| Total Households | 7,565 (100.0%) | 2.33 |
Household Size by Marriage Status in Young County
Out of a total of 7,565 households in Young County, 4,936 (65.2%) are family households, while 2,629 (34.7%) are nonfamily households. The most numerous type of family households are 2-person households, comprising 2,600, and the most common type of nonfamily households are 1-person households, comprising 2,230.
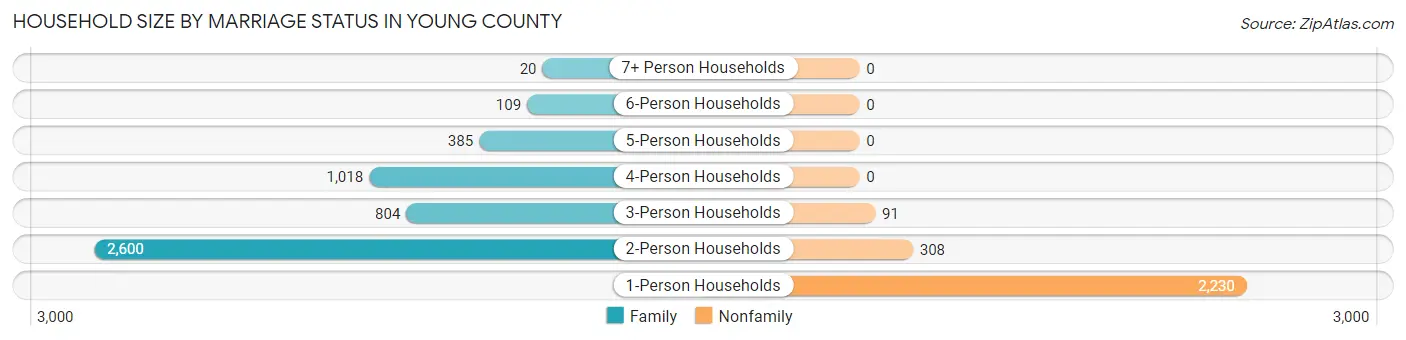
| Household Size | Family Households | Nonfamily Households |
| 1-Person Households | - | 2,230 (29.5%) |
| 2-Person Households | 2,600 (34.4%) | 308 (4.1%) |
| 3-Person Households | 804 (10.6%) | 91 (1.2%) |
| 4-Person Households | 1,018 (13.5%) | 0 (0.0%) |
| 5-Person Households | 385 (5.1%) | 0 (0.0%) |
| 6-Person Households | 109 (1.4%) | 0 (0.0%) |
| 7+ Person Households | 20 (0.3%) | 0 (0.0%) |
| Total | 4,936 (65.2%) | 2,629 (34.7%) |
Female Fertility in Young County
Fertility by Age in Young County
Average fertility rate in Young County is 55.0 births per 1,000 women. Women in the age bracket of 20 to 34 years have the highest fertility rate with 114.0 births per 1,000 women. Women in the age bracket of 20 to 34 years acount for 76.8% of all women with births.
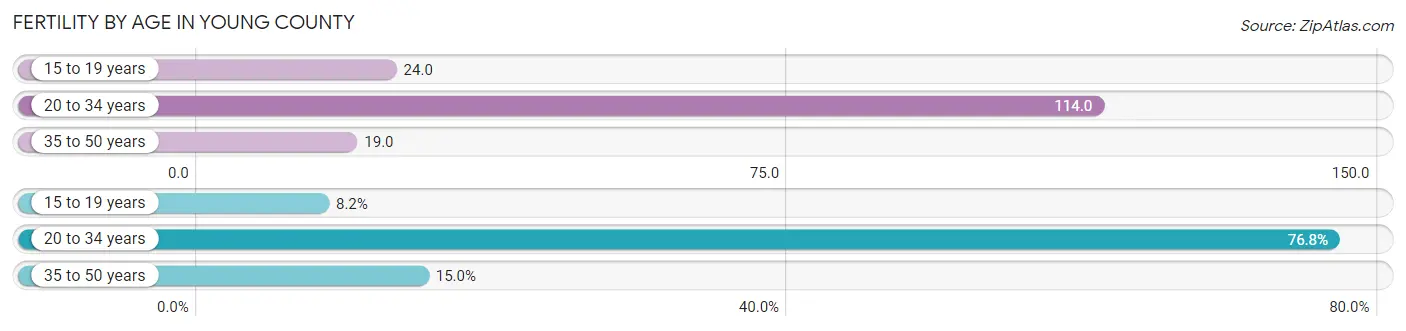
| Age Bracket | Women with Births | Births / 1,000 Women |
| 15 to 19 years | 17 (8.2%) | 24.0 |
| 20 to 34 years | 159 (76.8%) | 114.0 |
| 35 to 50 years | 31 (15.0%) | 19.0 |
| Total | 207 (100.0%) | 55.0 |
Fertility by Age by Marriage Status in Young County
47.8% of women with births (207) in Young County are married. The highest percentage of unmarried women with births falls into 15 to 19 years age bracket with 100.0% of them unmarried at the time of birth, while the lowest percentage of unmarried women with births belong to 20 to 34 years age bracket with 37.7% of them unmarried.
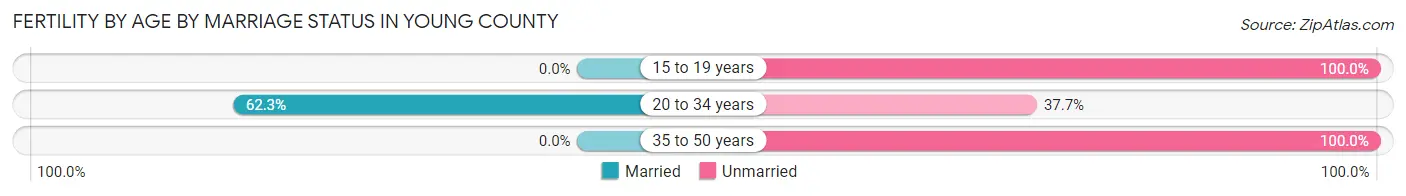
| Age Bracket | Married | Unmarried |
| 15 to 19 years | 0 (0.0%) | 17 (100.0%) |
| 20 to 34 years | 99 (62.3%) | 60 (37.7%) |
| 35 to 50 years | 0 (0.0%) | 31 (100.0%) |
| Total | 99 (47.8%) | 108 (52.2%) |
Fertility by Education in Young County
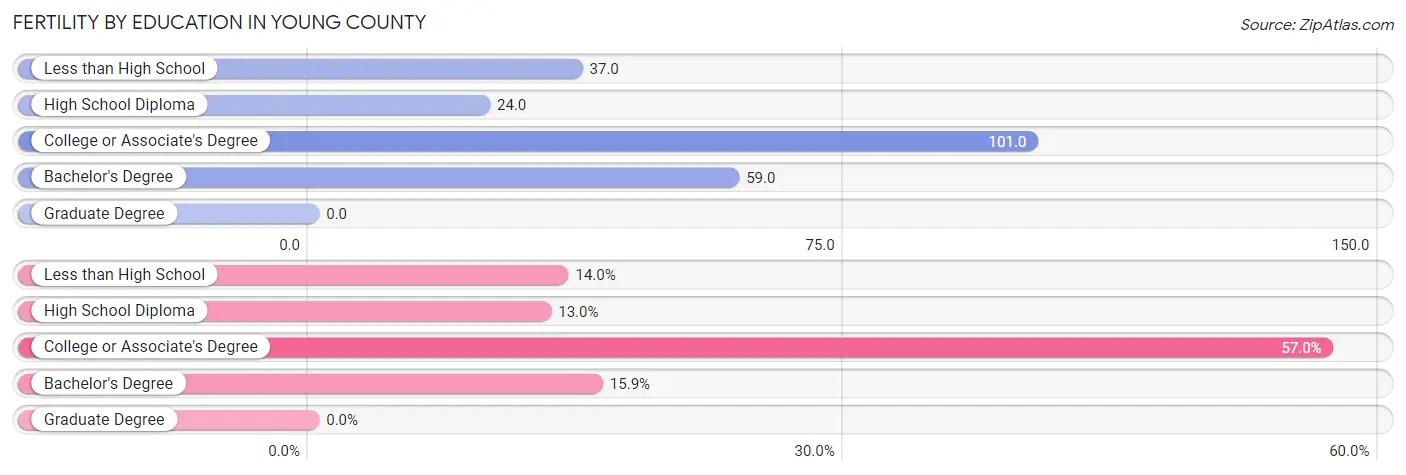
| Educational Attainment | Women with Births | Births / 1,000 Women |
| Less than High School | 29 (14.0%) | 37.0 |
| High School Diploma | 27 (13.0%) | 24.0 |
| College or Associate's Degree | 118 (57.0%) | 101.0 |
| Bachelor's Degree | 33 (15.9%) | 59.0 |
| Graduate Degree | 0 (0.0%) | 0.0 |
| Total | 207 (100.0%) | 55.0 |
Fertility by Education by Marriage Status in Young County
52.2% of women with births in Young County are unmarried. Women with the educational attainment of bachelor's degree are most likely to be married with 100.0% of them married at childbirth, while women with the educational attainment of less than high school are least likely to be married with 100.0% of them unmarried at childbirth.
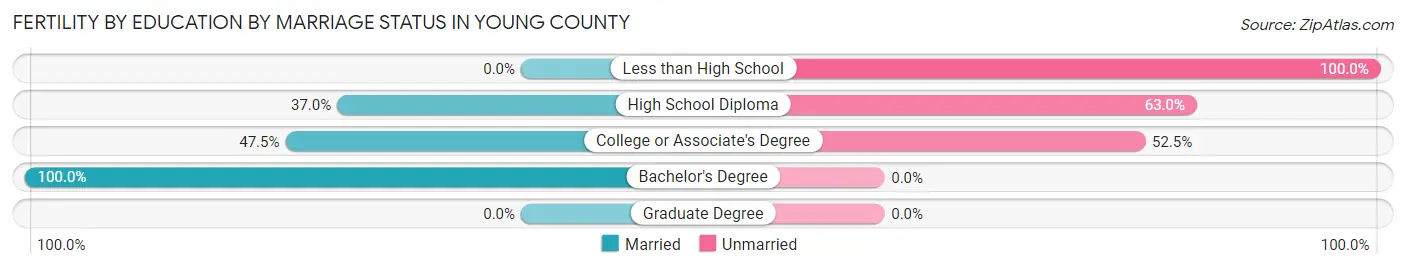
| Educational Attainment | Married | Unmarried |
| Less than High School | 0 (0.0%) | 29 (100.0%) |
| High School Diploma | 10 (37.0%) | 17 (63.0%) |
| College or Associate's Degree | 56 (47.5%) | 62 (52.5%) |
| Bachelor's Degree | 33 (100.0%) | 0 (0.0%) |
| Graduate Degree | 0 (0.0%) | 0 (0.0%) |
| Total | 99 (47.8%) | 108 (52.2%) |
Employment Characteristics in Young County
Employment by Class of Employer in Young County
Among the 8,135 employed individuals in Young County, private company employees (5,027 | 61.8%), local government employees (894 | 11.0%), and self-employed (not incorporated) (881 | 10.8%) make up the most common classes of employment.
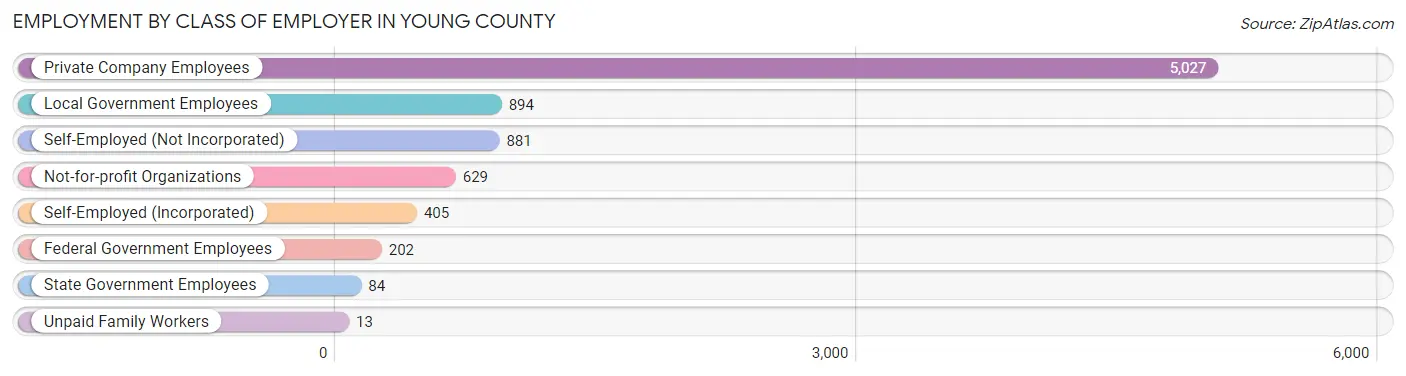
| Employer Class | # Employees | % Employees |
| Private Company Employees | 5,027 | 61.8% |
| Self-Employed (Incorporated) | 405 | 5.0% |
| Self-Employed (Not Incorporated) | 881 | 10.8% |
| Not-for-profit Organizations | 629 | 7.7% |
| Local Government Employees | 894 | 11.0% |
| State Government Employees | 84 | 1.0% |
| Federal Government Employees | 202 | 2.5% |
| Unpaid Family Workers | 13 | 0.2% |
| Total | 8,135 | 100.0% |
Employment Status by Age in Young County
According to the labor force statistics for Young County, out of the total population over 16 years of age (14,167), 59.6% or 8,444 individuals are in the labor force, with 2.6% or 220 of them unemployed. The age group with the highest labor force participation rate is 30 to 34 years, with 83.4% or 851 individuals in the labor force. Within the labor force, the 25 to 29 years age range has the highest percentage of unemployed individuals, with 7.6% or 72 of them being unemployed.
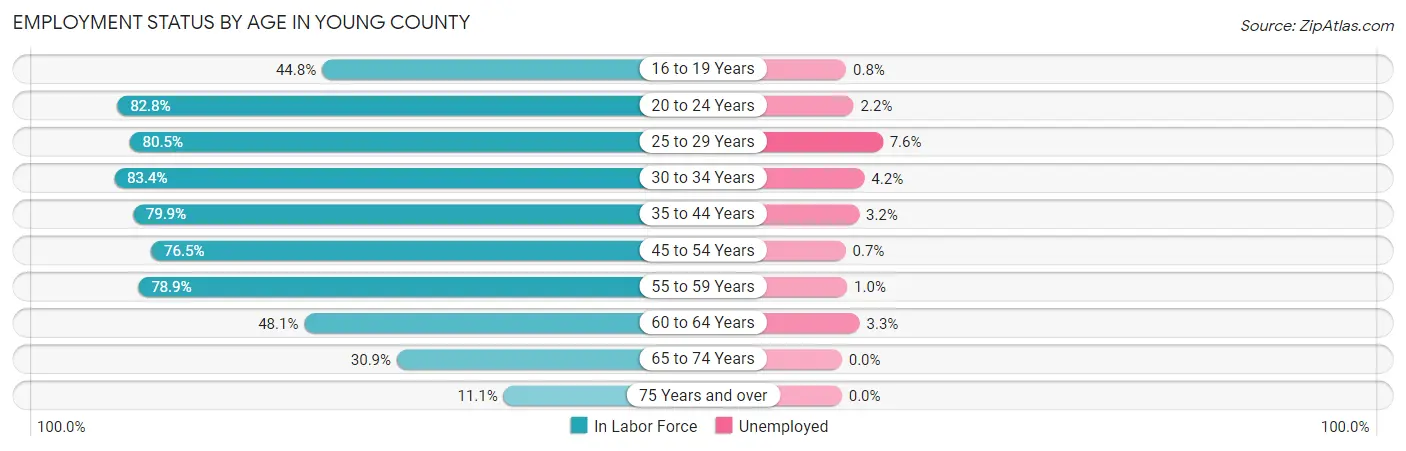
| Age Bracket | In Labor Force | Unemployed |
| 16 to 19 Years | 368 (44.8%) | 3 (0.8%) |
| 20 to 24 Years | 761 (82.8%) | 17 (2.2%) |
| 25 to 29 Years | 942 (80.5%) | 72 (7.6%) |
| 30 to 34 Years | 851 (83.4%) | 36 (4.2%) |
| 35 to 44 Years | 1,664 (79.9%) | 53 (3.2%) |
| 45 to 54 Years | 1,615 (76.5%) | 11 (0.7%) |
| 55 to 59 Years | 733 (78.9%) | 7 (1.0%) |
| 60 to 64 Years | 664 (48.1%) | 22 (3.3%) |
| 65 to 74 Years | 667 (30.9%) | 0 (0.0%) |
| 75 Years and over | 175 (11.1%) | 0 (0.0%) |
| Total | 8,444 (59.6%) | 220 (2.6%) |
Employment Status by Educational Attainment in Young County
According to labor force statistics for Young County, 74.4% of individuals (6,468) out of the total population between 25 and 64 years of age (8,693) are in the labor force, with 3.1% or 201 of them being unemployed. The group with the highest labor force participation rate are those with the educational attainment of bachelor's degree or higher, with 81.1% or 1,740 individuals in the labor force. Within the labor force, individuals with less than high school education have the highest percentage of unemployment, with 11.4% or 63 of them being unemployed.
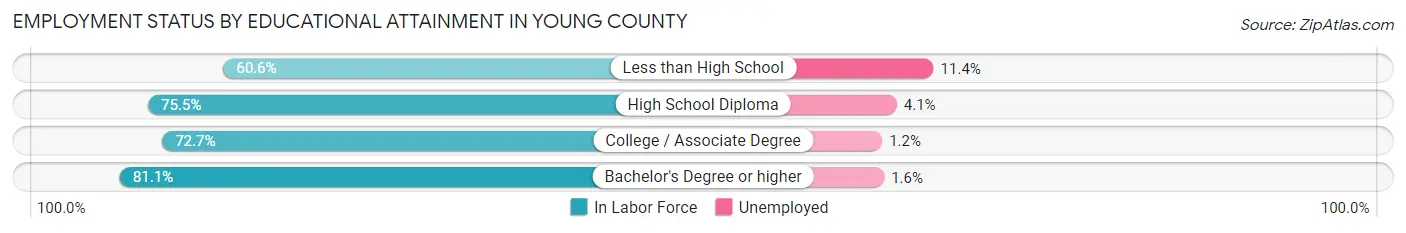
| Educational Attainment | In Labor Force | Unemployed |
| Less than High School | 551 (60.6%) | 104 (11.4%) |
| High School Diploma | 2,075 (75.5%) | 113 (4.1%) |
| College / Associate Degree | 2,101 (72.7%) | 35 (1.2%) |
| Bachelor's Degree or higher | 1,740 (81.1%) | 34 (1.6%) |
| Total | 6,468 (74.4%) | 269 (3.1%) |
Employment Occupations by Sex in Young County
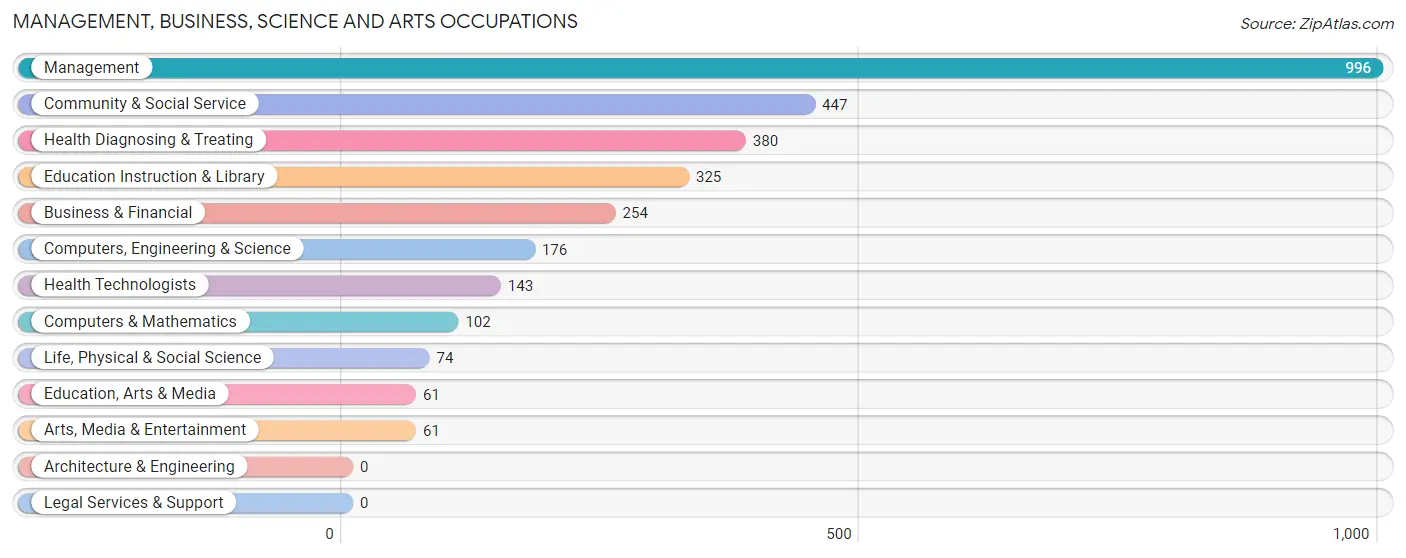
Management, Business, Science and Arts Occupations
The most common Management, Business, Science and Arts occupations in Young County are Management (996 | 12.1%), Community & Social Service (447 | 5.4%), Health Diagnosing & Treating (380 | 4.6%), Education Instruction & Library (325 | 4.0%), and Business & Financial (254 | 3.1%).
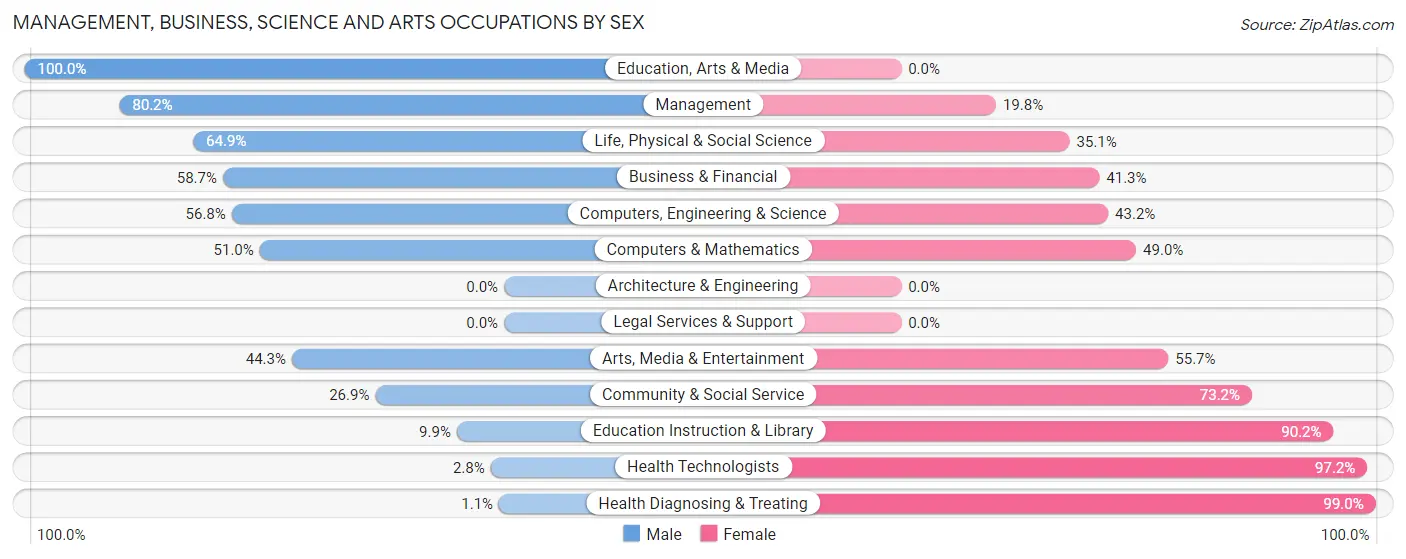
Management, Business, Science and Arts Occupations by Sex
Within the Management, Business, Science and Arts occupations in Young County, the most male-oriented occupations are Education, Arts & Media (100.0%), Management (80.2%), and Life, Physical & Social Science (64.9%), while the most female-oriented occupations are Health Diagnosing & Treating (99.0%), Health Technologists (97.2%), and Education Instruction & Library (90.1%).
| Occupation | Male | Female |
| Management | 799 (80.2%) | 197 (19.8%) |
| Business & Financial | 149 (58.7%) | 105 (41.3%) |
| Computers, Engineering & Science | 100 (56.8%) | 76 (43.2%) |
| Computers & Mathematics | 52 (51.0%) | 50 (49.0%) |
| Architecture & Engineering | 0 (0.0%) | 0 (0.0%) |
| Life, Physical & Social Science | 48 (64.9%) | 26 (35.1%) |
| Community & Social Service | 120 (26.9%) | 327 (73.2%) |
| Education, Arts & Media | 61 (100.0%) | 0 (0.0%) |
| Legal Services & Support | 0 (0.0%) | 0 (0.0%) |
| Education Instruction & Library | 32 (9.9%) | 293 (90.1%) |
| Arts, Media & Entertainment | 27 (44.3%) | 34 (55.7%) |
| Health Diagnosing & Treating | 4 (1.1%) | 376 (99.0%) |
| Health Technologists | 4 (2.8%) | 139 (97.2%) |
| Total (Category) | 1,172 (52.0%) | 1,081 (48.0%) |
| Total (Overall) | 4,762 (58.0%) | 3,455 (42.0%) |
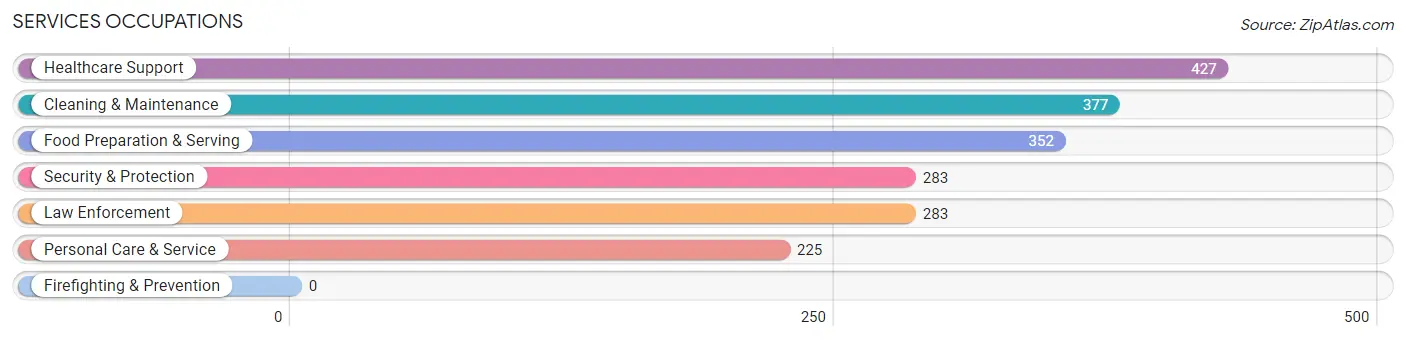
Services Occupations
The most common Services occupations in Young County are Healthcare Support (427 | 5.2%), Cleaning & Maintenance (377 | 4.6%), Food Preparation & Serving (352 | 4.3%), Security & Protection (283 | 3.4%), and Law Enforcement (283 | 3.4%).
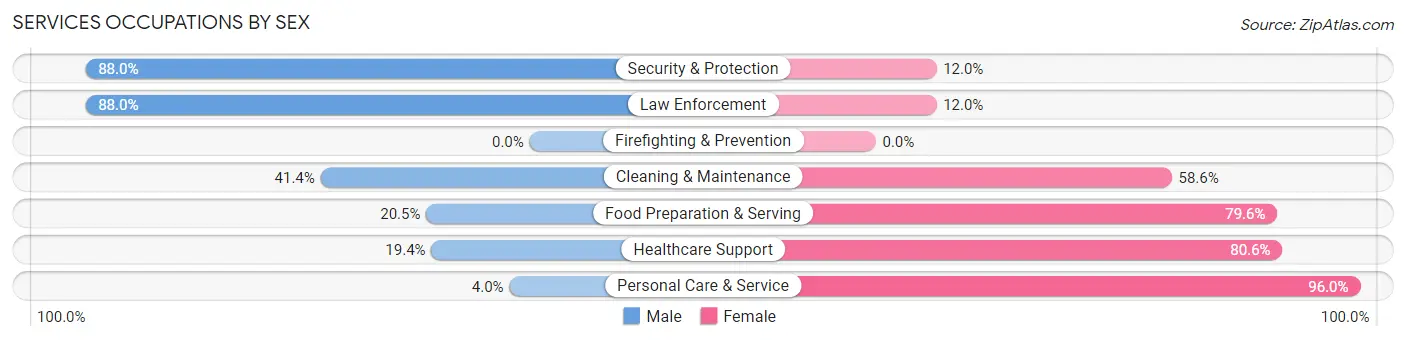
Services Occupations by Sex
Within the Services occupations in Young County, the most male-oriented occupations are Security & Protection (88.0%), Law Enforcement (88.0%), and Cleaning & Maintenance (41.4%), while the most female-oriented occupations are Personal Care & Service (96.0%), Healthcare Support (80.6%), and Food Preparation & Serving (79.5%).
| Occupation | Male | Female |
| Healthcare Support | 83 (19.4%) | 344 (80.6%) |
| Security & Protection | 249 (88.0%) | 34 (12.0%) |
| Firefighting & Prevention | 0 (0.0%) | 0 (0.0%) |
| Law Enforcement | 249 (88.0%) | 34 (12.0%) |
| Food Preparation & Serving | 72 (20.4%) | 280 (79.5%) |
| Cleaning & Maintenance | 156 (41.4%) | 221 (58.6%) |
| Personal Care & Service | 9 (4.0%) | 216 (96.0%) |
| Total (Category) | 569 (34.2%) | 1,095 (65.8%) |
| Total (Overall) | 4,762 (58.0%) | 3,455 (42.0%) |
Sales and Office Occupations
The most common Sales and Office occupations in Young County are Office & Administration (1,079 | 13.1%), and Sales & Related (542 | 6.6%).
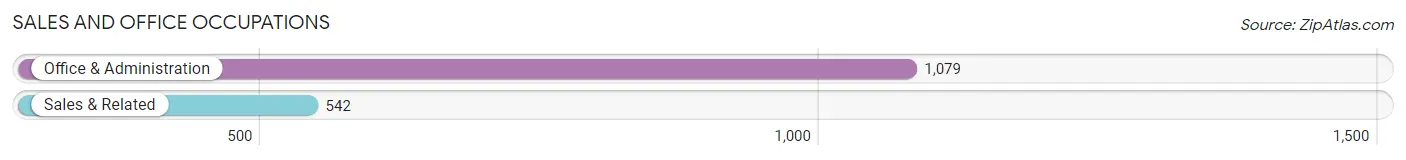
Sales and Office Occupations by Sex
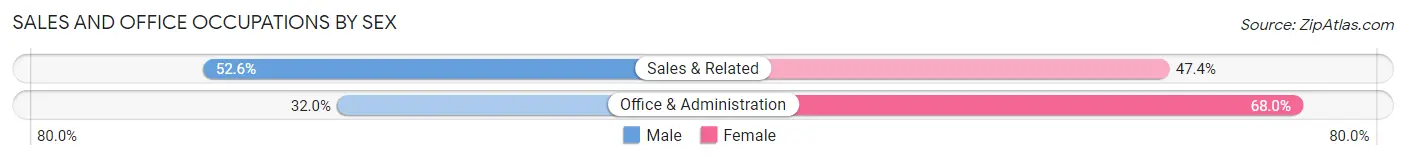
| Occupation | Male | Female |
| Sales & Related | 285 (52.6%) | 257 (47.4%) |
| Office & Administration | 345 (32.0%) | 734 (68.0%) |
| Total (Category) | 630 (38.9%) | 991 (61.1%) |
| Total (Overall) | 4,762 (58.0%) | 3,455 (42.0%) |
Natural Resources, Construction and Maintenance Occupations
The most common Natural Resources, Construction and Maintenance occupations in Young County are Construction & Extraction (954 | 11.6%), Installation, Maintenance & Repair (292 | 3.5%), and Farming, Fishing & Forestry (146 | 1.8%).
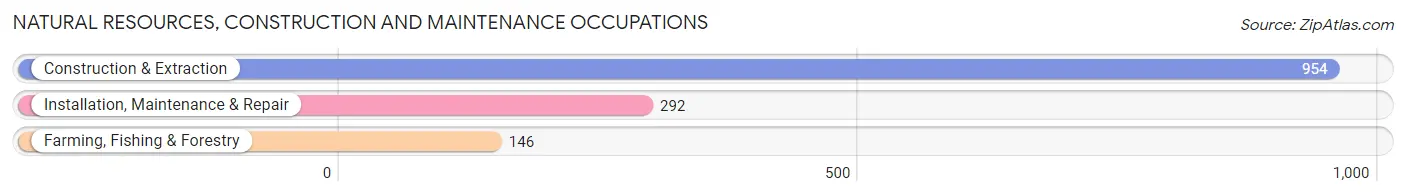
Natural Resources, Construction and Maintenance Occupations by Sex
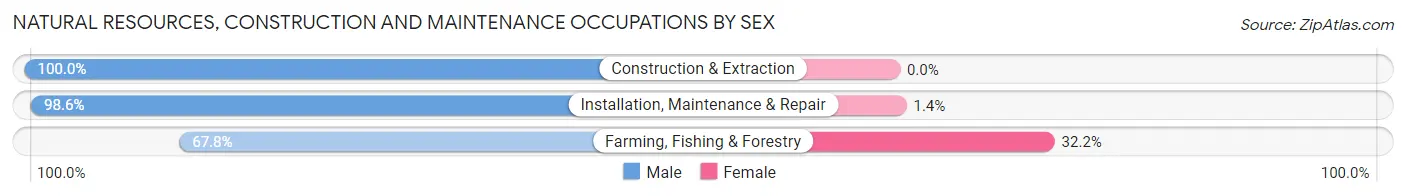
| Occupation | Male | Female |
| Farming, Fishing & Forestry | 99 (67.8%) | 47 (32.2%) |
| Construction & Extraction | 954 (100.0%) | 0 (0.0%) |
| Installation, Maintenance & Repair | 288 (98.6%) | 4 (1.4%) |
| Total (Category) | 1,341 (96.3%) | 51 (3.7%) |
| Total (Overall) | 4,762 (58.0%) | 3,455 (42.0%) |
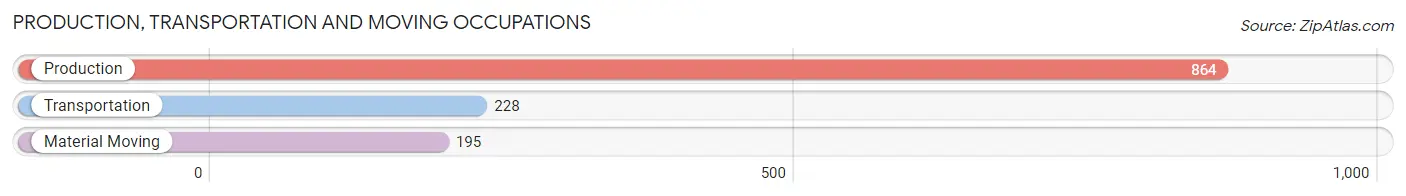
Production, Transportation and Moving Occupations
The most common Production, Transportation and Moving occupations in Young County are Production (864 | 10.5%), Transportation (228 | 2.8%), and Material Moving (195 | 2.4%).
Production, Transportation and Moving Occupations by Sex
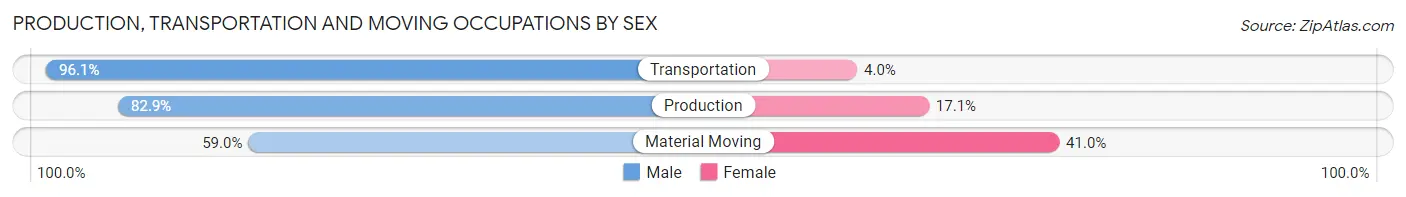
| Occupation | Male | Female |
| Production | 716 (82.9%) | 148 (17.1%) |
| Transportation | 219 (96.1%) | 9 (4.0%) |
| Material Moving | 115 (59.0%) | 80 (41.0%) |
| Total (Category) | 1,050 (81.6%) | 237 (18.4%) |
| Total (Overall) | 4,762 (58.0%) | 3,455 (42.0%) |
Employment Industries by Sex in Young County
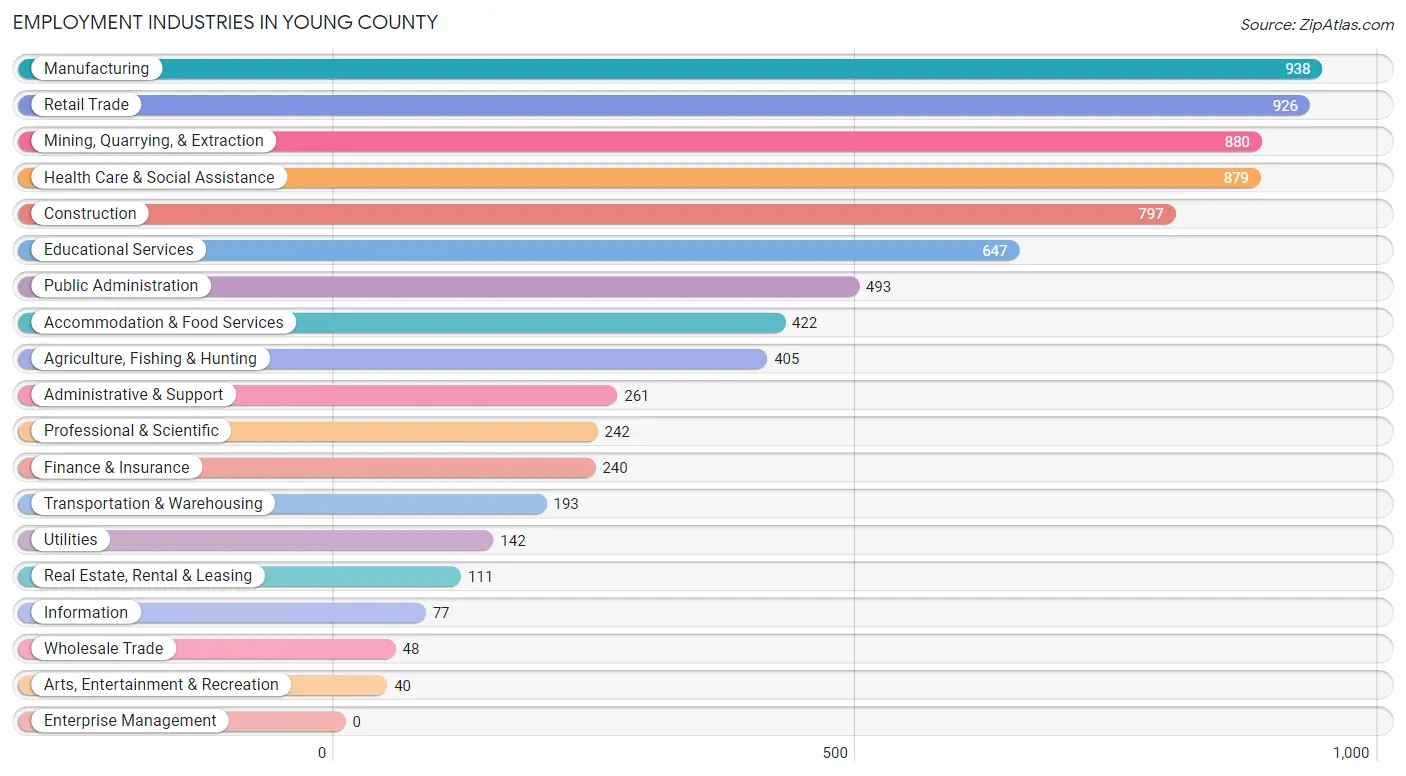
Employment Industries in Young County
The major employment industries in Young County include Manufacturing (938 | 11.4%), Retail Trade (926 | 11.3%), Mining, Quarrying, & Extraction (880 | 10.7%), Health Care & Social Assistance (879 | 10.7%), and Construction (797 | 9.7%).
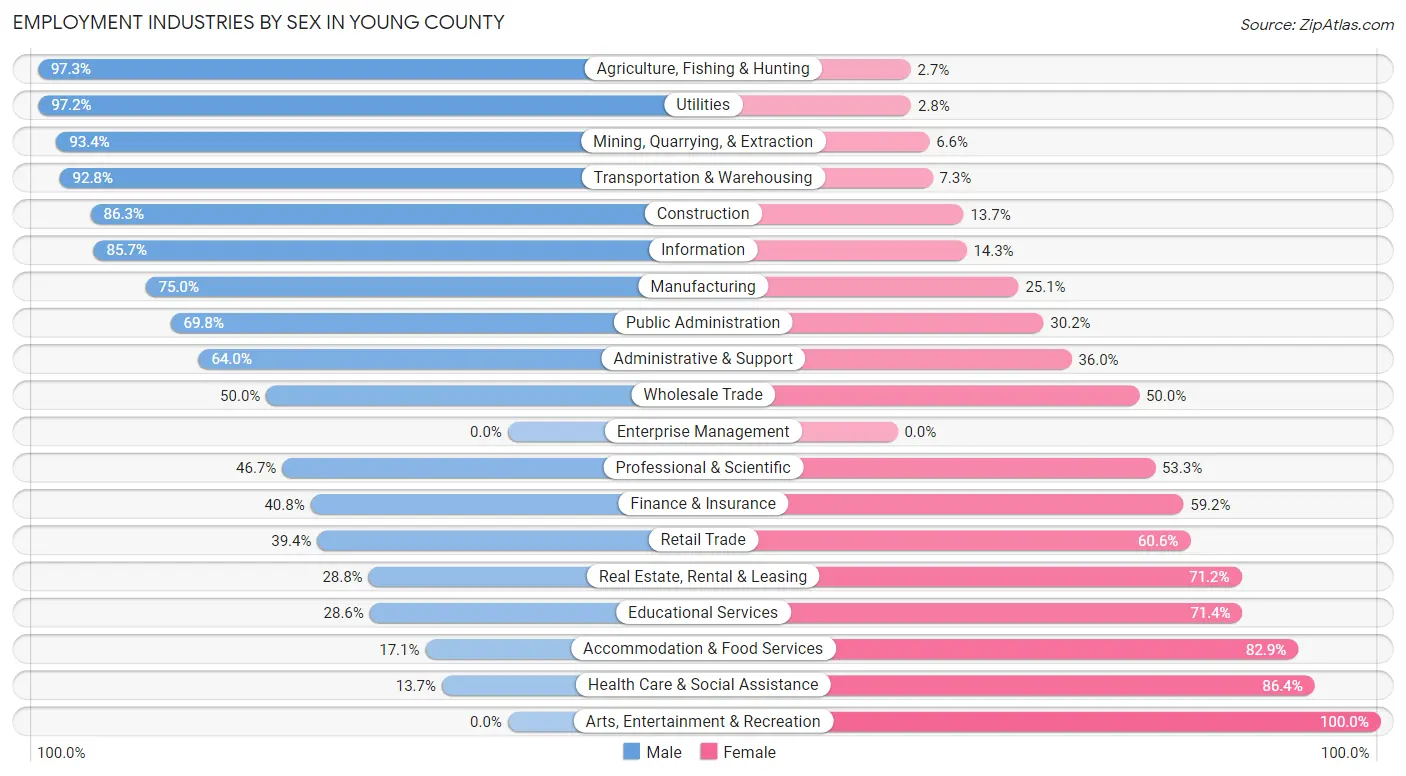
Employment Industries by Sex in Young County
The Young County industries that see more men than women are Agriculture, Fishing & Hunting (97.3%), Utilities (97.2%), and Mining, Quarrying, & Extraction (93.4%), whereas the industries that tend to have a higher number of women are Arts, Entertainment & Recreation (100.0%), Health Care & Social Assistance (86.4%), and Accommodation & Food Services (82.9%).
| Industry | Male | Female |
| Agriculture, Fishing & Hunting | 394 (97.3%) | 11 (2.7%) |
| Mining, Quarrying, & Extraction | 822 (93.4%) | 58 (6.6%) |
| Construction | 688 (86.3%) | 109 (13.7%) |
| Manufacturing | 703 (75.0%) | 235 (25.1%) |
| Wholesale Trade | 24 (50.0%) | 24 (50.0%) |
| Retail Trade | 365 (39.4%) | 561 (60.6%) |
| Transportation & Warehousing | 179 (92.7%) | 14 (7.2%) |
| Utilities | 138 (97.2%) | 4 (2.8%) |
| Information | 66 (85.7%) | 11 (14.3%) |
| Finance & Insurance | 98 (40.8%) | 142 (59.2%) |
| Real Estate, Rental & Leasing | 32 (28.8%) | 79 (71.2%) |
| Professional & Scientific | 113 (46.7%) | 129 (53.3%) |
| Enterprise Management | 0 (0.0%) | 0 (0.0%) |
| Administrative & Support | 167 (64.0%) | 94 (36.0%) |
| Educational Services | 185 (28.6%) | 462 (71.4%) |
| Health Care & Social Assistance | 120 (13.7%) | 759 (86.4%) |
| Arts, Entertainment & Recreation | 0 (0.0%) | 40 (100.0%) |
| Accommodation & Food Services | 72 (17.1%) | 350 (82.9%) |
| Public Administration | 344 (69.8%) | 149 (30.2%) |
| Total | 4,762 (58.0%) | 3,455 (42.0%) |
Education in Young County
School Enrollment in Young County
The most common levels of schooling among the 3,940 students in Young County are elementary school (1,248 | 31.7%), high school (945 | 24.0%), and middle school (907 | 23.0%).
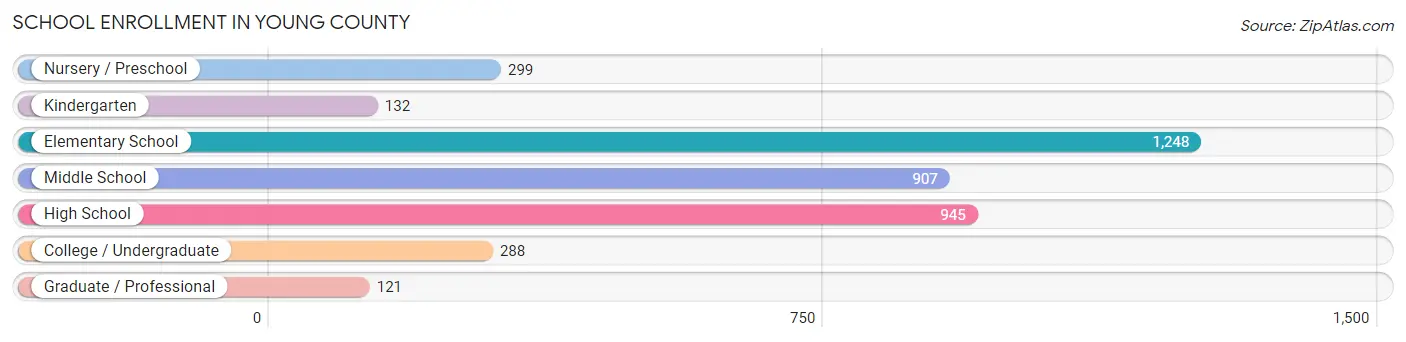
| School Level | # Students | % Students |
| Nursery / Preschool | 299 | 7.6% |
| Kindergarten | 132 | 3.4% |
| Elementary School | 1,248 | 31.7% |
| Middle School | 907 | 23.0% |
| High School | 945 | 24.0% |
| College / Undergraduate | 288 | 7.3% |
| Graduate / Professional | 121 | 3.1% |
| Total | 3,940 | 100.0% |
School Enrollment by Age by Funding Source in Young County
Out of a total of 3,940 students who are enrolled in schools in Young County, 433 (11.0%) attend a private institution, while the remaining 3,507 (89.0%) are enrolled in public schools. The age group of 3 to 4 year olds has the highest likelihood of being enrolled in private schools, with 113 (54.6% in the age bracket) enrolled. Conversely, the age group of 20 to 24 year olds has the lowest likelihood of being enrolled in a private school, with 47 (100.0% in the age bracket) attending a public institution.
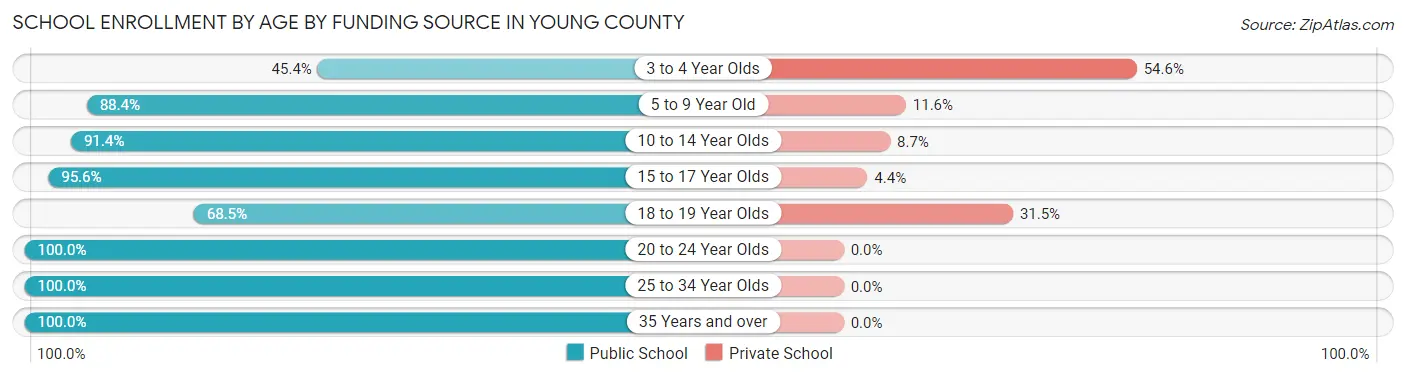
| Age Bracket | Public School | Private School |
| 3 to 4 Year Olds | 94 (45.4%) | 113 (54.6%) |
| 5 to 9 Year Old | 1,115 (88.4%) | 146 (11.6%) |
| 10 to 14 Year Olds | 1,130 (91.3%) | 107 (8.6%) |
| 15 to 17 Year Olds | 735 (95.6%) | 34 (4.4%) |
| 18 to 19 Year Olds | 76 (68.5%) | 35 (31.5%) |
| 20 to 24 Year Olds | 47 (100.0%) | 0 (0.0%) |
| 25 to 34 Year Olds | 171 (100.0%) | 0 (0.0%) |
| 35 Years and over | 137 (100.0%) | 0 (0.0%) |
| Total | 3,507 (89.0%) | 433 (11.0%) |
Educational Attainment by Field of Study in Young County
Business (722 | 24.2%), education (659 | 22.1%), arts & humanities (281 | 9.4%), bio, nature & agricultural (254 | 8.5%), and social sciences (243 | 8.1%) are the most common fields of study among 2,986 individuals in Young County who have obtained a bachelor's degree or higher.
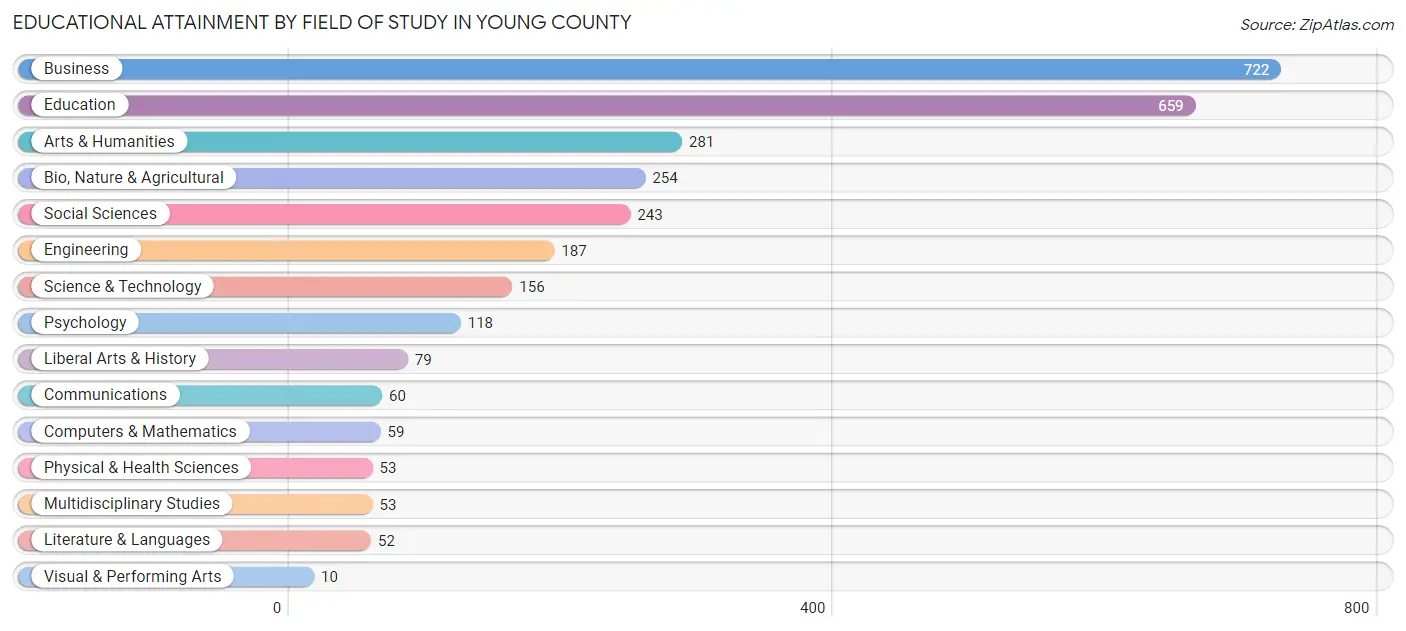
| Field of Study | # Graduates | % Graduates |
| Computers & Mathematics | 59 | 2.0% |
| Bio, Nature & Agricultural | 254 | 8.5% |
| Physical & Health Sciences | 53 | 1.8% |
| Psychology | 118 | 4.0% |
| Social Sciences | 243 | 8.1% |
| Engineering | 187 | 6.3% |
| Multidisciplinary Studies | 53 | 1.8% |
| Science & Technology | 156 | 5.2% |
| Business | 722 | 24.2% |
| Education | 659 | 22.1% |
| Literature & Languages | 52 | 1.7% |
| Liberal Arts & History | 79 | 2.6% |
| Visual & Performing Arts | 10 | 0.3% |
| Communications | 60 | 2.0% |
| Arts & Humanities | 281 | 9.4% |
| Total | 2,986 | 100.0% |
Transportation & Commute in Young County
Vehicle Availability by Sex in Young County
The most prevalent vehicle ownership categories in Young County are males with 2 vehicles (2,191, accounting for 46.6%) and females with 2 vehicles (1,498, making up 63.8%).
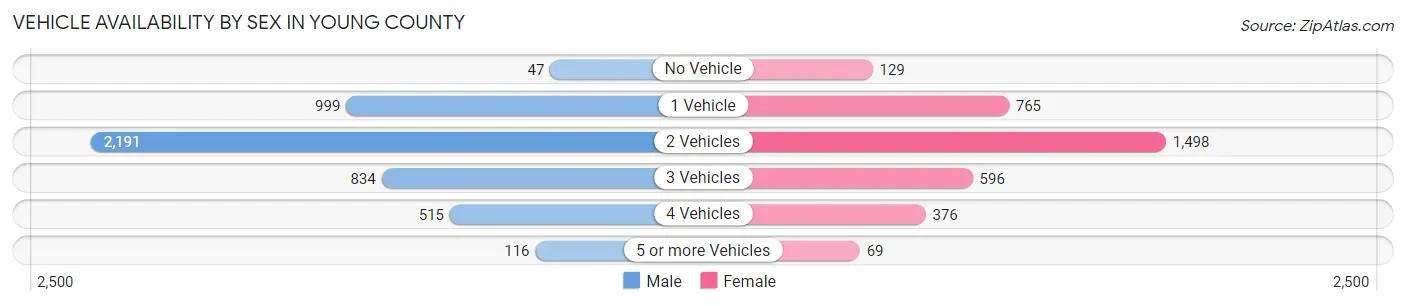
| Vehicles Available | Male | Female |
| No Vehicle | 47 (1.0%) | 129 (3.8%) |
| 1 Vehicle | 999 (21.2%) | 765 (22.3%) |
| 2 Vehicles | 2,191 (46.6%) | 1,498 (43.6%) |
| 3 Vehicles | 834 (17.7%) | 596 (17.4%) |
| 4 Vehicles | 515 (11.0%) | 376 (11.0%) |
| 5 or more Vehicles | 116 (2.5%) | 69 (2.0%) |
| Total | 4,702 (100.0%) | 3,433 (100.0%) |
Commute Time in Young County
The most frequently occuring commute durations in Young County are 5 to 9 minutes (2,145 commuters, 27.9%), less than 5 minutes (1,214 commuters, 15.8%), and 10 to 14 minutes (1,110 commuters, 14.4%).
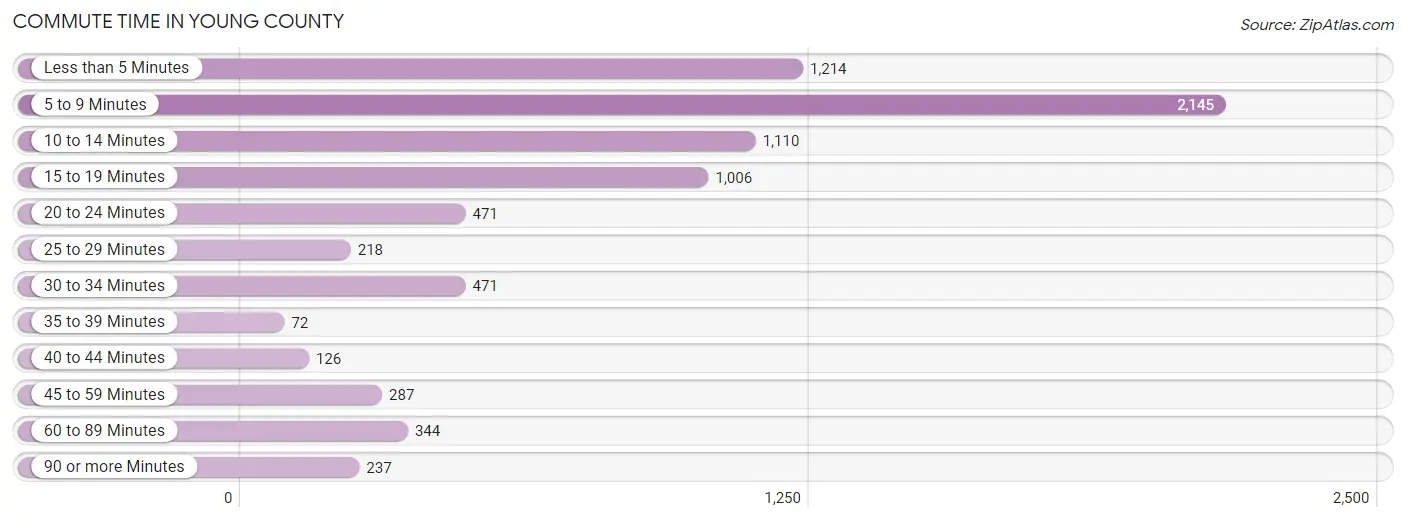
| Commute Time | # Commuters | % Commuters |
| Less than 5 Minutes | 1,214 | 15.8% |
| 5 to 9 Minutes | 2,145 | 27.9% |
| 10 to 14 Minutes | 1,110 | 14.4% |
| 15 to 19 Minutes | 1,006 | 13.1% |
| 20 to 24 Minutes | 471 | 6.1% |
| 25 to 29 Minutes | 218 | 2.8% |
| 30 to 34 Minutes | 471 | 6.1% |
| 35 to 39 Minutes | 72 | 0.9% |
| 40 to 44 Minutes | 126 | 1.6% |
| 45 to 59 Minutes | 287 | 3.7% |
| 60 to 89 Minutes | 344 | 4.5% |
| 90 or more Minutes | 237 | 3.1% |
Commute Time by Sex in Young County
The most common commute times in Young County are 5 to 9 minutes (1,016 commuters, 23.4%) for males and 5 to 9 minutes (1,129 commuters, 33.7%) for females.
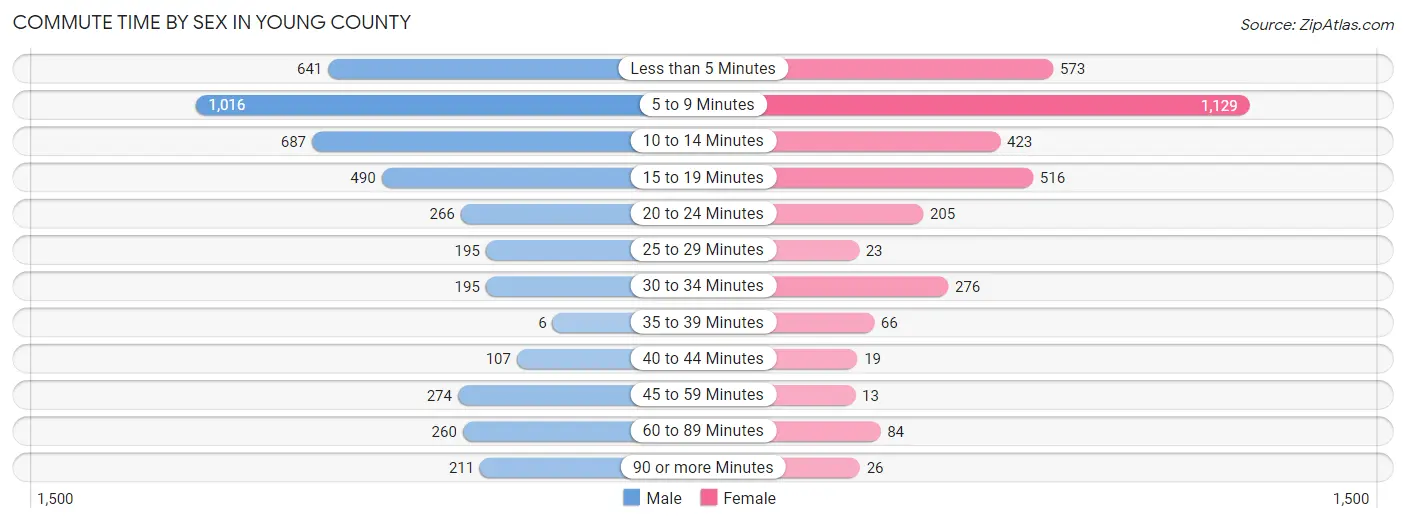
| Commute Time | Male | Female |
| Less than 5 Minutes | 641 (14.7%) | 573 (17.1%) |
| 5 to 9 Minutes | 1,016 (23.4%) | 1,129 (33.7%) |
| 10 to 14 Minutes | 687 (15.8%) | 423 (12.6%) |
| 15 to 19 Minutes | 490 (11.3%) | 516 (15.4%) |
| 20 to 24 Minutes | 266 (6.1%) | 205 (6.1%) |
| 25 to 29 Minutes | 195 (4.5%) | 23 (0.7%) |
| 30 to 34 Minutes | 195 (4.5%) | 276 (8.2%) |
| 35 to 39 Minutes | 6 (0.1%) | 66 (2.0%) |
| 40 to 44 Minutes | 107 (2.5%) | 19 (0.6%) |
| 45 to 59 Minutes | 274 (6.3%) | 13 (0.4%) |
| 60 to 89 Minutes | 260 (6.0%) | 84 (2.5%) |
| 90 or more Minutes | 211 (4.9%) | 26 (0.8%) |
Time of Departure to Work by Sex in Young County
The most frequent times of departure to work in Young County are 7:30 AM to 7:59 AM (652, 15.0%) for males and 7:30 AM to 7:59 AM (679, 20.3%) for females.
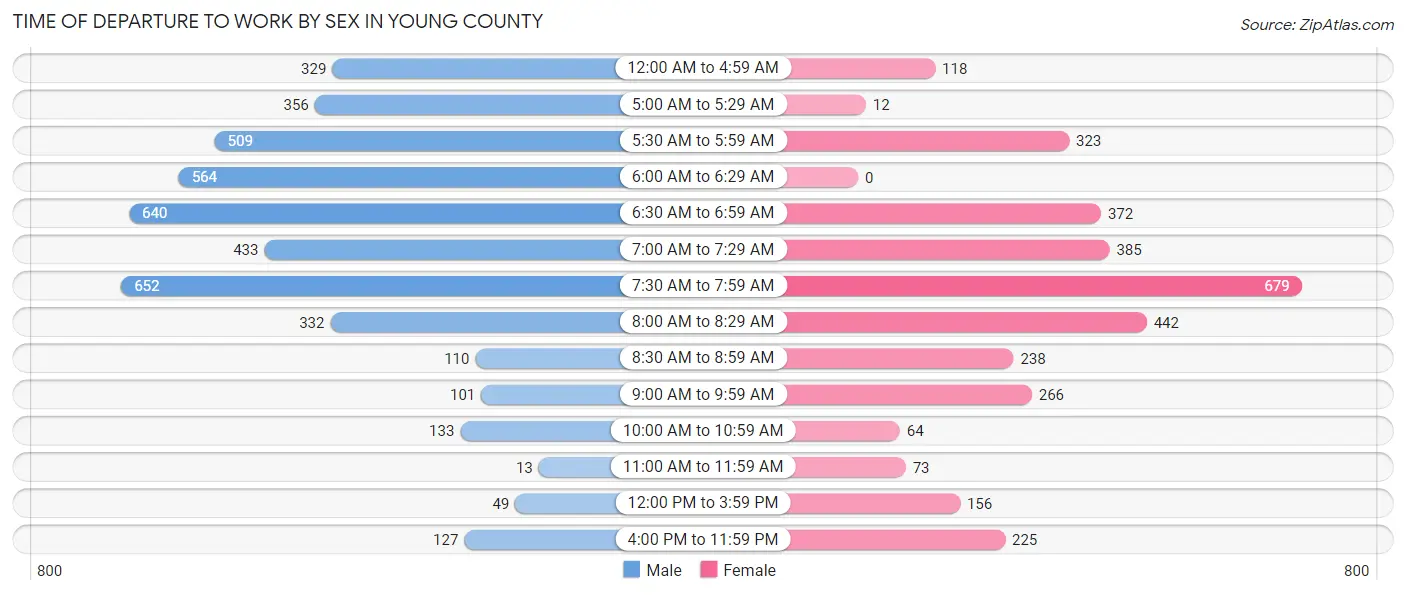
| Time of Departure | Male | Female |
| 12:00 AM to 4:59 AM | 329 (7.6%) | 118 (3.5%) |
| 5:00 AM to 5:29 AM | 356 (8.2%) | 12 (0.4%) |
| 5:30 AM to 5:59 AM | 509 (11.7%) | 323 (9.6%) |
| 6:00 AM to 6:29 AM | 564 (13.0%) | 0 (0.0%) |
| 6:30 AM to 6:59 AM | 640 (14.7%) | 372 (11.1%) |
| 7:00 AM to 7:29 AM | 433 (10.0%) | 385 (11.5%) |
| 7:30 AM to 7:59 AM | 652 (15.0%) | 679 (20.3%) |
| 8:00 AM to 8:29 AM | 332 (7.6%) | 442 (13.2%) |
| 8:30 AM to 8:59 AM | 110 (2.5%) | 238 (7.1%) |
| 9:00 AM to 9:59 AM | 101 (2.3%) | 266 (7.9%) |
| 10:00 AM to 10:59 AM | 133 (3.1%) | 64 (1.9%) |
| 11:00 AM to 11:59 AM | 13 (0.3%) | 73 (2.2%) |
| 12:00 PM to 3:59 PM | 49 (1.1%) | 156 (4.6%) |
| 4:00 PM to 11:59 PM | 127 (2.9%) | 225 (6.7%) |
| Total | 4,348 (100.0%) | 3,353 (100.0%) |
Housing Occupancy in Young County
Occupancy by Ownership in Young County
Of the total 7,565 dwellings in Young County, owner-occupied units account for 5,573 (73.7%), while renter-occupied units make up 1,992 (26.3%).
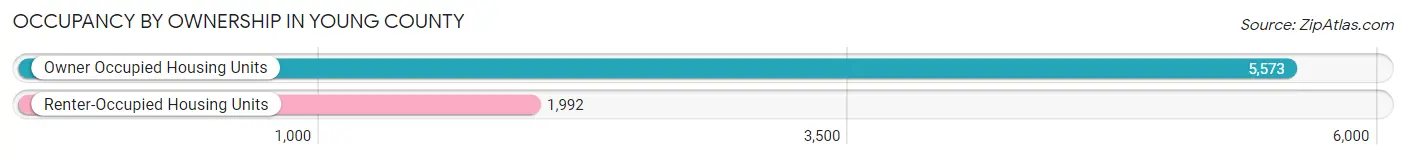
| Occupancy | # Housing Units | % Housing Units |
| Owner Occupied Housing Units | 5,573 | 73.7% |
| Renter-Occupied Housing Units | 1,992 | 26.3% |
| Total Occupied Housing Units | 7,565 | 100.0% |
Occupancy by Household Size in Young County
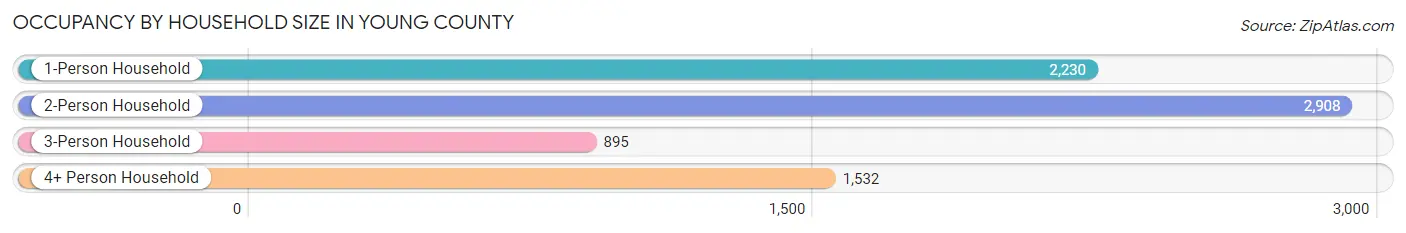
| Household Size | # Housing Units | % Housing Units |
| 1-Person Household | 2,230 | 29.5% |
| 2-Person Household | 2,908 | 38.4% |
| 3-Person Household | 895 | 11.8% |
| 4+ Person Household | 1,532 | 20.3% |
| Total Housing Units | 7,565 | 100.0% |
Occupancy by Ownership by Household Size in Young County
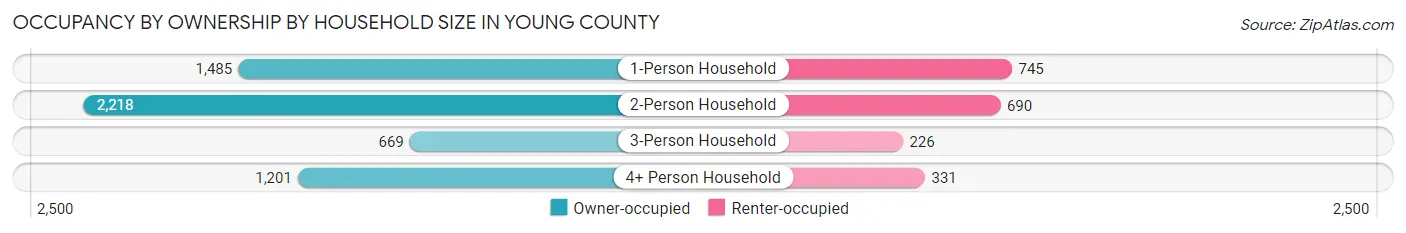
| Household Size | Owner-occupied | Renter-occupied |
| 1-Person Household | 1,485 (66.6%) | 745 (33.4%) |
| 2-Person Household | 2,218 (76.3%) | 690 (23.7%) |
| 3-Person Household | 669 (74.8%) | 226 (25.3%) |
| 4+ Person Household | 1,201 (78.4%) | 331 (21.6%) |
| Total Housing Units | 5,573 (73.7%) | 1,992 (26.3%) |
Occupancy by Educational Attainment in Young County
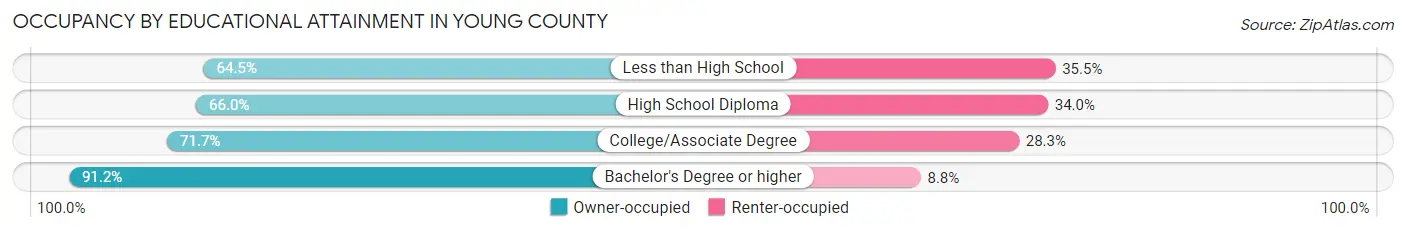
| Household Size | Owner-occupied | Renter-occupied |
| Less than High School | 396 (64.5%) | 218 (35.5%) |
| High School Diploma | 1,893 (66.0%) | 976 (34.0%) |
| College/Associate Degree | 1,616 (71.7%) | 637 (28.3%) |
| Bachelor's Degree or higher | 1,668 (91.2%) | 161 (8.8%) |
Occupancy by Age of Householder in Young County
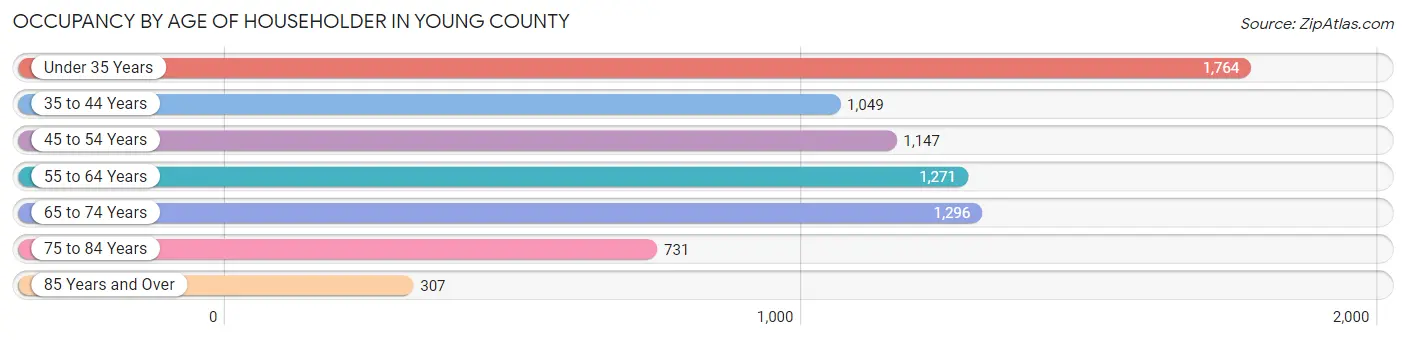
| Age Bracket | # Households | % Households |
| Under 35 Years | 1,764 | 23.3% |
| 35 to 44 Years | 1,049 | 13.9% |
| 45 to 54 Years | 1,147 | 15.2% |
| 55 to 64 Years | 1,271 | 16.8% |
| 65 to 74 Years | 1,296 | 17.1% |
| 75 to 84 Years | 731 | 9.7% |
| 85 Years and Over | 307 | 4.1% |
| Total | 7,565 | 100.0% |
Housing Finances in Young County
Median Income by Occupancy in Young County
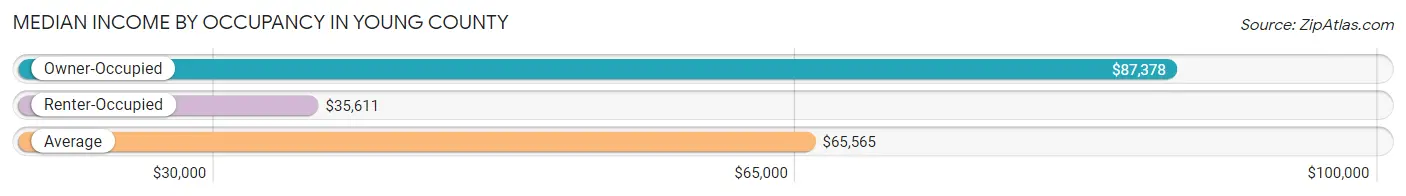
| Occupancy Type | # Households | Median Income |
| Owner-Occupied | 5,573 (73.7%) | $87,378 |
| Renter-Occupied | 1,992 (26.3%) | $35,611 |
| Average | 7,565 (100.0%) | $65,565 |
Occupancy by Householder Income Bracket in Young County
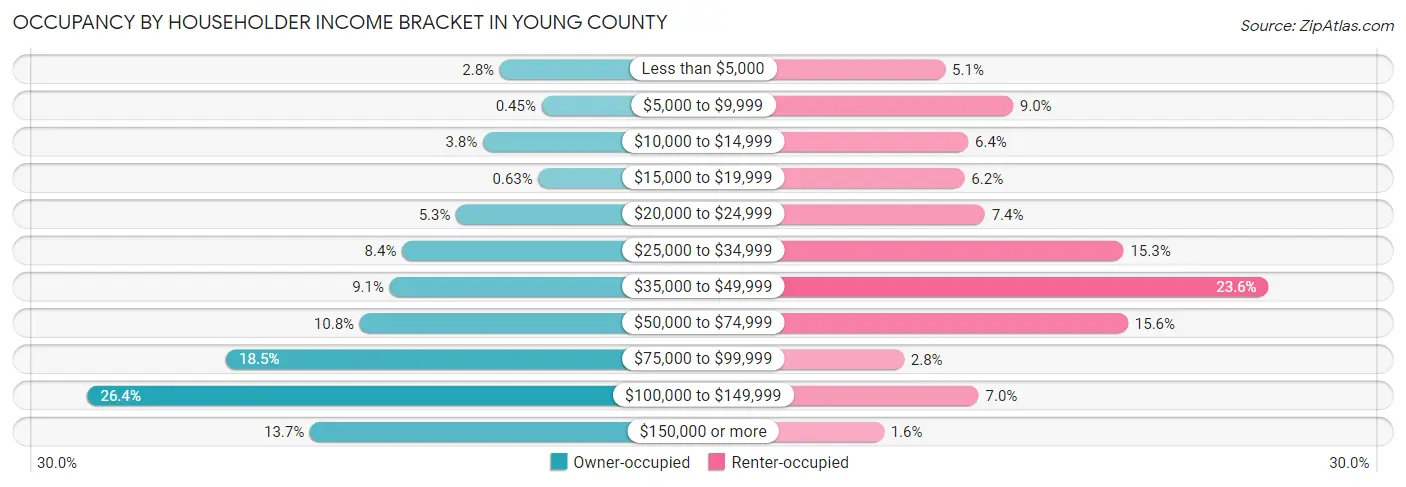
| Income Bracket | Owner-occupied | Renter-occupied |
| Less than $5,000 | 158 (2.8%) | 102 (5.1%) |
| $5,000 to $9,999 | 25 (0.4%) | 179 (9.0%) |
| $10,000 to $14,999 | 212 (3.8%) | 128 (6.4%) |
| $15,000 to $19,999 | 35 (0.6%) | 124 (6.2%) |
| $20,000 to $24,999 | 297 (5.3%) | 147 (7.4%) |
| $25,000 to $34,999 | 469 (8.4%) | 305 (15.3%) |
| $35,000 to $49,999 | 509 (9.1%) | 470 (23.6%) |
| $50,000 to $74,999 | 604 (10.8%) | 310 (15.6%) |
| $75,000 to $99,999 | 1,030 (18.5%) | 55 (2.8%) |
| $100,000 to $149,999 | 1,471 (26.4%) | 140 (7.0%) |
| $150,000 or more | 763 (13.7%) | 32 (1.6%) |
| Total | 5,573 (100.0%) | 1,992 (100.0%) |
Monthly Housing Cost Tiers in Young County
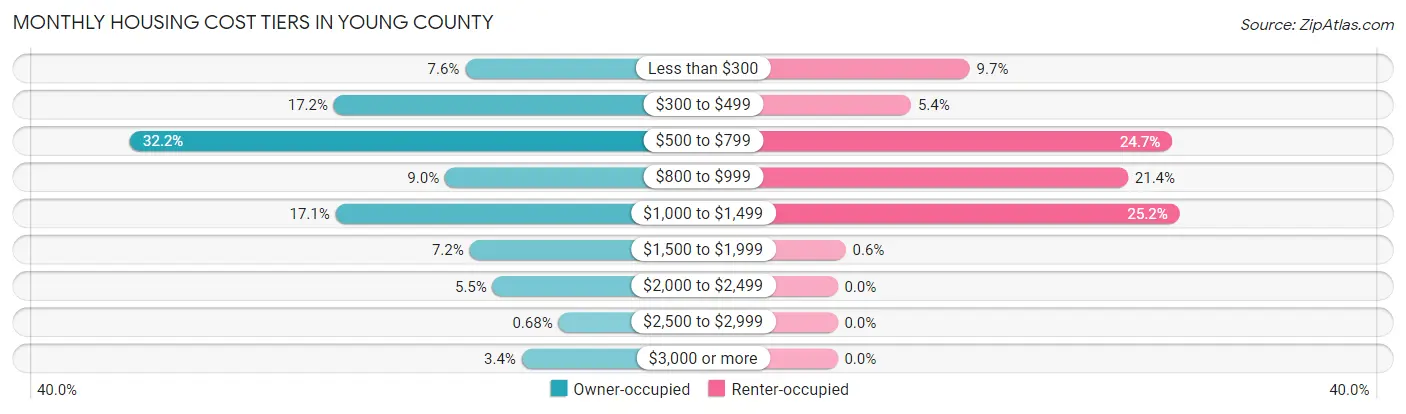
| Monthly Cost | Owner-occupied | Renter-occupied |
| Less than $300 | 421 (7.5%) | 194 (9.7%) |
| $300 to $499 | 960 (17.2%) | 108 (5.4%) |
| $500 to $799 | 1,797 (32.2%) | 491 (24.6%) |
| $800 to $999 | 504 (9.0%) | 426 (21.4%) |
| $1,000 to $1,499 | 953 (17.1%) | 502 (25.2%) |
| $1,500 to $1,999 | 403 (7.2%) | 12 (0.6%) |
| $2,000 to $2,499 | 308 (5.5%) | 0 (0.0%) |
| $2,500 to $2,999 | 38 (0.7%) | 0 (0.0%) |
| $3,000 or more | 189 (3.4%) | 0 (0.0%) |
| Total | 5,573 (100.0%) | 1,992 (100.0%) |
Physical Housing Characteristics in Young County
Housing Structures in Young County
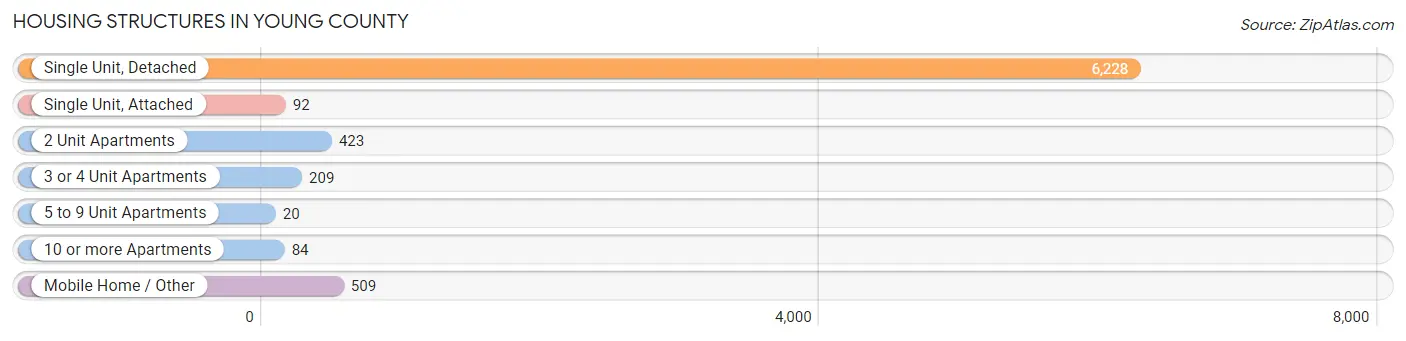
| Structure Type | # Housing Units | % Housing Units |
| Single Unit, Detached | 6,228 | 82.3% |
| Single Unit, Attached | 92 | 1.2% |
| 2 Unit Apartments | 423 | 5.6% |
| 3 or 4 Unit Apartments | 209 | 2.8% |
| 5 to 9 Unit Apartments | 20 | 0.3% |
| 10 or more Apartments | 84 | 1.1% |
| Mobile Home / Other | 509 | 6.7% |
| Total | 7,565 | 100.0% |
Housing Structures by Occupancy in Young County
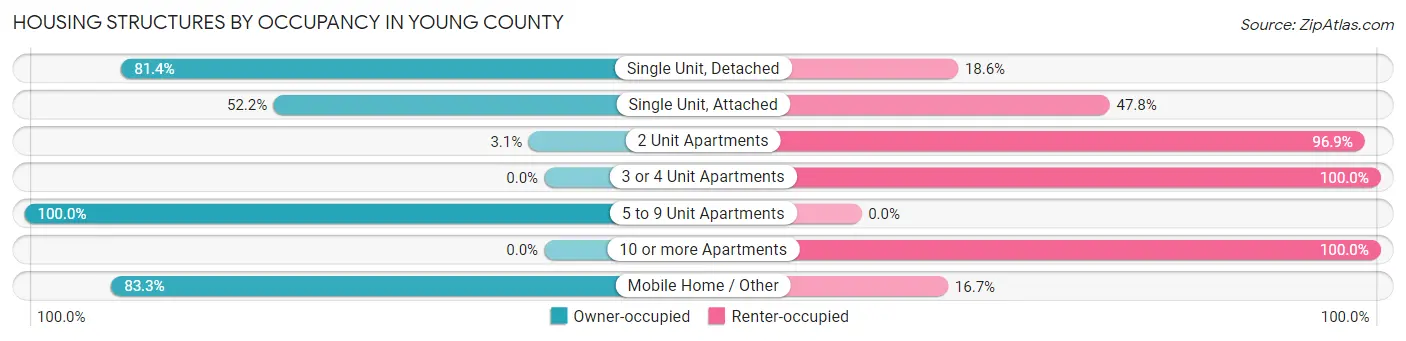
| Structure Type | Owner-occupied | Renter-occupied |
| Single Unit, Detached | 5,068 (81.4%) | 1,160 (18.6%) |
| Single Unit, Attached | 48 (52.2%) | 44 (47.8%) |
| 2 Unit Apartments | 13 (3.1%) | 410 (96.9%) |
| 3 or 4 Unit Apartments | 0 (0.0%) | 209 (100.0%) |
| 5 to 9 Unit Apartments | 20 (100.0%) | 0 (0.0%) |
| 10 or more Apartments | 0 (0.0%) | 84 (100.0%) |
| Mobile Home / Other | 424 (83.3%) | 85 (16.7%) |
| Total | 5,573 (73.7%) | 1,992 (26.3%) |
Housing Structures by Number of Rooms in Young County
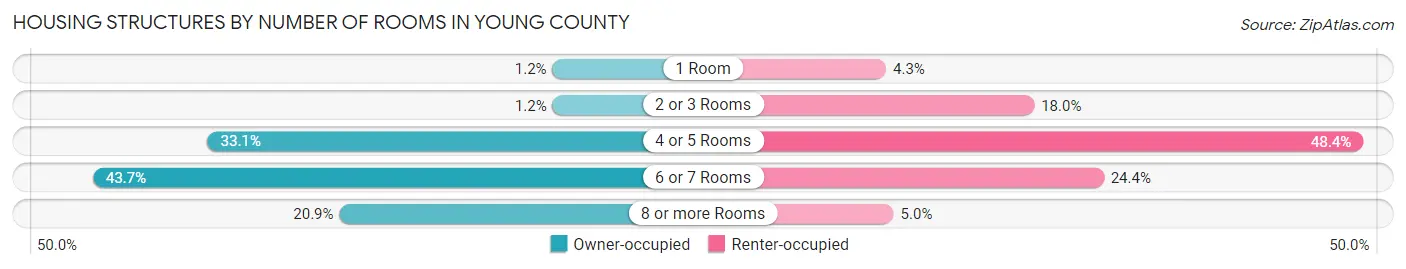
| Number of Rooms | Owner-occupied | Renter-occupied |
| 1 Room | 66 (1.2%) | 85 (4.3%) |
| 2 or 3 Rooms | 65 (1.2%) | 358 (18.0%) |
| 4 or 5 Rooms | 1,843 (33.1%) | 964 (48.4%) |
| 6 or 7 Rooms | 2,435 (43.7%) | 486 (24.4%) |
| 8 or more Rooms | 1,164 (20.9%) | 99 (5.0%) |
| Total | 5,573 (100.0%) | 1,992 (100.0%) |
Housing Structure by Heating Type in Young County
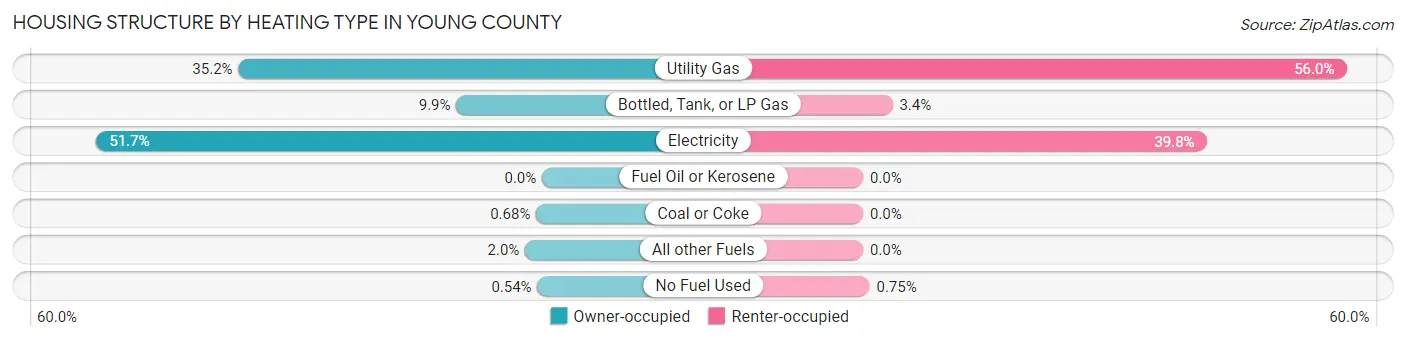
| Heating Type | Owner-occupied | Renter-occupied |
| Utility Gas | 1,962 (35.2%) | 1,116 (56.0%) |
| Bottled, Tank, or LP Gas | 554 (9.9%) | 68 (3.4%) |
| Electricity | 2,880 (51.7%) | 793 (39.8%) |
| Fuel Oil or Kerosene | 0 (0.0%) | 0 (0.0%) |
| Coal or Coke | 38 (0.7%) | 0 (0.0%) |
| All other Fuels | 109 (2.0%) | 0 (0.0%) |
| No Fuel Used | 30 (0.5%) | 15 (0.7%) |
| Total | 5,573 (100.0%) | 1,992 (100.0%) |
Household Vehicle Usage in Young County
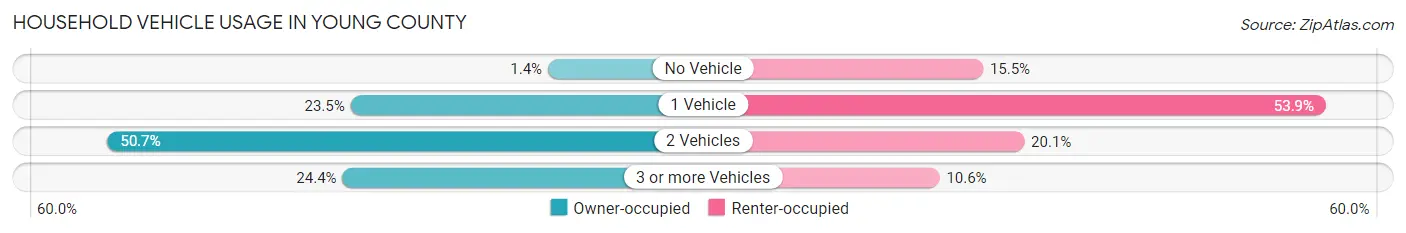
| Vehicles per Household | Owner-occupied | Renter-occupied |
| No Vehicle | 77 (1.4%) | 308 (15.5%) |
| 1 Vehicle | 1,309 (23.5%) | 1,073 (53.9%) |
| 2 Vehicles | 2,827 (50.7%) | 400 (20.1%) |
| 3 or more Vehicles | 1,360 (24.4%) | 211 (10.6%) |
| Total | 5,573 (100.0%) | 1,992 (100.0%) |
Real Estate & Mortgages in Young County
Real Estate and Mortgage Overview in Young County
| Characteristic | Without Mortgage | With Mortgage |
| Housing Units | 3,469 | 2,104 |
| Median Property Value | $135,400 | $162,600 |
| Median Household Income | $83,987 | $455 |
| Monthly Housing Costs | $561 | $189 |
| Real Estate Taxes | $1,787 | $77 |
Property Value by Mortgage Status in Young County
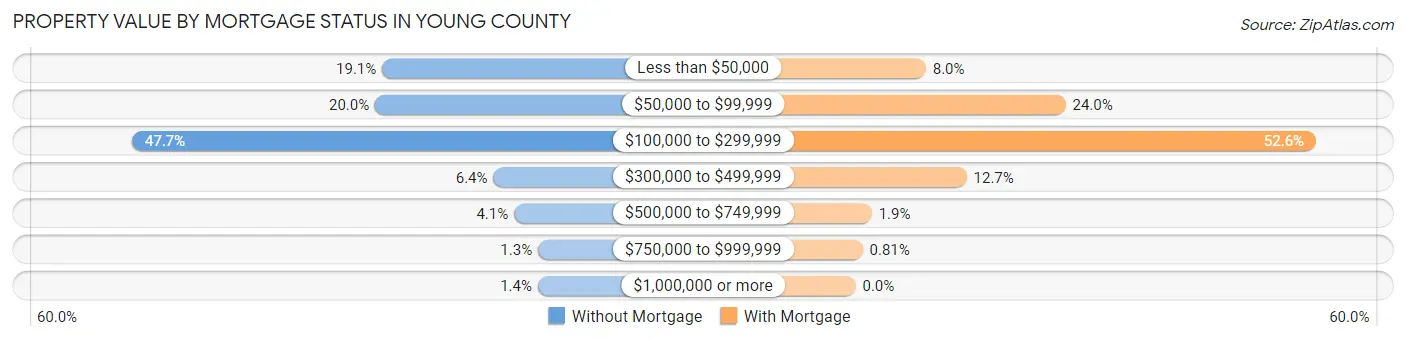
| Property Value | Without Mortgage | With Mortgage |
| Less than $50,000 | 664 (19.1%) | 169 (8.0%) |
| $50,000 to $99,999 | 692 (20.0%) | 505 (24.0%) |
| $100,000 to $299,999 | 1,656 (47.7%) | 1,107 (52.6%) |
| $300,000 to $499,999 | 223 (6.4%) | 267 (12.7%) |
| $500,000 to $749,999 | 141 (4.1%) | 39 (1.8%) |
| $750,000 to $999,999 | 46 (1.3%) | 17 (0.8%) |
| $1,000,000 or more | 47 (1.3%) | 0 (0.0%) |
| Total | 3,469 (100.0%) | 2,104 (100.0%) |
Household Income by Mortgage Status in Young County
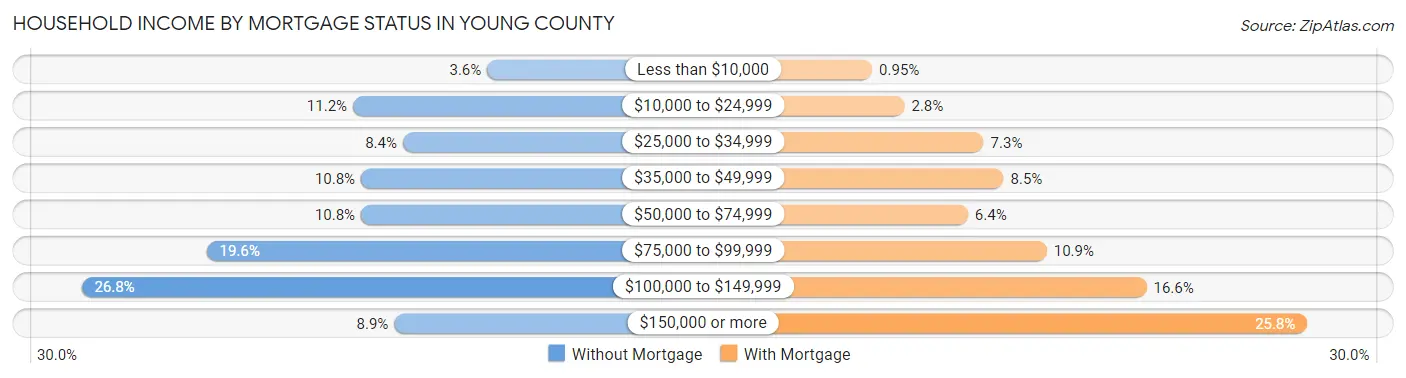
| Household Income | Without Mortgage | With Mortgage |
| Less than $10,000 | 124 (3.6%) | 20 (0.9%) |
| $10,000 to $24,999 | 390 (11.2%) | 59 (2.8%) |
| $25,000 to $34,999 | 291 (8.4%) | 154 (7.3%) |
| $35,000 to $49,999 | 374 (10.8%) | 178 (8.5%) |
| $50,000 to $74,999 | 374 (10.8%) | 135 (6.4%) |
| $75,000 to $99,999 | 680 (19.6%) | 230 (10.9%) |
| $100,000 to $149,999 | 928 (26.8%) | 350 (16.6%) |
| $150,000 or more | 308 (8.9%) | 543 (25.8%) |
| Total | 3,469 (100.0%) | 2,104 (100.0%) |
Property Value to Household Income Ratio in Young County
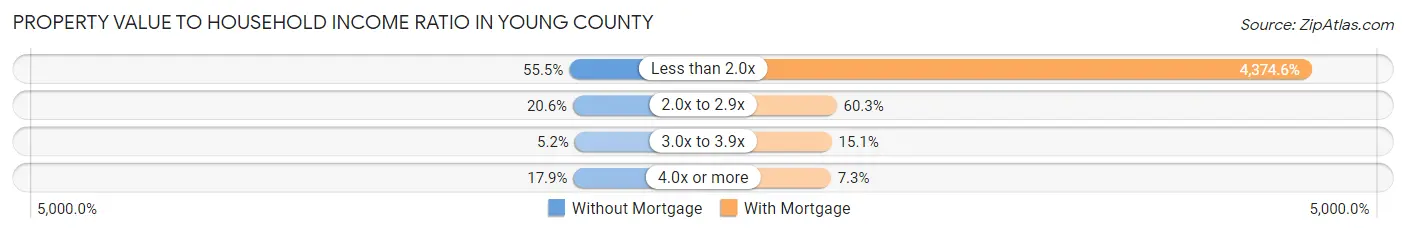
| Value-to-Income Ratio | Without Mortgage | With Mortgage |
| Less than 2.0x | 1,924 (55.5%) | 92,042 (4,374.6%) |
| 2.0x to 2.9x | 714 (20.6%) | 1,269 (60.3%) |
| 3.0x to 3.9x | 181 (5.2%) | 318 (15.1%) |
| 4.0x or more | 621 (17.9%) | 153 (7.3%) |
| Total | 3,469 (100.0%) | 2,104 (100.0%) |
Real Estate Taxes by Mortgage Status in Young County
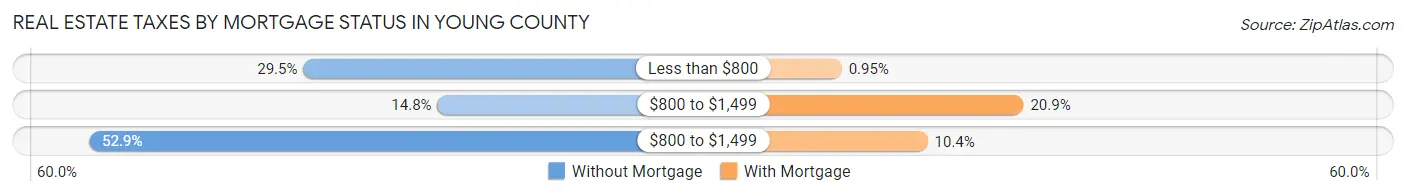
| Property Taxes | Without Mortgage | With Mortgage |
| Less than $800 | 1,022 (29.5%) | 20 (0.9%) |
| $800 to $1,499 | 512 (14.8%) | 439 (20.9%) |
| $800 to $1,499 | 1,836 (52.9%) | 218 (10.4%) |
| Total | 3,469 (100.0%) | 2,104 (100.0%) |
Health & Disability in Young County
Health Insurance Coverage by Age in Young County
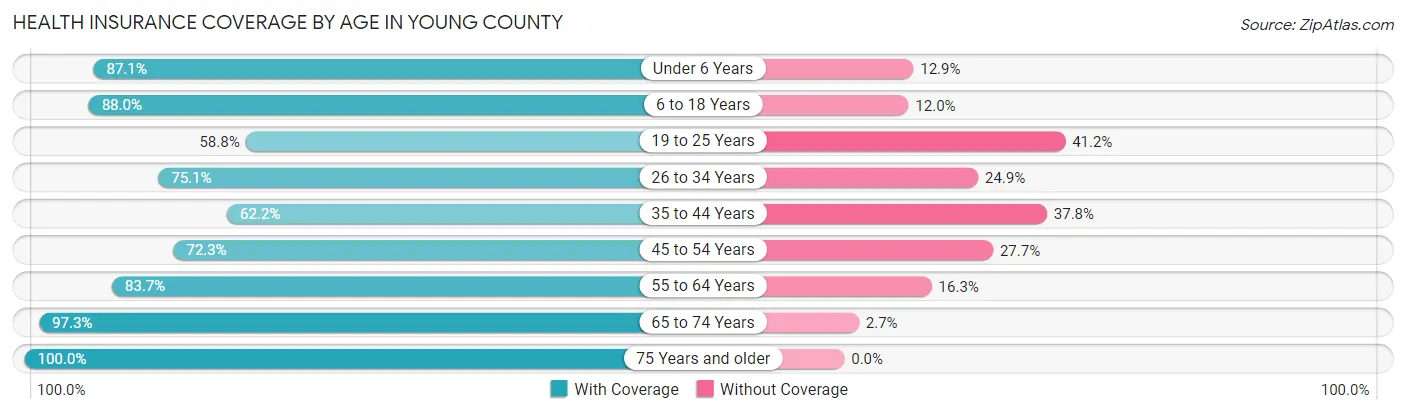
| Age Bracket | With Coverage | Without Coverage |
| Under 6 Years | 1,036 (87.1%) | 153 (12.9%) |
| 6 to 18 Years | 2,819 (88.0%) | 383 (12.0%) |
| 19 to 25 Years | 744 (58.8%) | 521 (41.2%) |
| 26 to 34 Years | 1,496 (75.1%) | 497 (24.9%) |
| 35 to 44 Years | 1,259 (62.2%) | 764 (37.8%) |
| 45 to 54 Years | 1,522 (72.3%) | 584 (27.7%) |
| 55 to 64 Years | 1,917 (83.7%) | 373 (16.3%) |
| 65 to 74 Years | 2,076 (97.3%) | 58 (2.7%) |
| 75 Years and older | 1,432 (100.0%) | 0 (0.0%) |
| Total | 14,301 (81.1%) | 3,333 (18.9%) |
Health Insurance Coverage by Citizenship Status in Young County
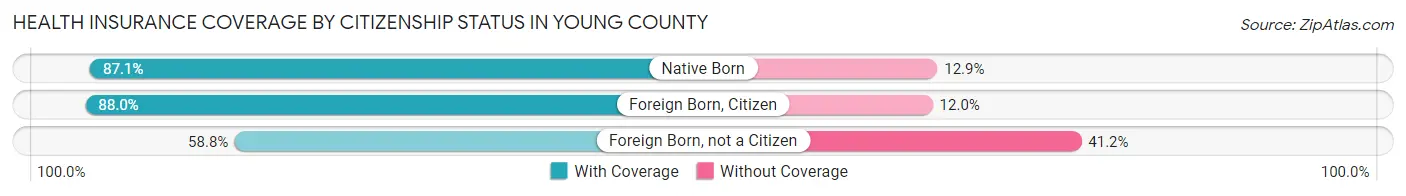
| Citizenship Status | With Coverage | Without Coverage |
| Native Born | 1,036 (87.1%) | 153 (12.9%) |
| Foreign Born, Citizen | 2,819 (88.0%) | 383 (12.0%) |
| Foreign Born, not a Citizen | 744 (58.8%) | 521 (41.2%) |
Health Insurance Coverage by Household Income in Young County
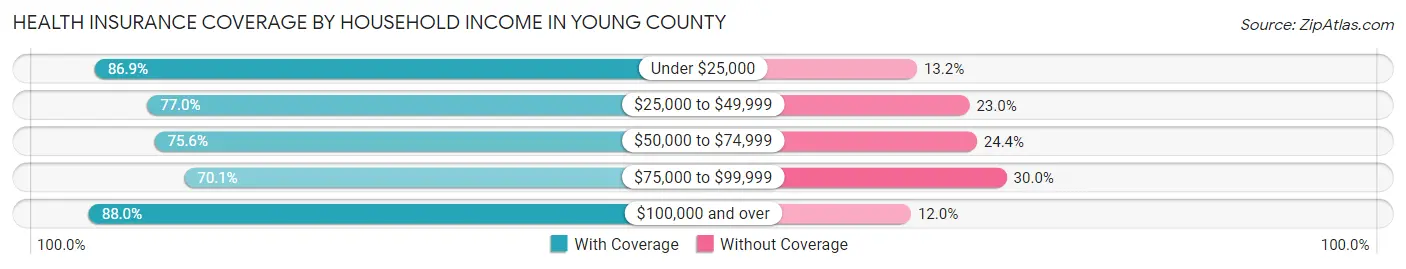
| Household Income | With Coverage | Without Coverage |
| Under $25,000 | 2,008 (86.9%) | 304 (13.2%) |
| $25,000 to $49,999 | 2,988 (77.0%) | 892 (23.0%) |
| $50,000 to $74,999 | 1,722 (75.6%) | 555 (24.4%) |
| $75,000 to $99,999 | 1,857 (70.1%) | 794 (29.9%) |
| $100,000 and over | 5,726 (88.0%) | 783 (12.0%) |
Public vs Private Health Insurance Coverage by Age in Young County
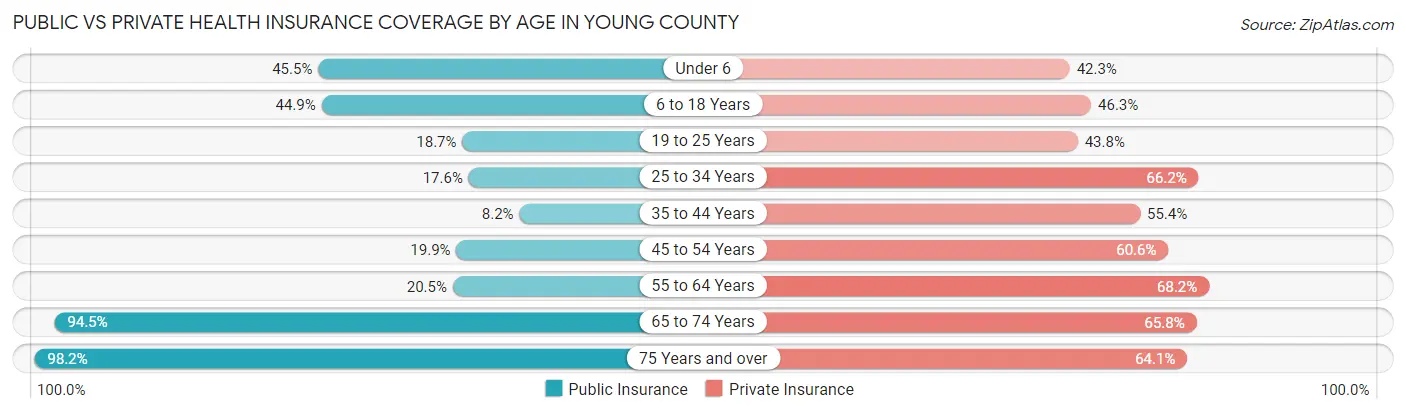
| Age Bracket | Public Insurance | Private Insurance |
| Under 6 | 541 (45.5%) | 503 (42.3%) |
| 6 to 18 Years | 1,437 (44.9%) | 1,482 (46.3%) |
| 19 to 25 Years | 237 (18.7%) | 554 (43.8%) |
| 25 to 34 Years | 350 (17.6%) | 1,320 (66.2%) |
| 35 to 44 Years | 165 (8.2%) | 1,120 (55.4%) |
| 45 to 54 Years | 418 (19.9%) | 1,276 (60.6%) |
| 55 to 64 Years | 470 (20.5%) | 1,561 (68.2%) |
| 65 to 74 Years | 2,016 (94.5%) | 1,405 (65.8%) |
| 75 Years and over | 1,406 (98.2%) | 918 (64.1%) |
| Total | 7,040 (39.9%) | 10,139 (57.5%) |
Disability Status by Sex by Age in Young County
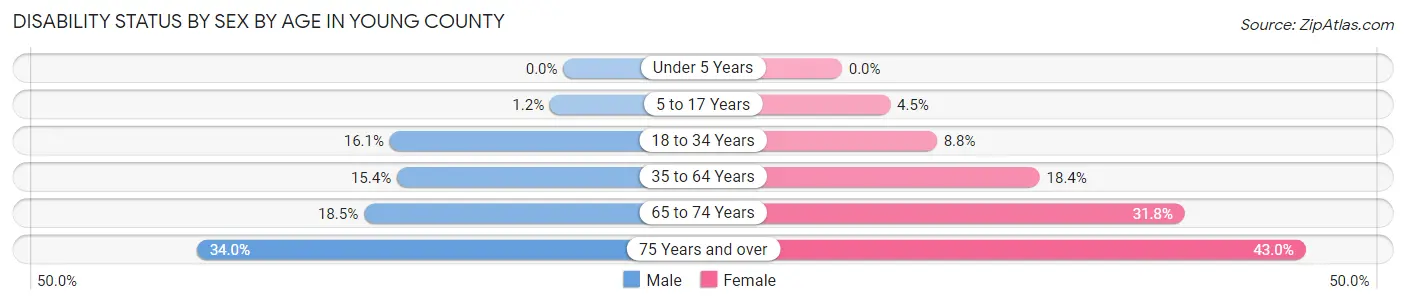
| Age Bracket | Male | Female |
| Under 5 Years | 0 (0.0%) | 0 (0.0%) |
| 5 to 17 Years | 19 (1.2%) | 79 (4.5%) |
| 18 to 34 Years | 282 (16.1%) | 143 (8.8%) |
| 35 to 64 Years | 500 (15.4%) | 584 (18.4%) |
| 65 to 74 Years | 182 (18.5%) | 366 (31.8%) |
| 75 Years and over | 231 (34.0%) | 324 (43.0%) |
Disability Class by Sex by Age in Young County
Disability Class: Hearing Difficulty
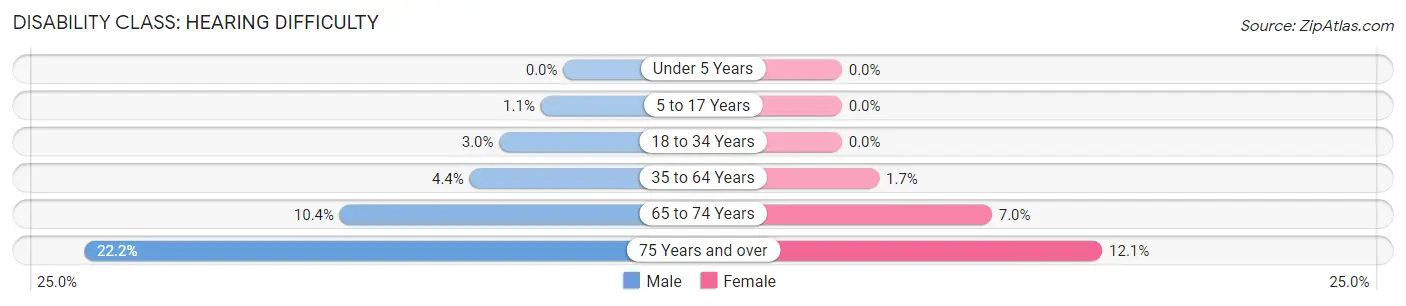
| Age Bracket | Male | Female |
| Under 5 Years | 0 (0.0%) | 0 (0.0%) |
| 5 to 17 Years | 16 (1.1%) | 0 (0.0%) |
| 18 to 34 Years | 52 (3.0%) | 0 (0.0%) |
| 35 to 64 Years | 141 (4.3%) | 55 (1.7%) |
| 65 to 74 Years | 102 (10.4%) | 80 (7.0%) |
| 75 Years and over | 151 (22.2%) | 91 (12.1%) |
Disability Class: Vision Difficulty
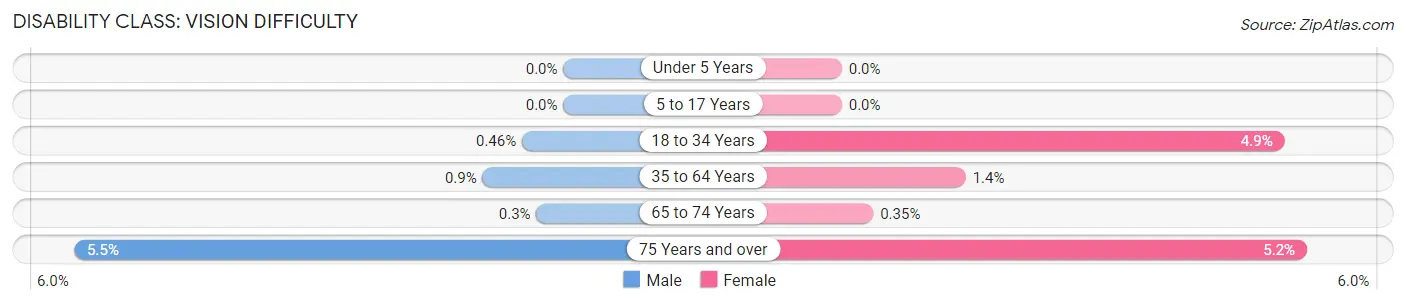
| Age Bracket | Male | Female |
| Under 5 Years | 0 (0.0%) | 0 (0.0%) |
| 5 to 17 Years | 0 (0.0%) | 0 (0.0%) |
| 18 to 34 Years | 8 (0.5%) | 80 (4.9%) |
| 35 to 64 Years | 29 (0.9%) | 44 (1.4%) |
| 65 to 74 Years | 3 (0.3%) | 4 (0.4%) |
| 75 Years and over | 37 (5.4%) | 39 (5.2%) |
Disability Class: Cognitive Difficulty
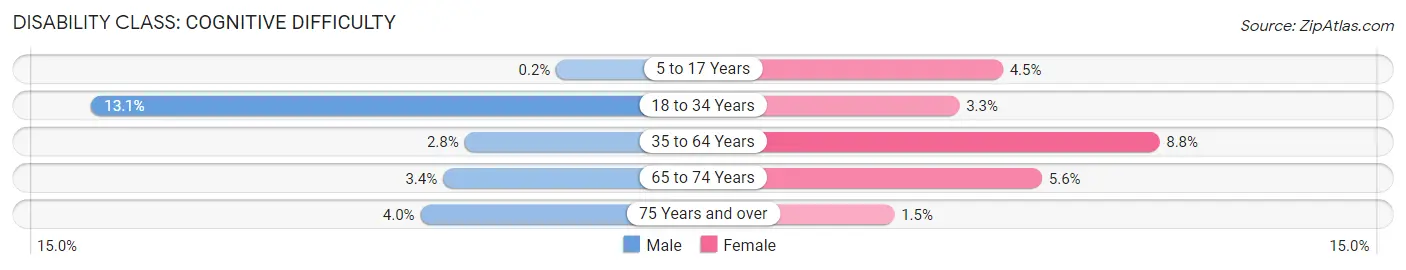
| Age Bracket | Male | Female |
| 5 to 17 Years | 3 (0.2%) | 79 (4.5%) |
| 18 to 34 Years | 230 (13.1%) | 53 (3.3%) |
| 35 to 64 Years | 89 (2.8%) | 281 (8.8%) |
| 65 to 74 Years | 33 (3.4%) | 64 (5.6%) |
| 75 Years and over | 27 (4.0%) | 11 (1.5%) |
Disability Class: Ambulatory Difficulty
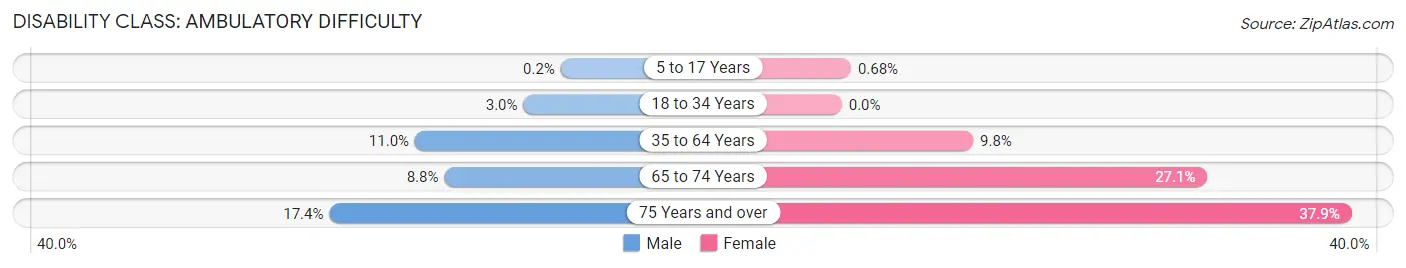
| Age Bracket | Male | Female |
| 5 to 17 Years | 3 (0.2%) | 12 (0.7%) |
| 18 to 34 Years | 52 (3.0%) | 0 (0.0%) |
| 35 to 64 Years | 357 (11.0%) | 310 (9.8%) |
| 65 to 74 Years | 87 (8.8%) | 312 (27.1%) |
| 75 Years and over | 118 (17.4%) | 285 (37.9%) |
Disability Class: Self-Care Difficulty
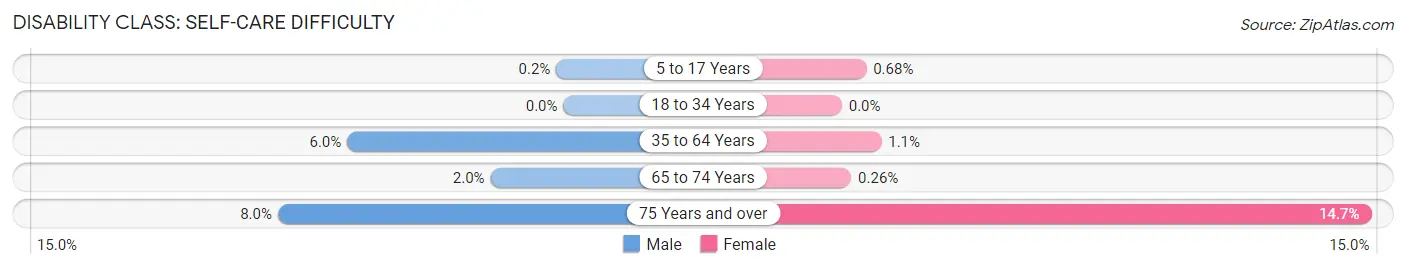
| Age Bracket | Male | Female |
| 5 to 17 Years | 3 (0.2%) | 12 (0.7%) |
| 18 to 34 Years | 0 (0.0%) | 0 (0.0%) |
| 35 to 64 Years | 195 (6.0%) | 35 (1.1%) |
| 65 to 74 Years | 20 (2.0%) | 3 (0.3%) |
| 75 Years and over | 54 (8.0%) | 111 (14.7%) |
Technology Access in Young County
Computing Device Access in Young County
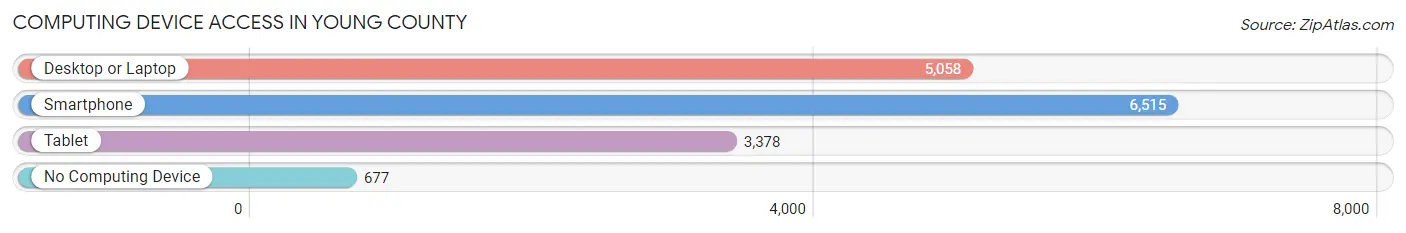
| Device Type | # Households | % Households |
| Desktop or Laptop | 5,058 | 66.9% |
| Smartphone | 6,515 | 86.1% |
| Tablet | 3,378 | 44.7% |
| No Computing Device | 677 | 8.9% |
| Total | 7,565 | 100.0% |
Internet Access in Young County
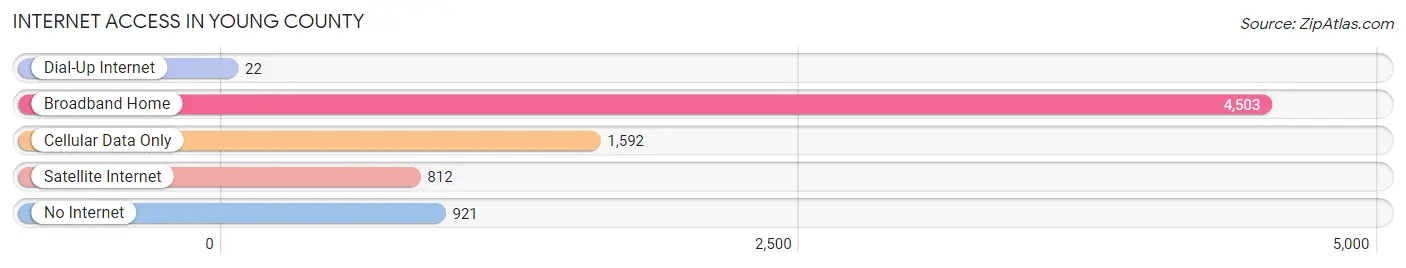
| Internet Type | # Households | % Households |
| Dial-Up Internet | 22 | 0.3% |
| Broadband Home | 4,503 | 59.5% |
| Cellular Data Only | 1,592 | 21.0% |
| Satellite Internet | 812 | 10.7% |
| No Internet | 921 | 12.2% |
| Total | 7,565 | 100.0% |
Young County Summary
Young County is located in north-central Texas, and is part of the Wichita Falls metropolitan area. It is bordered by Archer, Clay, Jack, Montague, Stephens, and Throckmorton counties. The county seat is Graham, and the largest city is Olney. As of the 2010 census, the population was 18,550.
History
Young County was established in 1856 and named for William Cocke Young, a soldier in the Texas Revolution. The county was originally part of Fannin County, and was organized in 1876. The first county seat was located in Belknap, but was moved to Graham in 1879.
Geography
Young County covers an area of 902 square miles, of which 899 square miles is land and 3 square miles is water. The county is located in the Rolling Plains region of Texas, and is mostly flat with some rolling hills. The Brazos River runs through the county, and there are several small lakes and reservoirs.
The climate is semi-arid, with hot summers and mild winters. The average annual temperature is 64°F, and the average annual precipitation is 22 inches.
Economy
The economy of Young County is largely based on agriculture and oil and gas production. The county is home to several large ranches, and the main crops are cotton, wheat, and sorghum. Oil and gas production is also a major industry, and there are several large oil and gas fields in the county.
The county also has a growing tourism industry, with several attractions such as the Graham Historic District, the Graham County Museum, and the Graham County Fair.
Demographics
As of the 2010 census, there were 18,550 people, 6,945 households, and 4,845 families living in the county. The population density was 20.5 people per square mile. The racial makeup of the county was 81.3% White, 11.3% Hispanic or Latino, 7.2% Black or African American, 0.7% Native American, 0.2% Asian, and 0.2% Pacific Islander.
The median income for a household in the county was $35,945, and the median income for a family was $43,945. The per capita income for the county was $17,945. About 16.2% of the population was below the poverty line.
The largest cities in Young County are Graham (population: 8,743), Olney (population: 3,717), and Newcastle (population: 1,845). The county is served by the Graham Independent School District.
Common Questions
What is Per Capita Income in Young County?
Per Capita income in Young County is $35,039.
What is the Median Family Income in Young County?
Median Family Income in Young County is $88,069.
What is the Median Household income in Young County?
Median Household Income in Young County is $65,565.
What is Income or Wage Gap in Young County?
Income or Wage Gap in Young County is 48.5%.
Women in Young County earn 51.5 cents for every dollar earned by a man.
What is Inequality or Gini Index in Young County?
Inequality or Gini Index in Young County is 0.45.
What is the Total Population of Young County?
Total Population of Young County is 17,903.
What is the Total Male Population of Young County?
Total Male Population of Young County is 8,822.
What is the Total Female Population of Young County?
Total Female Population of Young County is 9,081.
What is the Ratio of Males per 100 Females in Young County?
There are 97.15 Males per 100 Females in Young County.
What is the Ratio of Females per 100 Males in Young County?
There are 102.94 Females per 100 Males in Young County.
What is the Median Population Age in Young County?
Median Population Age in Young County is 40.3 Years.
What is the Average Family Size in Young County
Average Family Size in Young County is 2.9 People.
What is the Average Household Size in Young County
Average Household Size in Young County is 2.3 People.
How Large is the Labor Force in Young County?
There are 8,444 People in the Labor Forcein in Young County.
What is the Percentage of People in the Labor Force in Young County?
59.6% of People are in the Labor Force in Young County.
What is the Unemployment Rate in Young County?
Unemployment Rate in Young County is 2.6%.