Willacy County, TX Map & Demographics
Willacy County Map
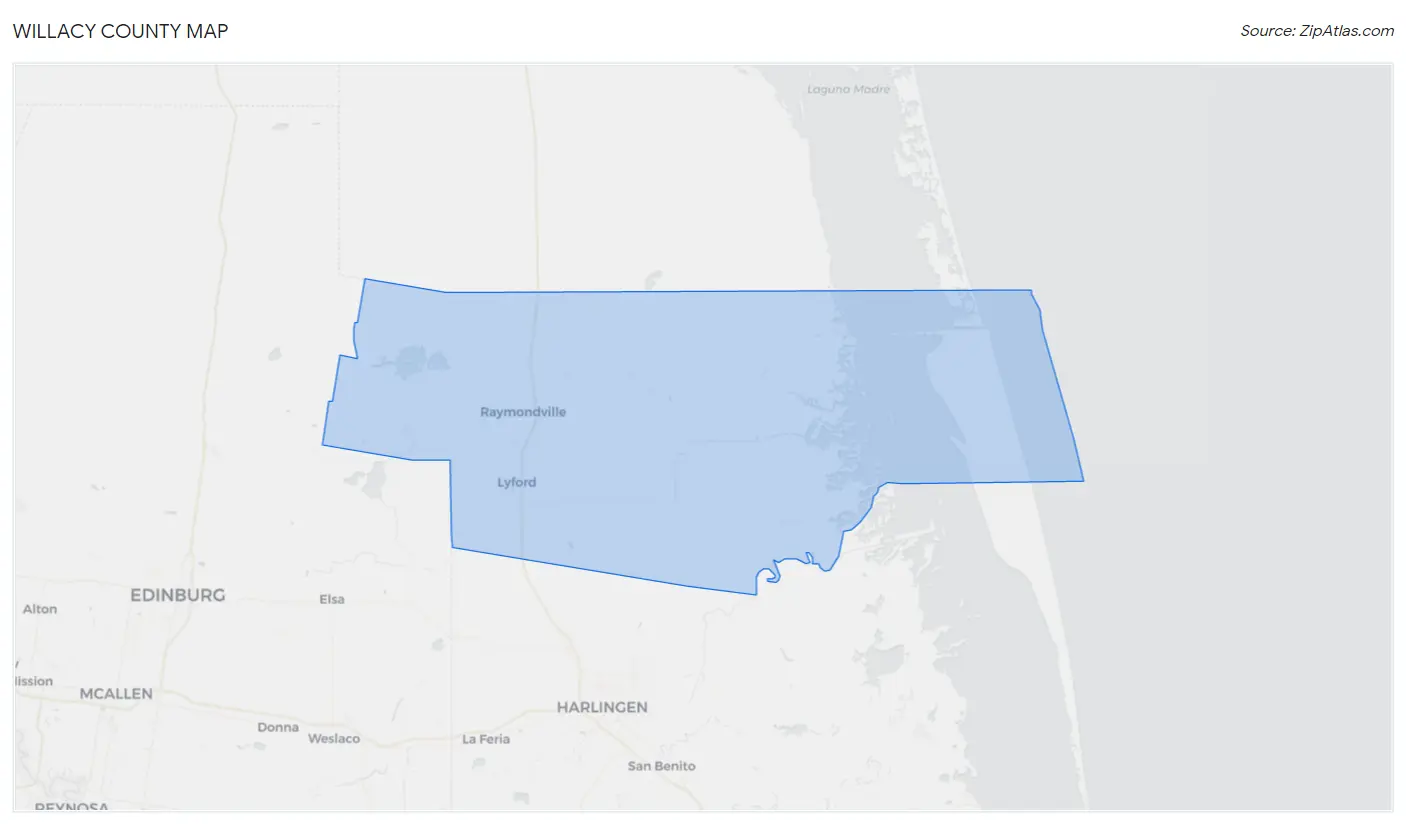
Willacy County Overview
$20,229
PER CAPITA INCOME
$50,023
AVG FAMILY INCOME
$42,839
AVG HOUSEHOLD INCOME
40.6%
WAGE / INCOME GAP [ % ]
59.4¢/ $1
WAGE / INCOME GAP [ $ ]
$10,411
FAMILY INCOME DEFICIT
0.47
INEQUALITY / GINI INDEX
20,308
TOTAL POPULATION
11,047
MALE POPULATION
9,261
FEMALE POPULATION
119.29
MALES / 100 FEMALES
83.83
FEMALES / 100 MALES
33.7
MEDIAN AGE
4.2
AVG FAMILY SIZE
3.5
AVG HOUSEHOLD SIZE
8,793
LABOR FORCE [ PEOPLE ]
55.3%
PERCENT IN LABOR FORCE
8.7%
UNEMPLOYMENT RATE
Willacy County Area Codes
Income in Willacy County
Income Overview in Willacy County
Per Capita Income in Willacy County is $20,229, while median incomes of families and households are $50,023 and $42,839 respectively.
| Characteristic | Number | Measure |
| Per Capita Income | 20,308 | $20,229 |
| Median Family Income | 3,971 | $50,023 |
| Mean Family Income | 3,971 | $66,119 |
| Median Household Income | 5,414 | $42,839 |
| Mean Household Income | 5,414 | $59,226 |
| Income Deficit | 3,971 | $10,411 |
| Wage / Income Gap (%) | 20,308 | 40.64% |
| Wage / Income Gap ($) | 20,308 | 59.36¢ per $1 |
| Gini / Inequality Index | 20,308 | 0.47 |
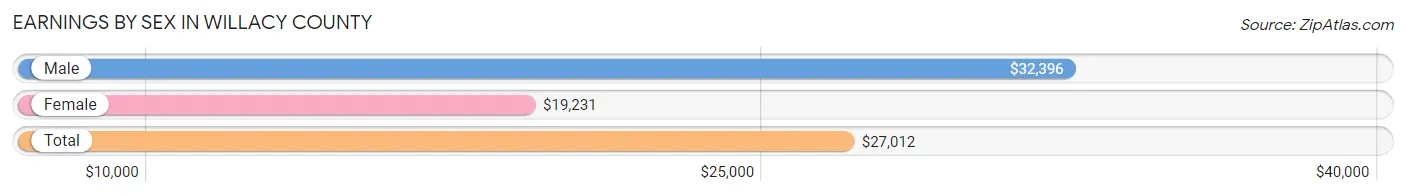
Earnings by Sex in Willacy County
Average Earnings in Willacy County are $27,012, $32,396 for men and $19,231 for women, a difference of 40.6%.
| Sex | Number | Average Earnings |
| Male | 5,475 (60.8%) | $32,396 |
| Female | 3,531 (39.2%) | $19,231 |
| Total | 9,006 (100.0%) | $27,012 |
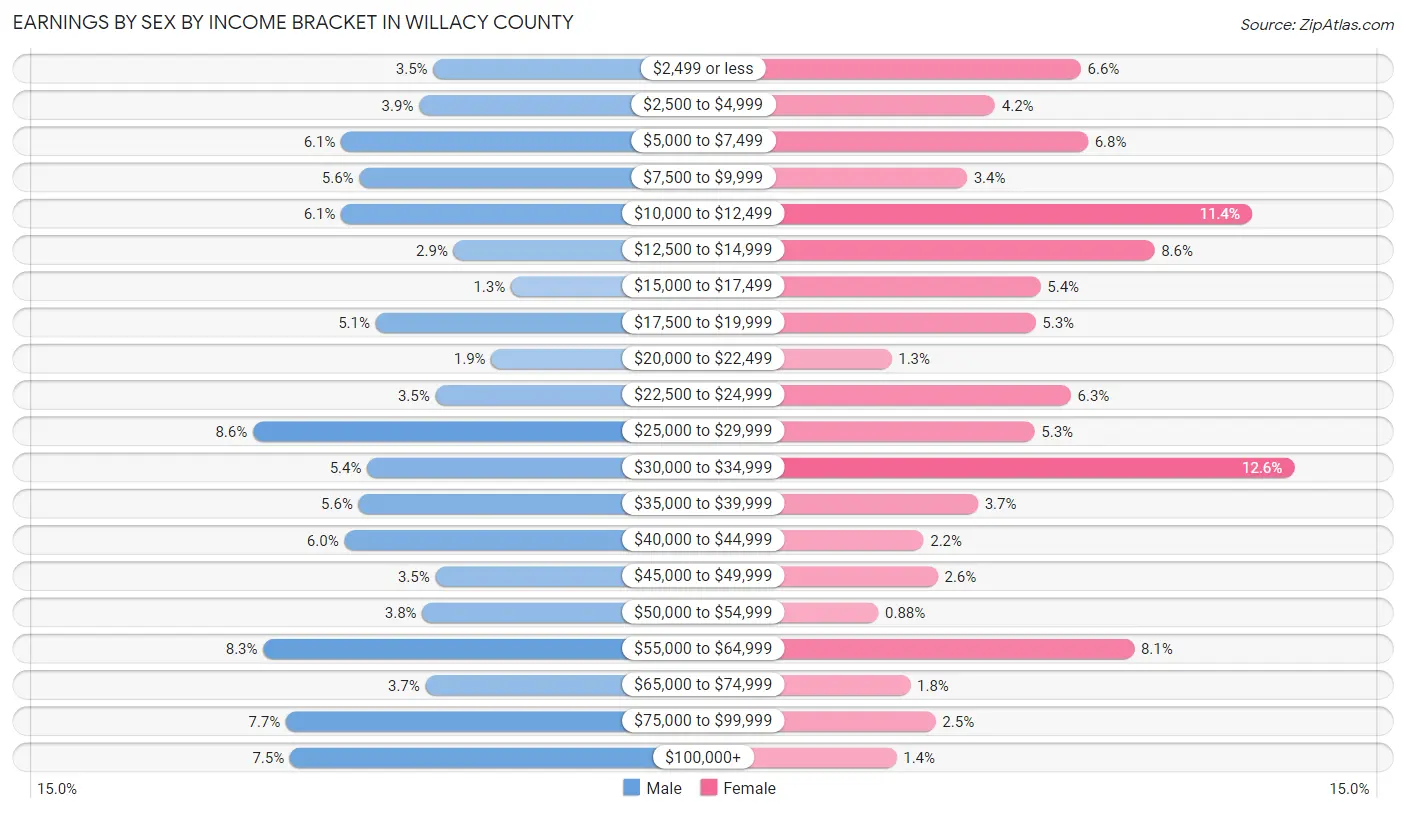
Earnings by Sex by Income Bracket in Willacy County
The most common earnings brackets in Willacy County are $25,000 to $29,999 for men (470 | 8.6%) and $30,000 to $34,999 for women (444 | 12.6%).
| Income | Male | Female |
| $2,499 or less | 192 (3.5%) | 232 (6.6%) |
| $2,500 to $4,999 | 214 (3.9%) | 147 (4.2%) |
| $5,000 to $7,499 | 334 (6.1%) | 239 (6.8%) |
| $7,500 to $9,999 | 306 (5.6%) | 119 (3.4%) |
| $10,000 to $12,499 | 334 (6.1%) | 402 (11.4%) |
| $12,500 to $14,999 | 161 (2.9%) | 305 (8.6%) |
| $15,000 to $17,499 | 73 (1.3%) | 192 (5.4%) |
| $17,500 to $19,999 | 281 (5.1%) | 187 (5.3%) |
| $20,000 to $22,499 | 103 (1.9%) | 44 (1.3%) |
| $22,500 to $24,999 | 189 (3.5%) | 222 (6.3%) |
| $25,000 to $29,999 | 470 (8.6%) | 186 (5.3%) |
| $30,000 to $34,999 | 294 (5.4%) | 444 (12.6%) |
| $35,000 to $39,999 | 307 (5.6%) | 130 (3.7%) |
| $40,000 to $44,999 | 329 (6.0%) | 76 (2.1%) |
| $45,000 to $49,999 | 189 (3.5%) | 90 (2.5%) |
| $50,000 to $54,999 | 209 (3.8%) | 31 (0.9%) |
| $55,000 to $64,999 | 454 (8.3%) | 285 (8.1%) |
| $65,000 to $74,999 | 204 (3.7%) | 63 (1.8%) |
| $75,000 to $99,999 | 419 (7.6%) | 88 (2.5%) |
| $100,000+ | 413 (7.5%) | 49 (1.4%) |
| Total | 5,475 (100.0%) | 3,531 (100.0%) |
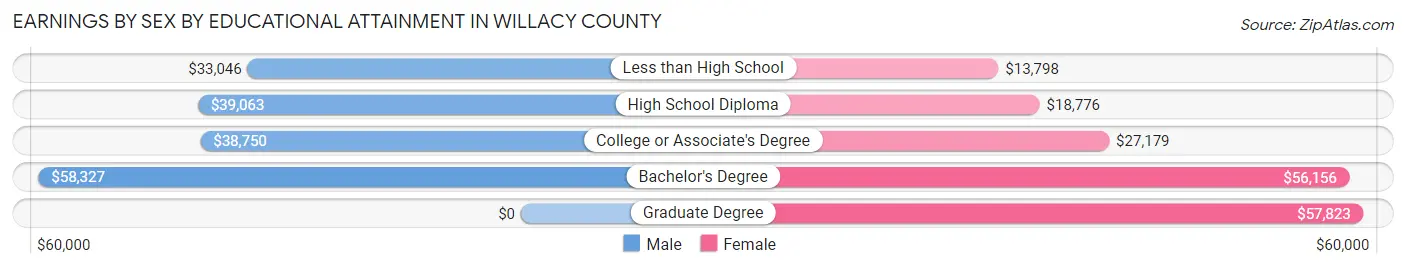
Earnings by Sex by Educational Attainment in Willacy County
Average earnings in Willacy County are $38,465 for men and $24,240 for women, a difference of 37.0%. Men with an educational attainment of bachelor's degree enjoy the highest average annual earnings of $58,327, while those with less than high school education earn the least with $33,046. Women with an educational attainment of graduate degree earn the most with the average annual earnings of $57,823, while those with less than high school education have the smallest earnings of $13,798.
| Educational Attainment | Male Income | Female Income |
| Less than High School | $33,046 | $13,798 |
| High School Diploma | $39,063 | $18,776 |
| College or Associate's Degree | $38,750 | $27,179 |
| Bachelor's Degree | $58,327 | $56,156 |
| Graduate Degree | - | - |
| Total | $38,465 | $24,240 |
Family Income in Willacy County
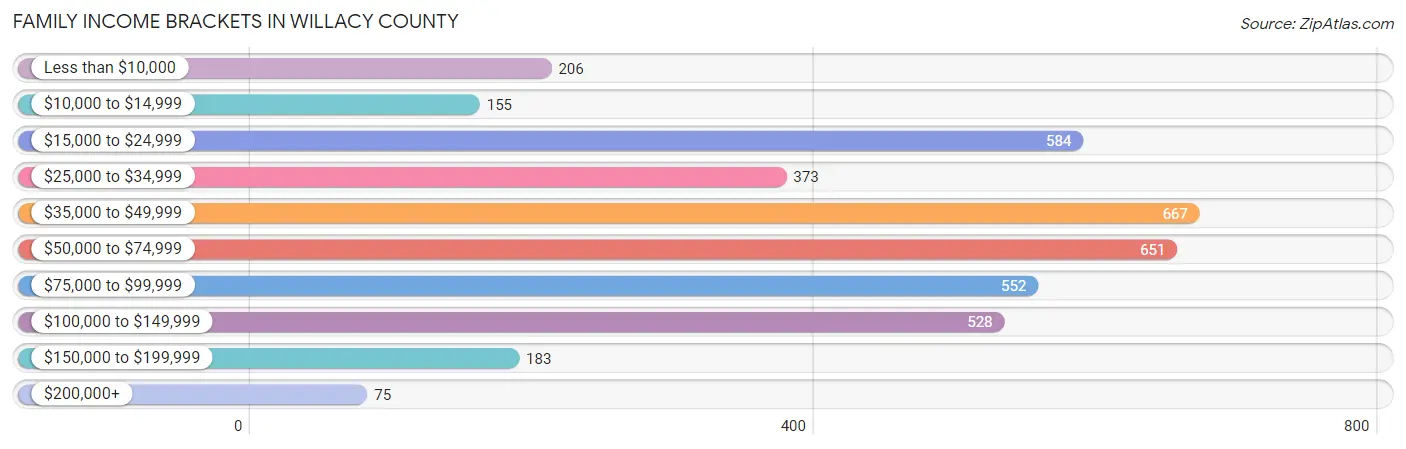
Family Income Brackets in Willacy County
According to the Willacy County family income data, there are 667 families falling into the $35,000 to $49,999 income range, which is the most common income bracket and makes up 16.8% of all families. Conversely, the $200,000+ income bracket is the least frequent group with only 75 families (1.9%) belonging to this category.
| Income Bracket | # Families | % Families |
| Less than $10,000 | 206 | 5.2% |
| $10,000 to $14,999 | 155 | 3.9% |
| $15,000 to $24,999 | 584 | 14.7% |
| $25,000 to $34,999 | 373 | 9.4% |
| $35,000 to $49,999 | 667 | 16.8% |
| $50,000 to $74,999 | 651 | 16.4% |
| $75,000 to $99,999 | 552 | 13.9% |
| $100,000 to $149,999 | 528 | 13.3% |
| $150,000 to $199,999 | 183 | 4.6% |
| $200,000+ | 75 | 1.9% |
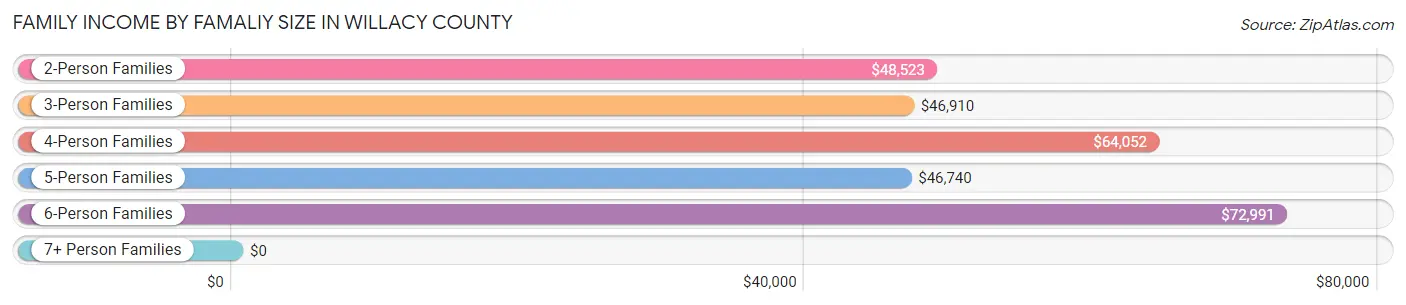
Family Income by Famaliy Size in Willacy County
6-person families (233 | 5.9%) account for the highest median family income in Willacy County with $72,991 per family, while 2-person families (1,554 | 39.1%) have the highest median income of $24,262 per family member.
| Income Bracket | # Families | Median Income |
| 2-Person Families | 1,554 (39.1%) | $48,523 |
| 3-Person Families | 565 (14.2%) | $46,910 |
| 4-Person Families | 864 (21.8%) | $64,052 |
| 5-Person Families | 551 (13.9%) | $46,740 |
| 6-Person Families | 233 (5.9%) | $72,991 |
| 7+ Person Families | 204 (5.1%) | $0 |
| Total | 3,971 (100.0%) | $50,023 |
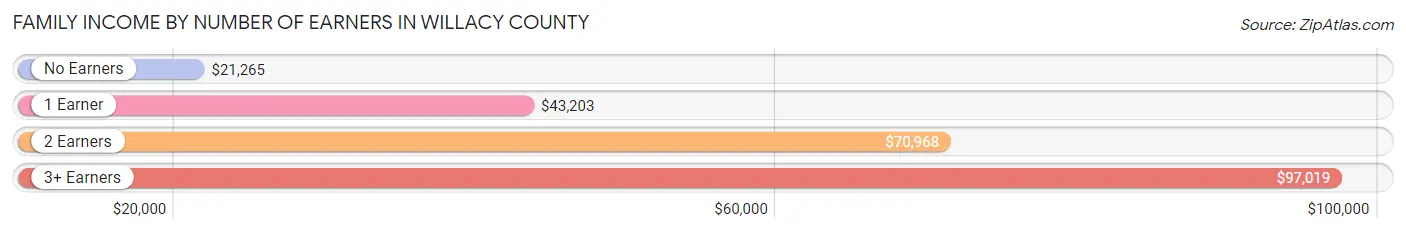
Family Income by Number of Earners in Willacy County
The median family income in Willacy County is $50,023, with families comprising 3+ earners (353) having the highest median family income of $97,019, while families with no earners (676) have the lowest median family income of $21,265, accounting for 8.9% and 17.0% of families, respectively.
| Number of Earners | # Families | Median Income |
| No Earners | 676 (17.0%) | $21,265 |
| 1 Earner | 1,600 (40.3%) | $43,203 |
| 2 Earners | 1,342 (33.8%) | $70,968 |
| 3+ Earners | 353 (8.9%) | $97,019 |
| Total | 3,971 (100.0%) | $50,023 |
Household Income in Willacy County
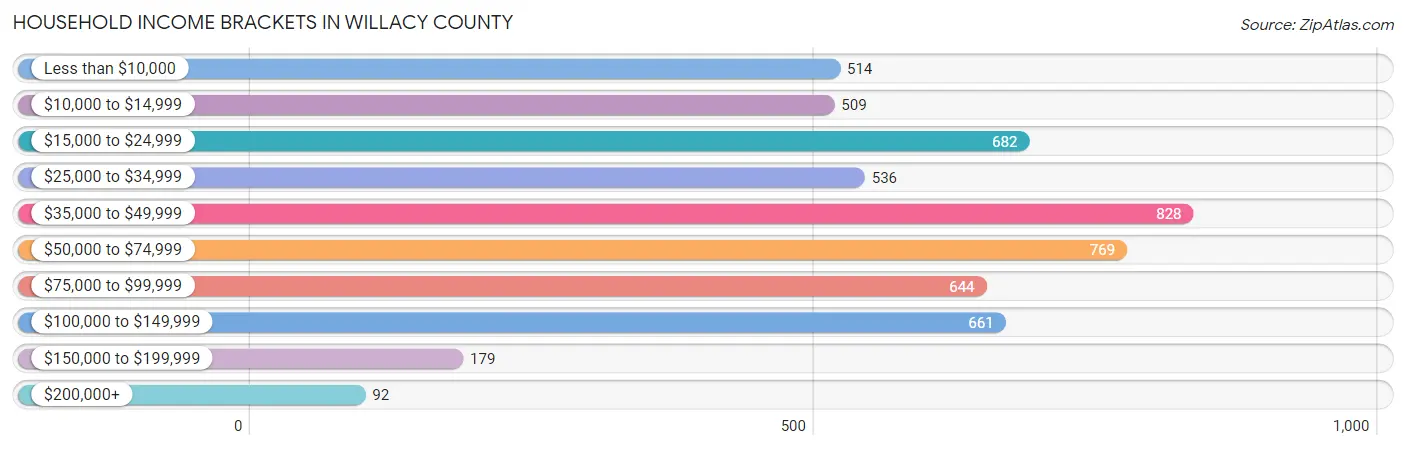
Household Income Brackets in Willacy County
With 828 households falling in the category, the $35,000 to $49,999 income range is the most frequent in Willacy County, accounting for 15.3% of all households. In contrast, only 92 households (1.7%) fall into the $200,000+ income bracket, making it the least populous group.
| Income Bracket | # Households | % Households |
| Less than $10,000 | 514 | 9.5% |
| $10,000 to $14,999 | 509 | 9.4% |
| $15,000 to $24,999 | 682 | 12.6% |
| $25,000 to $34,999 | 536 | 9.9% |
| $35,000 to $49,999 | 828 | 15.3% |
| $50,000 to $74,999 | 769 | 14.2% |
| $75,000 to $99,999 | 644 | 11.9% |
| $100,000 to $149,999 | 661 | 12.2% |
| $150,000 to $199,999 | 179 | 3.3% |
| $200,000+ | 92 | 1.7% |
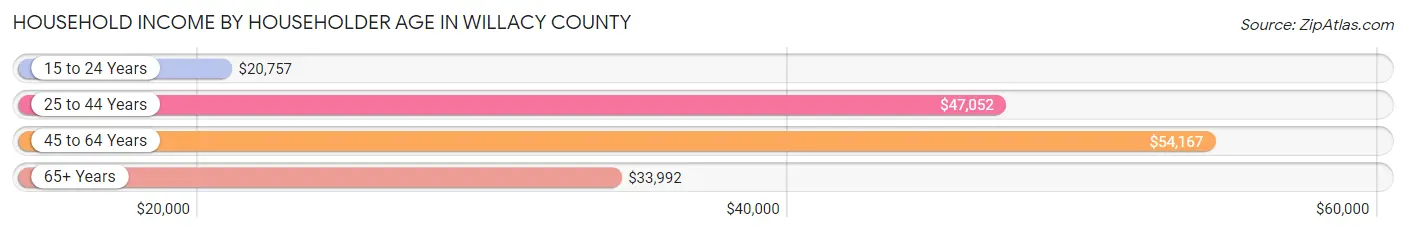
Household Income by Householder Age in Willacy County
The median household income in Willacy County is $42,839, with the highest median household income of $54,167 found in the 45 to 64 years age bracket for the primary householder. A total of 1,906 households (35.2%) fall into this category. Meanwhile, the 15 to 24 years age bracket for the primary householder has the lowest median household income of $20,757, with 217 households (4.0%) in this group.
| Income Bracket | # Households | Median Income |
| 15 to 24 Years | 217 (4.0%) | $20,757 |
| 25 to 44 Years | 1,527 (28.2%) | $47,052 |
| 45 to 64 Years | 1,906 (35.2%) | $54,167 |
| 65+ Years | 1,764 (32.6%) | $33,992 |
| Total | 5,414 (100.0%) | $42,839 |
Poverty in Willacy County
Income Below Poverty by Sex and Age in Willacy County
With 26.3% poverty level for males and 26.9% for females among the residents of Willacy County, 15 year old males and 5 year old females are the most vulnerable to poverty, with 60 males (56.1%) and 50 females (100.0%) in their respective age groups living below the poverty level.
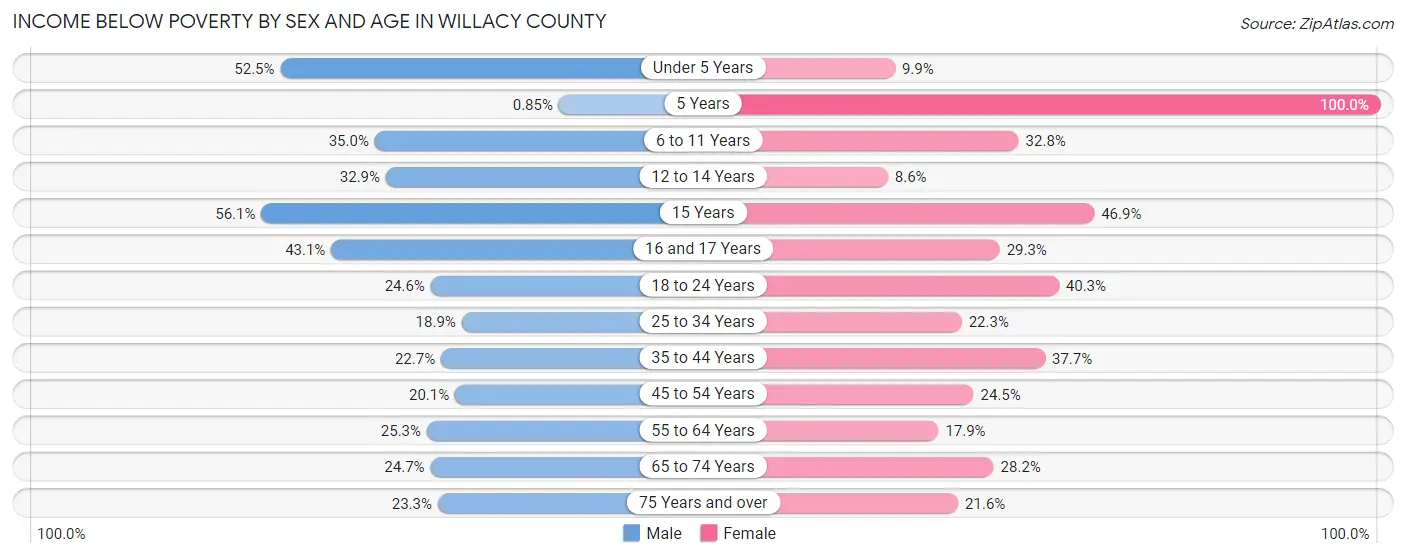
| Age Bracket | Male | Female |
| Under 5 Years | 311 (52.5%) | 62 (9.9%) |
| 5 Years | 1 (0.9%) | 50 (100.0%) |
| 6 to 11 Years | 257 (35.0%) | 304 (32.8%) |
| 12 to 14 Years | 139 (32.9%) | 37 (8.6%) |
| 15 Years | 60 (56.1%) | 112 (46.9%) |
| 16 and 17 Years | 131 (43.1%) | 51 (29.3%) |
| 18 to 24 Years | 341 (24.6%) | 363 (40.3%) |
| 25 to 34 Years | 303 (18.9%) | 242 (22.3%) |
| 35 to 44 Years | 285 (22.7%) | 406 (37.7%) |
| 45 to 54 Years | 241 (20.1%) | 241 (24.5%) |
| 55 to 64 Years | 206 (25.3%) | 179 (17.9%) |
| 65 to 74 Years | 191 (24.7%) | 241 (28.2%) |
| 75 Years and over | 124 (23.3%) | 154 (21.6%) |
| Total | 2,590 (26.3%) | 2,442 (26.9%) |
Income Above Poverty by Sex and Age in Willacy County
According to the poverty statistics in Willacy County, males aged 5 years and females aged 12 to 14 years are the age groups that are most secure financially, with 99.2% of males and 91.4% of females in these age groups living above the poverty line.
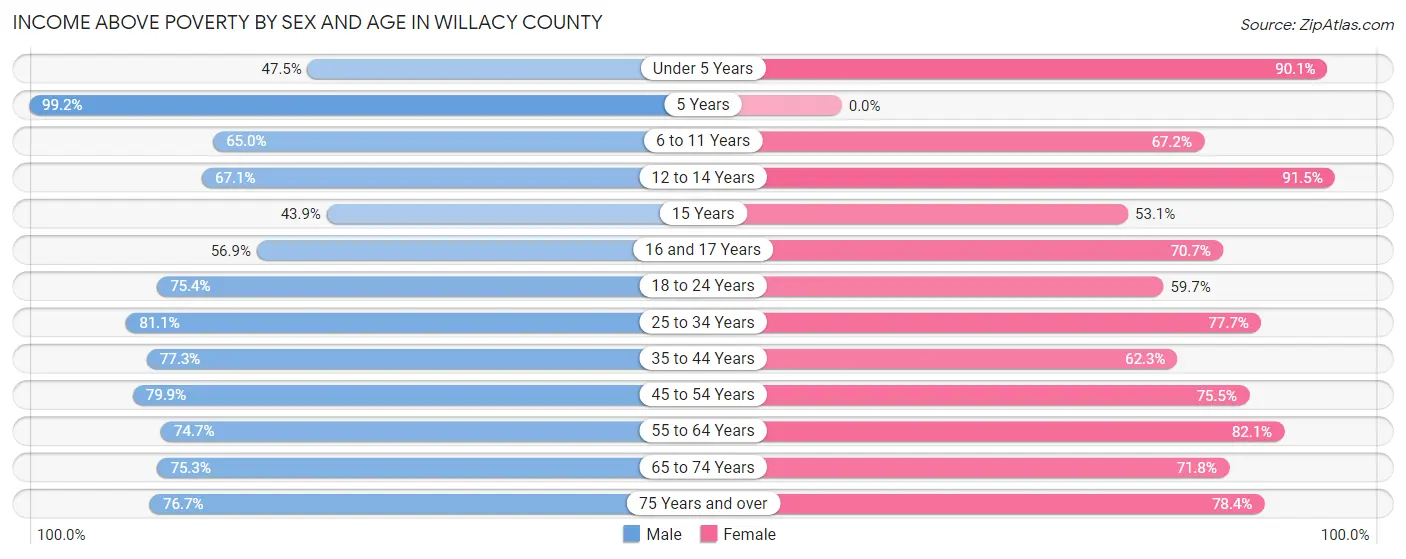
| Age Bracket | Male | Female |
| Under 5 Years | 281 (47.5%) | 566 (90.1%) |
| 5 Years | 117 (99.2%) | 0 (0.0%) |
| 6 to 11 Years | 477 (65.0%) | 622 (67.2%) |
| 12 to 14 Years | 283 (67.1%) | 396 (91.4%) |
| 15 Years | 47 (43.9%) | 127 (53.1%) |
| 16 and 17 Years | 173 (56.9%) | 123 (70.7%) |
| 18 to 24 Years | 1,044 (75.4%) | 538 (59.7%) |
| 25 to 34 Years | 1,302 (81.1%) | 845 (77.7%) |
| 35 to 44 Years | 970 (77.3%) | 670 (62.3%) |
| 45 to 54 Years | 958 (79.9%) | 744 (75.5%) |
| 55 to 64 Years | 607 (74.7%) | 819 (82.1%) |
| 65 to 74 Years | 583 (75.3%) | 614 (71.8%) |
| 75 Years and over | 408 (76.7%) | 559 (78.4%) |
| Total | 7,250 (73.7%) | 6,623 (73.1%) |
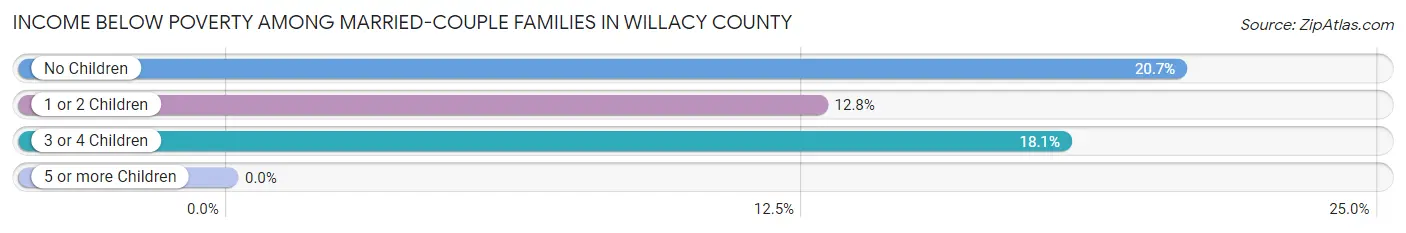
Income Below Poverty Among Married-Couple Families in Willacy County
The poverty statistics for married-couple families in Willacy County show that 17.4% or 453 of the total 2,607 families live below the poverty line. Families with no children have the highest poverty rate of 20.6%, comprising of 267 families. On the other hand, families with 5 or more children have the lowest poverty rate of 0.0%, which includes 0 families.
| Children | Above Poverty | Below Poverty |
| No Children | 1,026 (79.3%) | 267 (20.6%) |
| 1 or 2 Children | 720 (87.2%) | 106 (12.8%) |
| 3 or 4 Children | 361 (81.9%) | 80 (18.1%) |
| 5 or more Children | 47 (100.0%) | 0 (0.0%) |
| Total | 2,154 (82.6%) | 453 (17.4%) |
Income Below Poverty Among Single-Parent Households in Willacy County
According to the poverty data in Willacy County, 10.9% or 29 single-father households and 40.6% or 446 single-mother households are living below the poverty line. Among single-father households, those with 1 or 2 children have the highest poverty rate, with 18 households (11.4%) experiencing poverty. Likewise, among single-mother households, those with 5 or more children have the highest poverty rate, with 38 households (100.0%) falling below the poverty line.
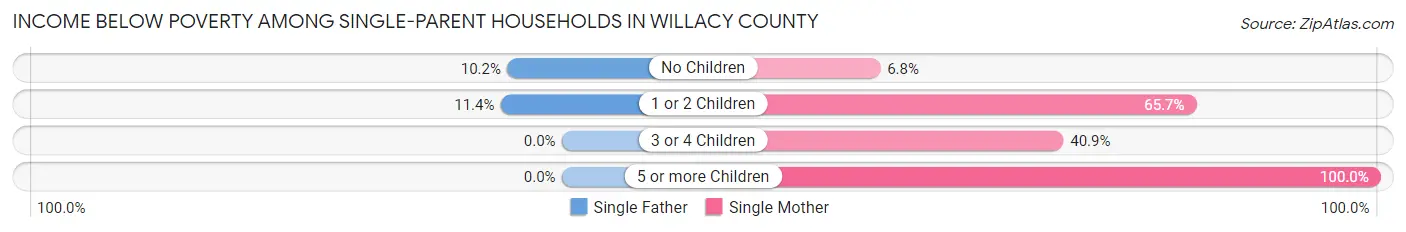
| Children | Single Father | Single Mother |
| No Children | 11 (10.2%) | 27 (6.8%) |
| 1 or 2 Children | 18 (11.4%) | 291 (65.7%) |
| 3 or 4 Children | 0 (0.0%) | 90 (40.9%) |
| 5 or more Children | 0 (0.0%) | 38 (100.0%) |
| Total | 29 (10.9%) | 446 (40.6%) |
Income Below Poverty Among Married-Couple vs Single-Parent Households in Willacy County
The poverty data for Willacy County shows that 453 of the married-couple family households (17.4%) and 475 of the single-parent households (34.8%) are living below the poverty level. Within the married-couple family households, those with no children have the highest poverty rate, with 267 households (20.6%) falling below the poverty line. Among the single-parent households, those with 5 or more children have the highest poverty rate, with 38 household (100.0%) living below poverty.
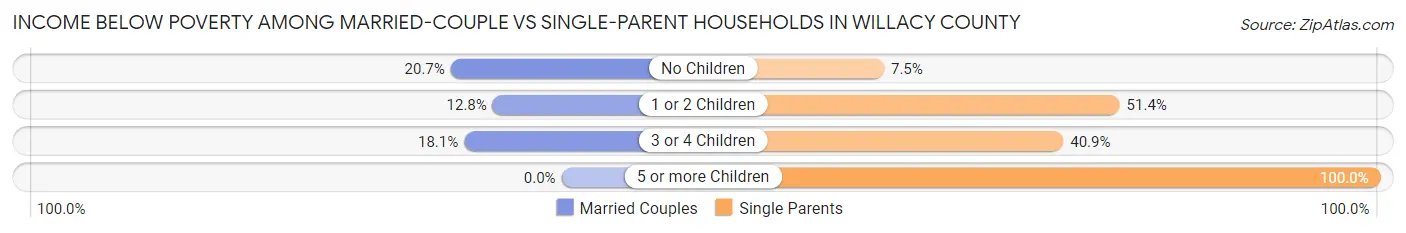
| Children | Married-Couple Families | Single-Parent Households |
| No Children | 267 (20.6%) | 38 (7.5%) |
| 1 or 2 Children | 106 (12.8%) | 309 (51.4%) |
| 3 or 4 Children | 80 (18.1%) | 90 (40.9%) |
| 5 or more Children | 0 (0.0%) | 38 (100.0%) |
| Total | 453 (17.4%) | 475 (34.8%) |
Race in Willacy County
The most populous races in Willacy County are Hispanic or Latino (17,939 | 88.3%), White / Caucasian (14,122 | 69.5%), and Two or more Races (5,242 | 25.8%).
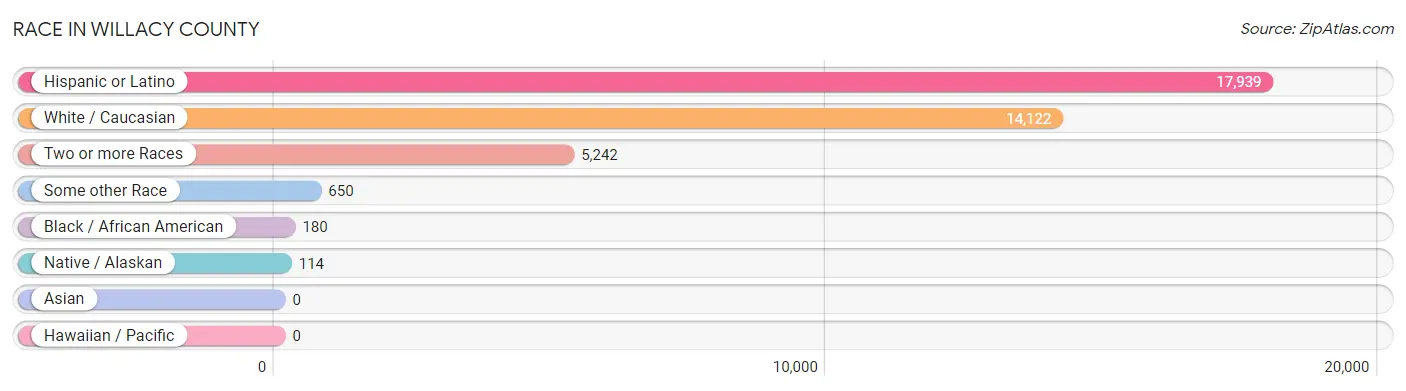
| Race | # Population | % Population |
| Asian | 0 | 0.0% |
| Black / African American | 180 | 0.9% |
| Hawaiian / Pacific | 0 | 0.0% |
| Hispanic or Latino | 17,939 | 88.3% |
| Native / Alaskan | 114 | 0.6% |
| White / Caucasian | 14,122 | 69.5% |
| Two or more Races | 5,242 | 25.8% |
| Some other Race | 650 | 3.2% |
| Total | 20,308 | 100.0% |
Ancestry in Willacy County
The most populous ancestries reported in Willacy County are Mexican (17,049 | 84.0%), German (501 | 2.5%), American (398 | 2.0%), Irish (307 | 1.5%), and English (142 | 0.7%), together accounting for 90.6% of all Willacy County residents.
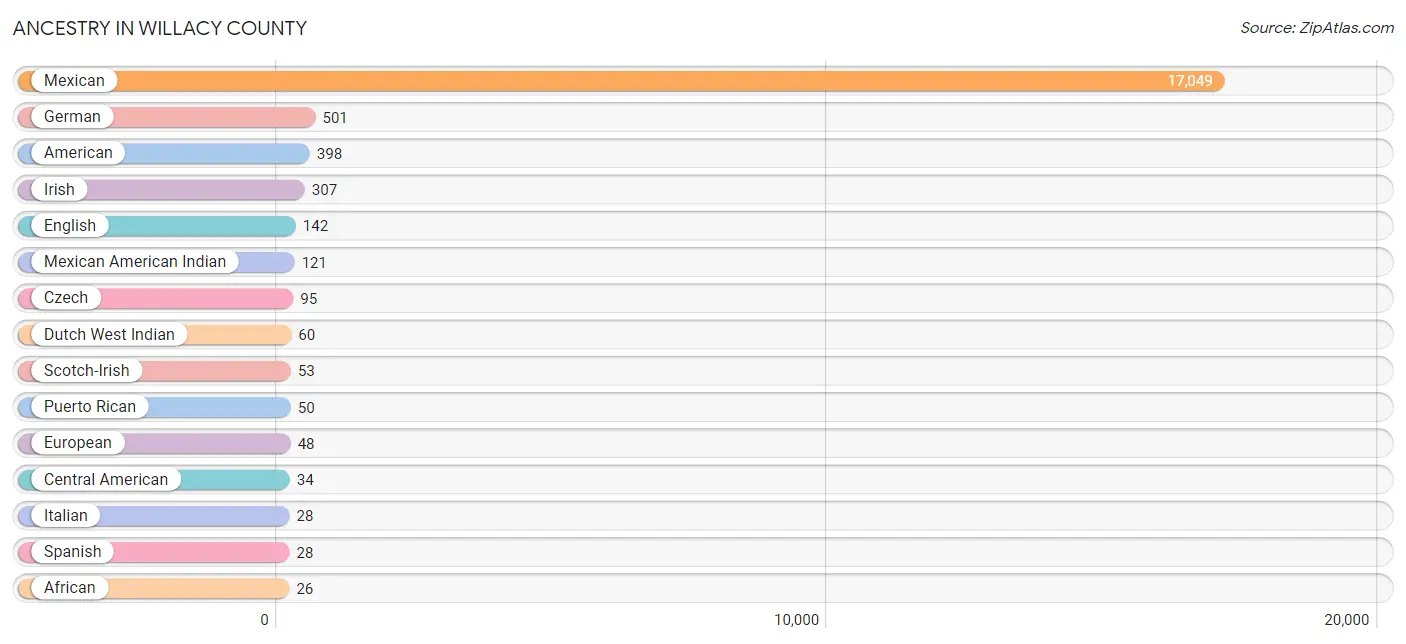
| Ancestry | # Population | % Population |
| African | 26 | 0.1% |
| American | 398 | 2.0% |
| Apache | 5 | 0.0% |
| Austrian | 17 | 0.1% |
| Belgian | 23 | 0.1% |
| Central American | 34 | 0.2% |
| Czech | 95 | 0.5% |
| Danish | 9 | 0.0% |
| Dominican | 12 | 0.1% |
| Dutch | 3 | 0.0% |
| Dutch West Indian | 60 | 0.3% |
| English | 142 | 0.7% |
| European | 48 | 0.2% |
| Finnish | 9 | 0.0% |
| French | 21 | 0.1% |
| German | 501 | 2.5% |
| Greek | 12 | 0.1% |
| Guatemalan | 24 | 0.1% |
| Haitian | 15 | 0.1% |
| Honduran | 3 | 0.0% |
| Irish | 307 | 1.5% |
| Italian | 28 | 0.1% |
| Jamaican | 7 | 0.0% |
| Korean | 25 | 0.1% |
| Lithuanian | 15 | 0.1% |
| Mexican | 17,049 | 84.0% |
| Mexican American Indian | 121 | 0.6% |
| Norwegian | 10 | 0.1% |
| Polish | 8 | 0.0% |
| Puerto Rican | 50 | 0.3% |
| Salvadoran | 7 | 0.0% |
| Scotch-Irish | 53 | 0.3% |
| Scottish | 24 | 0.1% |
| Spaniard | 9 | 0.0% |
| Spanish | 28 | 0.1% |
| Spanish American | 5 | 0.0% |
| Subsaharan African | 26 | 0.1% |
| Swedish | 22 | 0.1% |
| Turkish | 3 | 0.0% |
| Ukrainian | 6 | 0.0% |
| Welsh | 19 | 0.1% | View All 41 Rows |
Immigrants in Willacy County
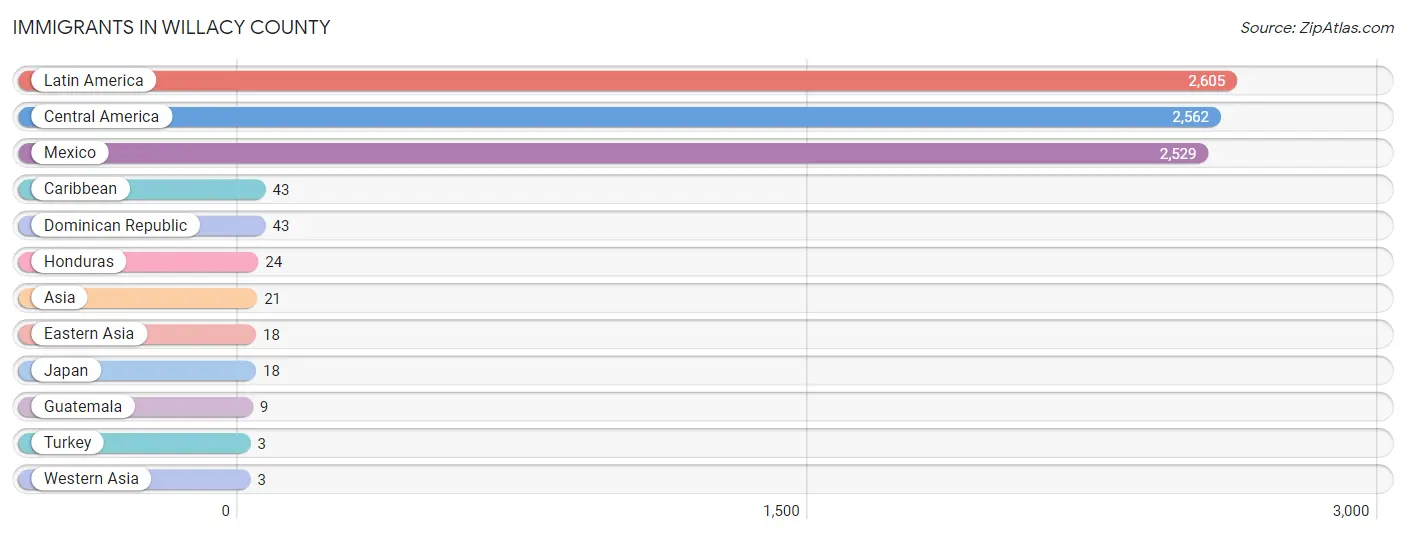
The most numerous immigrant groups reported in Willacy County came from Latin America (2,605 | 12.8%), Central America (2,562 | 12.6%), Mexico (2,529 | 12.4%), Caribbean (43 | 0.2%), and Dominican Republic (43 | 0.2%), together accounting for 38.3% of all Willacy County residents.
| Immigration Origin | # Population | % Population |
| Asia | 21 | 0.1% |
| Caribbean | 43 | 0.2% |
| Central America | 2,562 | 12.6% |
| Dominican Republic | 43 | 0.2% |
| Eastern Asia | 18 | 0.1% |
| Guatemala | 9 | 0.0% |
| Honduras | 24 | 0.1% |
| Japan | 18 | 0.1% |
| Latin America | 2,605 | 12.8% |
| Mexico | 2,529 | 12.4% |
| Turkey | 3 | 0.0% |
| Western Asia | 3 | 0.0% | View All 12 Rows |
Sex and Age in Willacy County
Sex and Age in Willacy County
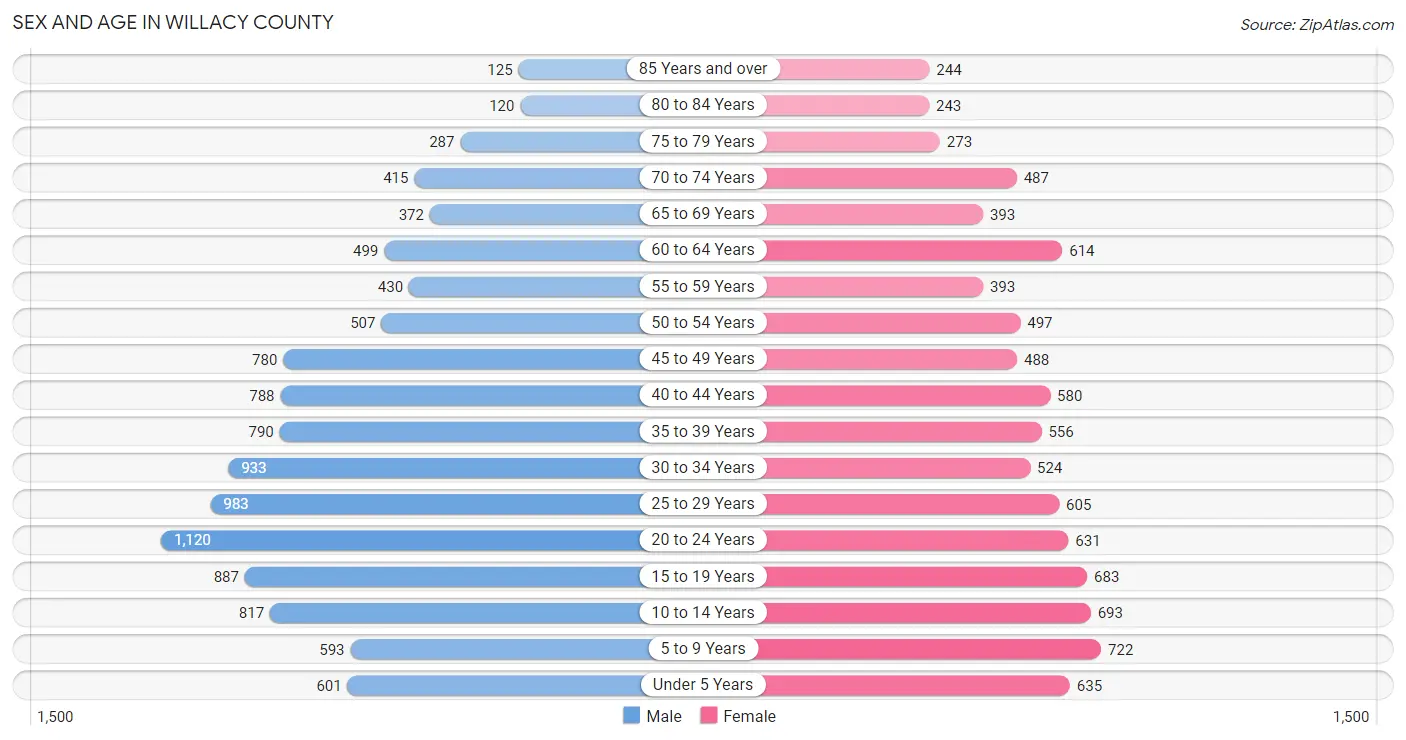
The most populous age groups in Willacy County are 20 to 24 Years (1,120 | 10.1%) for men and 5 to 9 Years (722 | 7.8%) for women.
| Age Bracket | Male | Female |
| Under 5 Years | 601 (5.4%) | 635 (6.9%) |
| 5 to 9 Years | 593 (5.4%) | 722 (7.8%) |
| 10 to 14 Years | 817 (7.4%) | 693 (7.5%) |
| 15 to 19 Years | 887 (8.0%) | 683 (7.4%) |
| 20 to 24 Years | 1,120 (10.1%) | 631 (6.8%) |
| 25 to 29 Years | 983 (8.9%) | 605 (6.5%) |
| 30 to 34 Years | 933 (8.5%) | 524 (5.7%) |
| 35 to 39 Years | 790 (7.1%) | 556 (6.0%) |
| 40 to 44 Years | 788 (7.1%) | 580 (6.3%) |
| 45 to 49 Years | 780 (7.1%) | 488 (5.3%) |
| 50 to 54 Years | 507 (4.6%) | 497 (5.4%) |
| 55 to 59 Years | 430 (3.9%) | 393 (4.2%) |
| 60 to 64 Years | 499 (4.5%) | 614 (6.6%) |
| 65 to 69 Years | 372 (3.4%) | 393 (4.2%) |
| 70 to 74 Years | 415 (3.8%) | 487 (5.3%) |
| 75 to 79 Years | 287 (2.6%) | 273 (2.9%) |
| 80 to 84 Years | 120 (1.1%) | 243 (2.6%) |
| 85 Years and over | 125 (1.1%) | 244 (2.6%) |
| Total | 11,047 (100.0%) | 9,261 (100.0%) |
Families and Households in Willacy County
Median Family Size in Willacy County
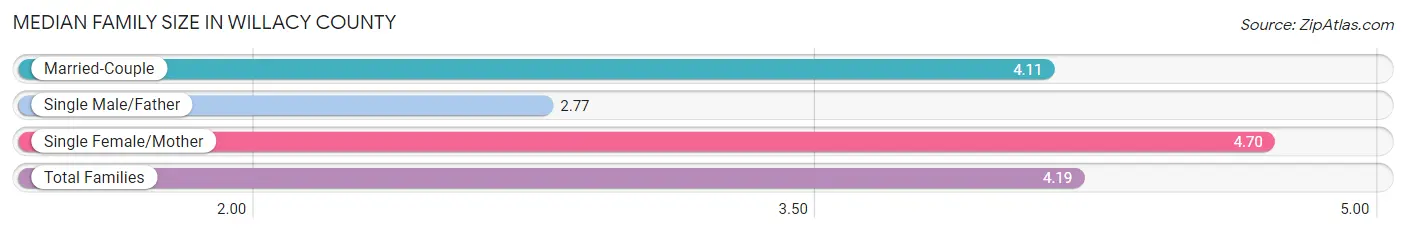
The median family size in Willacy County is 4.19 persons per family, with single female/mother families (1,098 | 27.7%) accounting for the largest median family size of 4.7 persons per family. On the other hand, single male/father families (266 | 6.7%) represent the smallest median family size with 2.77 persons per family.
| Family Type | # Families | Family Size |
| Married-Couple | 2,607 (65.6%) | 4.11 |
| Single Male/Father | 266 (6.7%) | 2.77 |
| Single Female/Mother | 1,098 (27.7%) | 4.70 |
| Total Families | 3,971 (100.0%) | 4.19 |
Median Household Size in Willacy County
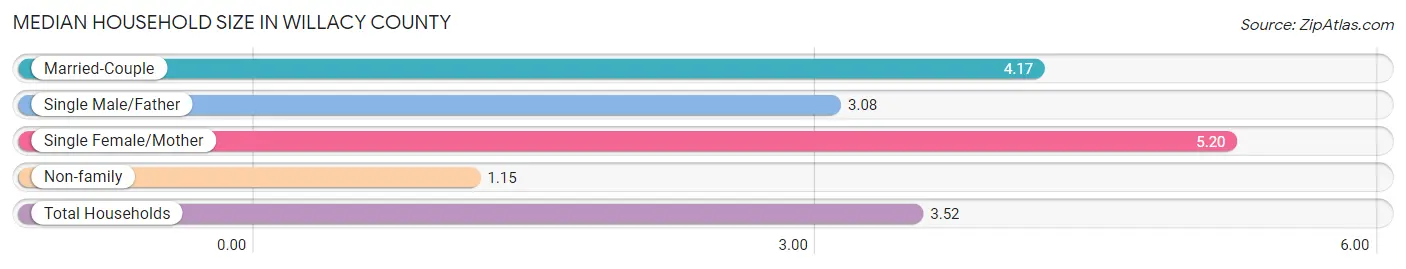
The median household size in Willacy County is 3.52 persons per household, with single female/mother households (1,098 | 20.3%) accounting for the largest median household size of 5.2 persons per household. non-family households (1,443 | 26.7%) represent the smallest median household size with 1.15 persons per household.
| Household Type | # Households | Household Size |
| Married-Couple | 2,607 (48.1%) | 4.17 |
| Single Male/Father | 266 (4.9%) | 3.08 |
| Single Female/Mother | 1,098 (20.3%) | 5.20 |
| Non-family | 1,443 (26.7%) | 1.15 |
| Total Households | 5,414 (100.0%) | 3.52 |
Household Size by Marriage Status in Willacy County
Out of a total of 5,414 households in Willacy County, 3,971 (73.4%) are family households, while 1,443 (26.7%) are nonfamily households. The most numerous type of family households are 2-person households, comprising 1,442, and the most common type of nonfamily households are 1-person households, comprising 1,270.
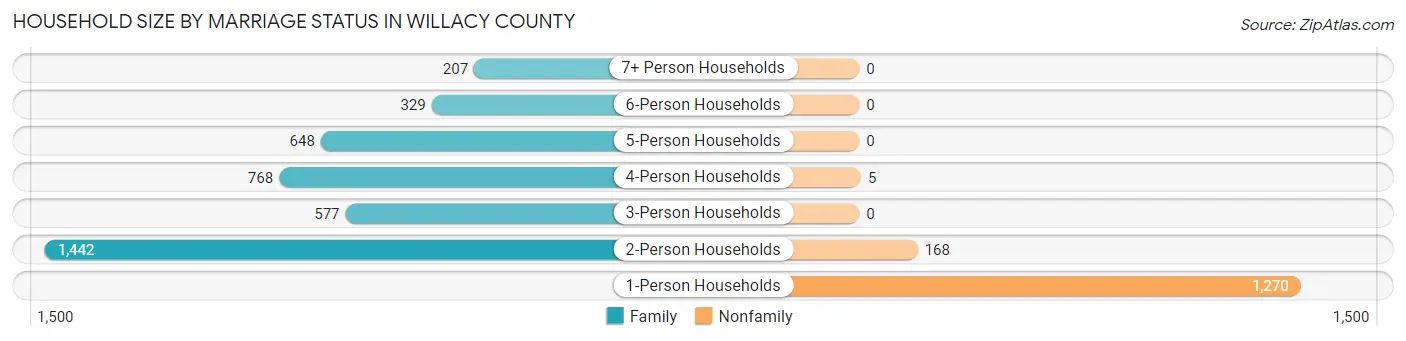
| Household Size | Family Households | Nonfamily Households |
| 1-Person Households | - | 1,270 (23.5%) |
| 2-Person Households | 1,442 (26.6%) | 168 (3.1%) |
| 3-Person Households | 577 (10.7%) | 0 (0.0%) |
| 4-Person Households | 768 (14.2%) | 5 (0.1%) |
| 5-Person Households | 648 (12.0%) | 0 (0.0%) |
| 6-Person Households | 329 (6.1%) | 0 (0.0%) |
| 7+ Person Households | 207 (3.8%) | 0 (0.0%) |
| Total | 3,971 (73.4%) | 1,443 (26.7%) |
Female Fertility in Willacy County
Fertility by Age in Willacy County
Average fertility rate in Willacy County is 90.0 births per 1,000 women. Women in the age bracket of 20 to 34 years have the highest fertility rate with 168.0 births per 1,000 women. Women in the age bracket of 20 to 34 years acount for 77.7% of all women with births.
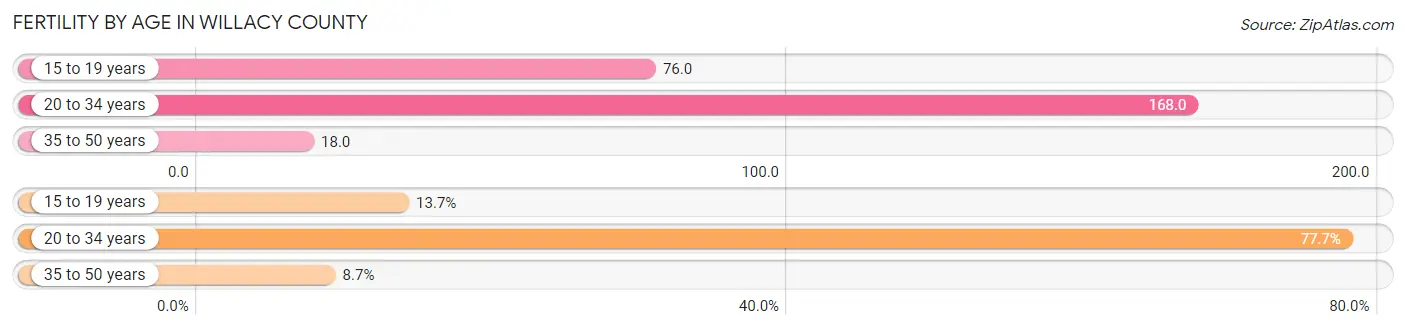
| Age Bracket | Women with Births | Births / 1,000 Women |
| 15 to 19 years | 52 (13.7%) | 76.0 |
| 20 to 34 years | 296 (77.7%) | 168.0 |
| 35 to 50 years | 33 (8.7%) | 18.0 |
| Total | 381 (100.0%) | 90.0 |
Fertility by Age by Marriage Status in Willacy County
40.9% of women with births (381) in Willacy County are married. The highest percentage of unmarried women with births falls into 15 to 19 years age bracket with 100.0% of them unmarried at the time of birth, while the lowest percentage of unmarried women with births belong to 35 to 50 years age bracket with 0.0% of them unmarried.
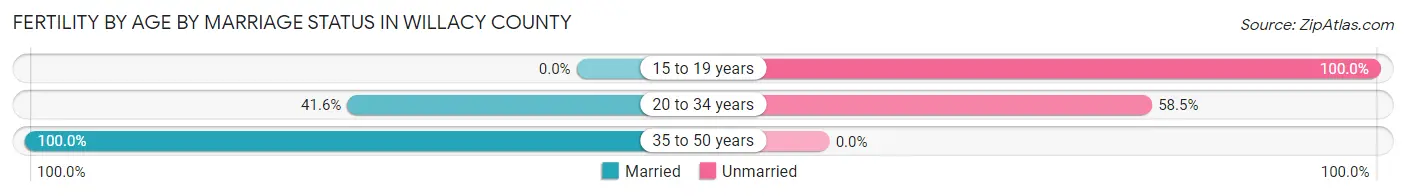
| Age Bracket | Married | Unmarried |
| 15 to 19 years | 0 (0.0%) | 52 (100.0%) |
| 20 to 34 years | 123 (41.5%) | 173 (58.5%) |
| 35 to 50 years | 33 (100.0%) | 0 (0.0%) |
| Total | 156 (40.9%) | 225 (59.1%) |
Fertility by Education in Willacy County
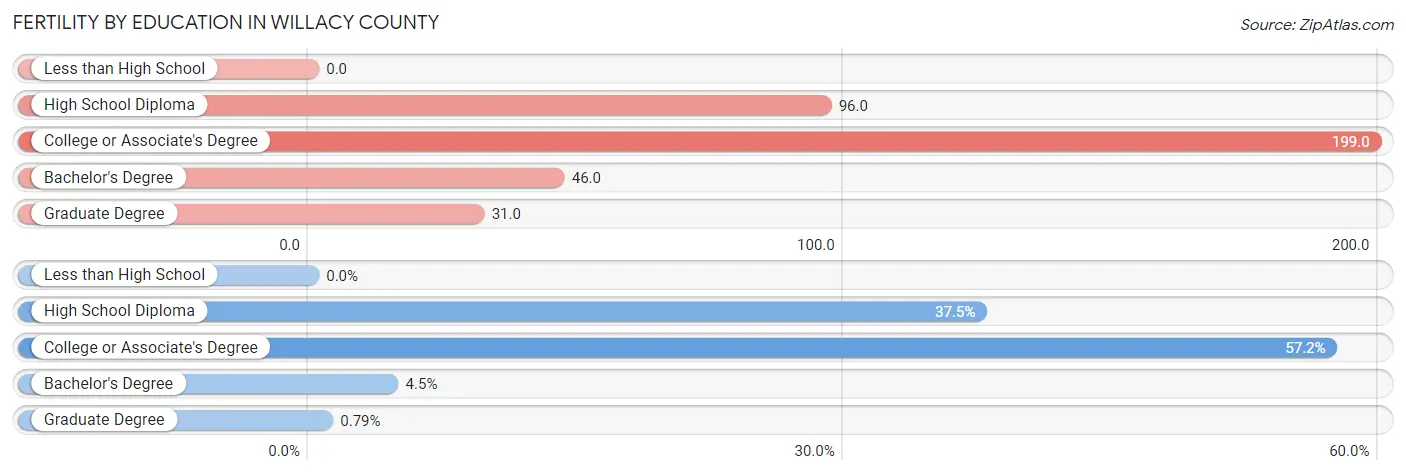
| Educational Attainment | Women with Births | Births / 1,000 Women |
| Less than High School | 0 (0.0%) | 0.0 |
| High School Diploma | 143 (37.5%) | 96.0 |
| College or Associate's Degree | 218 (57.2%) | 199.0 |
| Bachelor's Degree | 17 (4.5%) | 46.0 |
| Graduate Degree | 3 (0.8%) | 31.0 |
| Total | 381 (100.0%) | 90.0 |
Fertility by Education by Marriage Status in Willacy County
59.1% of women with births in Willacy County are unmarried. Women with the educational attainment of bachelor's degree are most likely to be married with 100.0% of them married at childbirth, while women with the educational attainment of high school diploma are least likely to be married with 91.6% of them unmarried at childbirth.
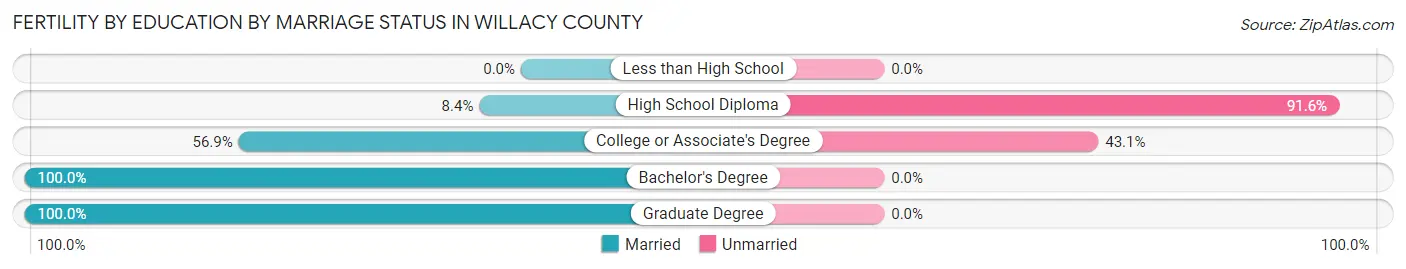
| Educational Attainment | Married | Unmarried |
| Less than High School | 0 (0.0%) | 0 (0.0%) |
| High School Diploma | 12 (8.4%) | 131 (91.6%) |
| College or Associate's Degree | 124 (56.9%) | 94 (43.1%) |
| Bachelor's Degree | 17 (100.0%) | 0 (0.0%) |
| Graduate Degree | 3 (100.0%) | 0 (0.0%) |
| Total | 156 (40.9%) | 225 (59.1%) |
Employment Characteristics in Willacy County
Employment by Class of Employer in Willacy County
Among the 7,939 employed individuals in Willacy County, private company employees (5,623 | 70.8%), self-employed (not incorporated) (913 | 11.5%), and local government employees (549 | 6.9%) make up the most common classes of employment.
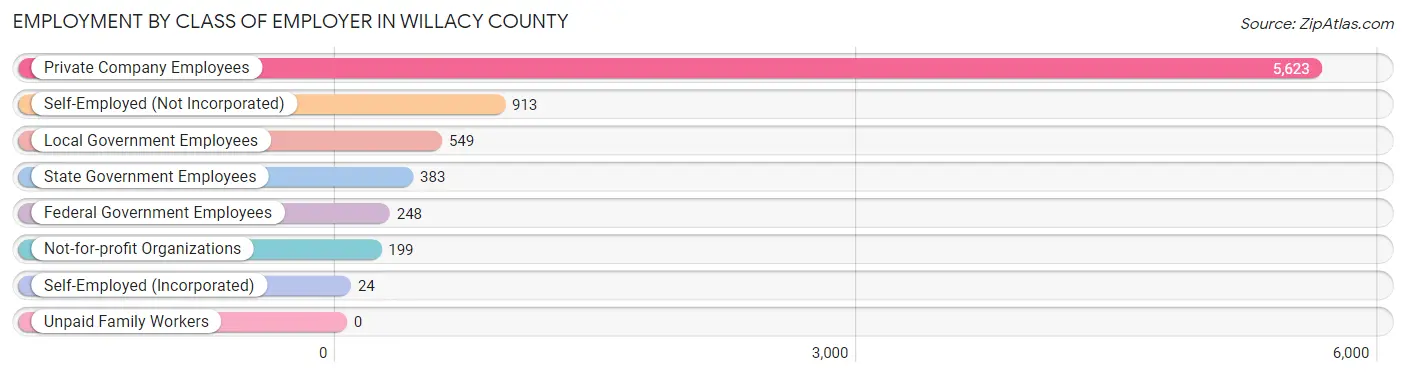
| Employer Class | # Employees | % Employees |
| Private Company Employees | 5,623 | 70.8% |
| Self-Employed (Incorporated) | 24 | 0.3% |
| Self-Employed (Not Incorporated) | 913 | 11.5% |
| Not-for-profit Organizations | 199 | 2.5% |
| Local Government Employees | 549 | 6.9% |
| State Government Employees | 383 | 4.8% |
| Federal Government Employees | 248 | 3.1% |
| Unpaid Family Workers | 0 | 0.0% |
| Total | 7,939 | 100.0% |
Employment Status by Age in Willacy County
According to the labor force statistics for Willacy County, out of the total population over 16 years of age (15,901), 55.3% or 8,793 individuals are in the labor force, with 8.7% or 765 of them unemployed. The age group with the highest labor force participation rate is 25 to 29 years, with 75.4% or 1,197 individuals in the labor force. Within the labor force, the 20 to 24 years age range has the highest percentage of unemployed individuals, with 13.2% or 159 of them being unemployed.
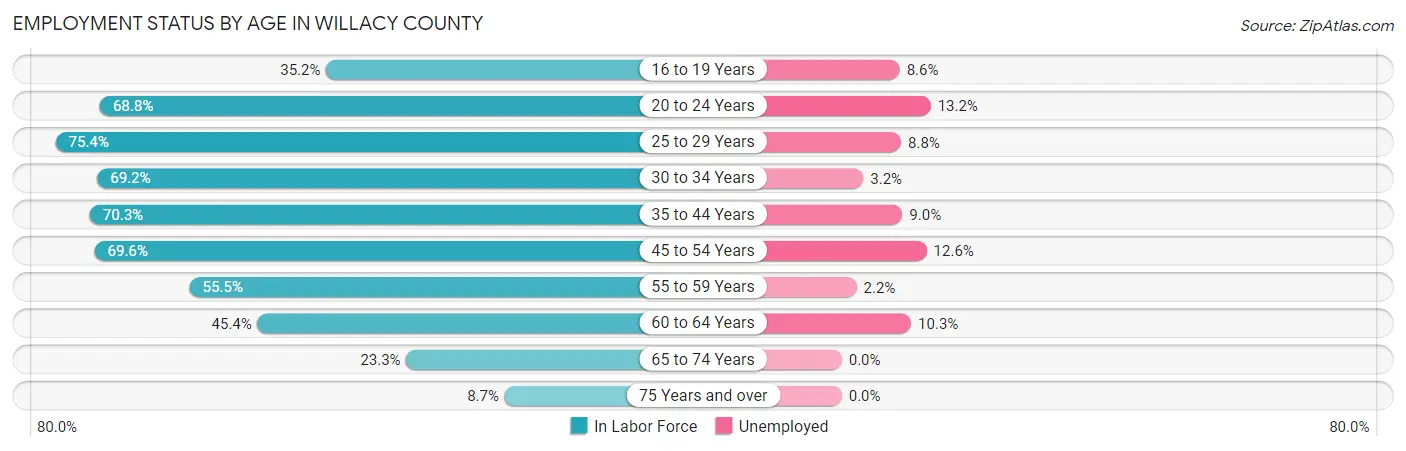
| Age Bracket | In Labor Force | Unemployed |
| 16 to 19 Years | 431 (35.2%) | 37 (8.6%) |
| 20 to 24 Years | 1,205 (68.8%) | 159 (13.2%) |
| 25 to 29 Years | 1,197 (75.4%) | 105 (8.8%) |
| 30 to 34 Years | 1,008 (69.2%) | 32 (3.2%) |
| 35 to 44 Years | 1,908 (70.3%) | 172 (9.0%) |
| 45 to 54 Years | 1,581 (69.6%) | 199 (12.6%) |
| 55 to 59 Years | 457 (55.5%) | 10 (2.2%) |
| 60 to 64 Years | 505 (45.4%) | 52 (10.3%) |
| 65 to 74 Years | 388 (23.3%) | 0 (0.0%) |
| 75 Years and over | 112 (8.7%) | 0 (0.0%) |
| Total | 8,793 (55.3%) | 765 (8.7%) |
Employment Status by Educational Attainment in Willacy County
According to labor force statistics for Willacy County, 66.8% of individuals (6,658) out of the total population between 25 and 64 years of age (9,967) are in the labor force, with 8.6% or 573 of them being unemployed. The group with the highest labor force participation rate are those with the educational attainment of bachelor's degree or higher, with 84.7% or 857 individuals in the labor force. Within the labor force, individuals with less than high school education have the highest percentage of unemployment, with 16.2% or 234 of them being unemployed.
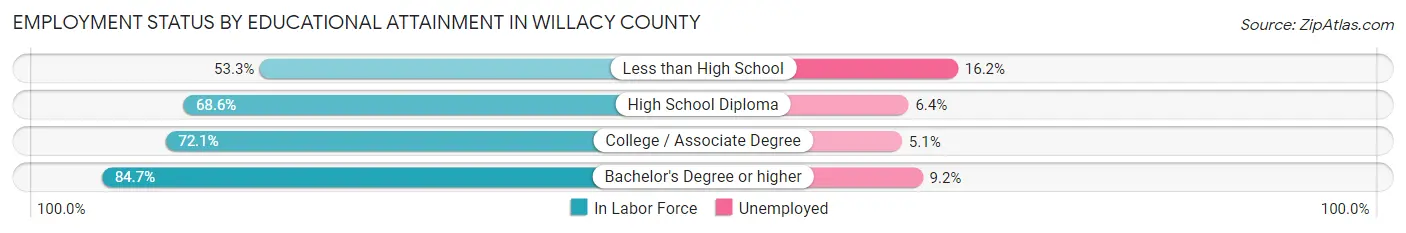
| Educational Attainment | In Labor Force | Unemployed |
| Less than High School | 1,447 (53.3%) | 440 (16.2%) |
| High School Diploma | 2,812 (68.6%) | 262 (6.4%) |
| College / Associate Degree | 1,544 (72.1%) | 109 (5.1%) |
| Bachelor's Degree or higher | 857 (84.7%) | 93 (9.2%) |
| Total | 6,658 (66.8%) | 857 (8.6%) |
Employment Occupations by Sex in Willacy County
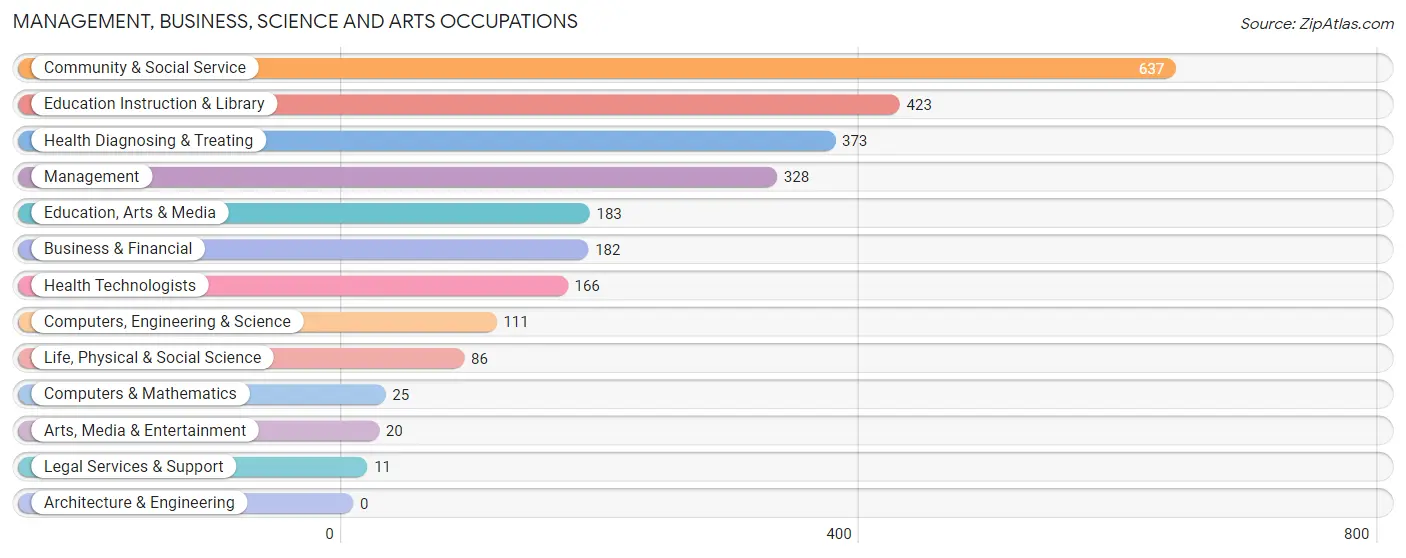
Management, Business, Science and Arts Occupations
The most common Management, Business, Science and Arts occupations in Willacy County are Community & Social Service (637 | 7.9%), Education Instruction & Library (423 | 5.3%), Health Diagnosing & Treating (373 | 4.6%), Management (328 | 4.1%), and Education, Arts & Media (183 | 2.3%).
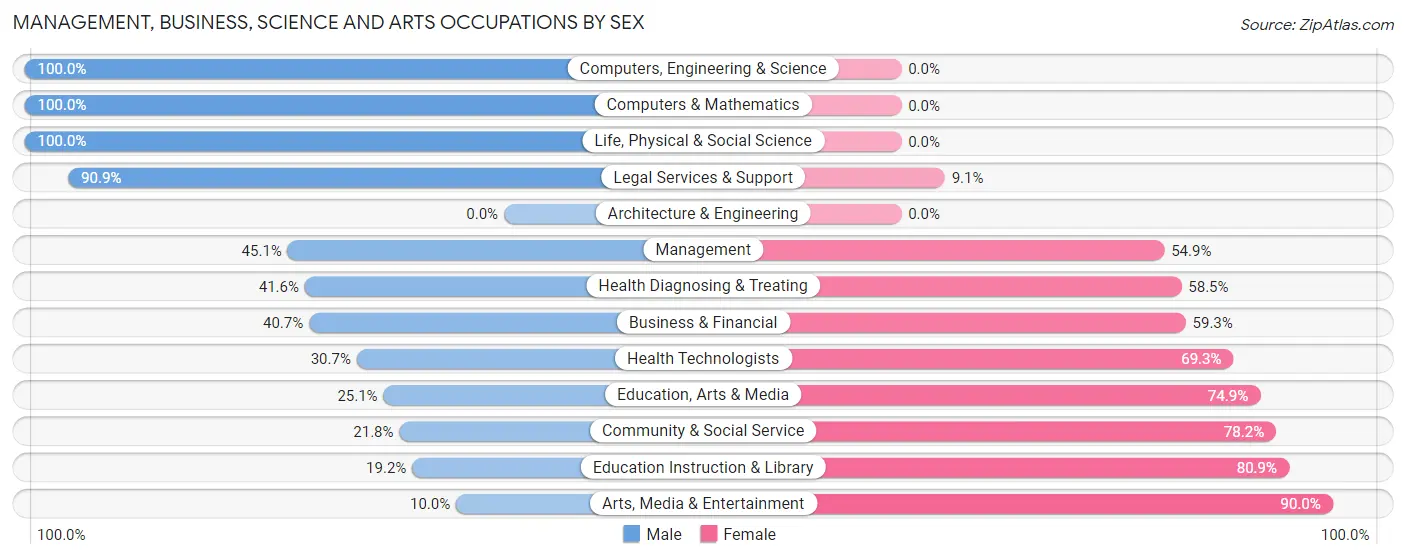
Management, Business, Science and Arts Occupations by Sex
Within the Management, Business, Science and Arts occupations in Willacy County, the most male-oriented occupations are Computers, Engineering & Science (100.0%), Computers & Mathematics (100.0%), and Life, Physical & Social Science (100.0%), while the most female-oriented occupations are Arts, Media & Entertainment (90.0%), Education Instruction & Library (80.8%), and Community & Social Service (78.2%).
| Occupation | Male | Female |
| Management | 148 (45.1%) | 180 (54.9%) |
| Business & Financial | 74 (40.7%) | 108 (59.3%) |
| Computers, Engineering & Science | 111 (100.0%) | 0 (0.0%) |
| Computers & Mathematics | 25 (100.0%) | 0 (0.0%) |
| Architecture & Engineering | 0 (0.0%) | 0 (0.0%) |
| Life, Physical & Social Science | 86 (100.0%) | 0 (0.0%) |
| Community & Social Service | 139 (21.8%) | 498 (78.2%) |
| Education, Arts & Media | 46 (25.1%) | 137 (74.9%) |
| Legal Services & Support | 10 (90.9%) | 1 (9.1%) |
| Education Instruction & Library | 81 (19.2%) | 342 (80.8%) |
| Arts, Media & Entertainment | 2 (10.0%) | 18 (90.0%) |
| Health Diagnosing & Treating | 155 (41.5%) | 218 (58.5%) |
| Health Technologists | 51 (30.7%) | 115 (69.3%) |
| Total (Category) | 627 (38.4%) | 1,004 (61.6%) |
| Total (Overall) | 4,750 (59.2%) | 3,279 (40.8%) |
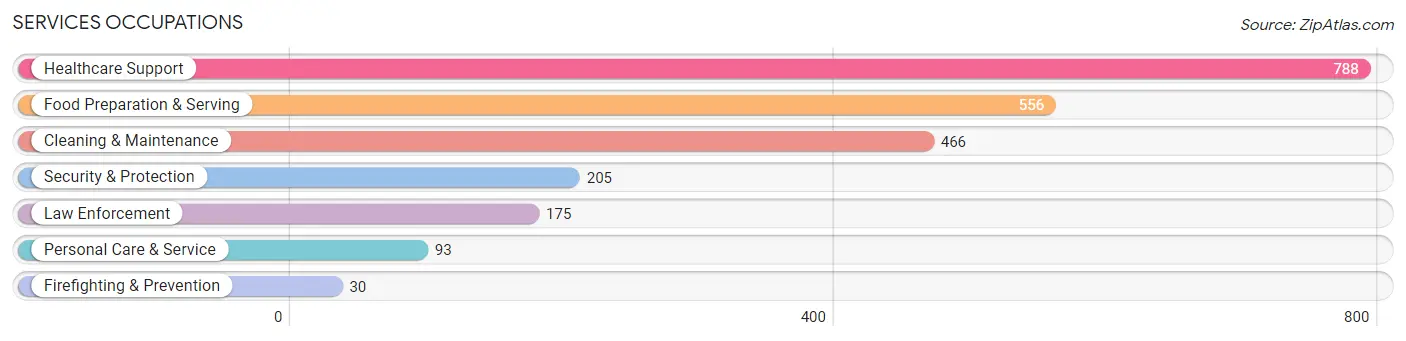
Services Occupations
The most common Services occupations in Willacy County are Healthcare Support (788 | 9.8%), Food Preparation & Serving (556 | 6.9%), Cleaning & Maintenance (466 | 5.8%), Security & Protection (205 | 2.5%), and Law Enforcement (175 | 2.2%).
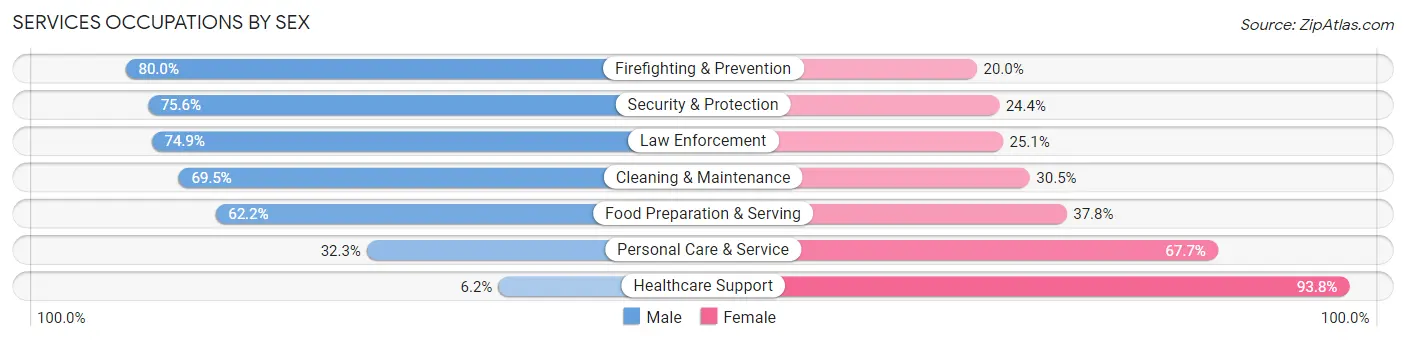
Services Occupations by Sex
Within the Services occupations in Willacy County, the most male-oriented occupations are Firefighting & Prevention (80.0%), Security & Protection (75.6%), and Law Enforcement (74.9%), while the most female-oriented occupations are Healthcare Support (93.8%), Personal Care & Service (67.7%), and Food Preparation & Serving (37.8%).
| Occupation | Male | Female |
| Healthcare Support | 49 (6.2%) | 739 (93.8%) |
| Security & Protection | 155 (75.6%) | 50 (24.4%) |
| Firefighting & Prevention | 24 (80.0%) | 6 (20.0%) |
| Law Enforcement | 131 (74.9%) | 44 (25.1%) |
| Food Preparation & Serving | 346 (62.2%) | 210 (37.8%) |
| Cleaning & Maintenance | 324 (69.5%) | 142 (30.5%) |
| Personal Care & Service | 30 (32.3%) | 63 (67.7%) |
| Total (Category) | 904 (42.9%) | 1,204 (57.1%) |
| Total (Overall) | 4,750 (59.2%) | 3,279 (40.8%) |
Sales and Office Occupations
The most common Sales and Office occupations in Willacy County are Sales & Related (887 | 11.1%), and Office & Administration (580 | 7.2%).
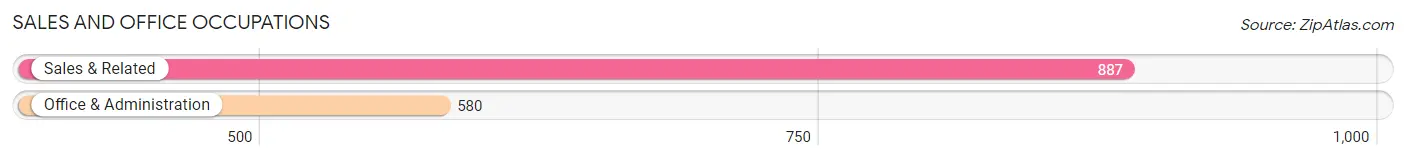
Sales and Office Occupations by Sex
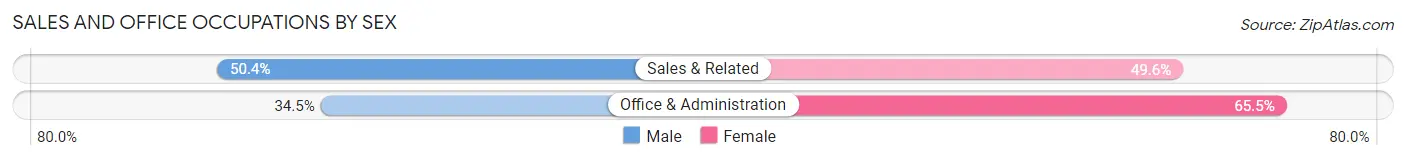
| Occupation | Male | Female |
| Sales & Related | 447 (50.4%) | 440 (49.6%) |
| Office & Administration | 200 (34.5%) | 380 (65.5%) |
| Total (Category) | 647 (44.1%) | 820 (55.9%) |
| Total (Overall) | 4,750 (59.2%) | 3,279 (40.8%) |
Natural Resources, Construction and Maintenance Occupations
The most common Natural Resources, Construction and Maintenance occupations in Willacy County are Construction & Extraction (601 | 7.5%), Installation, Maintenance & Repair (540 | 6.7%), and Farming, Fishing & Forestry (415 | 5.2%).
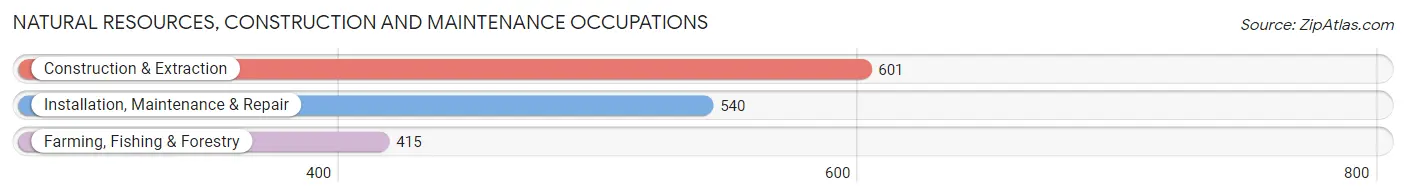
Natural Resources, Construction and Maintenance Occupations by Sex
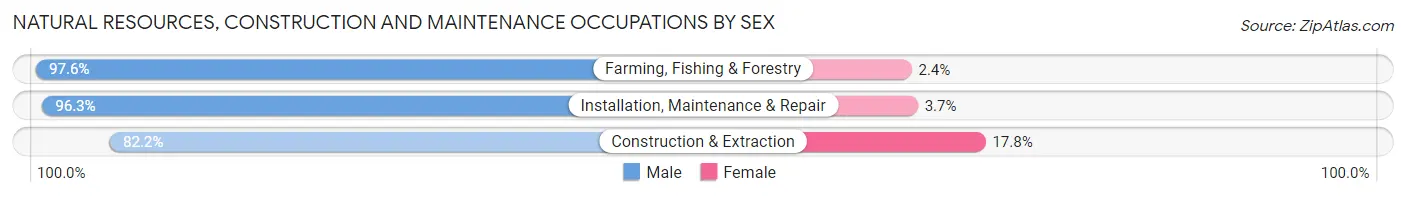
| Occupation | Male | Female |
| Farming, Fishing & Forestry | 405 (97.6%) | 10 (2.4%) |
| Construction & Extraction | 494 (82.2%) | 107 (17.8%) |
| Installation, Maintenance & Repair | 520 (96.3%) | 20 (3.7%) |
| Total (Category) | 1,419 (91.2%) | 137 (8.8%) |
| Total (Overall) | 4,750 (59.2%) | 3,279 (40.8%) |
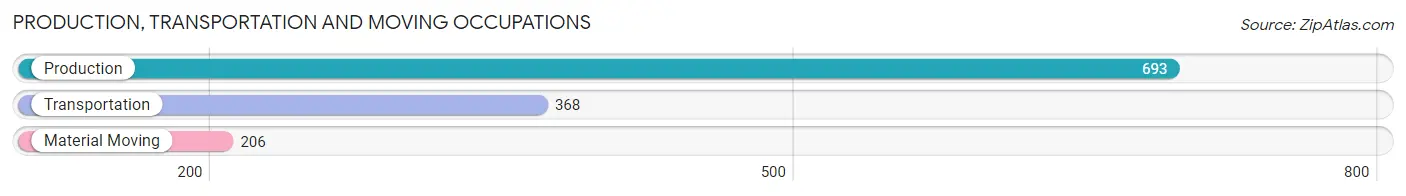
Production, Transportation and Moving Occupations
The most common Production, Transportation and Moving occupations in Willacy County are Production (693 | 8.6%), Transportation (368 | 4.6%), and Material Moving (206 | 2.6%).
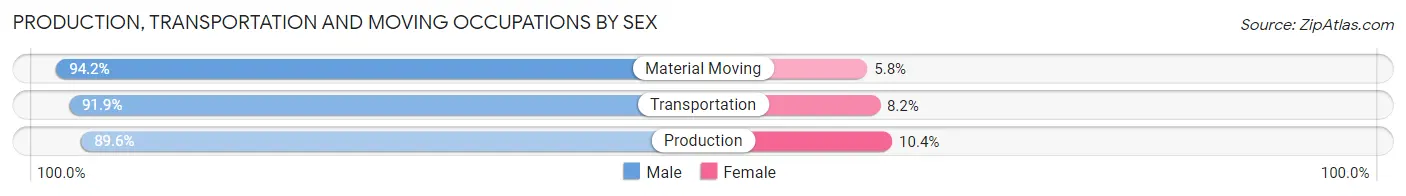
Production, Transportation and Moving Occupations by Sex
| Occupation | Male | Female |
| Production | 621 (89.6%) | 72 (10.4%) |
| Transportation | 338 (91.8%) | 30 (8.2%) |
| Material Moving | 194 (94.2%) | 12 (5.8%) |
| Total (Category) | 1,153 (91.0%) | 114 (9.0%) |
| Total (Overall) | 4,750 (59.2%) | 3,279 (40.8%) |
Employment Industries by Sex in Willacy County
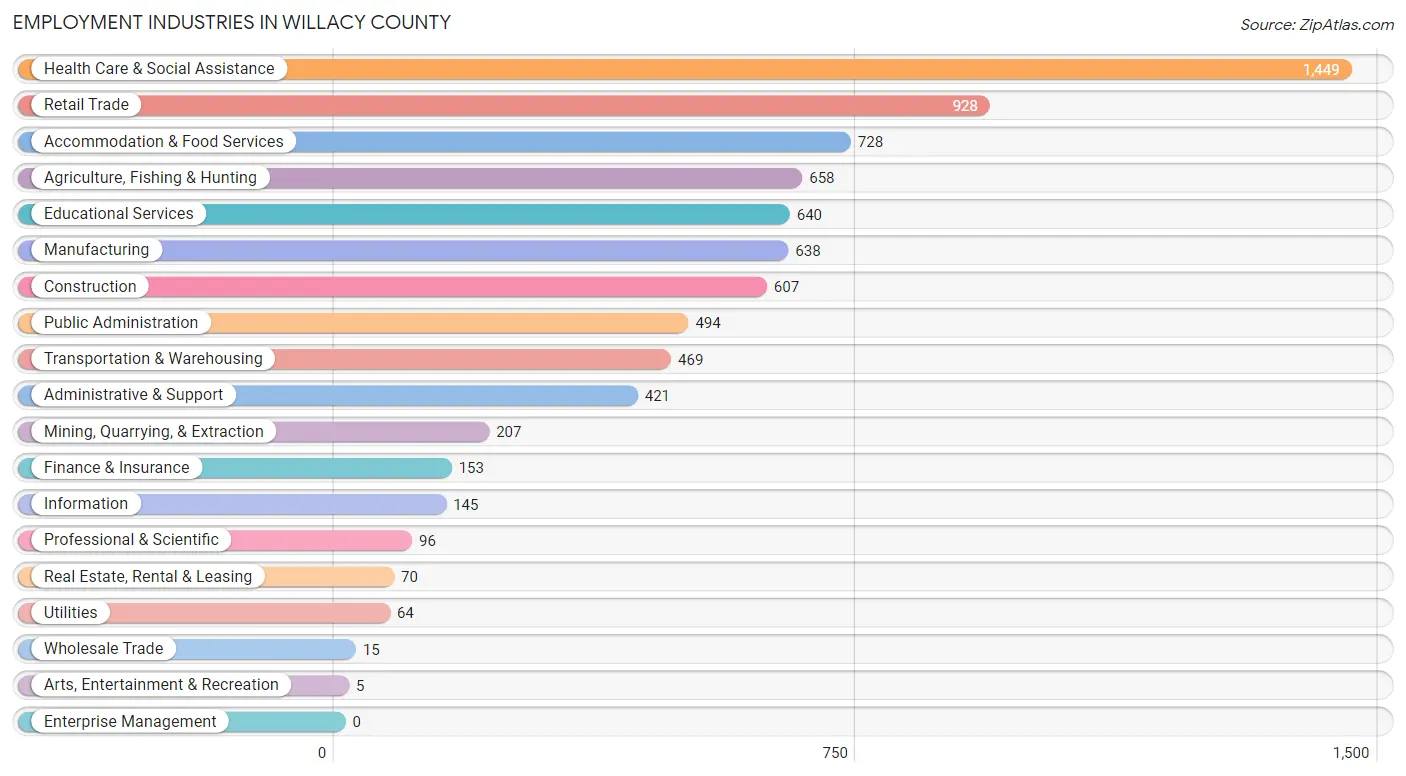
Employment Industries in Willacy County
The major employment industries in Willacy County include Health Care & Social Assistance (1,449 | 18.0%), Retail Trade (928 | 11.6%), Accommodation & Food Services (728 | 9.1%), Agriculture, Fishing & Hunting (658 | 8.2%), and Educational Services (640 | 8.0%).
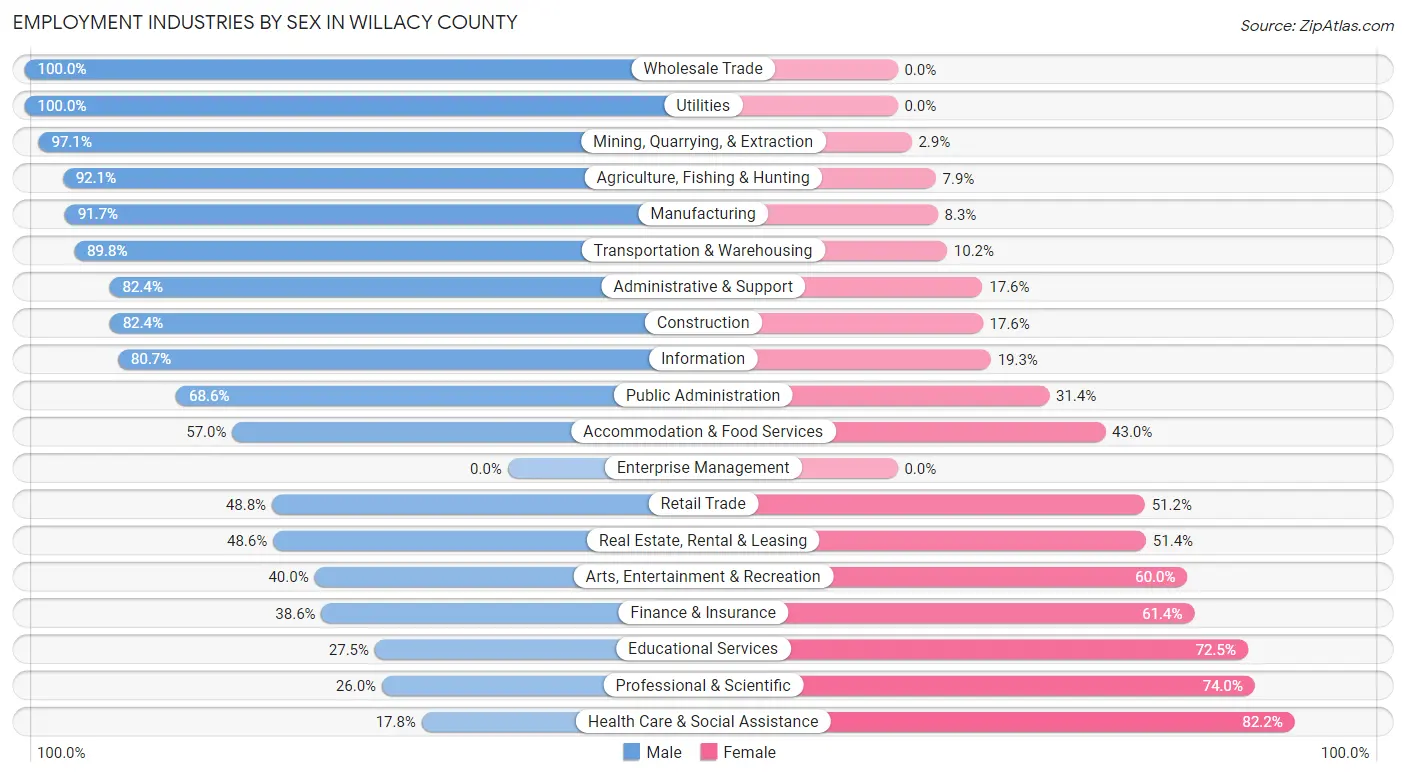
Employment Industries by Sex in Willacy County
The Willacy County industries that see more men than women are Wholesale Trade (100.0%), Utilities (100.0%), and Mining, Quarrying, & Extraction (97.1%), whereas the industries that tend to have a higher number of women are Health Care & Social Assistance (82.2%), Professional & Scientific (74.0%), and Educational Services (72.5%).
| Industry | Male | Female |
| Agriculture, Fishing & Hunting | 606 (92.1%) | 52 (7.9%) |
| Mining, Quarrying, & Extraction | 201 (97.1%) | 6 (2.9%) |
| Construction | 500 (82.4%) | 107 (17.6%) |
| Manufacturing | 585 (91.7%) | 53 (8.3%) |
| Wholesale Trade | 15 (100.0%) | 0 (0.0%) |
| Retail Trade | 453 (48.8%) | 475 (51.2%) |
| Transportation & Warehousing | 421 (89.8%) | 48 (10.2%) |
| Utilities | 64 (100.0%) | 0 (0.0%) |
| Information | 117 (80.7%) | 28 (19.3%) |
| Finance & Insurance | 59 (38.6%) | 94 (61.4%) |
| Real Estate, Rental & Leasing | 34 (48.6%) | 36 (51.4%) |
| Professional & Scientific | 25 (26.0%) | 71 (74.0%) |
| Enterprise Management | 0 (0.0%) | 0 (0.0%) |
| Administrative & Support | 347 (82.4%) | 74 (17.6%) |
| Educational Services | 176 (27.5%) | 464 (72.5%) |
| Health Care & Social Assistance | 258 (17.8%) | 1,191 (82.2%) |
| Arts, Entertainment & Recreation | 2 (40.0%) | 3 (60.0%) |
| Accommodation & Food Services | 415 (57.0%) | 313 (43.0%) |
| Public Administration | 339 (68.6%) | 155 (31.4%) |
| Total | 4,750 (59.2%) | 3,279 (40.8%) |
Education in Willacy County
School Enrollment in Willacy County
The most common levels of schooling among the 4,951 students in Willacy County are high school (1,313 | 26.5%), middle school (1,194 | 24.1%), and elementary school (1,043 | 21.1%).
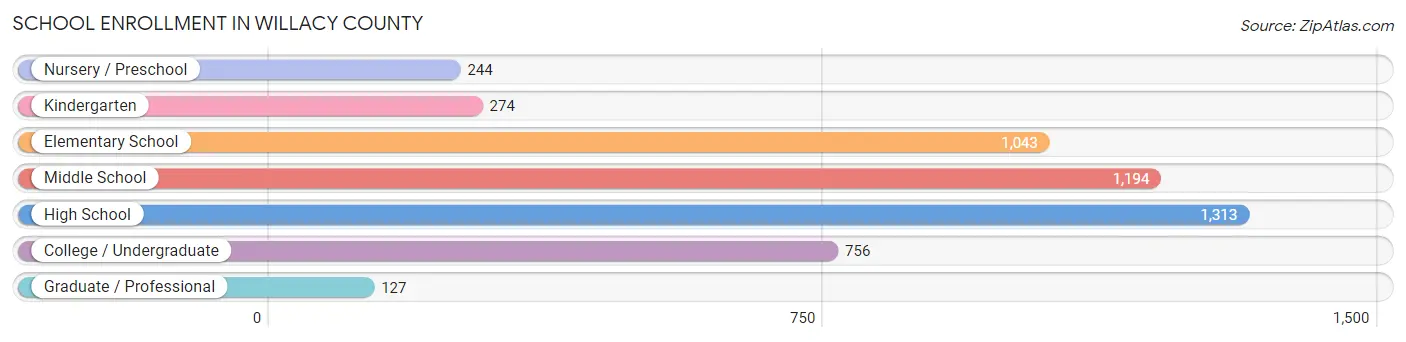
| School Level | # Students | % Students |
| Nursery / Preschool | 244 | 4.9% |
| Kindergarten | 274 | 5.5% |
| Elementary School | 1,043 | 21.1% |
| Middle School | 1,194 | 24.1% |
| High School | 1,313 | 26.5% |
| College / Undergraduate | 756 | 15.3% |
| Graduate / Professional | 127 | 2.6% |
| Total | 4,951 | 100.0% |
School Enrollment by Age by Funding Source in Willacy County
Out of a total of 4,951 students who are enrolled in schools in Willacy County, 163 (3.3%) attend a private institution, while the remaining 4,788 (96.7%) are enrolled in public schools. The age group of 3 to 4 year olds has the highest likelihood of being enrolled in private schools, with 42 (22.2% in the age bracket) enrolled. Conversely, the age group of 20 to 24 year olds has the lowest likelihood of being enrolled in a private school, with 488 (100.0% in the age bracket) attending a public institution.
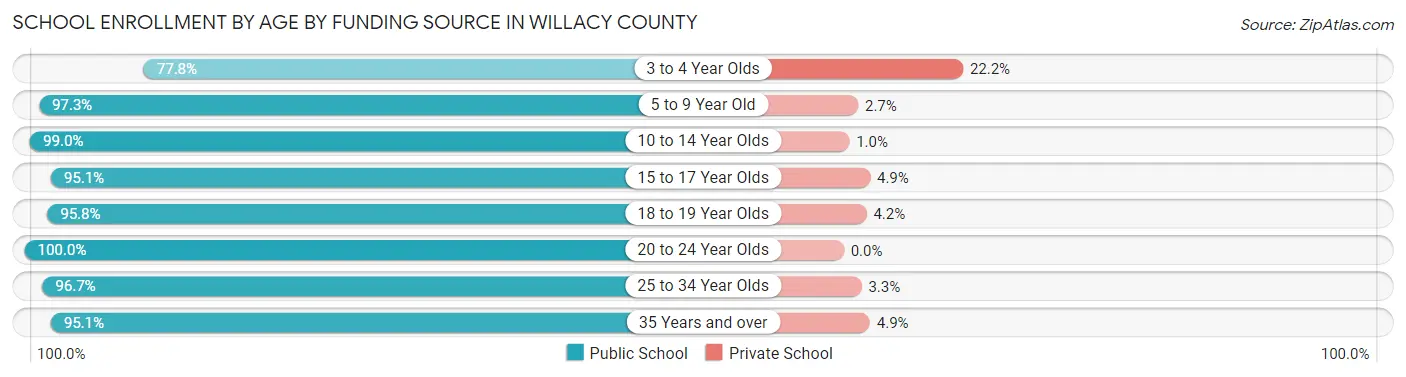
| Age Bracket | Public School | Private School |
| 3 to 4 Year Olds | 147 (77.8%) | 42 (22.2%) |
| 5 to 9 Year Old | 1,197 (97.3%) | 33 (2.7%) |
| 10 to 14 Year Olds | 1,423 (99.0%) | 15 (1.0%) |
| 15 to 17 Year Olds | 755 (95.1%) | 39 (4.9%) |
| 18 to 19 Year Olds | 497 (95.8%) | 22 (4.2%) |
| 20 to 24 Year Olds | 488 (100.0%) | 0 (0.0%) |
| 25 to 34 Year Olds | 204 (96.7%) | 7 (3.3%) |
| 35 Years and over | 78 (95.1%) | 4 (4.9%) |
| Total | 4,788 (96.7%) | 163 (3.3%) |
Educational Attainment by Field of Study in Willacy County
Education (406 | 28.7%), business (188 | 13.3%), bio, nature & agricultural (178 | 12.6%), science & technology (139 | 9.8%), and arts & humanities (105 | 7.4%) are the most common fields of study among 1,416 individuals in Willacy County who have obtained a bachelor's degree or higher.
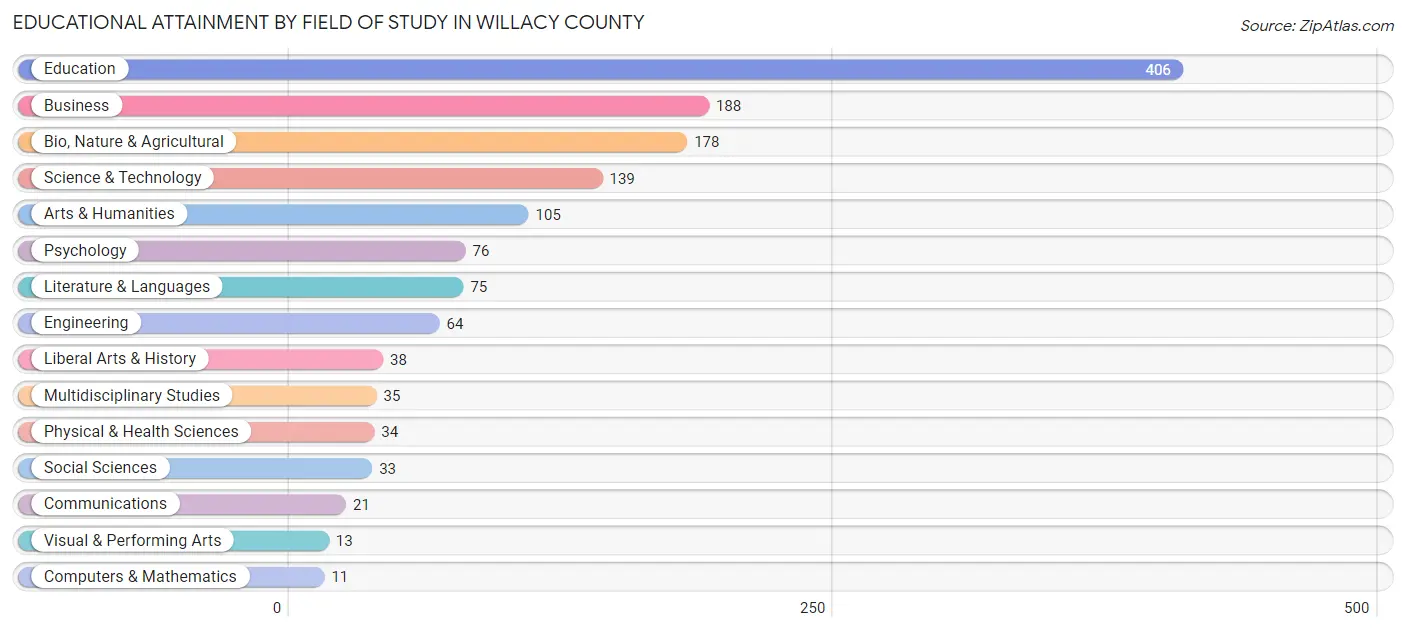
| Field of Study | # Graduates | % Graduates |
| Computers & Mathematics | 11 | 0.8% |
| Bio, Nature & Agricultural | 178 | 12.6% |
| Physical & Health Sciences | 34 | 2.4% |
| Psychology | 76 | 5.4% |
| Social Sciences | 33 | 2.3% |
| Engineering | 64 | 4.5% |
| Multidisciplinary Studies | 35 | 2.5% |
| Science & Technology | 139 | 9.8% |
| Business | 188 | 13.3% |
| Education | 406 | 28.7% |
| Literature & Languages | 75 | 5.3% |
| Liberal Arts & History | 38 | 2.7% |
| Visual & Performing Arts | 13 | 0.9% |
| Communications | 21 | 1.5% |
| Arts & Humanities | 105 | 7.4% |
| Total | 1,416 | 100.0% |
Transportation & Commute in Willacy County
Vehicle Availability by Sex in Willacy County
The most prevalent vehicle ownership categories in Willacy County are males with 2 vehicles (1,991, accounting for 42.2%) and females with 2 vehicles (1,263, making up 61.8%).
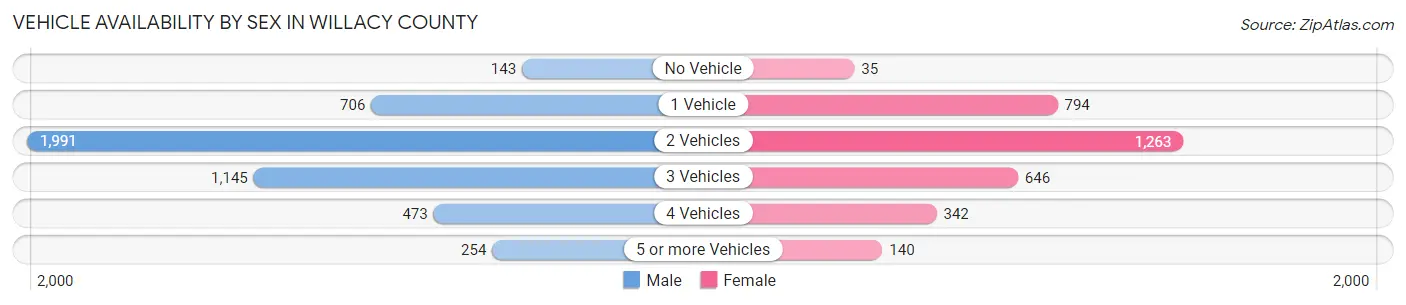
| Vehicles Available | Male | Female |
| No Vehicle | 143 (3.0%) | 35 (1.1%) |
| 1 Vehicle | 706 (15.0%) | 794 (24.7%) |
| 2 Vehicles | 1,991 (42.2%) | 1,263 (39.2%) |
| 3 Vehicles | 1,145 (24.3%) | 646 (20.1%) |
| 4 Vehicles | 473 (10.0%) | 342 (10.6%) |
| 5 or more Vehicles | 254 (5.4%) | 140 (4.3%) |
| Total | 4,712 (100.0%) | 3,220 (100.0%) |
Commute Time in Willacy County
The most frequently occuring commute durations in Willacy County are 5 to 9 minutes (1,864 commuters, 25.5%), 10 to 14 minutes (1,403 commuters, 19.2%), and 30 to 34 minutes (1,009 commuters, 13.8%).
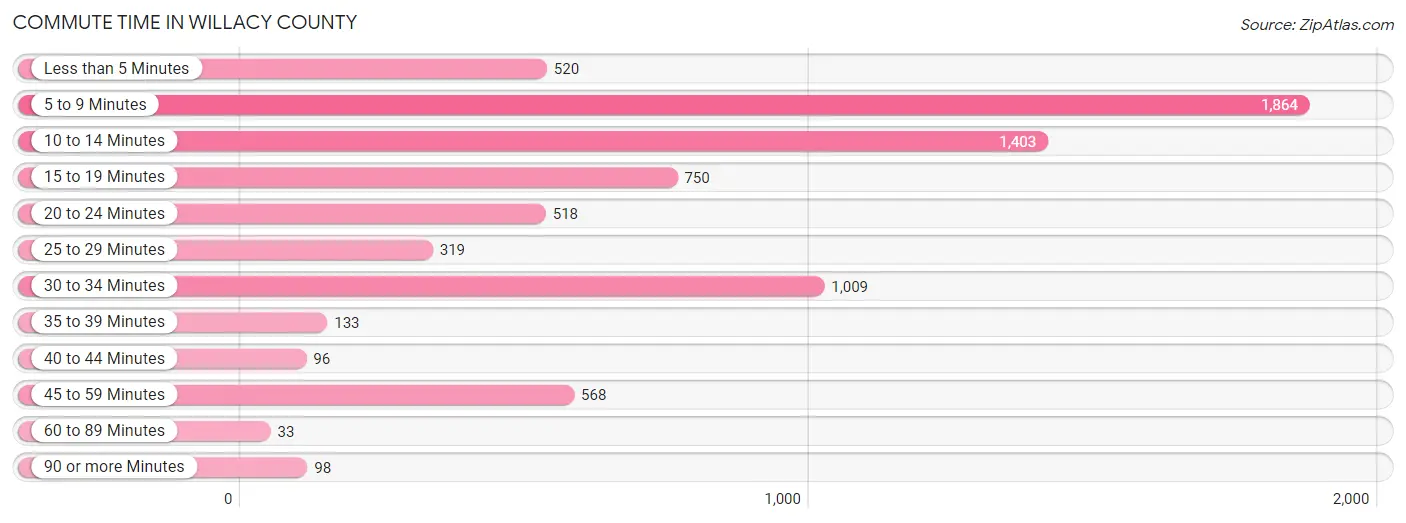
| Commute Time | # Commuters | % Commuters |
| Less than 5 Minutes | 520 | 7.1% |
| 5 to 9 Minutes | 1,864 | 25.5% |
| 10 to 14 Minutes | 1,403 | 19.2% |
| 15 to 19 Minutes | 750 | 10.3% |
| 20 to 24 Minutes | 518 | 7.1% |
| 25 to 29 Minutes | 319 | 4.4% |
| 30 to 34 Minutes | 1,009 | 13.8% |
| 35 to 39 Minutes | 133 | 1.8% |
| 40 to 44 Minutes | 96 | 1.3% |
| 45 to 59 Minutes | 568 | 7.8% |
| 60 to 89 Minutes | 33 | 0.4% |
| 90 or more Minutes | 98 | 1.3% |
Commute Time by Sex in Willacy County
The most common commute times in Willacy County are 5 to 9 minutes (1,022 commuters, 22.6%) for males and 5 to 9 minutes (842 commuters, 30.2%) for females.
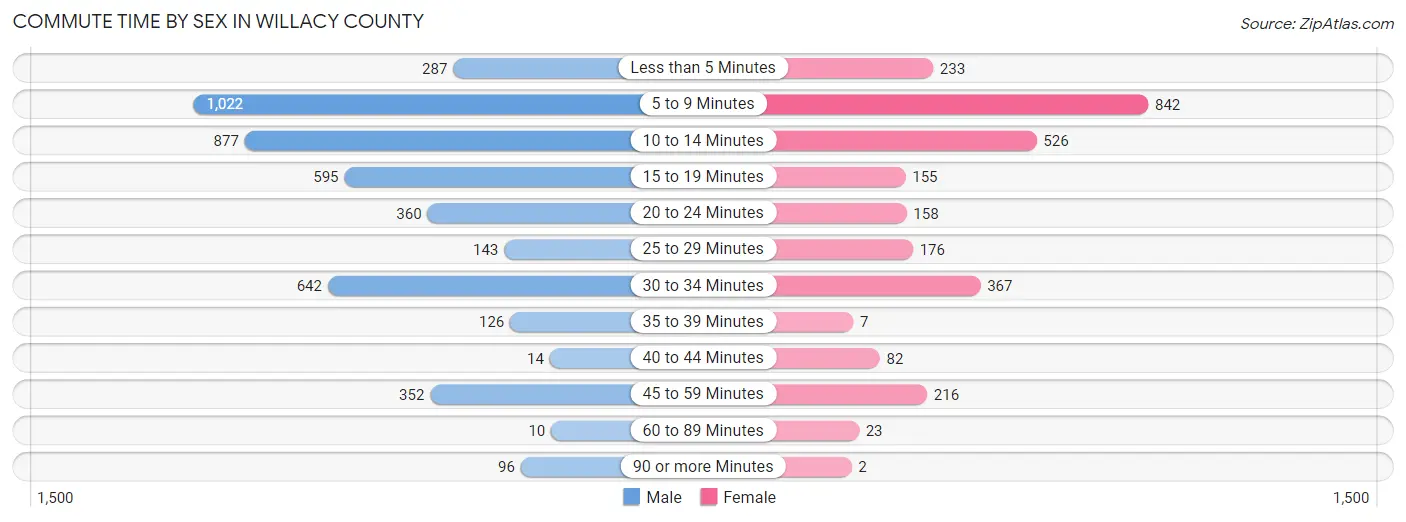
| Commute Time | Male | Female |
| Less than 5 Minutes | 287 (6.3%) | 233 (8.4%) |
| 5 to 9 Minutes | 1,022 (22.6%) | 842 (30.2%) |
| 10 to 14 Minutes | 877 (19.4%) | 526 (18.9%) |
| 15 to 19 Minutes | 595 (13.2%) | 155 (5.6%) |
| 20 to 24 Minutes | 360 (8.0%) | 158 (5.7%) |
| 25 to 29 Minutes | 143 (3.2%) | 176 (6.3%) |
| 30 to 34 Minutes | 642 (14.2%) | 367 (13.2%) |
| 35 to 39 Minutes | 126 (2.8%) | 7 (0.3%) |
| 40 to 44 Minutes | 14 (0.3%) | 82 (2.9%) |
| 45 to 59 Minutes | 352 (7.8%) | 216 (7.7%) |
| 60 to 89 Minutes | 10 (0.2%) | 23 (0.8%) |
| 90 or more Minutes | 96 (2.1%) | 2 (0.1%) |
Time of Departure to Work by Sex in Willacy County
The most frequent times of departure to work in Willacy County are 7:00 AM to 7:29 AM (736, 16.3%) for males and 7:30 AM to 7:59 AM (405, 14.5%) for females.
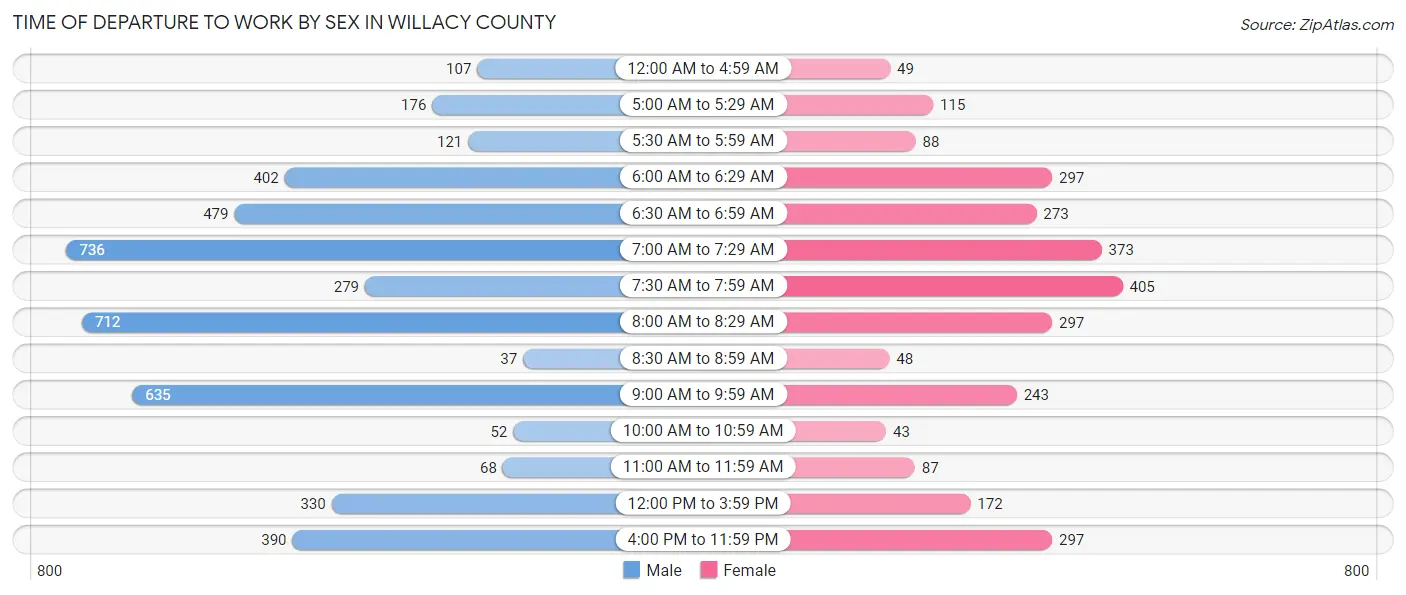
| Time of Departure | Male | Female |
| 12:00 AM to 4:59 AM | 107 (2.4%) | 49 (1.8%) |
| 5:00 AM to 5:29 AM | 176 (3.9%) | 115 (4.1%) |
| 5:30 AM to 5:59 AM | 121 (2.7%) | 88 (3.2%) |
| 6:00 AM to 6:29 AM | 402 (8.9%) | 297 (10.7%) |
| 6:30 AM to 6:59 AM | 479 (10.6%) | 273 (9.8%) |
| 7:00 AM to 7:29 AM | 736 (16.3%) | 373 (13.4%) |
| 7:30 AM to 7:59 AM | 279 (6.2%) | 405 (14.5%) |
| 8:00 AM to 8:29 AM | 712 (15.7%) | 297 (10.7%) |
| 8:30 AM to 8:59 AM | 37 (0.8%) | 48 (1.7%) |
| 9:00 AM to 9:59 AM | 635 (14.0%) | 243 (8.7%) |
| 10:00 AM to 10:59 AM | 52 (1.1%) | 43 (1.5%) |
| 11:00 AM to 11:59 AM | 68 (1.5%) | 87 (3.1%) |
| 12:00 PM to 3:59 PM | 330 (7.3%) | 172 (6.2%) |
| 4:00 PM to 11:59 PM | 390 (8.6%) | 297 (10.7%) |
| Total | 4,524 (100.0%) | 2,787 (100.0%) |
Housing Occupancy in Willacy County
Occupancy by Ownership in Willacy County
Of the total 5,414 dwellings in Willacy County, owner-occupied units account for 3,743 (69.1%), while renter-occupied units make up 1,671 (30.9%).
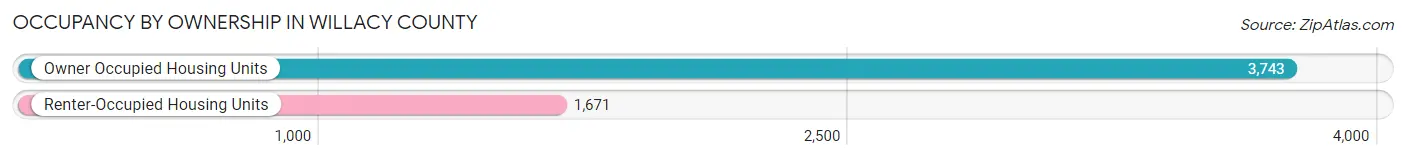
| Occupancy | # Housing Units | % Housing Units |
| Owner Occupied Housing Units | 3,743 | 69.1% |
| Renter-Occupied Housing Units | 1,671 | 30.9% |
| Total Occupied Housing Units | 5,414 | 100.0% |
Occupancy by Household Size in Willacy County
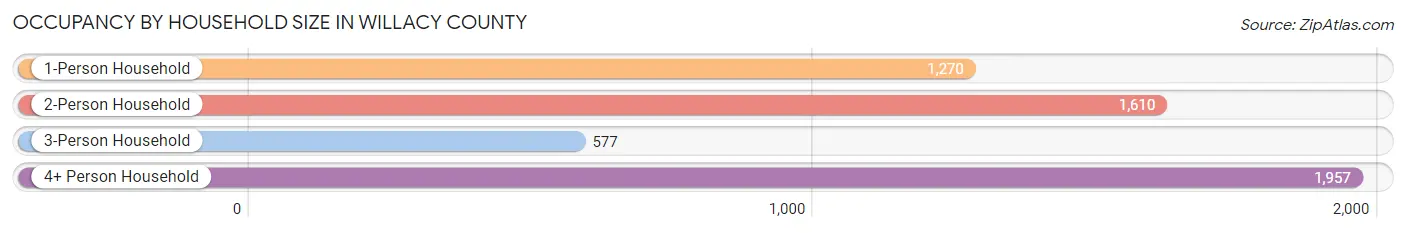
| Household Size | # Housing Units | % Housing Units |
| 1-Person Household | 1,270 | 23.5% |
| 2-Person Household | 1,610 | 29.7% |
| 3-Person Household | 577 | 10.7% |
| 4+ Person Household | 1,957 | 36.1% |
| Total Housing Units | 5,414 | 100.0% |
Occupancy by Ownership by Household Size in Willacy County
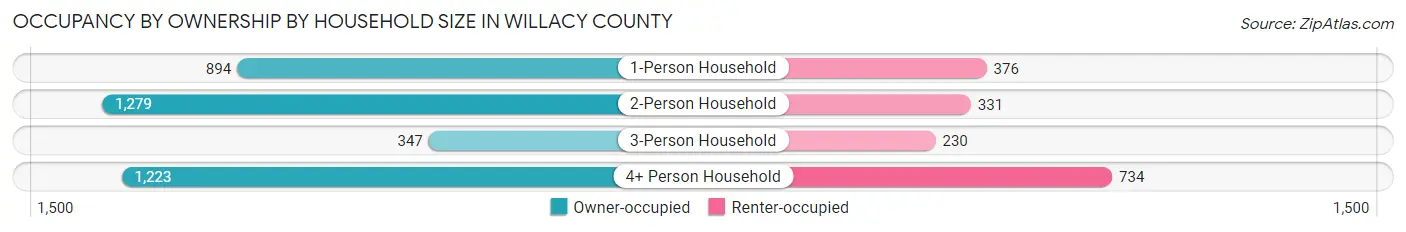
| Household Size | Owner-occupied | Renter-occupied |
| 1-Person Household | 894 (70.4%) | 376 (29.6%) |
| 2-Person Household | 1,279 (79.4%) | 331 (20.6%) |
| 3-Person Household | 347 (60.1%) | 230 (39.9%) |
| 4+ Person Household | 1,223 (62.5%) | 734 (37.5%) |
| Total Housing Units | 3,743 (69.1%) | 1,671 (30.9%) |
Occupancy by Educational Attainment in Willacy County
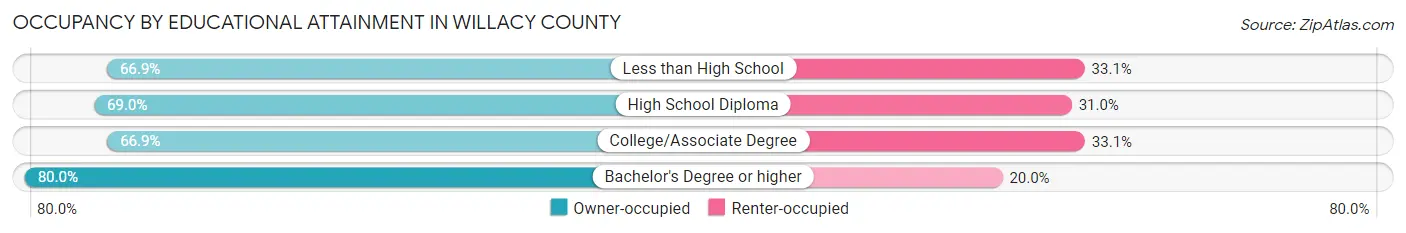
| Household Size | Owner-occupied | Renter-occupied |
| Less than High School | 1,190 (66.9%) | 588 (33.1%) |
| High School Diploma | 1,139 (69.0%) | 512 (31.0%) |
| College/Associate Degree | 887 (66.9%) | 439 (33.1%) |
| Bachelor's Degree or higher | 527 (80.0%) | 132 (20.0%) |
Occupancy by Age of Householder in Willacy County
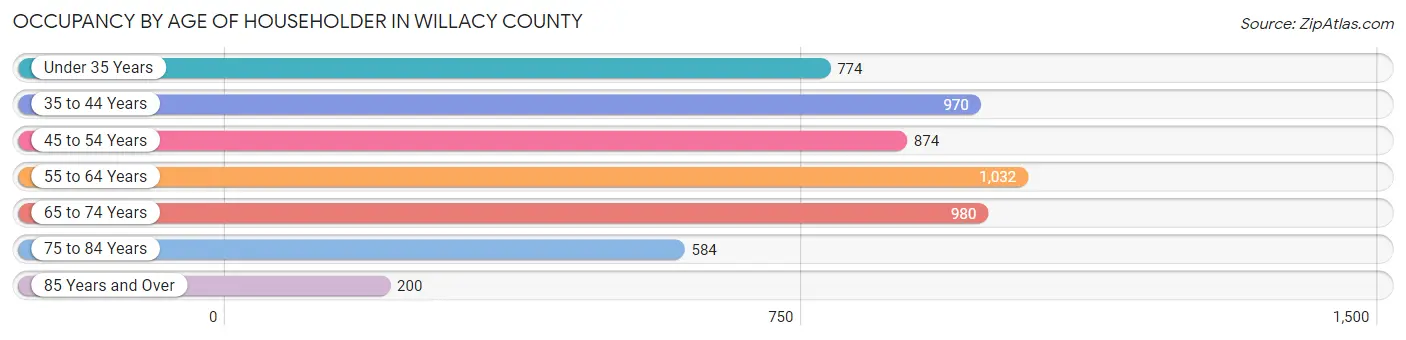
| Age Bracket | # Households | % Households |
| Under 35 Years | 774 | 14.3% |
| 35 to 44 Years | 970 | 17.9% |
| 45 to 54 Years | 874 | 16.1% |
| 55 to 64 Years | 1,032 | 19.1% |
| 65 to 74 Years | 980 | 18.1% |
| 75 to 84 Years | 584 | 10.8% |
| 85 Years and Over | 200 | 3.7% |
| Total | 5,414 | 100.0% |
Housing Finances in Willacy County
Median Income by Occupancy in Willacy County
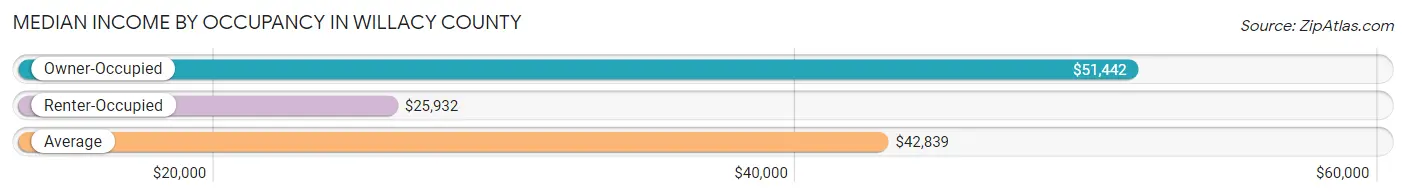
| Occupancy Type | # Households | Median Income |
| Owner-Occupied | 3,743 (69.1%) | $51,442 |
| Renter-Occupied | 1,671 (30.9%) | $25,932 |
| Average | 5,414 (100.0%) | $42,839 |
Occupancy by Householder Income Bracket in Willacy County
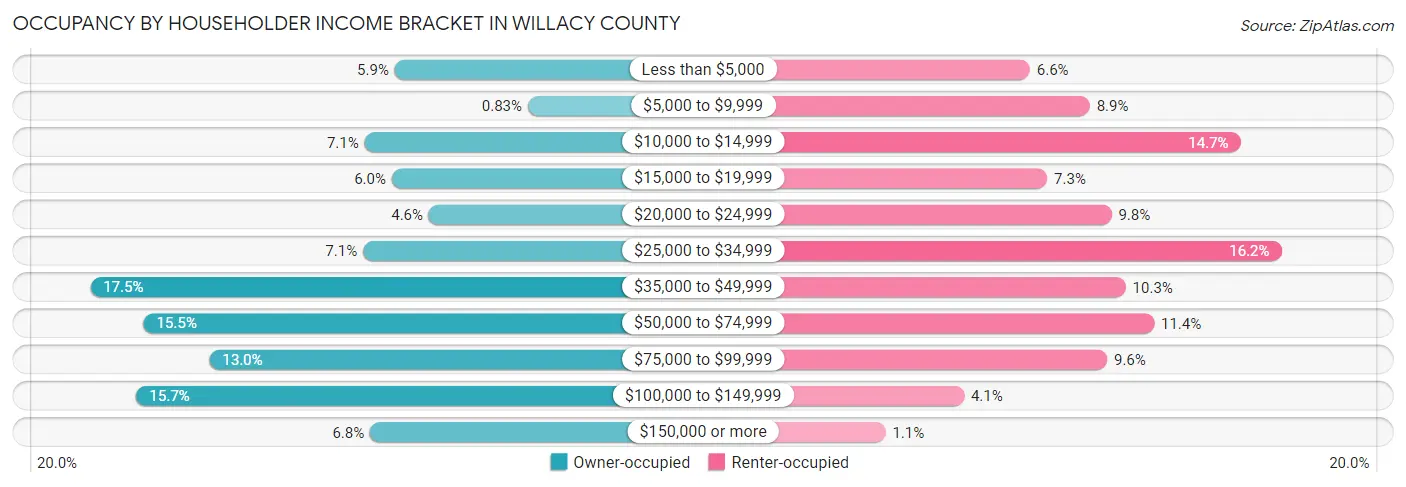
| Income Bracket | Owner-occupied | Renter-occupied |
| Less than $5,000 | 221 (5.9%) | 111 (6.6%) |
| $5,000 to $9,999 | 31 (0.8%) | 149 (8.9%) |
| $10,000 to $14,999 | 264 (7.0%) | 245 (14.7%) |
| $15,000 to $19,999 | 225 (6.0%) | 122 (7.3%) |
| $20,000 to $24,999 | 172 (4.6%) | 163 (9.8%) |
| $25,000 to $34,999 | 266 (7.1%) | 271 (16.2%) |
| $35,000 to $49,999 | 655 (17.5%) | 172 (10.3%) |
| $50,000 to $74,999 | 579 (15.5%) | 190 (11.4%) |
| $75,000 to $99,999 | 485 (13.0%) | 160 (9.6%) |
| $100,000 to $149,999 | 589 (15.7%) | 69 (4.1%) |
| $150,000 or more | 256 (6.8%) | 19 (1.1%) |
| Total | 3,743 (100.0%) | 1,671 (100.0%) |
Monthly Housing Cost Tiers in Willacy County
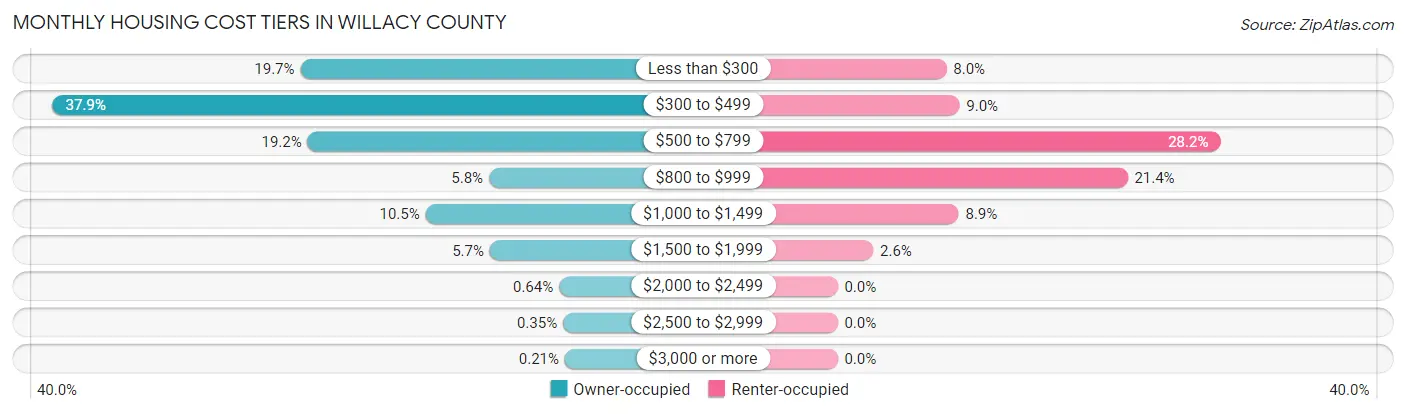
| Monthly Cost | Owner-occupied | Renter-occupied |
| Less than $300 | 737 (19.7%) | 134 (8.0%) |
| $300 to $499 | 1,420 (37.9%) | 150 (9.0%) |
| $500 to $799 | 717 (19.2%) | 471 (28.2%) |
| $800 to $999 | 217 (5.8%) | 357 (21.4%) |
| $1,000 to $1,499 | 392 (10.5%) | 149 (8.9%) |
| $1,500 to $1,999 | 215 (5.7%) | 44 (2.6%) |
| $2,000 to $2,499 | 24 (0.6%) | 0 (0.0%) |
| $2,500 to $2,999 | 13 (0.4%) | 0 (0.0%) |
| $3,000 or more | 8 (0.2%) | 0 (0.0%) |
| Total | 3,743 (100.0%) | 1,671 (100.0%) |
Physical Housing Characteristics in Willacy County
Housing Structures in Willacy County
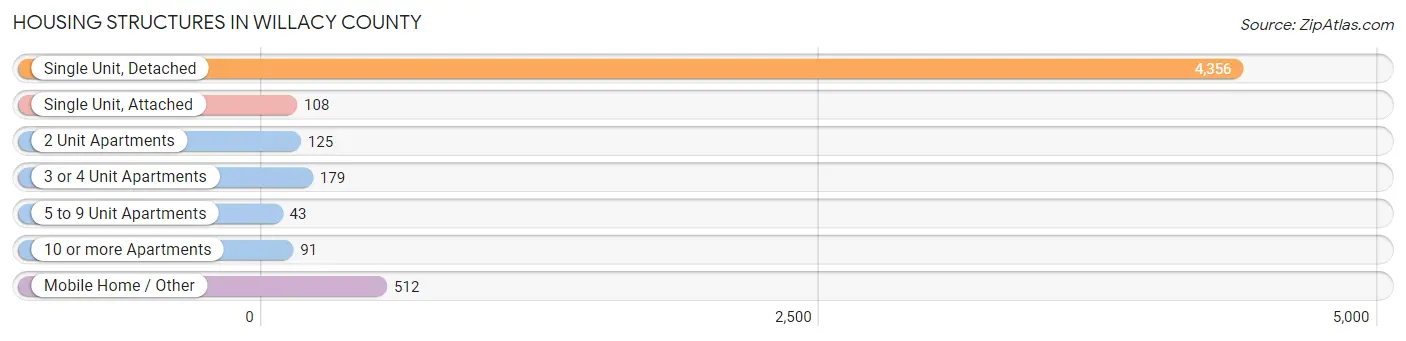
| Structure Type | # Housing Units | % Housing Units |
| Single Unit, Detached | 4,356 | 80.5% |
| Single Unit, Attached | 108 | 2.0% |
| 2 Unit Apartments | 125 | 2.3% |
| 3 or 4 Unit Apartments | 179 | 3.3% |
| 5 to 9 Unit Apartments | 43 | 0.8% |
| 10 or more Apartments | 91 | 1.7% |
| Mobile Home / Other | 512 | 9.5% |
| Total | 5,414 | 100.0% |
Housing Structures by Occupancy in Willacy County
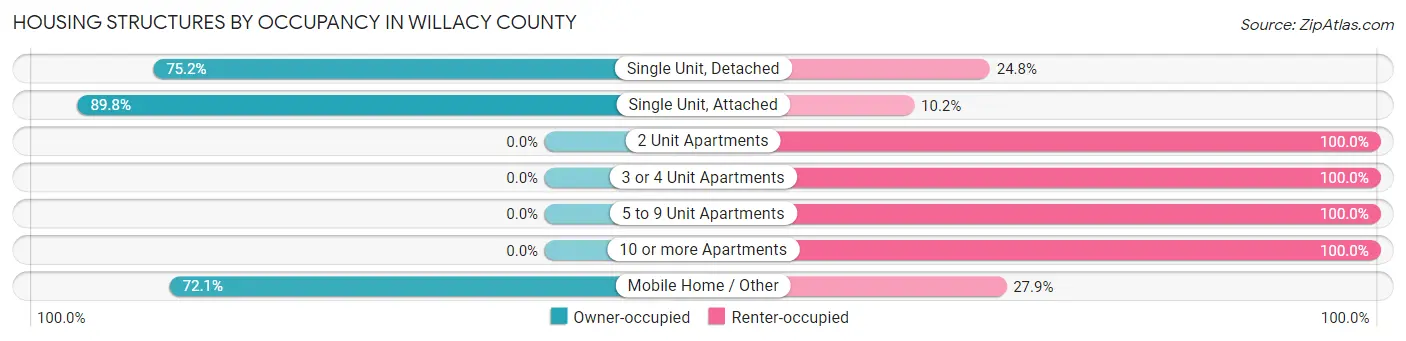
| Structure Type | Owner-occupied | Renter-occupied |
| Single Unit, Detached | 3,277 (75.2%) | 1,079 (24.8%) |
| Single Unit, Attached | 97 (89.8%) | 11 (10.2%) |
| 2 Unit Apartments | 0 (0.0%) | 125 (100.0%) |
| 3 or 4 Unit Apartments | 0 (0.0%) | 179 (100.0%) |
| 5 to 9 Unit Apartments | 0 (0.0%) | 43 (100.0%) |
| 10 or more Apartments | 0 (0.0%) | 91 (100.0%) |
| Mobile Home / Other | 369 (72.1%) | 143 (27.9%) |
| Total | 3,743 (69.1%) | 1,671 (30.9%) |
Housing Structures by Number of Rooms in Willacy County
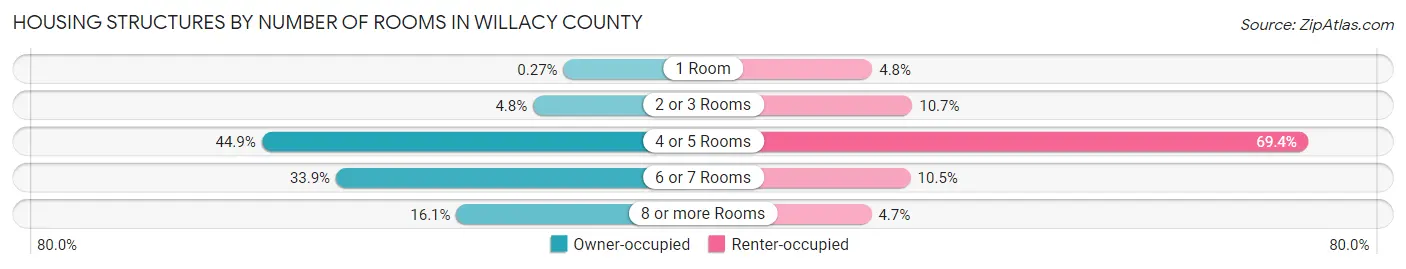
| Number of Rooms | Owner-occupied | Renter-occupied |
| 1 Room | 10 (0.3%) | 80 (4.8%) |
| 2 or 3 Rooms | 178 (4.8%) | 179 (10.7%) |
| 4 or 5 Rooms | 1,682 (44.9%) | 1,159 (69.4%) |
| 6 or 7 Rooms | 1,270 (33.9%) | 175 (10.5%) |
| 8 or more Rooms | 603 (16.1%) | 78 (4.7%) |
| Total | 3,743 (100.0%) | 1,671 (100.0%) |
Housing Structure by Heating Type in Willacy County
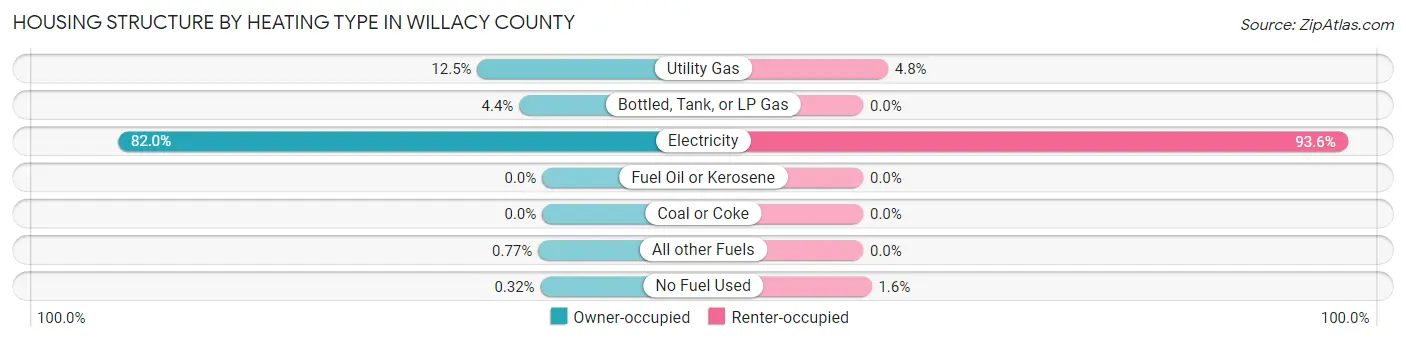
| Heating Type | Owner-occupied | Renter-occupied |
| Utility Gas | 468 (12.5%) | 80 (4.8%) |
| Bottled, Tank, or LP Gas | 166 (4.4%) | 0 (0.0%) |
| Electricity | 3,068 (82.0%) | 1,564 (93.6%) |
| Fuel Oil or Kerosene | 0 (0.0%) | 0 (0.0%) |
| Coal or Coke | 0 (0.0%) | 0 (0.0%) |
| All other Fuels | 29 (0.8%) | 0 (0.0%) |
| No Fuel Used | 12 (0.3%) | 27 (1.6%) |
| Total | 3,743 (100.0%) | 1,671 (100.0%) |
Household Vehicle Usage in Willacy County
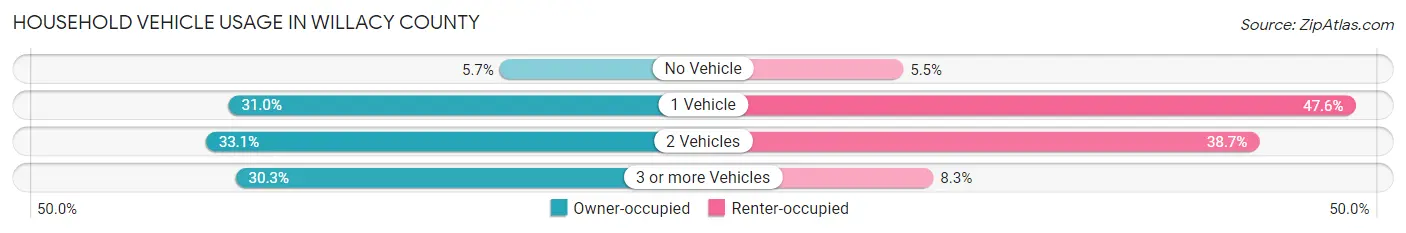
| Vehicles per Household | Owner-occupied | Renter-occupied |
| No Vehicle | 212 (5.7%) | 91 (5.4%) |
| 1 Vehicle | 1,159 (31.0%) | 796 (47.6%) |
| 2 Vehicles | 1,238 (33.1%) | 646 (38.7%) |
| 3 or more Vehicles | 1,134 (30.3%) | 138 (8.3%) |
| Total | 3,743 (100.0%) | 1,671 (100.0%) |
Real Estate & Mortgages in Willacy County
Real Estate and Mortgage Overview in Willacy County
| Characteristic | Without Mortgage | With Mortgage |
| Housing Units | 2,854 | 889 |
| Median Property Value | $54,000 | $115,600 |
| Median Household Income | $45,450 | $155 |
| Monthly Housing Costs | $373 | $8 |
| Real Estate Taxes | $954 | $20 |
Property Value by Mortgage Status in Willacy County
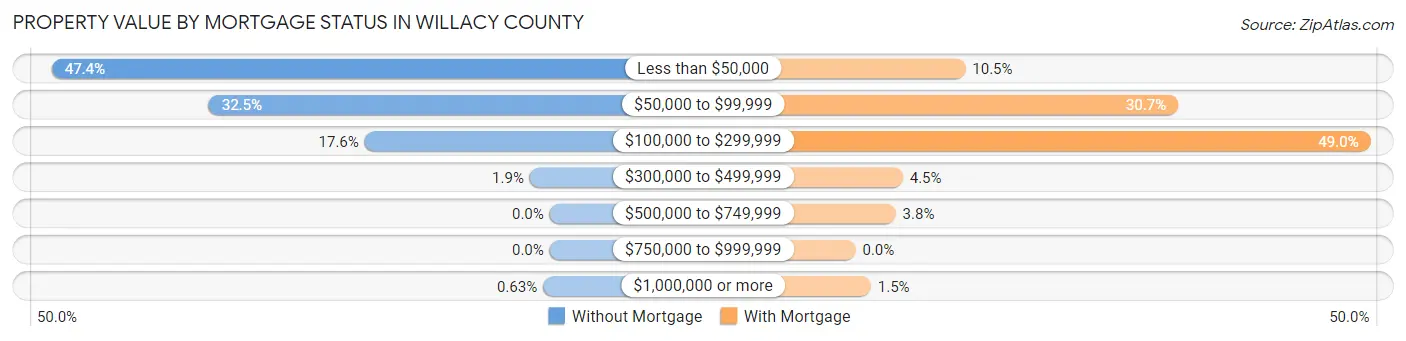
| Property Value | Without Mortgage | With Mortgage |
| Less than $50,000 | 1,353 (47.4%) | 93 (10.5%) |
| $50,000 to $99,999 | 926 (32.5%) | 273 (30.7%) |
| $100,000 to $299,999 | 503 (17.6%) | 436 (49.0%) |
| $300,000 to $499,999 | 54 (1.9%) | 40 (4.5%) |
| $500,000 to $749,999 | 0 (0.0%) | 34 (3.8%) |
| $750,000 to $999,999 | 0 (0.0%) | 0 (0.0%) |
| $1,000,000 or more | 18 (0.6%) | 13 (1.5%) |
| Total | 2,854 (100.0%) | 889 (100.0%) |
Household Income by Mortgage Status in Willacy County
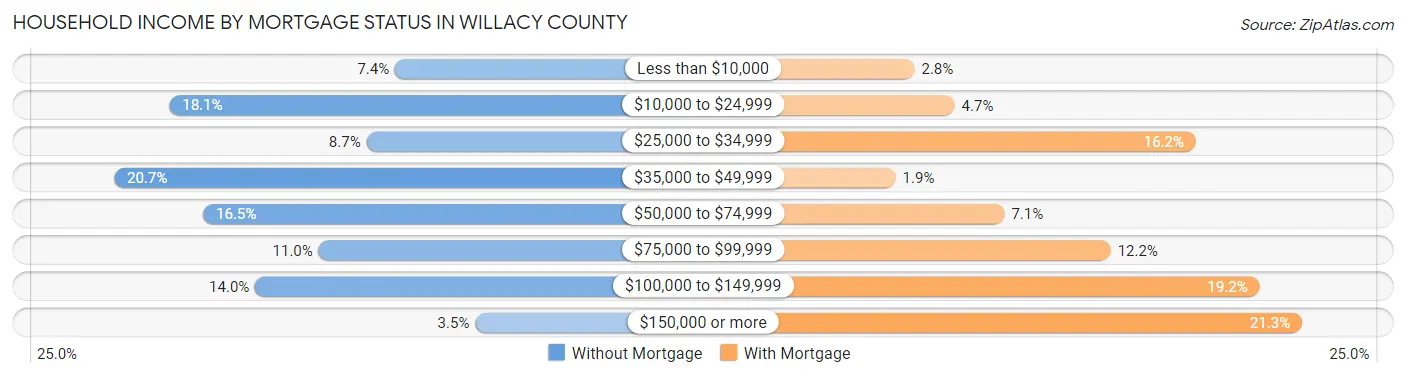
| Household Income | Without Mortgage | With Mortgage |
| Less than $10,000 | 210 (7.4%) | 25 (2.8%) |
| $10,000 to $24,999 | 517 (18.1%) | 42 (4.7%) |
| $25,000 to $34,999 | 249 (8.7%) | 144 (16.2%) |
| $35,000 to $49,999 | 592 (20.7%) | 17 (1.9%) |
| $50,000 to $74,999 | 471 (16.5%) | 63 (7.1%) |
| $75,000 to $99,999 | 314 (11.0%) | 108 (12.1%) |
| $100,000 to $149,999 | 400 (14.0%) | 171 (19.2%) |
| $150,000 or more | 101 (3.5%) | 189 (21.3%) |
| Total | 2,854 (100.0%) | 889 (100.0%) |
Property Value to Household Income Ratio in Willacy County
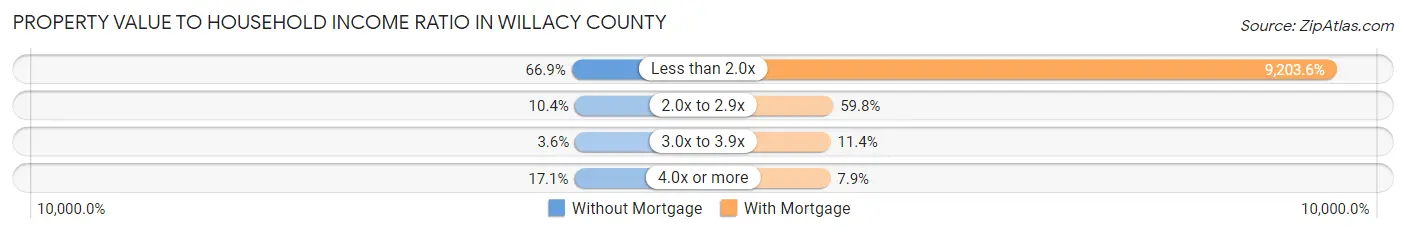
| Value-to-Income Ratio | Without Mortgage | With Mortgage |
| Less than 2.0x | 1,908 (66.8%) | 81,820 (9,203.6%) |
| 2.0x to 2.9x | 298 (10.4%) | 532 (59.8%) |
| 3.0x to 3.9x | 103 (3.6%) | 101 (11.4%) |
| 4.0x or more | 487 (17.1%) | 70 (7.9%) |
| Total | 2,854 (100.0%) | 889 (100.0%) |
Real Estate Taxes by Mortgage Status in Willacy County
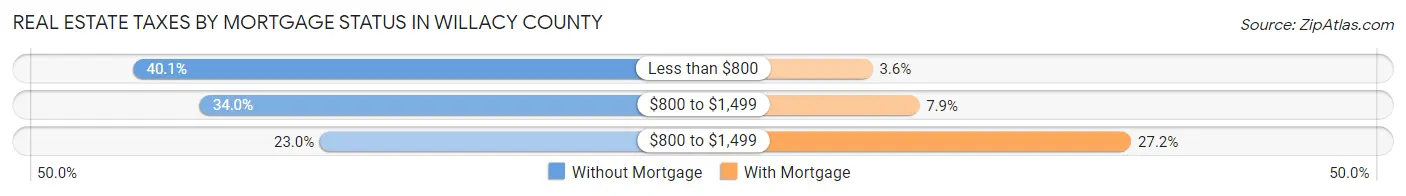
| Property Taxes | Without Mortgage | With Mortgage |
| Less than $800 | 1,143 (40.1%) | 32 (3.6%) |
| $800 to $1,499 | 970 (34.0%) | 70 (7.9%) |
| $800 to $1,499 | 657 (23.0%) | 242 (27.2%) |
| Total | 2,854 (100.0%) | 889 (100.0%) |
Health & Disability in Willacy County
Health Insurance Coverage by Age in Willacy County
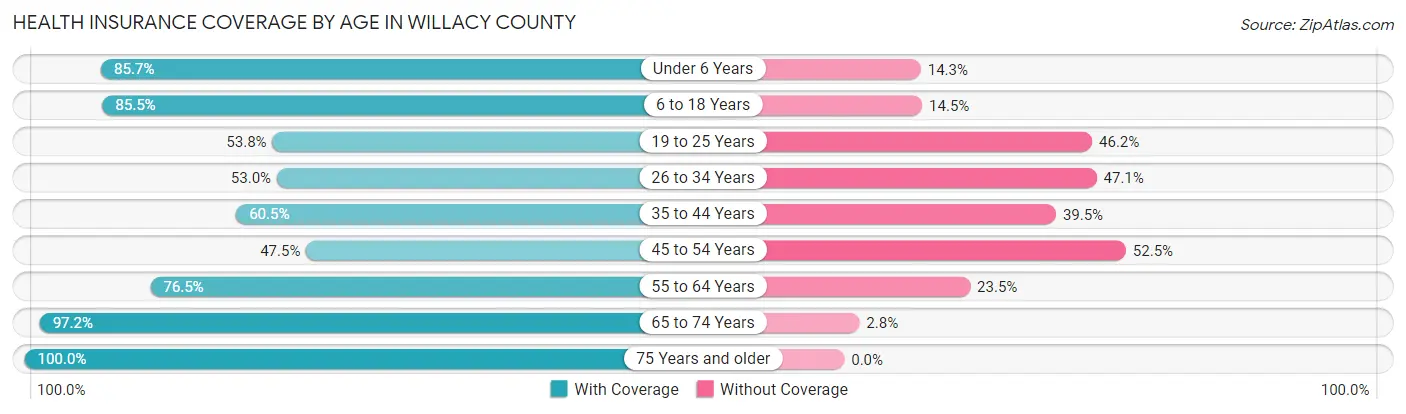
| Age Bracket | With Coverage | Without Coverage |
| Under 6 Years | 1,209 (85.7%) | 201 (14.3%) |
| 6 to 18 Years | 3,420 (85.5%) | 581 (14.5%) |
| 19 to 25 Years | 1,065 (53.8%) | 915 (46.2%) |
| 26 to 34 Years | 1,309 (52.9%) | 1,163 (47.0%) |
| 35 to 44 Years | 1,411 (60.5%) | 920 (39.5%) |
| 45 to 54 Years | 1,037 (47.5%) | 1,147 (52.5%) |
| 55 to 64 Years | 1,386 (76.5%) | 425 (23.5%) |
| 65 to 74 Years | 1,583 (97.2%) | 46 (2.8%) |
| 75 Years and older | 1,245 (100.0%) | 0 (0.0%) |
| Total | 13,665 (71.7%) | 5,398 (28.3%) |
Health Insurance Coverage by Citizenship Status in Willacy County
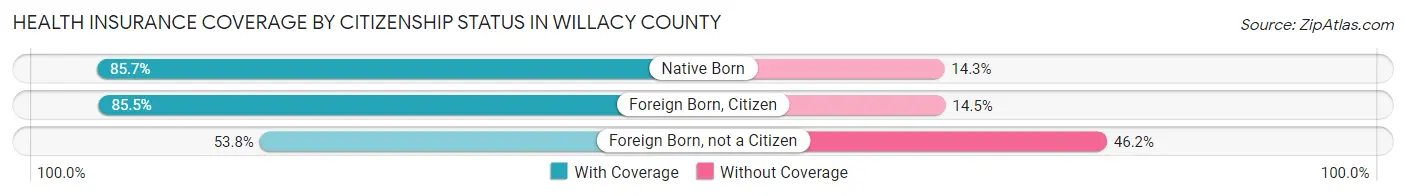
| Citizenship Status | With Coverage | Without Coverage |
| Native Born | 1,209 (85.7%) | 201 (14.3%) |
| Foreign Born, Citizen | 3,420 (85.5%) | 581 (14.5%) |
| Foreign Born, not a Citizen | 1,065 (53.8%) | 915 (46.2%) |
Health Insurance Coverage by Household Income in Willacy County
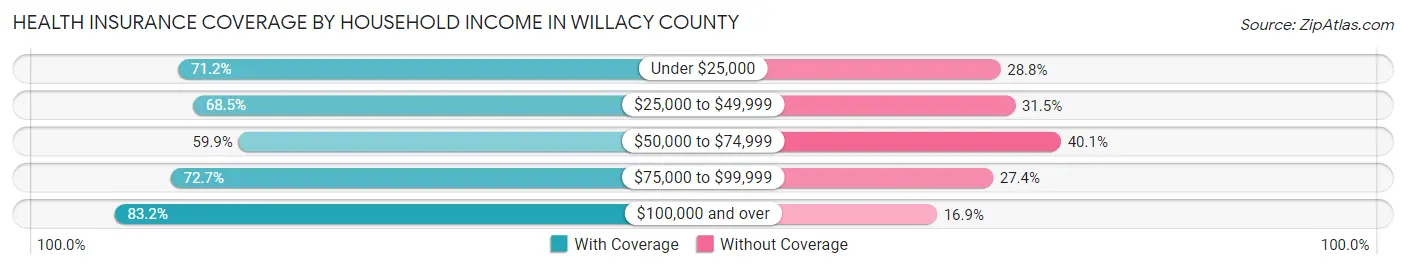
| Household Income | With Coverage | Without Coverage |
| Under $25,000 | 2,628 (71.2%) | 1,061 (28.8%) |
| $25,000 to $49,999 | 3,717 (68.5%) | 1,710 (31.5%) |
| $50,000 to $74,999 | 1,800 (59.9%) | 1,204 (40.1%) |
| $75,000 to $99,999 | 1,732 (72.7%) | 652 (27.4%) |
| $100,000 and over | 3,779 (83.2%) | 766 (16.9%) |
Public vs Private Health Insurance Coverage by Age in Willacy County
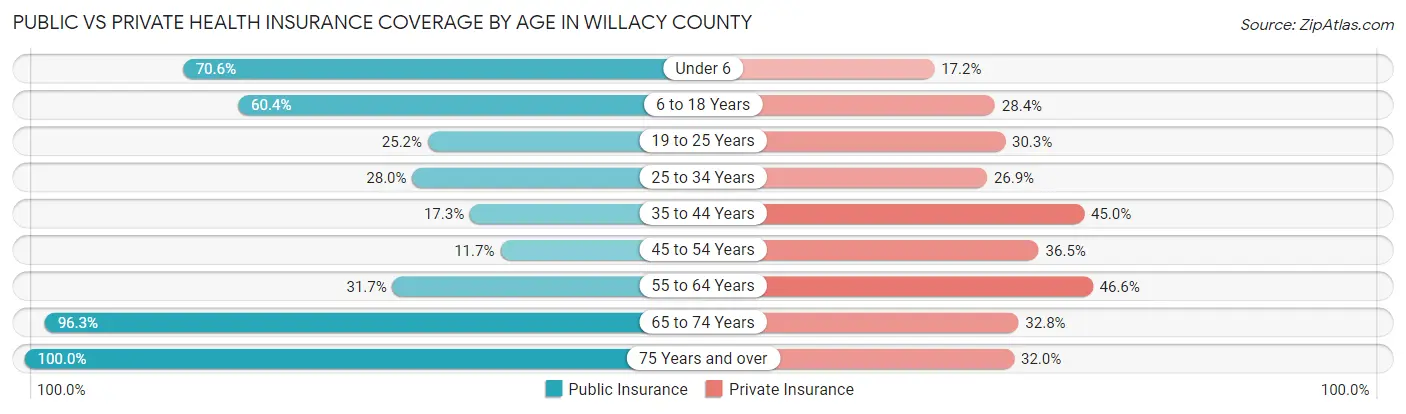
| Age Bracket | Public Insurance | Private Insurance |
| Under 6 | 996 (70.6%) | 242 (17.2%) |
| 6 to 18 Years | 2,415 (60.4%) | 1,137 (28.4%) |
| 19 to 25 Years | 498 (25.2%) | 600 (30.3%) |
| 25 to 34 Years | 693 (28.0%) | 666 (26.9%) |
| 35 to 44 Years | 404 (17.3%) | 1,048 (45.0%) |
| 45 to 54 Years | 256 (11.7%) | 798 (36.5%) |
| 55 to 64 Years | 574 (31.7%) | 843 (46.6%) |
| 65 to 74 Years | 1,568 (96.3%) | 534 (32.8%) |
| 75 Years and over | 1,245 (100.0%) | 398 (32.0%) |
| Total | 8,649 (45.4%) | 6,266 (32.9%) |
Disability Status by Sex by Age in Willacy County
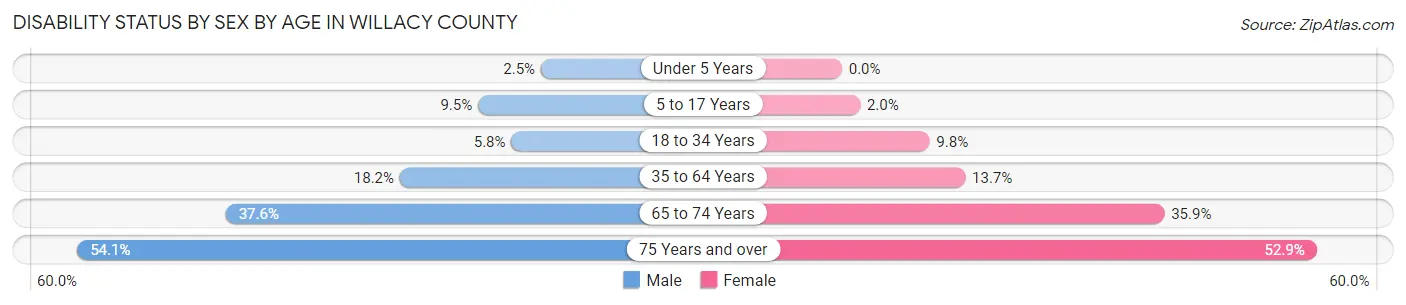
| Age Bracket | Male | Female |
| Under 5 Years | 15 (2.5%) | 0 (0.0%) |
| 5 to 17 Years | 173 (9.5%) | 37 (2.0%) |
| 18 to 34 Years | 173 (5.8%) | 194 (9.8%) |
| 35 to 64 Years | 595 (18.2%) | 420 (13.7%) |
| 65 to 74 Years | 291 (37.6%) | 307 (35.9%) |
| 75 Years and over | 288 (54.1%) | 377 (52.9%) |
Disability Class by Sex by Age in Willacy County
Disability Class: Hearing Difficulty
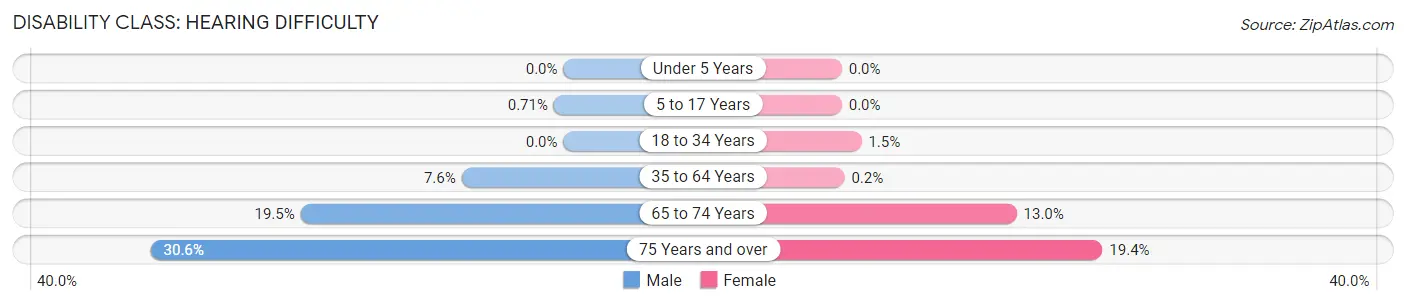
| Age Bracket | Male | Female |
| Under 5 Years | 0 (0.0%) | 0 (0.0%) |
| 5 to 17 Years | 13 (0.7%) | 0 (0.0%) |
| 18 to 34 Years | 0 (0.0%) | 29 (1.5%) |
| 35 to 64 Years | 247 (7.6%) | 6 (0.2%) |
| 65 to 74 Years | 151 (19.5%) | 111 (13.0%) |
| 75 Years and over | 163 (30.6%) | 138 (19.4%) |
Disability Class: Vision Difficulty
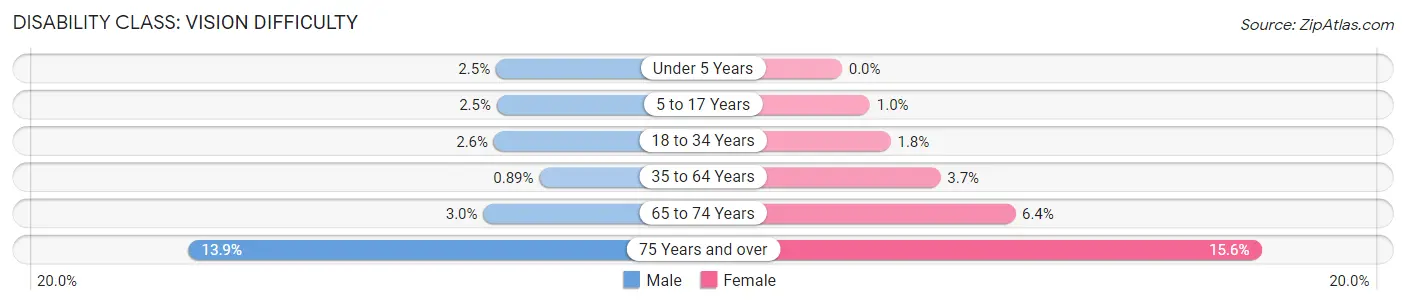
| Age Bracket | Male | Female |
| Under 5 Years | 15 (2.5%) | 0 (0.0%) |
| 5 to 17 Years | 45 (2.5%) | 19 (1.0%) |
| 18 to 34 Years | 77 (2.6%) | 36 (1.8%) |
| 35 to 64 Years | 29 (0.9%) | 112 (3.7%) |
| 65 to 74 Years | 23 (3.0%) | 55 (6.4%) |
| 75 Years and over | 74 (13.9%) | 111 (15.6%) |
Disability Class: Cognitive Difficulty
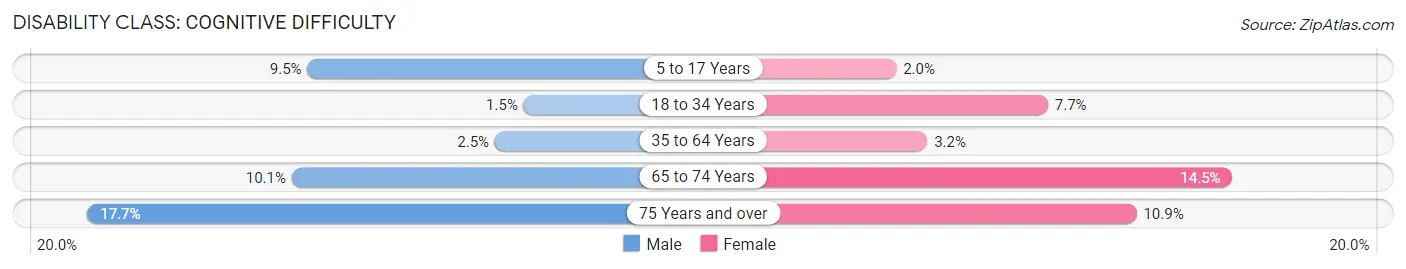
| Age Bracket | Male | Female |
| 5 to 17 Years | 173 (9.5%) | 37 (2.0%) |
| 18 to 34 Years | 44 (1.5%) | 152 (7.6%) |
| 35 to 64 Years | 83 (2.5%) | 97 (3.2%) |
| 65 to 74 Years | 78 (10.1%) | 124 (14.5%) |
| 75 Years and over | 94 (17.7%) | 78 (10.9%) |
Disability Class: Ambulatory Difficulty
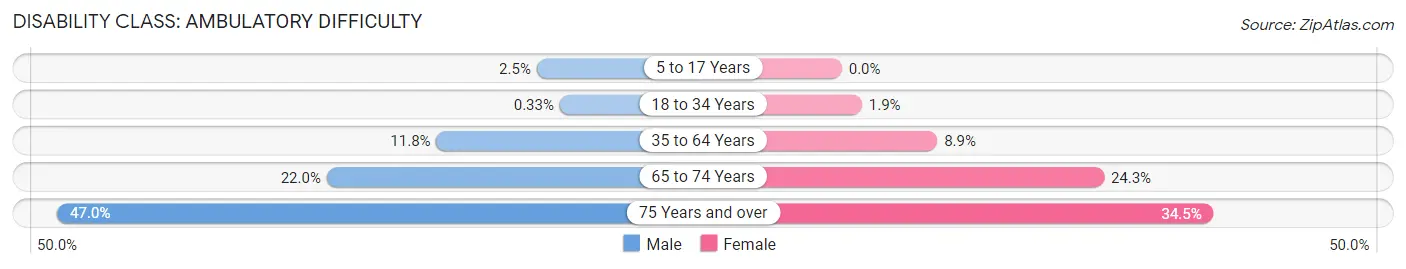
| Age Bracket | Male | Female |
| 5 to 17 Years | 45 (2.5%) | 0 (0.0%) |
| 18 to 34 Years | 10 (0.3%) | 37 (1.9%) |
| 35 to 64 Years | 385 (11.8%) | 271 (8.9%) |
| 65 to 74 Years | 170 (22.0%) | 208 (24.3%) |
| 75 Years and over | 250 (47.0%) | 246 (34.5%) |
Disability Class: Self-Care Difficulty
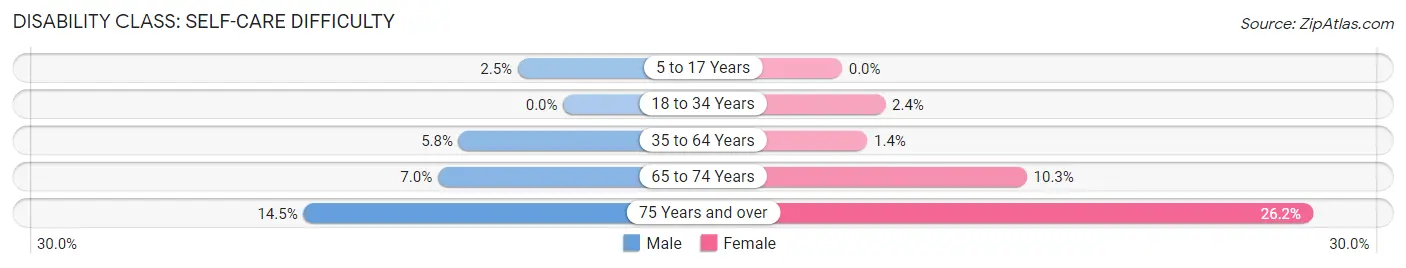
| Age Bracket | Male | Female |
| 5 to 17 Years | 46 (2.5%) | 0 (0.0%) |
| 18 to 34 Years | 0 (0.0%) | 48 (2.4%) |
| 35 to 64 Years | 190 (5.8%) | 43 (1.4%) |
| 65 to 74 Years | 54 (7.0%) | 88 (10.3%) |
| 75 Years and over | 77 (14.5%) | 187 (26.2%) |
Technology Access in Willacy County
Computing Device Access in Willacy County
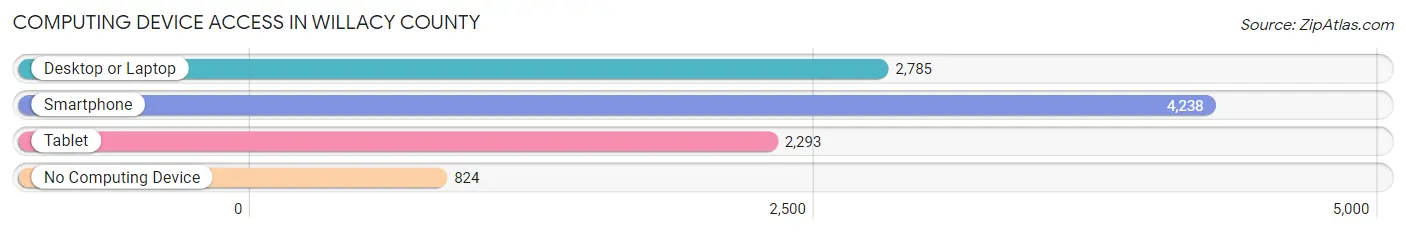
| Device Type | # Households | % Households |
| Desktop or Laptop | 2,785 | 51.4% |
| Smartphone | 4,238 | 78.3% |
| Tablet | 2,293 | 42.3% |
| No Computing Device | 824 | 15.2% |
| Total | 5,414 | 100.0% |
Internet Access in Willacy County
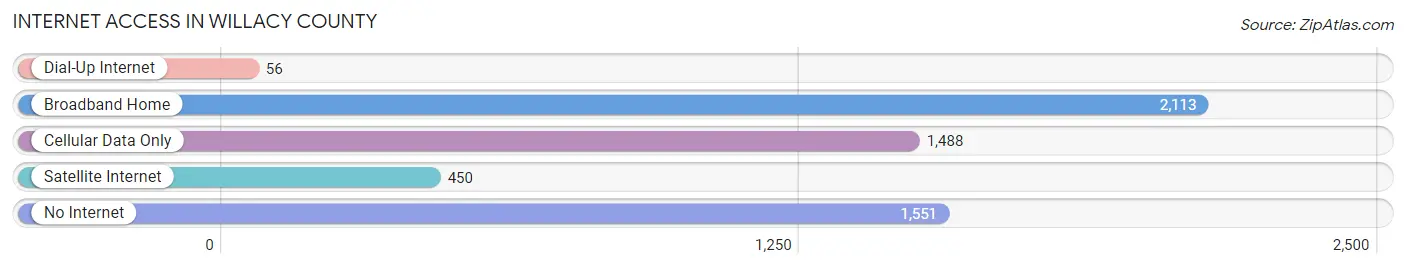
| Internet Type | # Households | % Households |
| Dial-Up Internet | 56 | 1.0% |
| Broadband Home | 2,113 | 39.0% |
| Cellular Data Only | 1,488 | 27.5% |
| Satellite Internet | 450 | 8.3% |
| No Internet | 1,551 | 28.6% |
| Total | 5,414 | 100.0% |
Willacy County Summary
Willacy County is located in the Rio Grande Valley of South Texas, along the Gulf of Mexico. It is bordered by Cameron County to the east, Kenedy County to the south, and Hidalgo County to the west. The county seat is Raymondville, and the largest city is Raymondville. As of the 2010 census, the population was 22,134.
History
Willacy County was created in 1911 from parts of Cameron and Hidalgo counties. It was named for Colonel William L. Willacy, a Texas Ranger who fought in the Mexican-American War.
The county was originally home to the Karankawa Indians, who were later displaced by Spanish settlers. The area was part of the Nueces Strip, a disputed area between Mexico and the United States. After the Mexican-American War, the area became part of the United States.
In the early 1900s, the area was settled by farmers and ranchers. The county was officially organized in 1911, and the first county seat was located in San Perlita. In 1913, the county seat was moved to Raymondville.
Geography
Willacy County is located in the Rio Grande Valley of South Texas, along the Gulf of Mexico. It is bordered by Cameron County to the east, Kenedy County to the south, and Hidalgo County to the west. The county has a total area of 877 square miles, of which 876 square miles is land and 1 square mile is water.
The terrain of Willacy County is mostly flat, with some rolling hills. The soil is mostly sandy loam, with some areas of clay. The climate is subtropical, with hot summers and mild winters.
Economy
The economy of Willacy County is largely based on agriculture. The main crops are cotton, sorghum, corn, and vegetables. Livestock production is also important, with cattle, hogs, and poultry being the main animals raised.
The county is also home to several oil and gas fields, and there is some manufacturing in the area. The county is served by the Port of Brownsville, which is located in nearby Cameron County.
Demographics
As of the 2010 census, there were 22,134 people, 6,845 households, and 5,072 families living in Willacy County. The population density was 25.2 people per square mile. The racial makeup of the county was 77.3% White, 0.7% African American, 0.5% Native American, 0.2% Asian, 0.1% Pacific Islander, 19.3% from other races, and 2.0% from two or more races. Hispanic or Latino of any race were 88.2% of the population.
The median income for a household in the county was $25,945, and the median income for a family was $30,945. The per capita income for the county was $11,845. About 24.3% of families and 28.7% of the population were below the poverty line, including 37.2% of those under age 18 and 24.2% of those age 65 or over.
Common Questions
What is Per Capita Income in Willacy County?
Per Capita income in Willacy County is $20,229.
What is the Median Family Income in Willacy County?
Median Family Income in Willacy County is $50,023.
What is the Median Household income in Willacy County?
Median Household Income in Willacy County is $42,839.
What is Income or Wage Gap in Willacy County?
Income or Wage Gap in Willacy County is 40.6%.
Women in Willacy County earn 59.4 cents for every dollar earned by a man.
What is Family Income Deficit in Willacy County?
Family Income Deficit in Willacy County is $10,411.
Families that are below poverty line in Willacy County earn $10,411 less on average than the poverty threshold level.
What is Inequality or Gini Index in Willacy County?
Inequality or Gini Index in Willacy County is 0.47.
What is the Total Population of Willacy County?
Total Population of Willacy County is 20,308.
What is the Total Male Population of Willacy County?
Total Male Population of Willacy County is 11,047.
What is the Total Female Population of Willacy County?
Total Female Population of Willacy County is 9,261.
What is the Ratio of Males per 100 Females in Willacy County?
There are 119.29 Males per 100 Females in Willacy County.
What is the Ratio of Females per 100 Males in Willacy County?
There are 83.83 Females per 100 Males in Willacy County.
What is the Median Population Age in Willacy County?
Median Population Age in Willacy County is 33.7 Years.
What is the Average Family Size in Willacy County
Average Family Size in Willacy County is 4.2 People.
What is the Average Household Size in Willacy County
Average Household Size in Willacy County is 3.5 People.
How Large is the Labor Force in Willacy County?
There are 8,793 People in the Labor Forcein in Willacy County.
What is the Percentage of People in the Labor Force in Willacy County?
55.3% of People are in the Labor Force in Willacy County.
What is the Unemployment Rate in Willacy County?
Unemployment Rate in Willacy County is 8.7%.