Wilbarger County, TX Map & Demographics
Wilbarger County Map
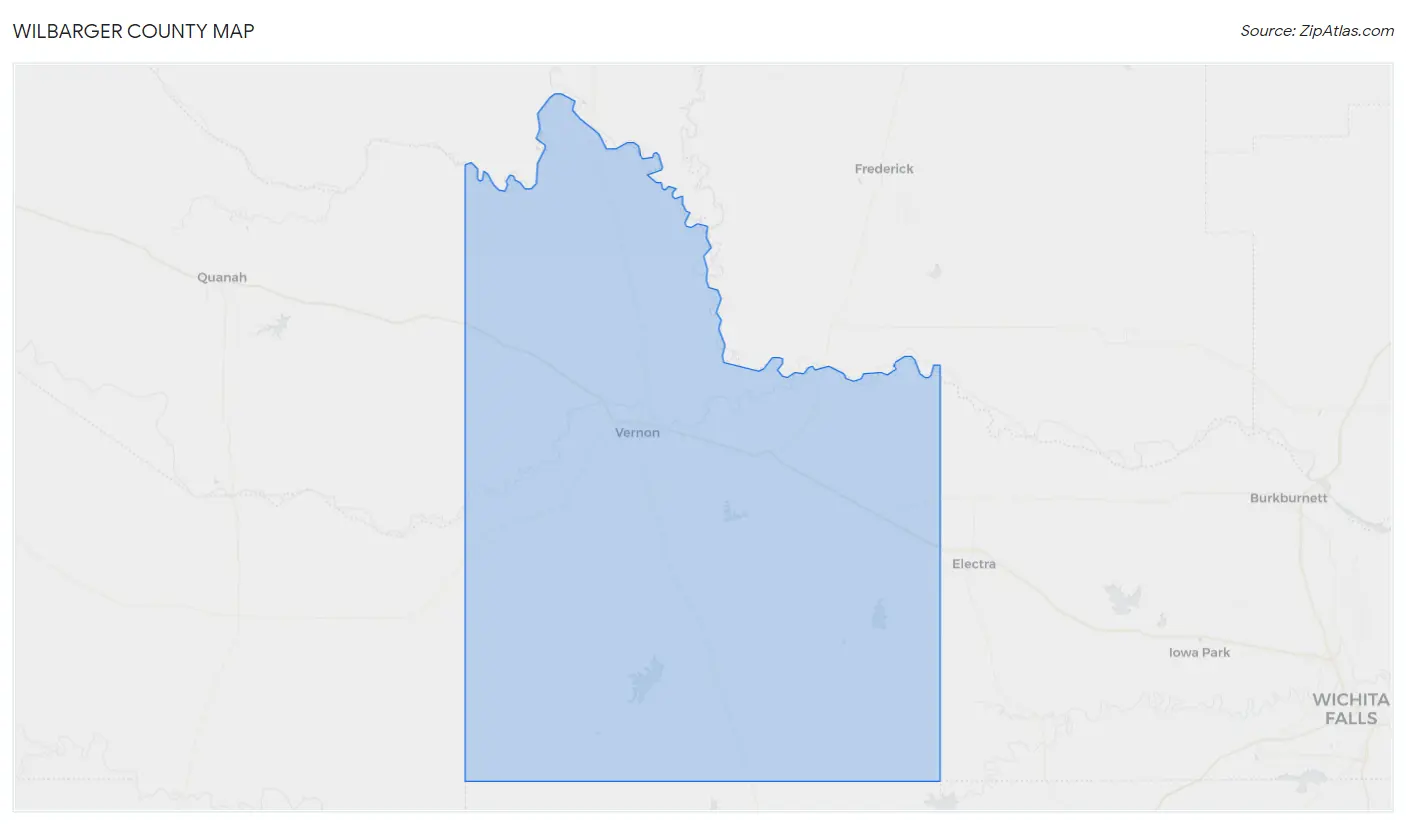
Wilbarger County Overview
$24,291
PER CAPITA INCOME
$63,611
AVG FAMILY INCOME
$50,769
AVG HOUSEHOLD INCOME
12.3%
WAGE / INCOME GAP [ % ]
87.7¢/ $1
WAGE / INCOME GAP [ $ ]
0.41
INEQUALITY / GINI INDEX
12,795
TOTAL POPULATION
6,305
MALE POPULATION
6,490
FEMALE POPULATION
97.15
MALES / 100 FEMALES
102.93
FEMALES / 100 MALES
37.2
MEDIAN AGE
3.3
AVG FAMILY SIZE
2.5
AVG HOUSEHOLD SIZE
6,063
LABOR FORCE [ PEOPLE ]
58.3%
PERCENT IN LABOR FORCE
9.3%
UNEMPLOYMENT RATE
Wilbarger County Area Codes
Income in Wilbarger County
Income Overview in Wilbarger County
Per Capita Income in Wilbarger County is $24,291, while median incomes of families and households are $63,611 and $50,769 respectively.
| Characteristic | Number | Measure |
| Per Capita Income | 12,795 | $24,291 |
| Median Family Income | 2,772 | $63,611 |
| Mean Family Income | 2,772 | $70,990 |
| Median Household Income | 4,626 | $50,769 |
| Mean Household Income | 4,626 | $62,488 |
| Income Deficit | 2,772 | $0 |
| Wage / Income Gap (%) | 12,795 | 12.27% |
| Wage / Income Gap ($) | 12,795 | 87.73¢ per $1 |
| Gini / Inequality Index | 12,795 | 0.41 |
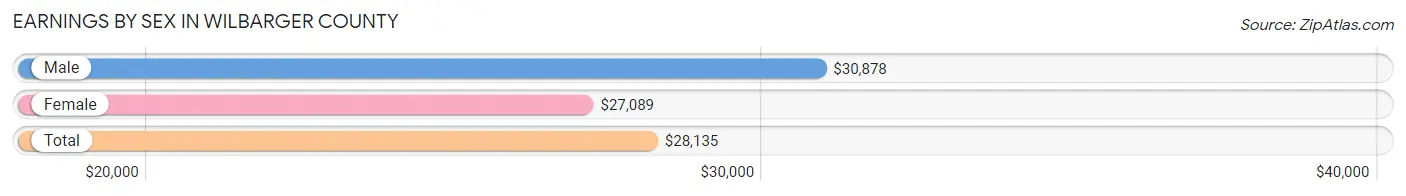
Earnings by Sex in Wilbarger County
Average Earnings in Wilbarger County are $28,135, $30,878 for men and $27,089 for women, a difference of 12.3%.
| Sex | Number | Average Earnings |
| Male | 3,172 (51.5%) | $30,878 |
| Female | 2,987 (48.5%) | $27,089 |
| Total | 6,159 (100.0%) | $28,135 |
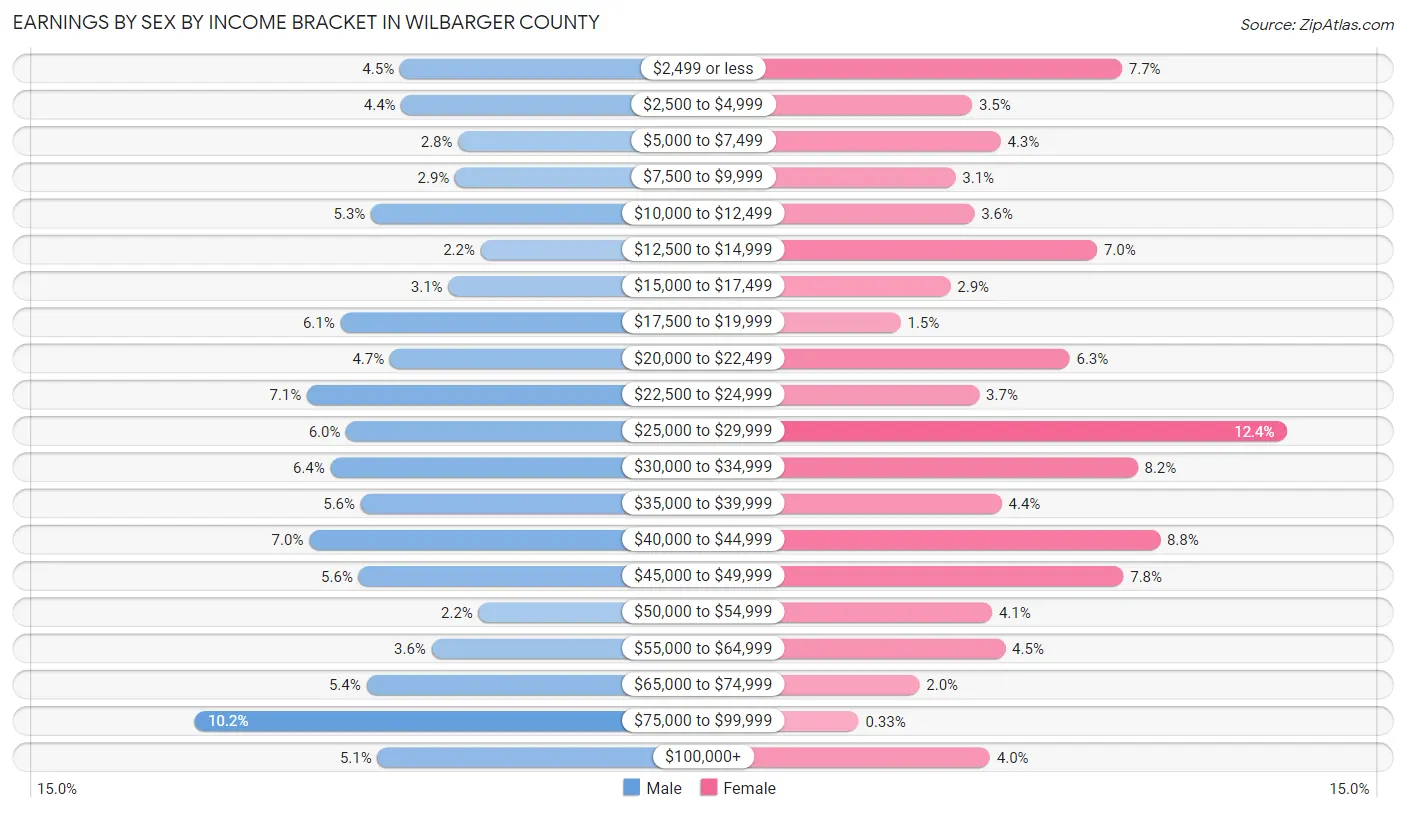
Earnings by Sex by Income Bracket in Wilbarger County
The most common earnings brackets in Wilbarger County are $75,000 to $99,999 for men (324 | 10.2%) and $25,000 to $29,999 for women (369 | 12.3%).
| Income | Male | Female |
| $2,499 or less | 141 (4.4%) | 231 (7.7%) |
| $2,500 to $4,999 | 140 (4.4%) | 105 (3.5%) |
| $5,000 to $7,499 | 89 (2.8%) | 129 (4.3%) |
| $7,500 to $9,999 | 92 (2.9%) | 91 (3.0%) |
| $10,000 to $12,499 | 167 (5.3%) | 107 (3.6%) |
| $12,500 to $14,999 | 69 (2.2%) | 210 (7.0%) |
| $15,000 to $17,499 | 98 (3.1%) | 87 (2.9%) |
| $17,500 to $19,999 | 194 (6.1%) | 45 (1.5%) |
| $20,000 to $22,499 | 150 (4.7%) | 187 (6.3%) |
| $22,500 to $24,999 | 224 (7.1%) | 111 (3.7%) |
| $25,000 to $29,999 | 189 (6.0%) | 369 (12.3%) |
| $30,000 to $34,999 | 203 (6.4%) | 244 (8.2%) |
| $35,000 to $39,999 | 176 (5.6%) | 130 (4.3%) |
| $40,000 to $44,999 | 222 (7.0%) | 263 (8.8%) |
| $45,000 to $49,999 | 178 (5.6%) | 232 (7.8%) |
| $50,000 to $54,999 | 71 (2.2%) | 122 (4.1%) |
| $55,000 to $64,999 | 113 (3.6%) | 133 (4.4%) |
| $65,000 to $74,999 | 171 (5.4%) | 61 (2.0%) |
| $75,000 to $99,999 | 324 (10.2%) | 10 (0.3%) |
| $100,000+ | 161 (5.1%) | 120 (4.0%) |
| Total | 3,172 (100.0%) | 2,987 (100.0%) |
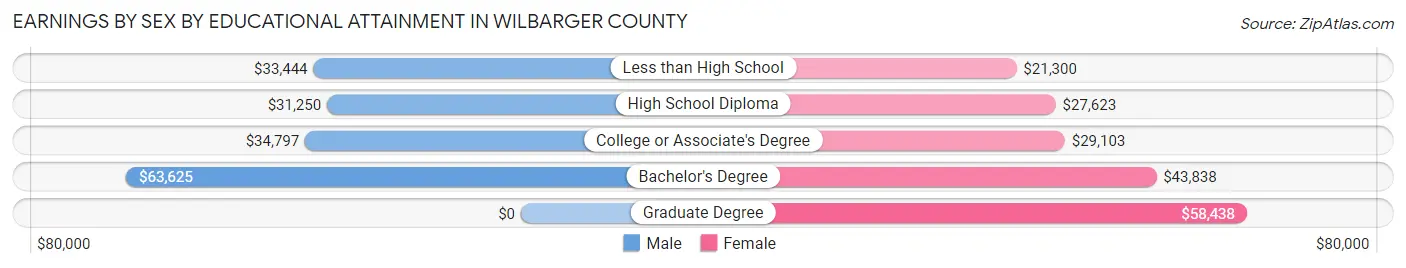
Earnings by Sex by Educational Attainment in Wilbarger County
Average earnings in Wilbarger County are $35,437 for men and $29,837 for women, a difference of 15.8%. Men with an educational attainment of bachelor's degree enjoy the highest average annual earnings of $63,625, while those with high school diploma education earn the least with $31,250. Women with an educational attainment of graduate degree earn the most with the average annual earnings of $58,438, while those with less than high school education have the smallest earnings of $21,300.
| Educational Attainment | Male Income | Female Income |
| Less than High School | $33,444 | $21,300 |
| High School Diploma | $31,250 | $27,623 |
| College or Associate's Degree | $34,797 | $29,103 |
| Bachelor's Degree | $63,625 | $43,838 |
| Graduate Degree | - | - |
| Total | $35,437 | $29,837 |
Family Income in Wilbarger County
Family Income Brackets in Wilbarger County
According to the Wilbarger County family income data, there are 613 families falling into the $75,000 to $99,999 income range, which is the most common income bracket and makes up 22.1% of all families. Conversely, the $200,000+ income bracket is the least frequent group with only 42 families (1.5%) belonging to this category.
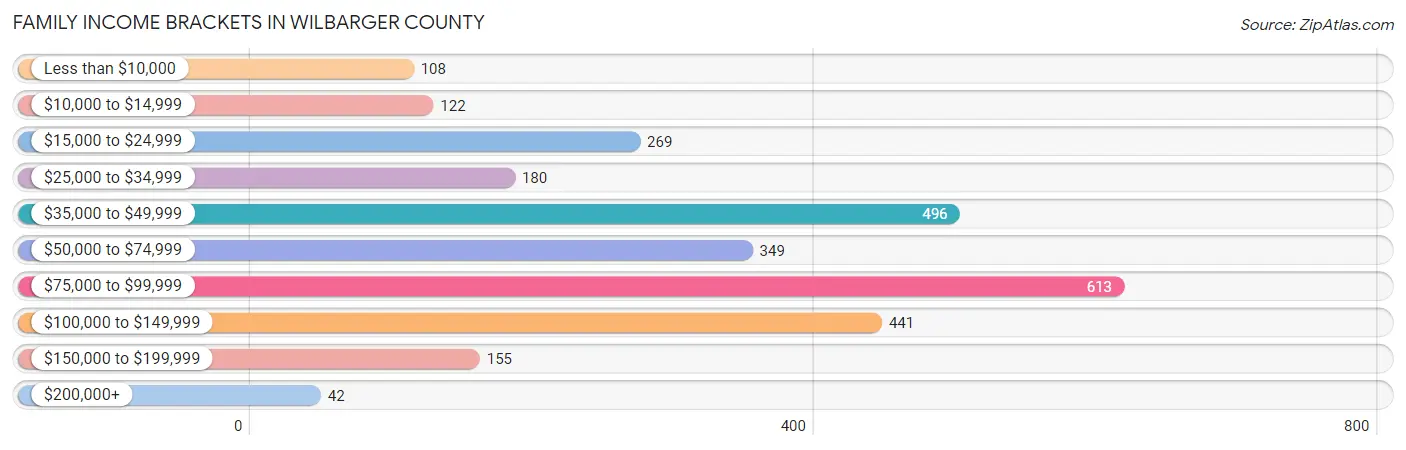
| Income Bracket | # Families | % Families |
| Less than $10,000 | 108 | 3.9% |
| $10,000 to $14,999 | 122 | 4.4% |
| $15,000 to $24,999 | 269 | 9.7% |
| $25,000 to $34,999 | 180 | 6.5% |
| $35,000 to $49,999 | 496 | 17.9% |
| $50,000 to $74,999 | 349 | 12.6% |
| $75,000 to $99,999 | 613 | 22.1% |
| $100,000 to $149,999 | 441 | 15.9% |
| $150,000 to $199,999 | 155 | 5.6% |
| $200,000+ | 42 | 1.5% |
Family Income by Famaliy Size in Wilbarger County
6-person families (103 | 3.7%) account for the highest median family income in Wilbarger County with $88,109 per family, while 2-person families (1,358 | 49.0%) have the highest median income of $28,812 per family member.
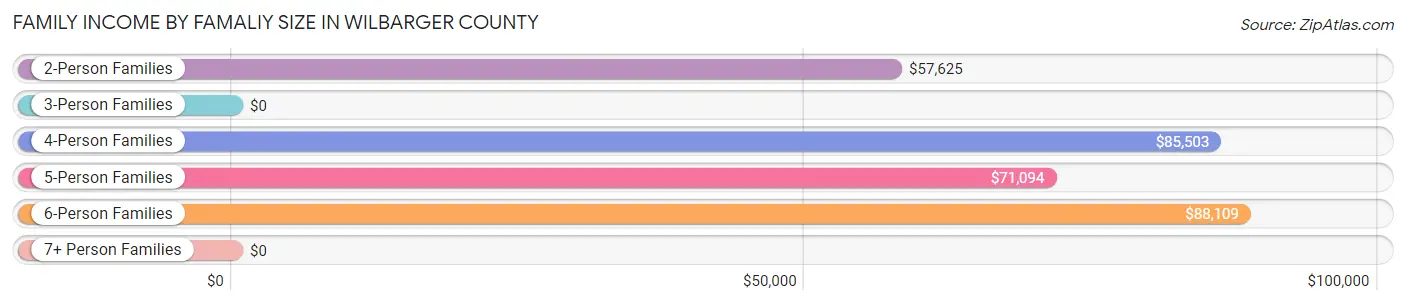
| Income Bracket | # Families | Median Income |
| 2-Person Families | 1,358 (49.0%) | $57,625 |
| 3-Person Families | 657 (23.7%) | $0 |
| 4-Person Families | 303 (10.9%) | $85,503 |
| 5-Person Families | 328 (11.8%) | $71,094 |
| 6-Person Families | 103 (3.7%) | $88,109 |
| 7+ Person Families | 23 (0.8%) | $0 |
| Total | 2,772 (100.0%) | $63,611 |
Family Income by Number of Earners in Wilbarger County
The median family income in Wilbarger County is $63,611, with families comprising 3+ earners (272) having the highest median family income of $89,717, while families with no earners (496) have the lowest median family income of $34,457, accounting for 9.8% and 17.9% of families, respectively.
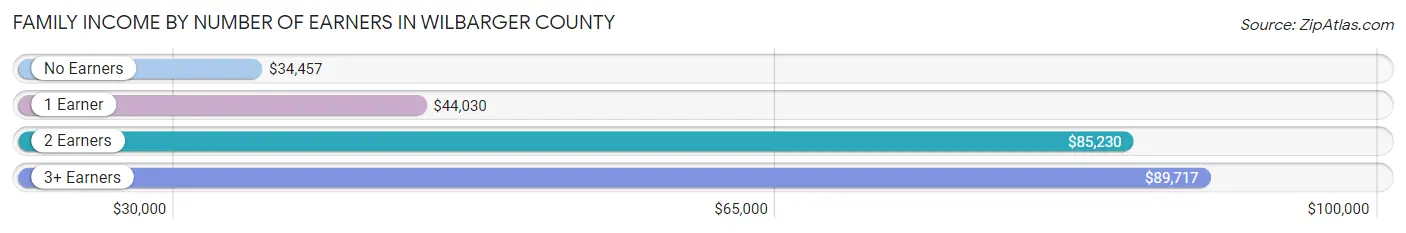
| Number of Earners | # Families | Median Income |
| No Earners | 496 (17.9%) | $34,457 |
| 1 Earner | 886 (32.0%) | $44,030 |
| 2 Earners | 1,118 (40.3%) | $85,230 |
| 3+ Earners | 272 (9.8%) | $89,717 |
| Total | 2,772 (100.0%) | $63,611 |
Household Income in Wilbarger County
Household Income Brackets in Wilbarger County
With 847 households falling in the category, the $15,000 to $24,999 income range is the most frequent in Wilbarger County, accounting for 18.3% of all households. In contrast, only 93 households (2.0%) fall into the $200,000+ income bracket, making it the least populous group.
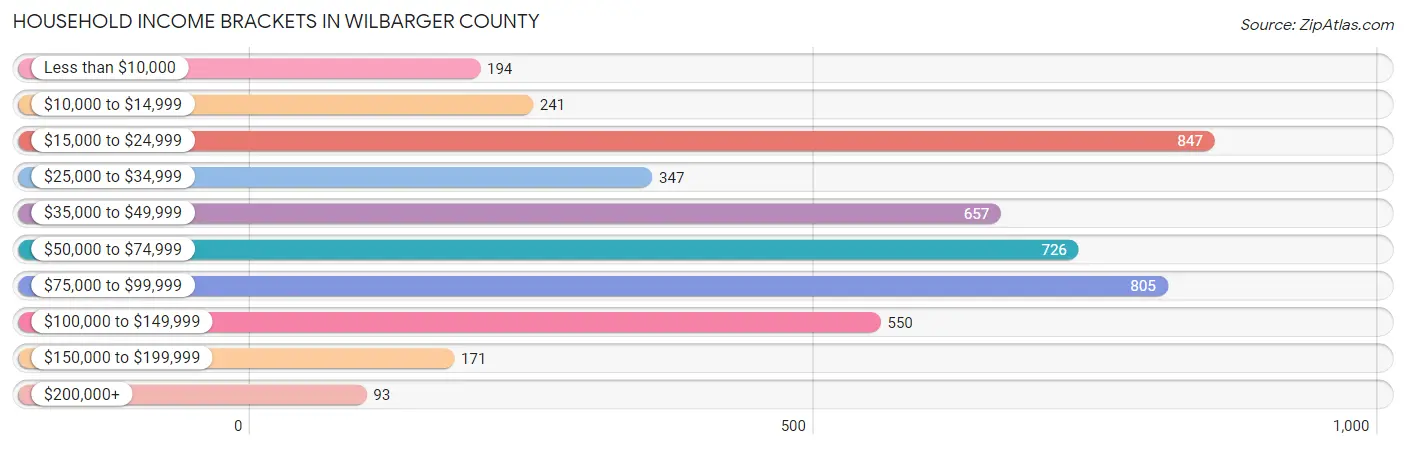
| Income Bracket | # Households | % Households |
| Less than $10,000 | 194 | 4.2% |
| $10,000 to $14,999 | 241 | 5.2% |
| $15,000 to $24,999 | 847 | 18.3% |
| $25,000 to $34,999 | 347 | 7.5% |
| $35,000 to $49,999 | 657 | 14.2% |
| $50,000 to $74,999 | 726 | 15.7% |
| $75,000 to $99,999 | 805 | 17.4% |
| $100,000 to $149,999 | 550 | 11.9% |
| $150,000 to $199,999 | 171 | 3.7% |
| $200,000+ | 93 | 2.0% |
Household Income by Householder Age in Wilbarger County
The median household income in Wilbarger County is $50,769, with the highest median household income of $66,292 found in the 25 to 44 years age bracket for the primary householder. A total of 1,371 households (29.6%) fall into this category. Meanwhile, the 15 to 24 years age bracket for the primary householder has the lowest median household income of $0, with 163 households (3.5%) in this group.
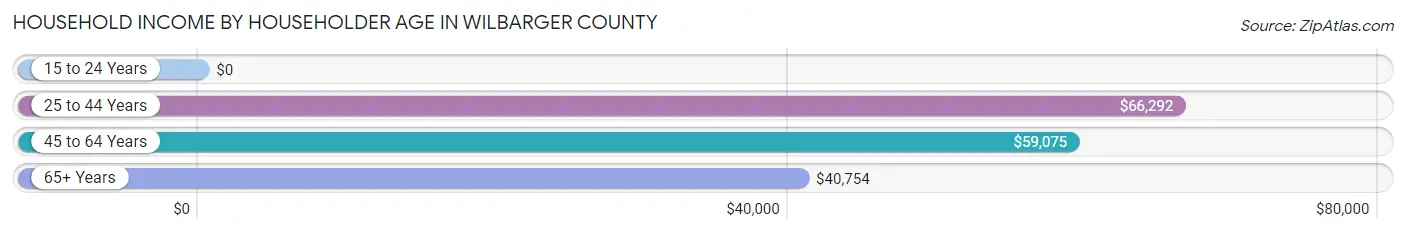
| Income Bracket | # Households | Median Income |
| 15 to 24 Years | 163 (3.5%) | $0 |
| 25 to 44 Years | 1,371 (29.6%) | $66,292 |
| 45 to 64 Years | 1,705 (36.9%) | $59,075 |
| 65+ Years | 1,387 (30.0%) | $40,754 |
| Total | 4,626 (100.0%) | $50,769 |
Poverty in Wilbarger County
Income Below Poverty by Sex and Age in Wilbarger County
With 20.7% poverty level for males and 16.2% for females among the residents of Wilbarger County, 16 and 17 year old males and 15 year old females are the most vulnerable to poverty, with 247 males (62.5%) and 37 females (37.8%) in their respective age groups living below the poverty level.
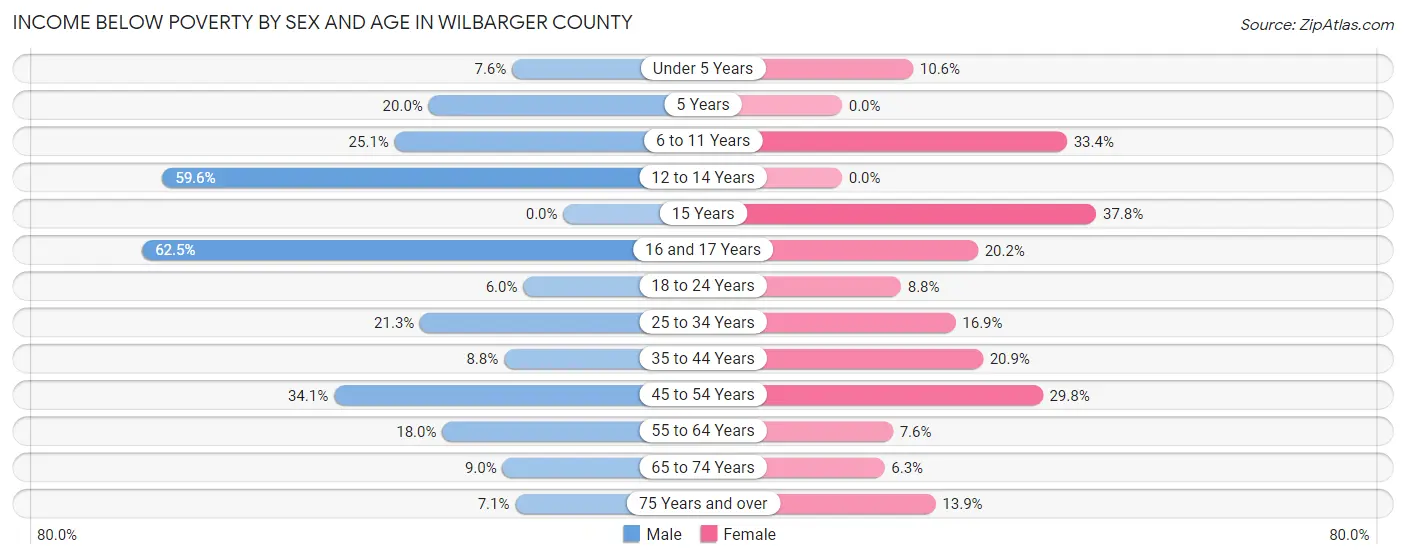
| Age Bracket | Male | Female |
| Under 5 Years | 28 (7.6%) | 50 (10.5%) |
| 5 Years | 19 (20.0%) | 0 (0.0%) |
| 6 to 11 Years | 127 (25.1%) | 176 (33.4%) |
| 12 to 14 Years | 53 (59.6%) | 0 (0.0%) |
| 15 Years | 0 (0.0%) | 37 (37.8%) |
| 16 and 17 Years | 247 (62.5%) | 23 (20.2%) |
| 18 to 24 Years | 25 (5.9%) | 53 (8.8%) |
| 25 to 34 Years | 186 (21.3%) | 146 (16.9%) |
| 35 to 44 Years | 55 (8.8%) | 155 (20.9%) |
| 45 to 54 Years | 280 (34.1%) | 191 (29.8%) |
| 55 to 64 Years | 140 (18.0%) | 70 (7.6%) |
| 65 to 74 Years | 57 (9.0%) | 42 (6.3%) |
| 75 Years and over | 22 (7.1%) | 62 (13.9%) |
| Total | 1,239 (20.7%) | 1,005 (16.2%) |
Income Above Poverty by Sex and Age in Wilbarger County
According to the poverty statistics in Wilbarger County, males aged 15 years and females aged 5 years are the age groups that are most secure financially, with 100.0% of males and 100.0% of females in these age groups living above the poverty line.
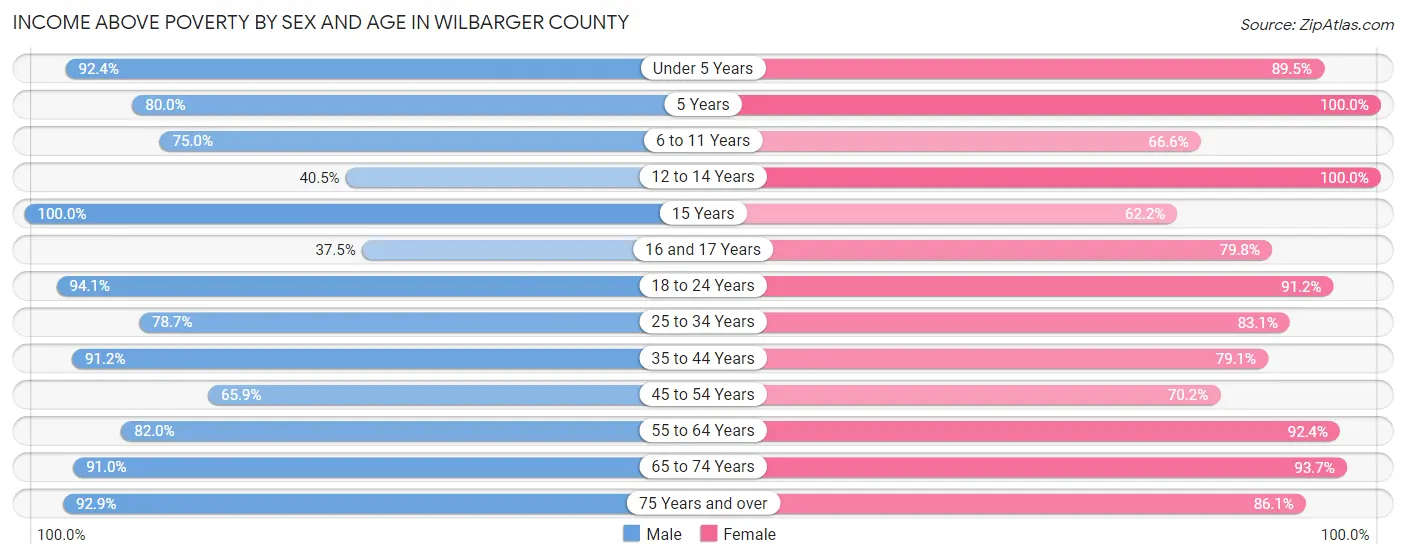
| Age Bracket | Male | Female |
| Under 5 Years | 340 (92.4%) | 424 (89.4%) |
| 5 Years | 76 (80.0%) | 32 (100.0%) |
| 6 to 11 Years | 380 (75.0%) | 351 (66.6%) |
| 12 to 14 Years | 36 (40.5%) | 84 (100.0%) |
| 15 Years | 68 (100.0%) | 61 (62.2%) |
| 16 and 17 Years | 148 (37.5%) | 91 (79.8%) |
| 18 to 24 Years | 395 (94.1%) | 552 (91.2%) |
| 25 to 34 Years | 689 (78.7%) | 720 (83.1%) |
| 35 to 44 Years | 569 (91.2%) | 586 (79.1%) |
| 45 to 54 Years | 542 (65.9%) | 450 (70.2%) |
| 55 to 64 Years | 639 (82.0%) | 856 (92.4%) |
| 65 to 74 Years | 574 (91.0%) | 623 (93.7%) |
| 75 Years and over | 286 (92.9%) | 384 (86.1%) |
| Total | 4,742 (79.3%) | 5,214 (83.8%) |
Income Below Poverty Among Married-Couple Families in Wilbarger County
The poverty statistics for married-couple families in Wilbarger County show that 10.4% or 195 of the total 1,868 families live below the poverty line. Families with 5 or more children have the highest poverty rate of 100.0%, comprising of 2 families. On the other hand, families with no children have the lowest poverty rate of 5.9%, which includes 66 families.
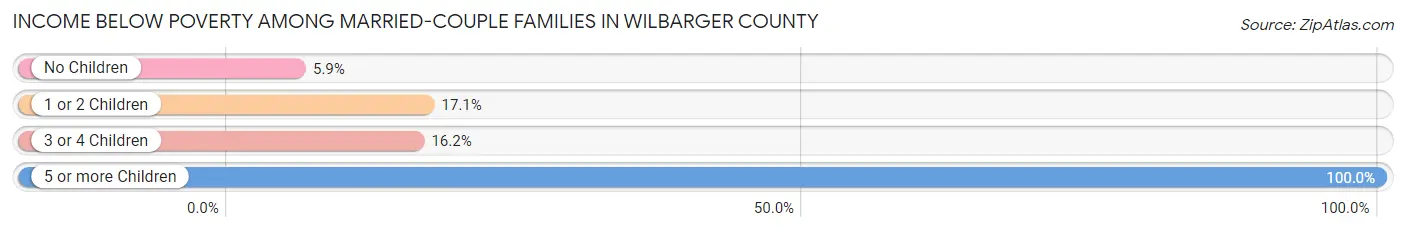
| Children | Above Poverty | Below Poverty |
| No Children | 1,048 (94.1%) | 66 (5.9%) |
| 1 or 2 Children | 465 (82.9%) | 96 (17.1%) |
| 3 or 4 Children | 160 (83.8%) | 31 (16.2%) |
| 5 or more Children | 0 (0.0%) | 2 (100.0%) |
| Total | 1,673 (89.6%) | 195 (10.4%) |
Income Below Poverty Among Single-Parent Households in Wilbarger County
According to the poverty data in Wilbarger County, 21.0% or 26 single-father households and 24.5% or 191 single-mother households are living below the poverty line. Among single-father households, those with 1 or 2 children have the highest poverty rate, with 26 households (52.0%) experiencing poverty. Likewise, among single-mother households, those with 1 or 2 children have the highest poverty rate, with 127 households (39.8%) falling below the poverty line.
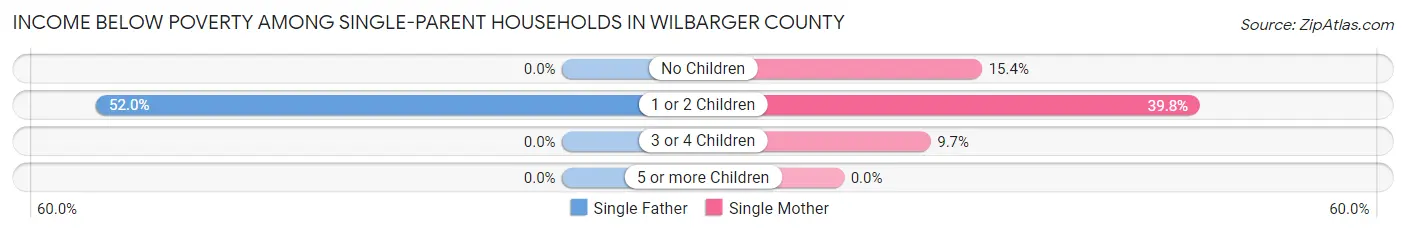
| Children | Single Father | Single Mother |
| No Children | 0 (0.0%) | 52 (15.4%) |
| 1 or 2 Children | 26 (52.0%) | 127 (39.8%) |
| 3 or 4 Children | 0 (0.0%) | 12 (9.7%) |
| 5 or more Children | 0 (0.0%) | 0 (0.0%) |
| Total | 26 (21.0%) | 191 (24.5%) |
Income Below Poverty Among Married-Couple vs Single-Parent Households in Wilbarger County
The poverty data for Wilbarger County shows that 195 of the married-couple family households (10.4%) and 217 of the single-parent households (24.0%) are living below the poverty level. Within the married-couple family households, those with 5 or more children have the highest poverty rate, with 2 households (100.0%) falling below the poverty line. Among the single-parent households, those with 1 or 2 children have the highest poverty rate, with 153 household (41.5%) living below poverty.
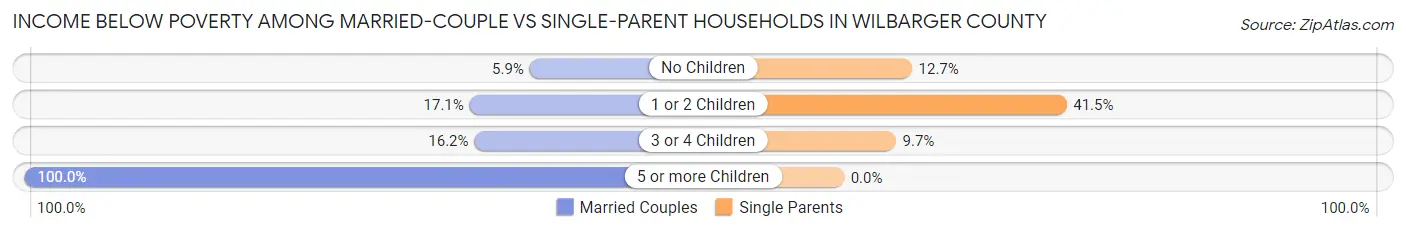
| Children | Married-Couple Families | Single-Parent Households |
| No Children | 66 (5.9%) | 52 (12.7%) |
| 1 or 2 Children | 96 (17.1%) | 153 (41.5%) |
| 3 or 4 Children | 31 (16.2%) | 12 (9.7%) |
| 5 or more Children | 2 (100.0%) | 0 (0.0%) |
| Total | 195 (10.4%) | 217 (24.0%) |
Race in Wilbarger County
The most populous races in Wilbarger County are White / Caucasian (8,746 | 68.3%), Hispanic or Latino (3,885 | 30.4%), and Two or more Races (1,597 | 12.5%).
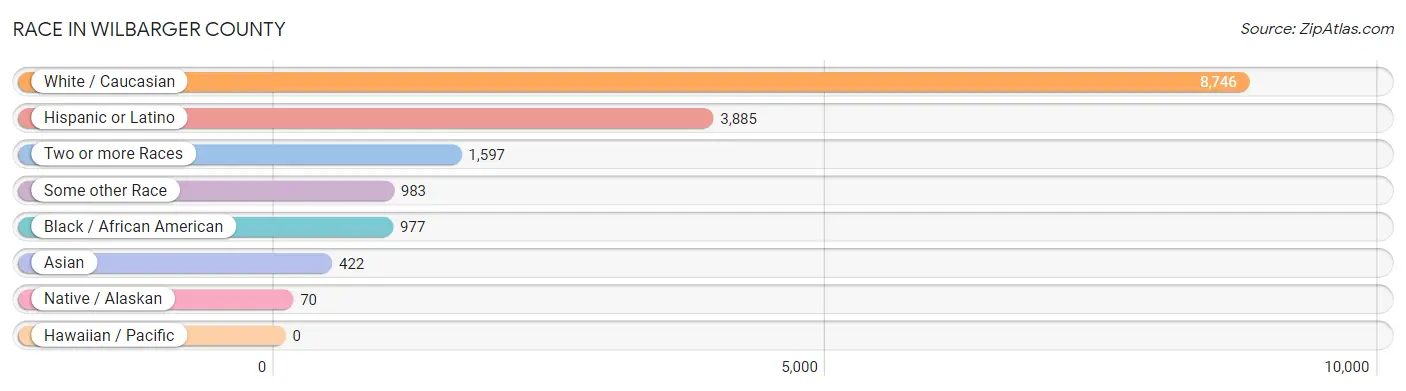
| Race | # Population | % Population |
| Asian | 422 | 3.3% |
| Black / African American | 977 | 7.6% |
| Hawaiian / Pacific | 0 | 0.0% |
| Hispanic or Latino | 3,885 | 30.4% |
| Native / Alaskan | 70 | 0.5% |
| White / Caucasian | 8,746 | 68.3% |
| Two or more Races | 1,597 | 12.5% |
| Some other Race | 983 | 7.7% |
| Total | 12,795 | 100.0% |
Ancestry in Wilbarger County
The most populous ancestries reported in Wilbarger County are Mexican (3,341 | 26.1%), German (1,314 | 10.3%), English (1,085 | 8.5%), Irish (986 | 7.7%), and American (604 | 4.7%), together accounting for 57.3% of all Wilbarger County residents.
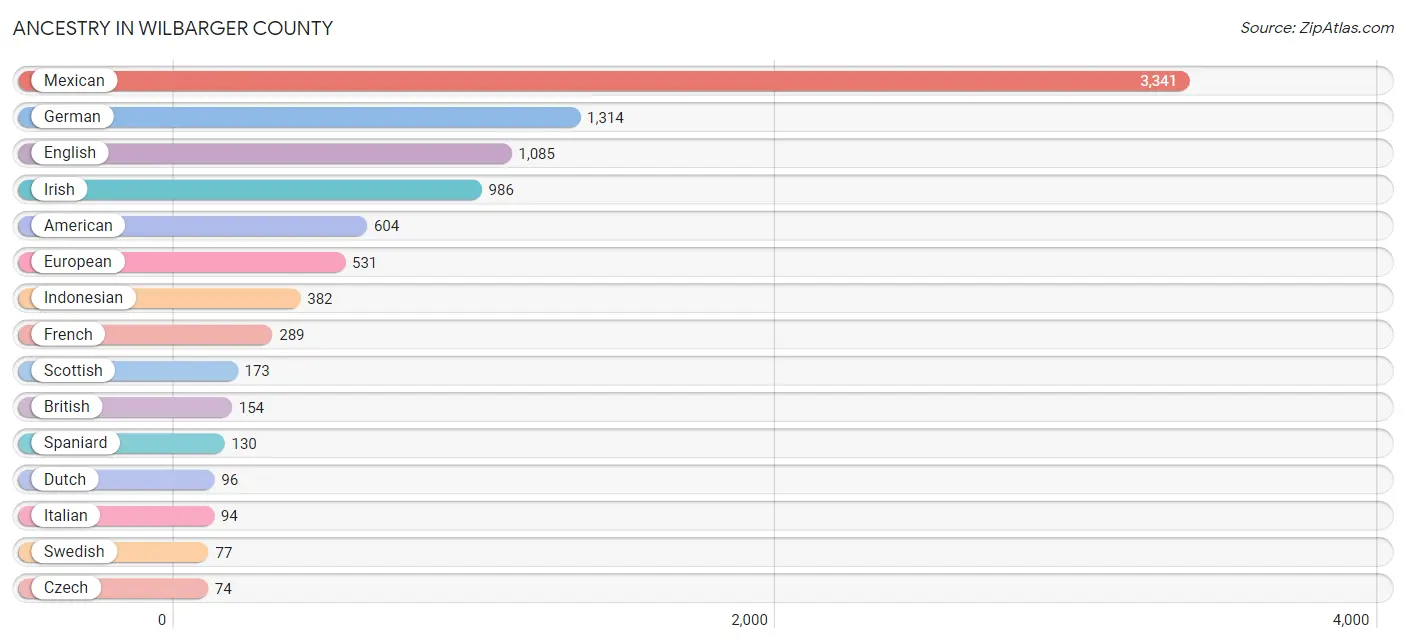
| Ancestry | # Population | % Population |
| African | 29 | 0.2% |
| American | 604 | 4.7% |
| Apache | 22 | 0.2% |
| Austrian | 4 | 0.0% |
| Blackfeet | 35 | 0.3% |
| British | 154 | 1.2% |
| Cajun | 28 | 0.2% |
| Central American | 37 | 0.3% |
| Central American Indian | 11 | 0.1% |
| Cherokee | 60 | 0.5% |
| Chickasaw | 4 | 0.0% |
| Chippewa | 1 | 0.0% |
| Choctaw | 54 | 0.4% |
| Comanche | 38 | 0.3% |
| Cuban | 5 | 0.0% |
| Czech | 74 | 0.6% |
| Czechoslovakian | 2 | 0.0% |
| Dutch | 96 | 0.7% |
| English | 1,085 | 8.5% |
| Ethiopian | 3 | 0.0% |
| European | 531 | 4.2% |
| Filipino | 5 | 0.0% |
| Finnish | 14 | 0.1% |
| French | 289 | 2.3% |
| German | 1,314 | 10.3% |
| Greek | 2 | 0.0% |
| Guatemalan | 25 | 0.2% |
| Hungarian | 3 | 0.0% |
| Indian (Asian) | 9 | 0.1% |
| Indonesian | 382 | 3.0% |
| Irish | 986 | 7.7% |
| Italian | 94 | 0.7% |
| Korean | 54 | 0.4% |
| Lithuanian | 2 | 0.0% |
| Mexican | 3,341 | 26.1% |
| Mexican American Indian | 31 | 0.2% |
| Nigerian | 7 | 0.1% |
| Osage | 1 | 0.0% |
| Pakistani | 1 | 0.0% |
| Polish | 37 | 0.3% |
| Pueblo | 15 | 0.1% |
| Puerto Rican | 28 | 0.2% |
| Russian | 11 | 0.1% |
| Salvadoran | 12 | 0.1% |
| Scandinavian | 36 | 0.3% |
| Scotch-Irish | 41 | 0.3% |
| Scottish | 173 | 1.3% |
| Sioux | 42 | 0.3% |
| Slovak | 43 | 0.3% |
| Spaniard | 130 | 1.0% |
| Spanish | 10 | 0.1% |
| Subsaharan African | 39 | 0.3% |
| Swedish | 77 | 0.6% |
| Swiss | 37 | 0.3% |
| Thai | 3 | 0.0% |
| Ukrainian | 9 | 0.1% |
| Welsh | 14 | 0.1% | View All 57 Rows |
Immigrants in Wilbarger County
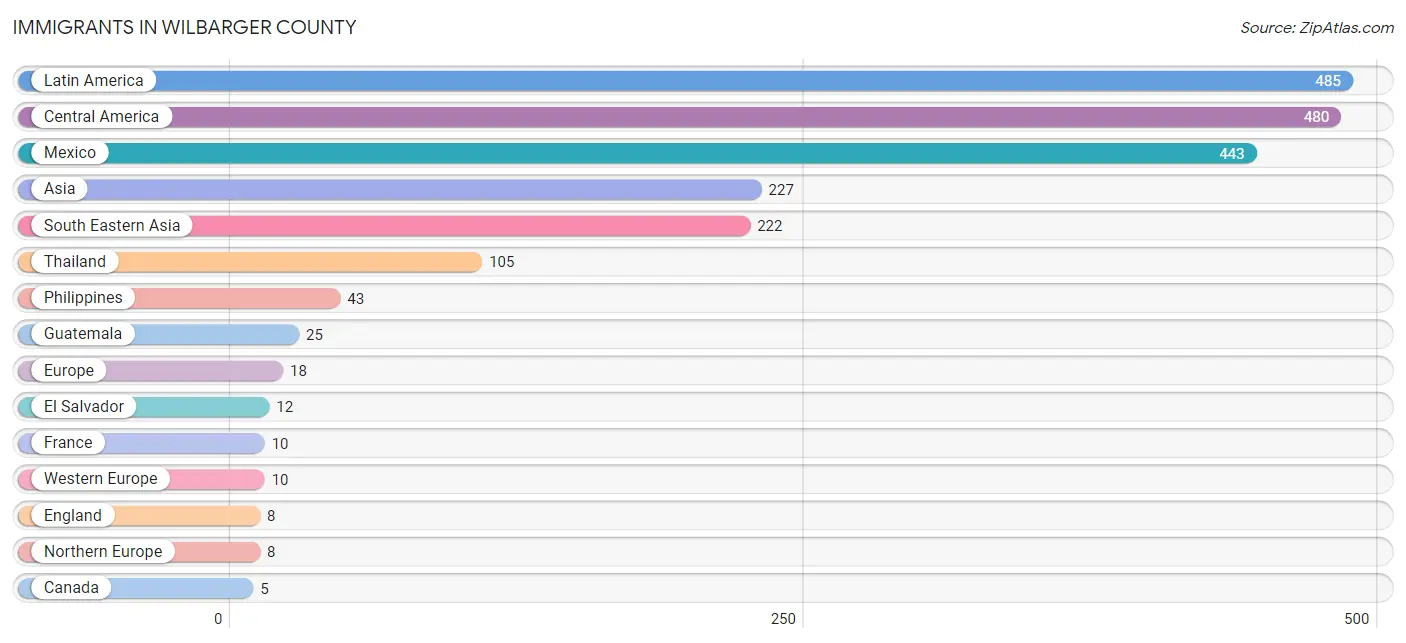
The most numerous immigrant groups reported in Wilbarger County came from Latin America (485 | 3.8%), Central America (480 | 3.7%), Mexico (443 | 3.5%), Asia (227 | 1.8%), and South Eastern Asia (222 | 1.7%), together accounting for 14.5% of all Wilbarger County residents.
| Immigration Origin | # Population | % Population |
| Africa | 3 | 0.0% |
| Asia | 227 | 1.8% |
| Canada | 5 | 0.0% |
| Caribbean | 5 | 0.0% |
| Central America | 480 | 3.7% |
| China | 2 | 0.0% |
| Cuba | 5 | 0.0% |
| Eastern Africa | 3 | 0.0% |
| Eastern Asia | 2 | 0.0% |
| El Salvador | 12 | 0.1% |
| England | 8 | 0.1% |
| Ethiopia | 3 | 0.0% |
| Europe | 18 | 0.1% |
| France | 10 | 0.1% |
| Guatemala | 25 | 0.2% |
| Hong Kong | 2 | 0.0% |
| India | 3 | 0.0% |
| Latin America | 485 | 3.8% |
| Mexico | 443 | 3.5% |
| Northern Europe | 8 | 0.1% |
| Philippines | 43 | 0.3% |
| South Central Asia | 3 | 0.0% |
| South Eastern Asia | 222 | 1.7% |
| Thailand | 105 | 0.8% |
| Western Europe | 10 | 0.1% | View All 25 Rows |
Sex and Age in Wilbarger County
Sex and Age in Wilbarger County
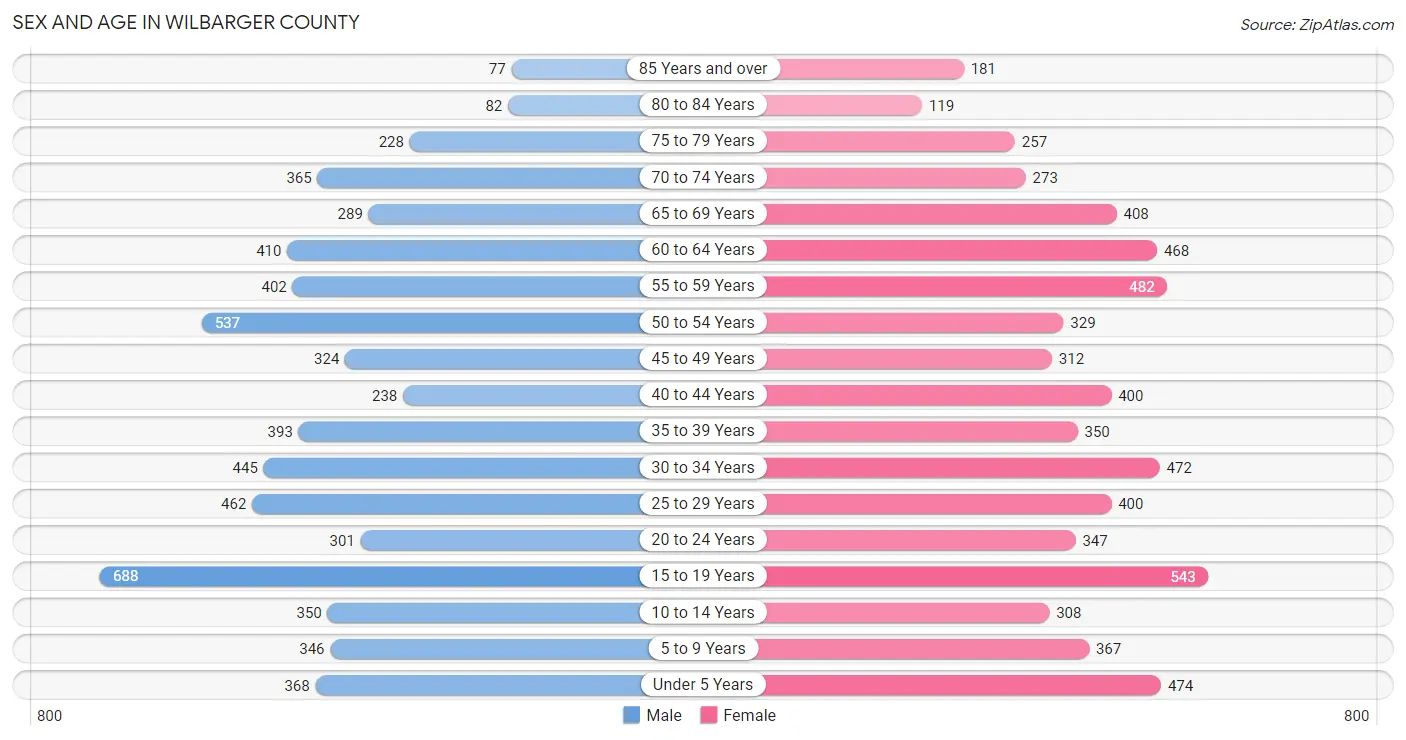
The most populous age groups in Wilbarger County are 15 to 19 Years (688 | 10.9%) for men and 15 to 19 Years (543 | 8.4%) for women.
| Age Bracket | Male | Female |
| Under 5 Years | 368 (5.8%) | 474 (7.3%) |
| 5 to 9 Years | 346 (5.5%) | 367 (5.7%) |
| 10 to 14 Years | 350 (5.6%) | 308 (4.8%) |
| 15 to 19 Years | 688 (10.9%) | 543 (8.4%) |
| 20 to 24 Years | 301 (4.8%) | 347 (5.3%) |
| 25 to 29 Years | 462 (7.3%) | 400 (6.2%) |
| 30 to 34 Years | 445 (7.1%) | 472 (7.3%) |
| 35 to 39 Years | 393 (6.2%) | 350 (5.4%) |
| 40 to 44 Years | 238 (3.8%) | 400 (6.2%) |
| 45 to 49 Years | 324 (5.1%) | 312 (4.8%) |
| 50 to 54 Years | 537 (8.5%) | 329 (5.1%) |
| 55 to 59 Years | 402 (6.4%) | 482 (7.4%) |
| 60 to 64 Years | 410 (6.5%) | 468 (7.2%) |
| 65 to 69 Years | 289 (4.6%) | 408 (6.3%) |
| 70 to 74 Years | 365 (5.8%) | 273 (4.2%) |
| 75 to 79 Years | 228 (3.6%) | 257 (4.0%) |
| 80 to 84 Years | 82 (1.3%) | 119 (1.8%) |
| 85 Years and over | 77 (1.2%) | 181 (2.8%) |
| Total | 6,305 (100.0%) | 6,490 (100.0%) |
Families and Households in Wilbarger County
Median Family Size in Wilbarger County
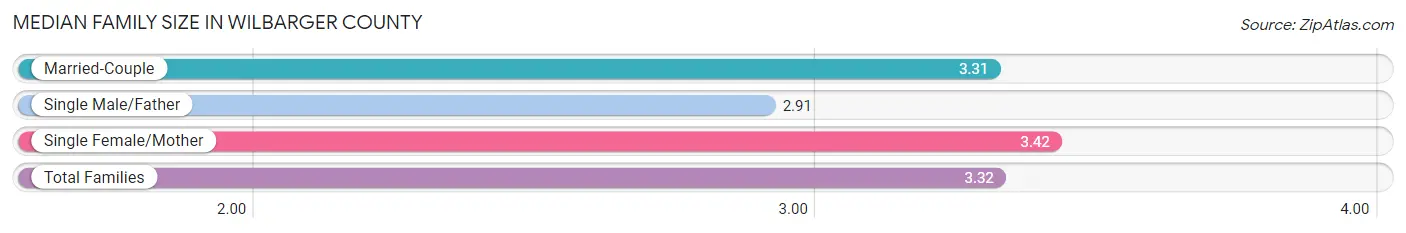
The median family size in Wilbarger County is 3.32 persons per family, with single female/mother families (780 | 28.1%) accounting for the largest median family size of 3.42 persons per family. On the other hand, single male/father families (124 | 4.5%) represent the smallest median family size with 2.91 persons per family.
| Family Type | # Families | Family Size |
| Married-Couple | 1,868 (67.4%) | 3.31 |
| Single Male/Father | 124 (4.5%) | 2.91 |
| Single Female/Mother | 780 (28.1%) | 3.42 |
| Total Families | 2,772 (100.0%) | 3.32 |
Median Household Size in Wilbarger County
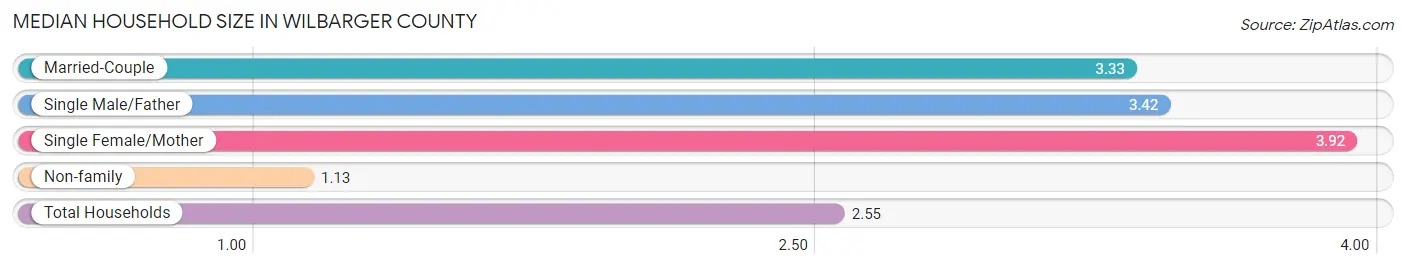
The median household size in Wilbarger County is 2.55 persons per household, with single female/mother households (780 | 16.9%) accounting for the largest median household size of 3.92 persons per household. non-family households (1,854 | 40.1%) represent the smallest median household size with 1.13 persons per household.
| Household Type | # Households | Household Size |
| Married-Couple | 1,868 (40.4%) | 3.33 |
| Single Male/Father | 124 (2.7%) | 3.42 |
| Single Female/Mother | 780 (16.9%) | 3.92 |
| Non-family | 1,854 (40.1%) | 1.13 |
| Total Households | 4,626 (100.0%) | 2.55 |
Household Size by Marriage Status in Wilbarger County
Out of a total of 4,626 households in Wilbarger County, 2,772 (59.9%) are family households, while 1,854 (40.1%) are nonfamily households. The most numerous type of family households are 2-person households, comprising 1,251, and the most common type of nonfamily households are 1-person households, comprising 1,663.
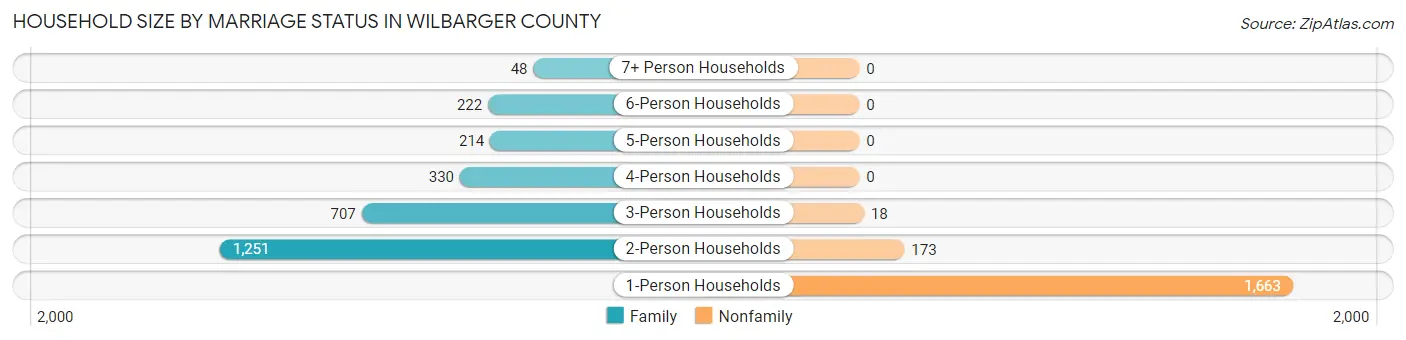
| Household Size | Family Households | Nonfamily Households |
| 1-Person Households | - | 1,663 (35.9%) |
| 2-Person Households | 1,251 (27.0%) | 173 (3.7%) |
| 3-Person Households | 707 (15.3%) | 18 (0.4%) |
| 4-Person Households | 330 (7.1%) | 0 (0.0%) |
| 5-Person Households | 214 (4.6%) | 0 (0.0%) |
| 6-Person Households | 222 (4.8%) | 0 (0.0%) |
| 7+ Person Households | 48 (1.0%) | 0 (0.0%) |
| Total | 2,772 (59.9%) | 1,854 (40.1%) |
Female Fertility in Wilbarger County
Fertility by Age in Wilbarger County
Average fertility rate in Wilbarger County is 61.0 births per 1,000 women. Women in the age bracket of 20 to 34 years have the highest fertility rate with 139.0 births per 1,000 women. Women in the age bracket of 20 to 34 years acount for 95.5% of all women with births.
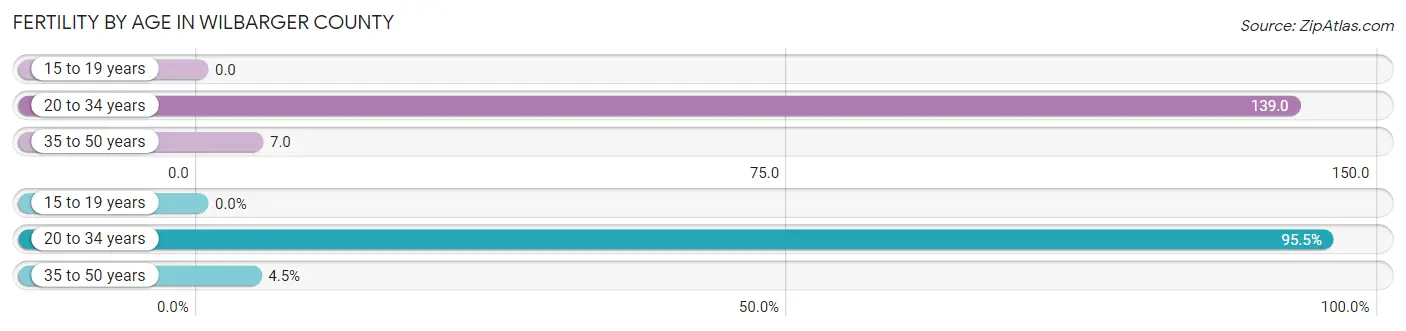
| Age Bracket | Women with Births | Births / 1,000 Women |
| 15 to 19 years | 0 (0.0%) | 0.0 |
| 20 to 34 years | 169 (95.5%) | 139.0 |
| 35 to 50 years | 8 (4.5%) | 7.0 |
| Total | 177 (100.0%) | 61.0 |
Fertility by Age by Marriage Status in Wilbarger County
57.1% of women with births (177) in Wilbarger County are married. The highest percentage of unmarried women with births falls into 35 to 50 years age bracket with 100.0% of them unmarried at the time of birth, while the lowest percentage of unmarried women with births belong to 20 to 34 years age bracket with 40.2% of them unmarried.
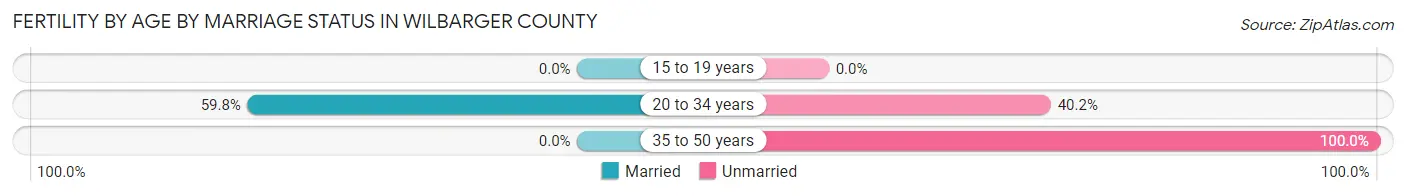
| Age Bracket | Married | Unmarried |
| 15 to 19 years | 0 (0.0%) | 0 (0.0%) |
| 20 to 34 years | 101 (59.8%) | 68 (40.2%) |
| 35 to 50 years | 0 (0.0%) | 8 (100.0%) |
| Total | 101 (57.1%) | 76 (42.9%) |
Fertility by Education in Wilbarger County
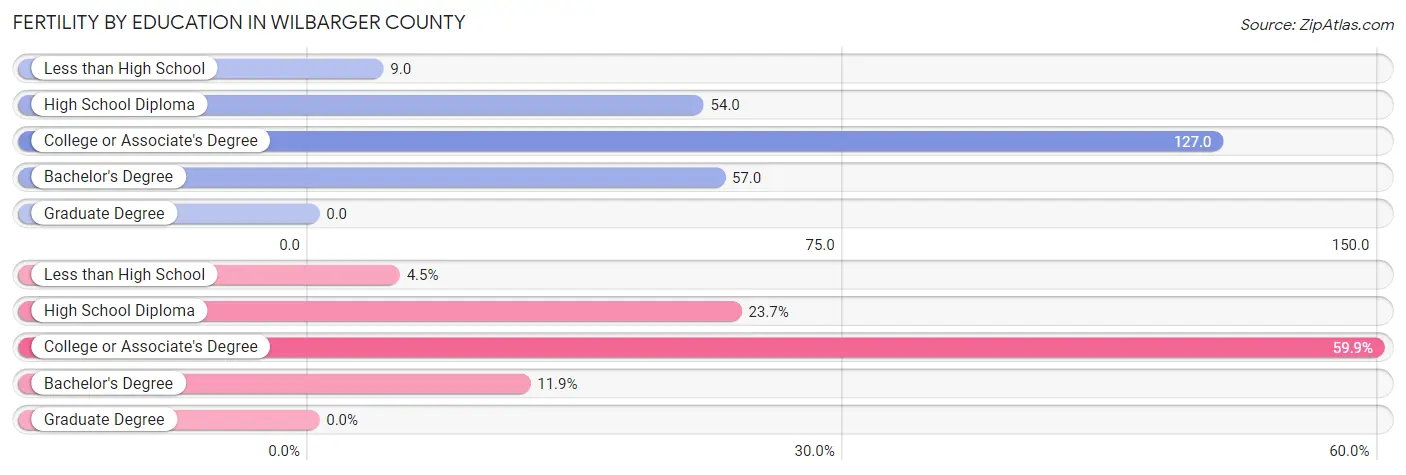
| Educational Attainment | Women with Births | Births / 1,000 Women |
| Less than High School | 8 (4.5%) | 9.0 |
| High School Diploma | 42 (23.7%) | 54.0 |
| College or Associate's Degree | 106 (59.9%) | 127.0 |
| Bachelor's Degree | 21 (11.9%) | 57.0 |
| Graduate Degree | 0 (0.0%) | 0.0 |
| Total | 177 (100.0%) | 61.0 |
Fertility by Education by Marriage Status in Wilbarger County
42.9% of women with births in Wilbarger County are unmarried. Women with the educational attainment of less than high school are most likely to be married with 100.0% of them married at childbirth, while women with the educational attainment of college or associate's degree are least likely to be married with 51.9% of them unmarried at childbirth.
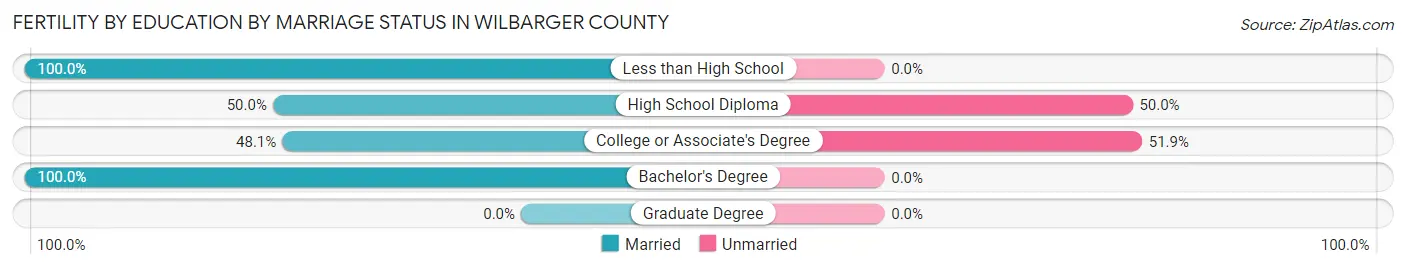
| Educational Attainment | Married | Unmarried |
| Less than High School | 8 (100.0%) | 0 (0.0%) |
| High School Diploma | 21 (50.0%) | 21 (50.0%) |
| College or Associate's Degree | 51 (48.1%) | 55 (51.9%) |
| Bachelor's Degree | 21 (100.0%) | 0 (0.0%) |
| Graduate Degree | 0 (0.0%) | 0 (0.0%) |
| Total | 101 (57.1%) | 76 (42.9%) |
Employment Characteristics in Wilbarger County
Employment by Class of Employer in Wilbarger County
Among the 5,436 employed individuals in Wilbarger County, private company employees (3,491 | 64.2%), state government employees (773 | 14.2%), and local government employees (491 | 9.0%) make up the most common classes of employment.
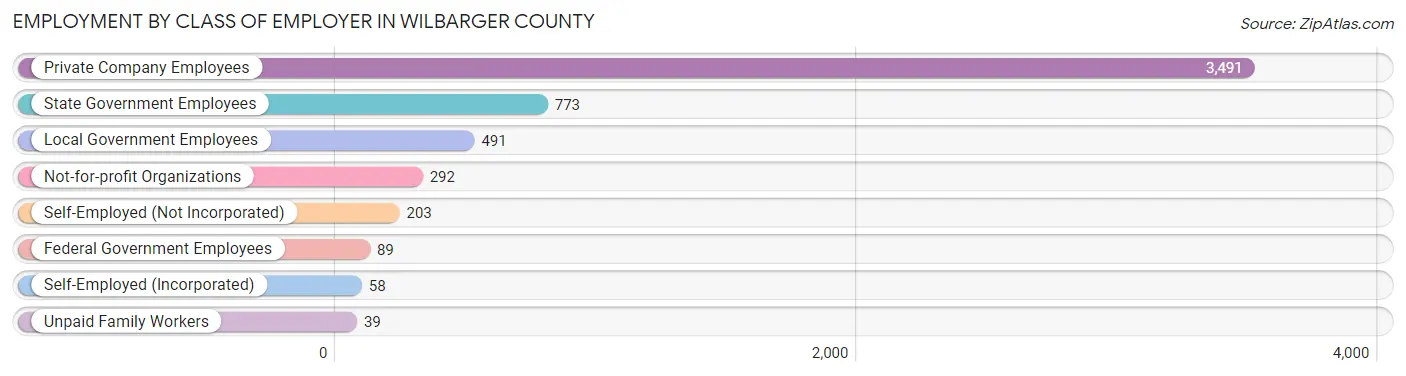
| Employer Class | # Employees | % Employees |
| Private Company Employees | 3,491 | 64.2% |
| Self-Employed (Incorporated) | 58 | 1.1% |
| Self-Employed (Not Incorporated) | 203 | 3.7% |
| Not-for-profit Organizations | 292 | 5.4% |
| Local Government Employees | 491 | 9.0% |
| State Government Employees | 773 | 14.2% |
| Federal Government Employees | 89 | 1.6% |
| Unpaid Family Workers | 39 | 0.7% |
| Total | 5,436 | 100.0% |
Employment Status by Age in Wilbarger County
According to the labor force statistics for Wilbarger County, out of the total population over 16 years of age (10,400), 58.3% or 6,063 individuals are in the labor force, with 9.3% or 564 of them unemployed. The age group with the highest labor force participation rate is 25 to 29 years, with 83.8% or 722 individuals in the labor force. Within the labor force, the 16 to 19 years age range has the highest percentage of unemployed individuals, with 33.5% or 180 of them being unemployed.
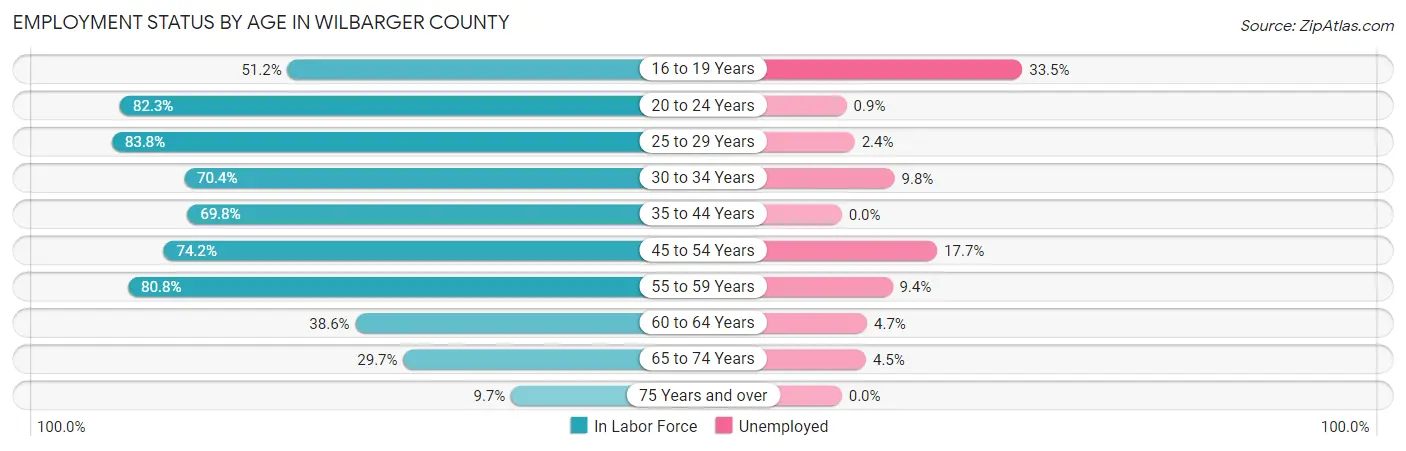
| Age Bracket | In Labor Force | Unemployed |
| 16 to 19 Years | 537 (51.2%) | 180 (33.5%) |
| 20 to 24 Years | 533 (82.3%) | 5 (0.9%) |
| 25 to 29 Years | 722 (83.8%) | 17 (2.4%) |
| 30 to 34 Years | 646 (70.4%) | 63 (9.8%) |
| 35 to 44 Years | 964 (69.8%) | 0 (0.0%) |
| 45 to 54 Years | 1,114 (74.2%) | 197 (17.7%) |
| 55 to 59 Years | 714 (80.8%) | 67 (9.4%) |
| 60 to 64 Years | 339 (38.6%) | 16 (4.7%) |
| 65 to 74 Years | 396 (29.7%) | 18 (4.5%) |
| 75 Years and over | 92 (9.7%) | 0 (0.0%) |
| Total | 6,063 (58.3%) | 564 (9.3%) |
Employment Status by Educational Attainment in Wilbarger County
According to labor force statistics for Wilbarger County, 70.0% of individuals (4,497) out of the total population between 25 and 64 years of age (6,424) are in the labor force, with 8.0% or 360 of them being unemployed. The group with the highest labor force participation rate are those with the educational attainment of bachelor's degree or higher, with 83.2% or 844 individuals in the labor force. Within the labor force, individuals with high school diploma education have the highest percentage of unemployment, with 15.9% or 266 of them being unemployed.
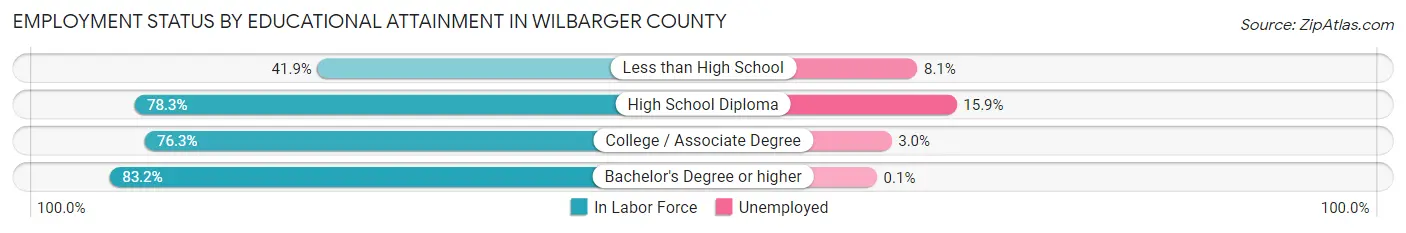
| Educational Attainment | In Labor Force | Unemployed |
| Less than High School | 628 (41.9%) | 121 (8.1%) |
| High School Diploma | 1,676 (78.3%) | 340 (15.9%) |
| College / Associate Degree | 1,351 (76.3%) | 53 (3.0%) |
| Bachelor's Degree or higher | 844 (83.2%) | 1 (0.1%) |
| Total | 4,497 (70.0%) | 514 (8.0%) |
Employment Occupations by Sex in Wilbarger County
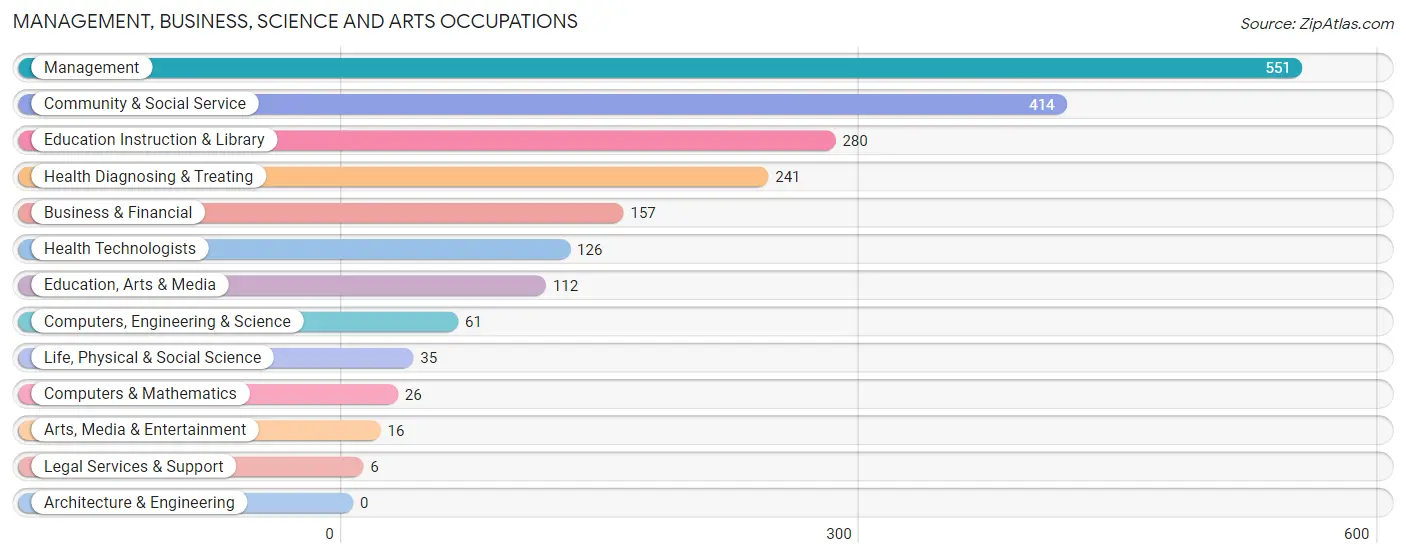
Management, Business, Science and Arts Occupations
The most common Management, Business, Science and Arts occupations in Wilbarger County are Management (551 | 10.0%), Community & Social Service (414 | 7.5%), Education Instruction & Library (280 | 5.1%), Health Diagnosing & Treating (241 | 4.4%), and Business & Financial (157 | 2.9%).
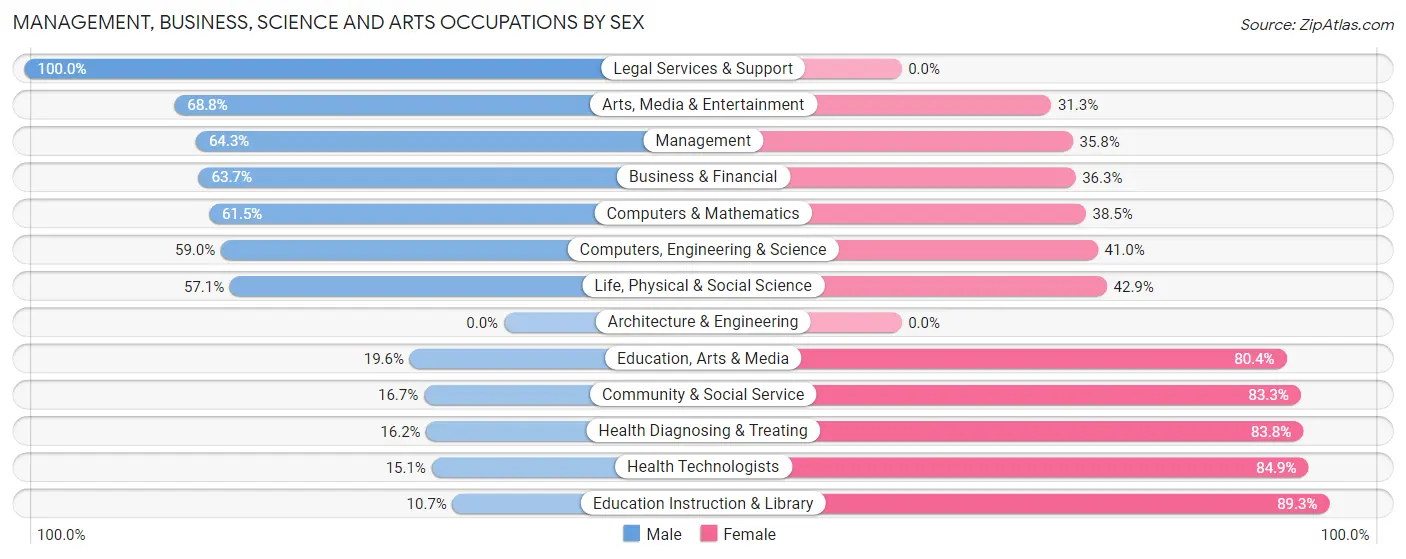
Management, Business, Science and Arts Occupations by Sex
Within the Management, Business, Science and Arts occupations in Wilbarger County, the most male-oriented occupations are Legal Services & Support (100.0%), Arts, Media & Entertainment (68.8%), and Management (64.2%), while the most female-oriented occupations are Education Instruction & Library (89.3%), Health Technologists (84.9%), and Health Diagnosing & Treating (83.8%).
| Occupation | Male | Female |
| Management | 354 (64.2%) | 197 (35.7%) |
| Business & Financial | 100 (63.7%) | 57 (36.3%) |
| Computers, Engineering & Science | 36 (59.0%) | 25 (41.0%) |
| Computers & Mathematics | 16 (61.5%) | 10 (38.5%) |
| Architecture & Engineering | 0 (0.0%) | 0 (0.0%) |
| Life, Physical & Social Science | 20 (57.1%) | 15 (42.9%) |
| Community & Social Service | 69 (16.7%) | 345 (83.3%) |
| Education, Arts & Media | 22 (19.6%) | 90 (80.4%) |
| Legal Services & Support | 6 (100.0%) | 0 (0.0%) |
| Education Instruction & Library | 30 (10.7%) | 250 (89.3%) |
| Arts, Media & Entertainment | 11 (68.8%) | 5 (31.2%) |
| Health Diagnosing & Treating | 39 (16.2%) | 202 (83.8%) |
| Health Technologists | 19 (15.1%) | 107 (84.9%) |
| Total (Category) | 598 (42.0%) | 826 (58.0%) |
| Total (Overall) | 2,845 (51.8%) | 2,650 (48.2%) |
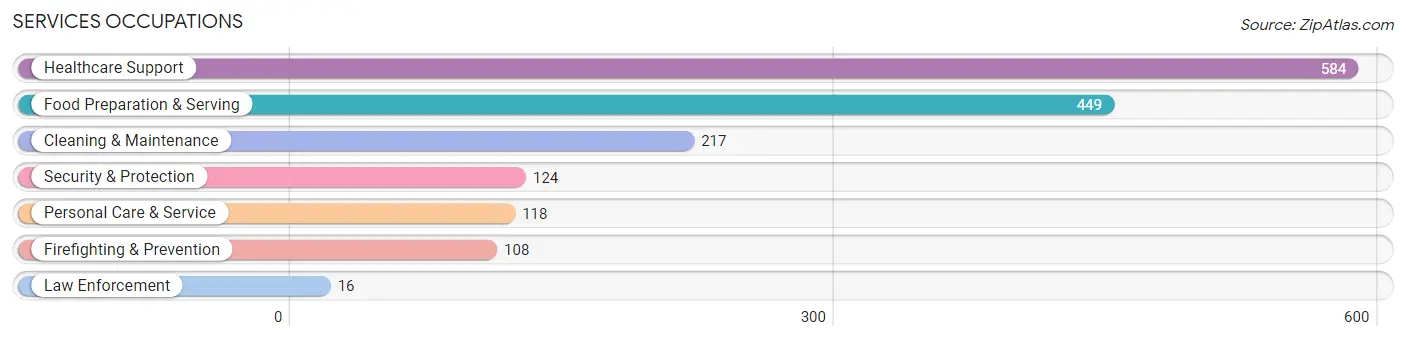
Services Occupations
The most common Services occupations in Wilbarger County are Healthcare Support (584 | 10.6%), Food Preparation & Serving (449 | 8.2%), Cleaning & Maintenance (217 | 4.0%), Security & Protection (124 | 2.3%), and Personal Care & Service (118 | 2.1%).
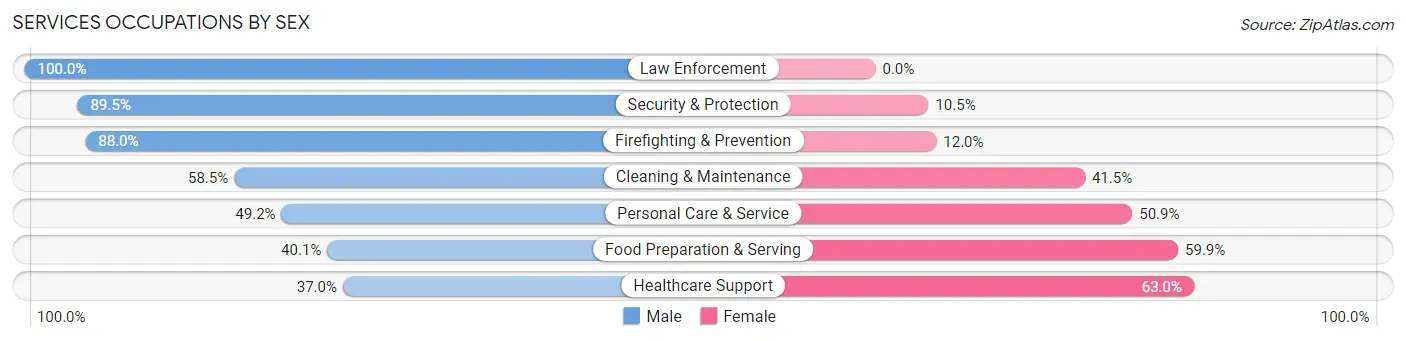
Services Occupations by Sex
Within the Services occupations in Wilbarger County, the most male-oriented occupations are Law Enforcement (100.0%), Security & Protection (89.5%), and Firefighting & Prevention (88.0%), while the most female-oriented occupations are Healthcare Support (63.0%), Food Preparation & Serving (59.9%), and Personal Care & Service (50.8%).
| Occupation | Male | Female |
| Healthcare Support | 216 (37.0%) | 368 (63.0%) |
| Security & Protection | 111 (89.5%) | 13 (10.5%) |
| Firefighting & Prevention | 95 (88.0%) | 13 (12.0%) |
| Law Enforcement | 16 (100.0%) | 0 (0.0%) |
| Food Preparation & Serving | 180 (40.1%) | 269 (59.9%) |
| Cleaning & Maintenance | 127 (58.5%) | 90 (41.5%) |
| Personal Care & Service | 58 (49.1%) | 60 (50.8%) |
| Total (Category) | 692 (46.4%) | 800 (53.6%) |
| Total (Overall) | 2,845 (51.8%) | 2,650 (48.2%) |
Sales and Office Occupations
The most common Sales and Office occupations in Wilbarger County are Office & Administration (675 | 12.3%), and Sales & Related (387 | 7.0%).
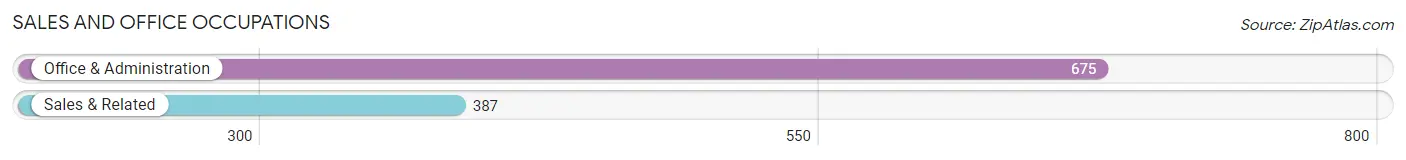
Sales and Office Occupations by Sex

| Occupation | Male | Female |
| Sales & Related | 221 (57.1%) | 166 (42.9%) |
| Office & Administration | 127 (18.8%) | 548 (81.2%) |
| Total (Category) | 348 (32.8%) | 714 (67.2%) |
| Total (Overall) | 2,845 (51.8%) | 2,650 (48.2%) |
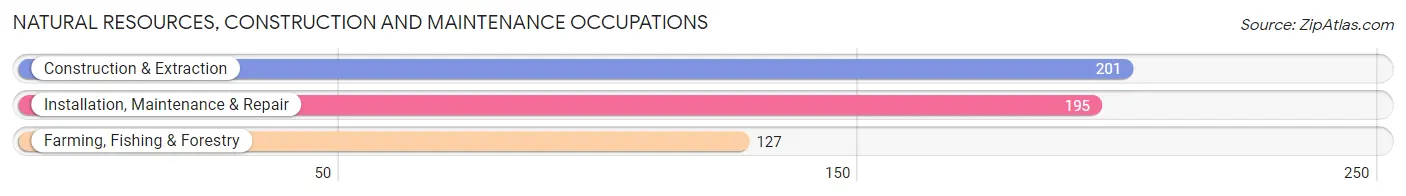
Natural Resources, Construction and Maintenance Occupations
The most common Natural Resources, Construction and Maintenance occupations in Wilbarger County are Construction & Extraction (201 | 3.7%), Installation, Maintenance & Repair (195 | 3.5%), and Farming, Fishing & Forestry (127 | 2.3%).
Natural Resources, Construction and Maintenance Occupations by Sex
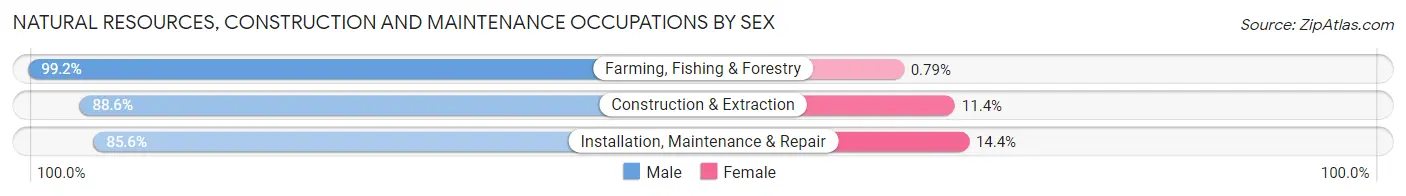
| Occupation | Male | Female |
| Farming, Fishing & Forestry | 126 (99.2%) | 1 (0.8%) |
| Construction & Extraction | 178 (88.6%) | 23 (11.4%) |
| Installation, Maintenance & Repair | 167 (85.6%) | 28 (14.4%) |
| Total (Category) | 471 (90.1%) | 52 (9.9%) |
| Total (Overall) | 2,845 (51.8%) | 2,650 (48.2%) |
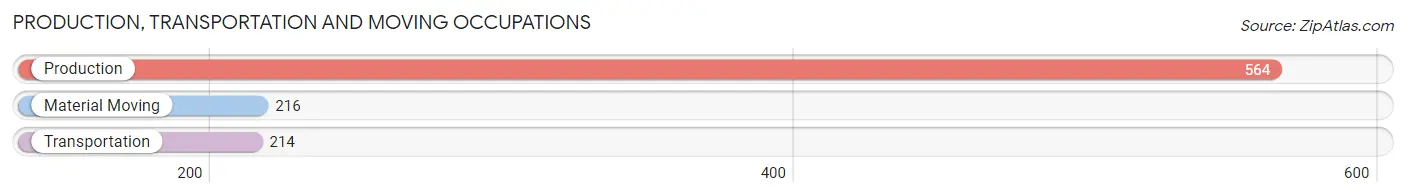
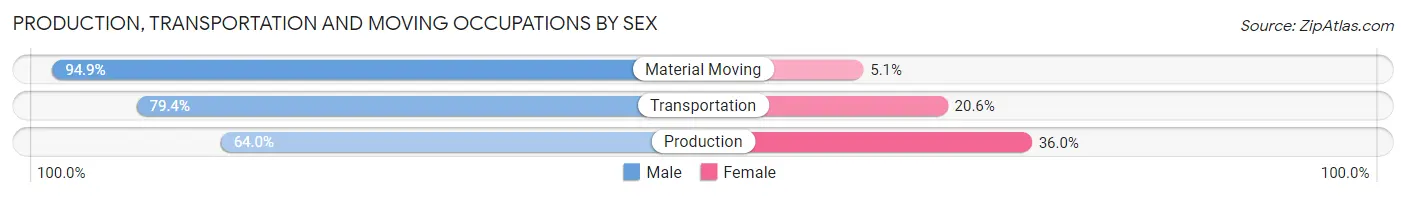
Production, Transportation and Moving Occupations
The most common Production, Transportation and Moving occupations in Wilbarger County are Production (564 | 10.3%), Material Moving (216 | 3.9%), and Transportation (214 | 3.9%).
Production, Transportation and Moving Occupations by Sex
| Occupation | Male | Female |
| Production | 361 (64.0%) | 203 (36.0%) |
| Transportation | 170 (79.4%) | 44 (20.6%) |
| Material Moving | 205 (94.9%) | 11 (5.1%) |
| Total (Category) | 736 (74.0%) | 258 (26.0%) |
| Total (Overall) | 2,845 (51.8%) | 2,650 (48.2%) |
Employment Industries by Sex in Wilbarger County
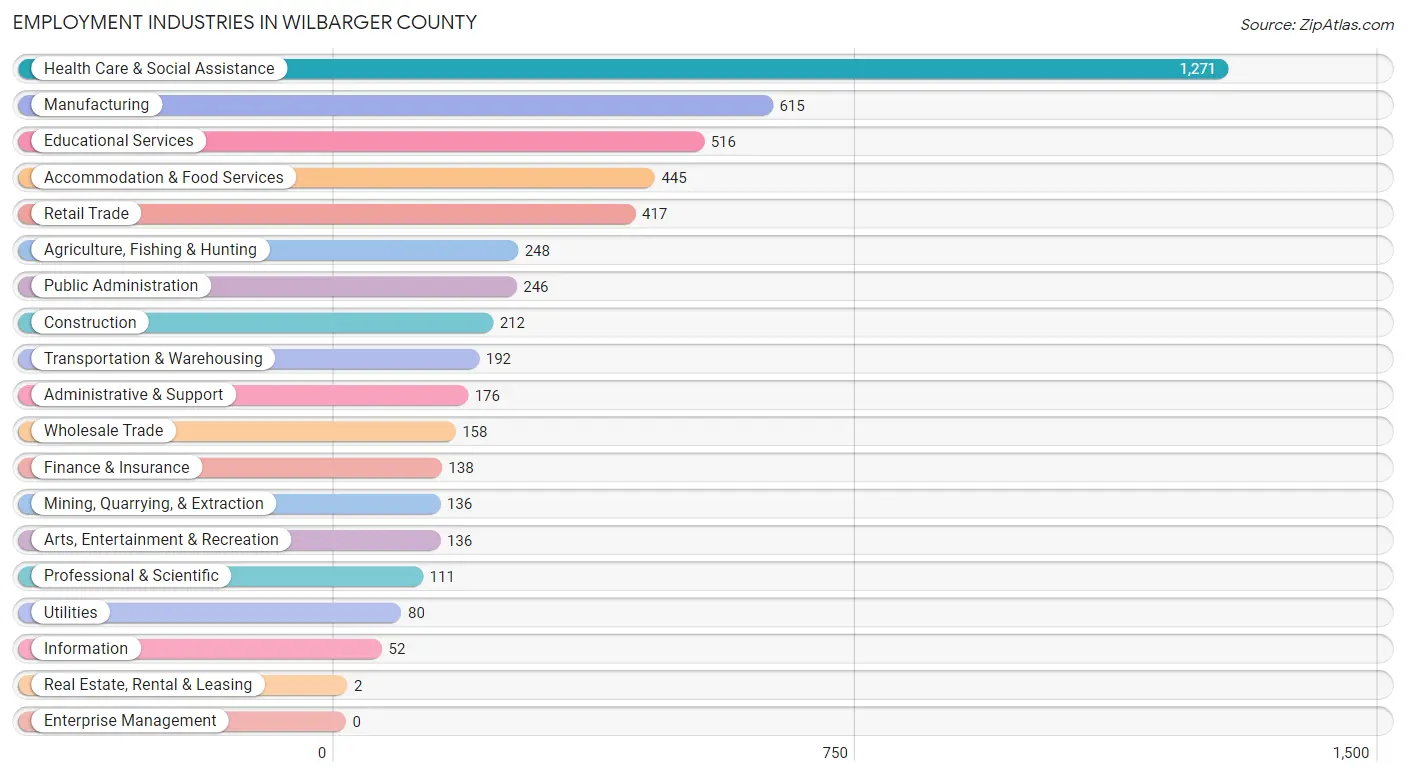
Employment Industries in Wilbarger County
The major employment industries in Wilbarger County include Health Care & Social Assistance (1,271 | 23.1%), Manufacturing (615 | 11.2%), Educational Services (516 | 9.4%), Accommodation & Food Services (445 | 8.1%), and Retail Trade (417 | 7.6%).
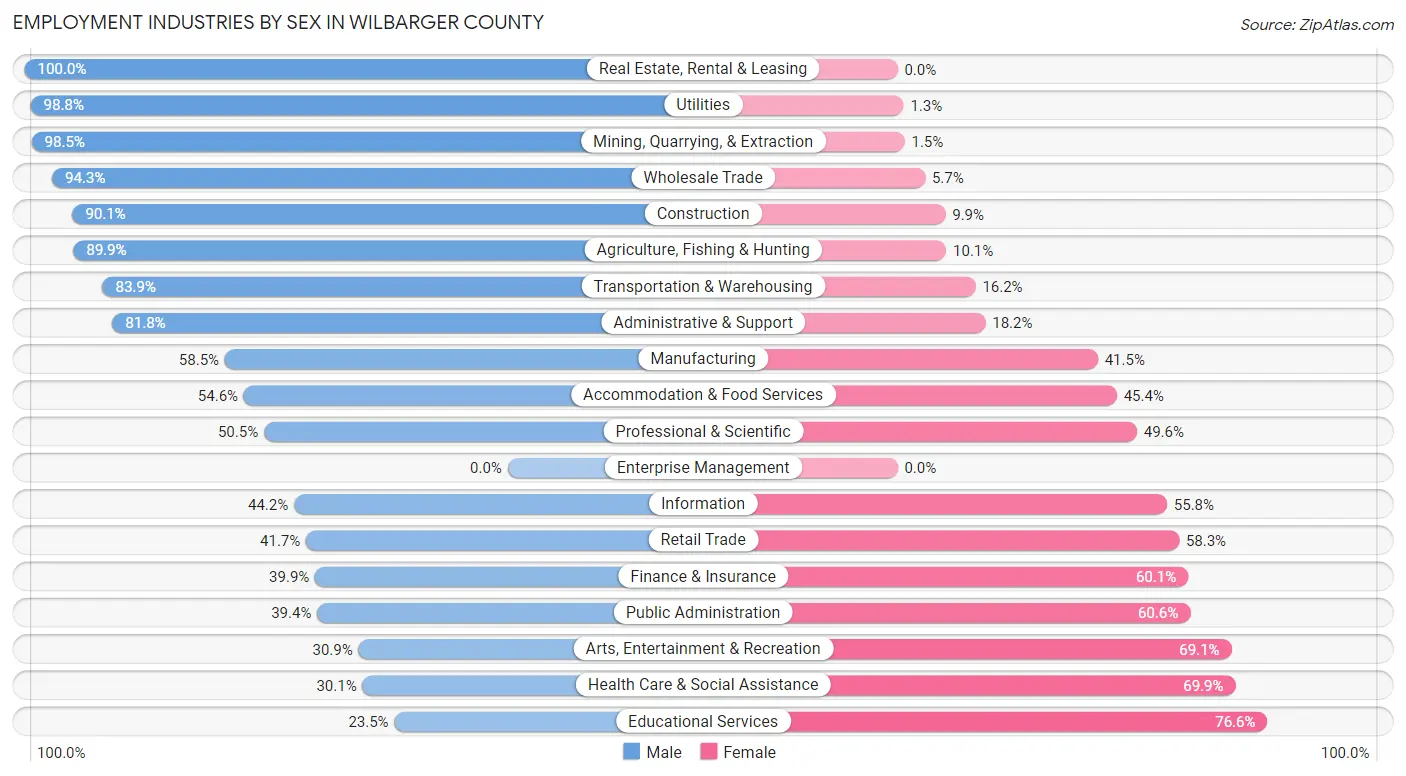
Employment Industries by Sex in Wilbarger County
The Wilbarger County industries that see more men than women are Real Estate, Rental & Leasing (100.0%), Utilities (98.8%), and Mining, Quarrying, & Extraction (98.5%), whereas the industries that tend to have a higher number of women are Educational Services (76.5%), Health Care & Social Assistance (69.9%), and Arts, Entertainment & Recreation (69.1%).
| Industry | Male | Female |
| Agriculture, Fishing & Hunting | 223 (89.9%) | 25 (10.1%) |
| Mining, Quarrying, & Extraction | 134 (98.5%) | 2 (1.5%) |
| Construction | 191 (90.1%) | 21 (9.9%) |
| Manufacturing | 360 (58.5%) | 255 (41.5%) |
| Wholesale Trade | 149 (94.3%) | 9 (5.7%) |
| Retail Trade | 174 (41.7%) | 243 (58.3%) |
| Transportation & Warehousing | 161 (83.9%) | 31 (16.2%) |
| Utilities | 79 (98.8%) | 1 (1.3%) |
| Information | 23 (44.2%) | 29 (55.8%) |
| Finance & Insurance | 55 (39.9%) | 83 (60.1%) |
| Real Estate, Rental & Leasing | 2 (100.0%) | 0 (0.0%) |
| Professional & Scientific | 56 (50.4%) | 55 (49.5%) |
| Enterprise Management | 0 (0.0%) | 0 (0.0%) |
| Administrative & Support | 144 (81.8%) | 32 (18.2%) |
| Educational Services | 121 (23.4%) | 395 (76.5%) |
| Health Care & Social Assistance | 382 (30.1%) | 889 (69.9%) |
| Arts, Entertainment & Recreation | 42 (30.9%) | 94 (69.1%) |
| Accommodation & Food Services | 243 (54.6%) | 202 (45.4%) |
| Public Administration | 97 (39.4%) | 149 (60.6%) |
| Total | 2,845 (51.8%) | 2,650 (48.2%) |
Education in Wilbarger County
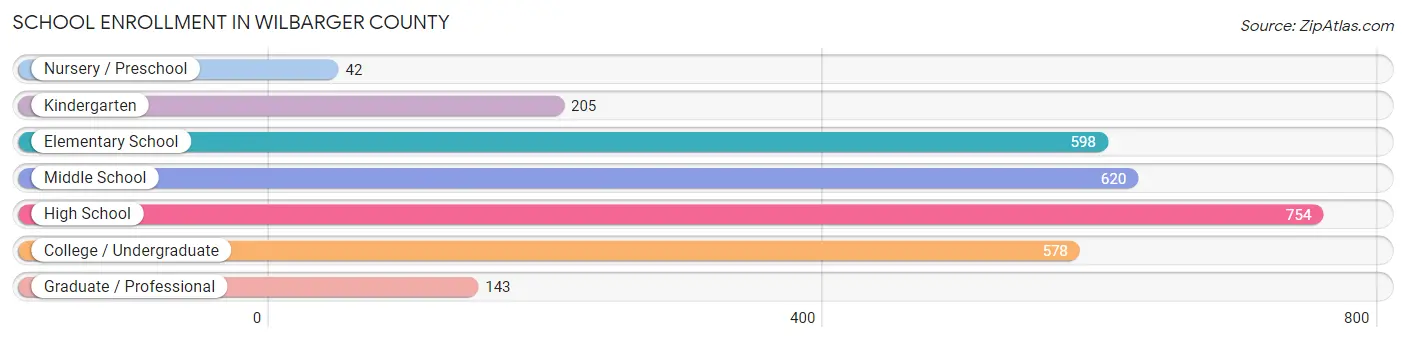
School Enrollment in Wilbarger County
The most common levels of schooling among the 2,940 students in Wilbarger County are high school (754 | 25.7%), middle school (620 | 21.1%), and elementary school (598 | 20.3%).
| School Level | # Students | % Students |
| Nursery / Preschool | 42 | 1.4% |
| Kindergarten | 205 | 7.0% |
| Elementary School | 598 | 20.3% |
| Middle School | 620 | 21.1% |
| High School | 754 | 25.7% |
| College / Undergraduate | 578 | 19.7% |
| Graduate / Professional | 143 | 4.9% |
| Total | 2,940 | 100.0% |
School Enrollment by Age by Funding Source in Wilbarger County
Out of a total of 2,940 students who are enrolled in schools in Wilbarger County, 88 (3.0%) attend a private institution, while the remaining 2,852 (97.0%) are enrolled in public schools. The age group of 20 to 24 year olds has the highest likelihood of being enrolled in private schools, with 43 (25.4% in the age bracket) enrolled. Conversely, the age group of 25 to 34 year olds has the lowest likelihood of being enrolled in a private school, with 354 (100.0% in the age bracket) attending a public institution.
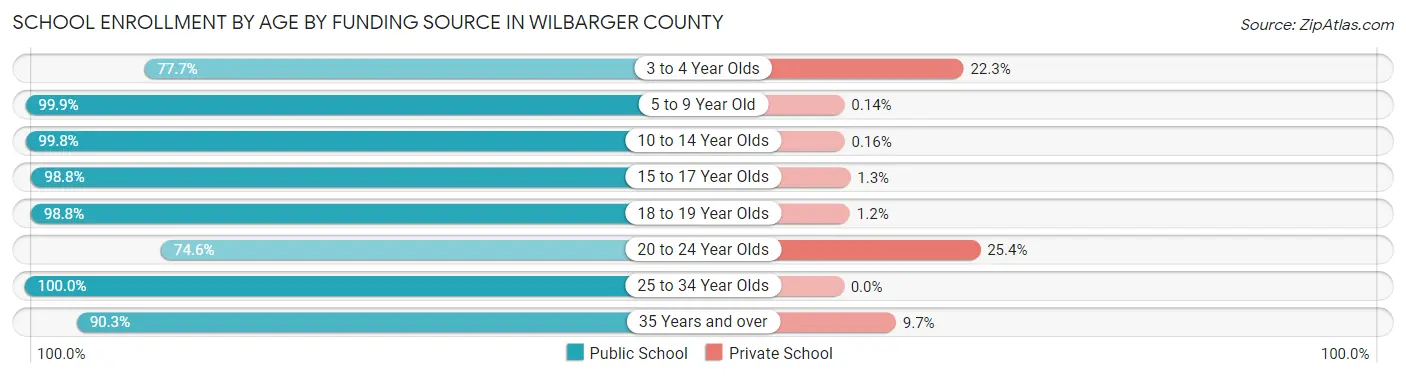
| Age Bracket | Public School | Private School |
| 3 to 4 Year Olds | 87 (77.7%) | 25 (22.3%) |
| 5 to 9 Year Old | 699 (99.9%) | 1 (0.1%) |
| 10 to 14 Year Olds | 632 (99.8%) | 1 (0.2%) |
| 15 to 17 Year Olds | 633 (98.8%) | 8 (1.3%) |
| 18 to 19 Year Olds | 256 (98.8%) | 3 (1.2%) |
| 20 to 24 Year Olds | 126 (74.6%) | 43 (25.4%) |
| 25 to 34 Year Olds | 354 (100.0%) | 0 (0.0%) |
| 35 Years and over | 65 (90.3%) | 7 (9.7%) |
| Total | 2,852 (97.0%) | 88 (3.0%) |
Educational Attainment by Field of Study in Wilbarger County
Education (428 | 28.4%), science & technology (238 | 15.8%), bio, nature & agricultural (161 | 10.7%), arts & humanities (160 | 10.6%), and business (140 | 9.3%) are the most common fields of study among 1,505 individuals in Wilbarger County who have obtained a bachelor's degree or higher.
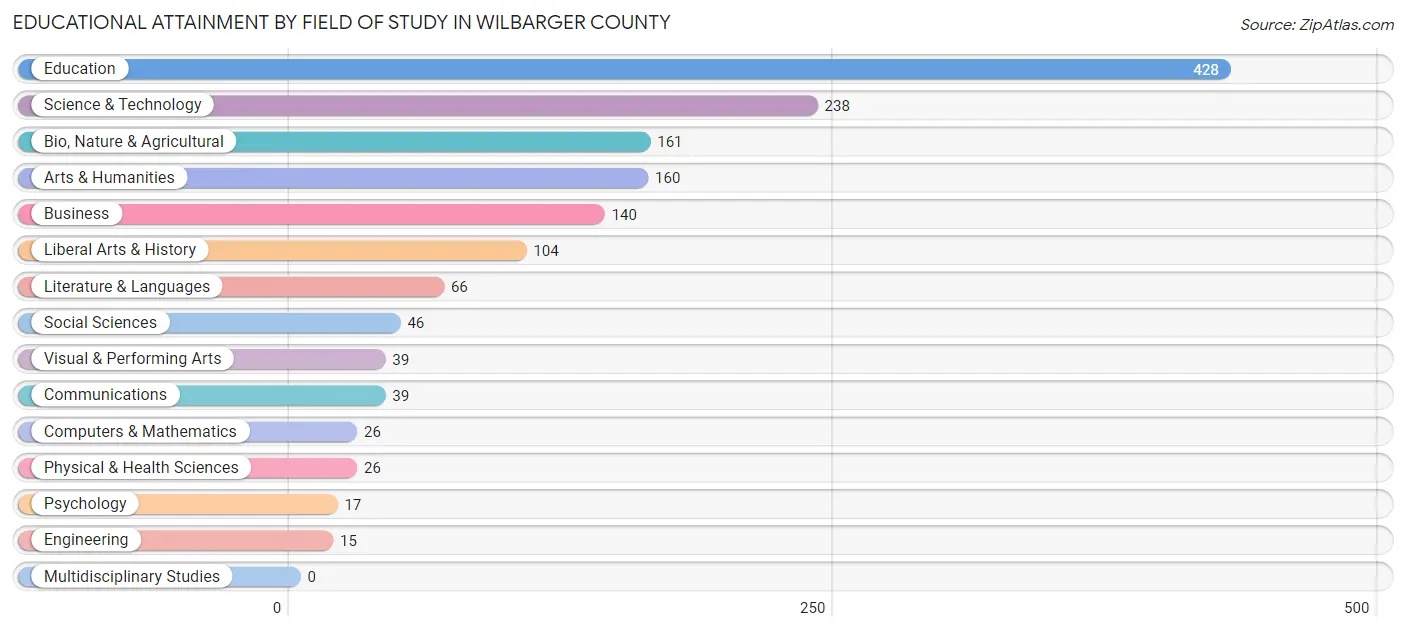
| Field of Study | # Graduates | % Graduates |
| Computers & Mathematics | 26 | 1.7% |
| Bio, Nature & Agricultural | 161 | 10.7% |
| Physical & Health Sciences | 26 | 1.7% |
| Psychology | 17 | 1.1% |
| Social Sciences | 46 | 3.1% |
| Engineering | 15 | 1.0% |
| Multidisciplinary Studies | 0 | 0.0% |
| Science & Technology | 238 | 15.8% |
| Business | 140 | 9.3% |
| Education | 428 | 28.4% |
| Literature & Languages | 66 | 4.4% |
| Liberal Arts & History | 104 | 6.9% |
| Visual & Performing Arts | 39 | 2.6% |
| Communications | 39 | 2.6% |
| Arts & Humanities | 160 | 10.6% |
| Total | 1,505 | 100.0% |
Transportation & Commute in Wilbarger County
Vehicle Availability by Sex in Wilbarger County
The most prevalent vehicle ownership categories in Wilbarger County are males with 2 vehicles (1,026, accounting for 36.9%) and females with 2 vehicles (1,176, making up 39.6%).
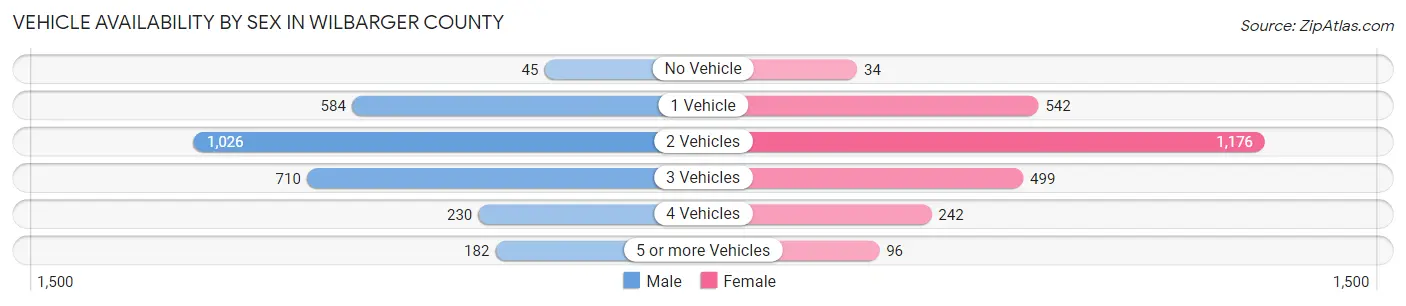
| Vehicles Available | Male | Female |
| No Vehicle | 45 (1.6%) | 34 (1.3%) |
| 1 Vehicle | 584 (21.0%) | 542 (20.9%) |
| 2 Vehicles | 1,026 (36.9%) | 1,176 (45.4%) |
| 3 Vehicles | 710 (25.6%) | 499 (19.3%) |
| 4 Vehicles | 230 (8.3%) | 242 (9.3%) |
| 5 or more Vehicles | 182 (6.6%) | 96 (3.7%) |
| Total | 2,777 (100.0%) | 2,589 (100.0%) |
Commute Time in Wilbarger County
The most frequently occuring commute durations in Wilbarger County are 5 to 9 minutes (1,919 commuters, 36.5%), 10 to 14 minutes (1,099 commuters, 20.9%), and 20 to 24 minutes (538 commuters, 10.2%).
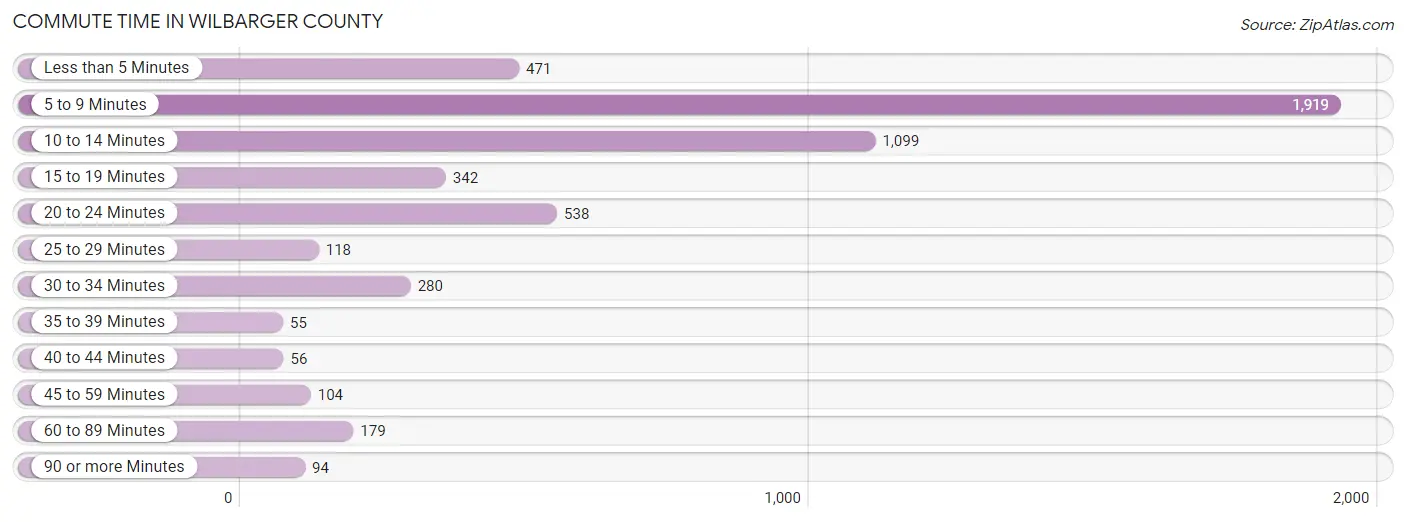
| Commute Time | # Commuters | % Commuters |
| Less than 5 Minutes | 471 | 9.0% |
| 5 to 9 Minutes | 1,919 | 36.5% |
| 10 to 14 Minutes | 1,099 | 20.9% |
| 15 to 19 Minutes | 342 | 6.5% |
| 20 to 24 Minutes | 538 | 10.2% |
| 25 to 29 Minutes | 118 | 2.2% |
| 30 to 34 Minutes | 280 | 5.3% |
| 35 to 39 Minutes | 55 | 1.1% |
| 40 to 44 Minutes | 56 | 1.1% |
| 45 to 59 Minutes | 104 | 2.0% |
| 60 to 89 Minutes | 179 | 3.4% |
| 90 or more Minutes | 94 | 1.8% |
Commute Time by Sex in Wilbarger County
The most common commute times in Wilbarger County are 5 to 9 minutes (764 commuters, 27.9%) for males and 5 to 9 minutes (1,155 commuters, 45.9%) for females.
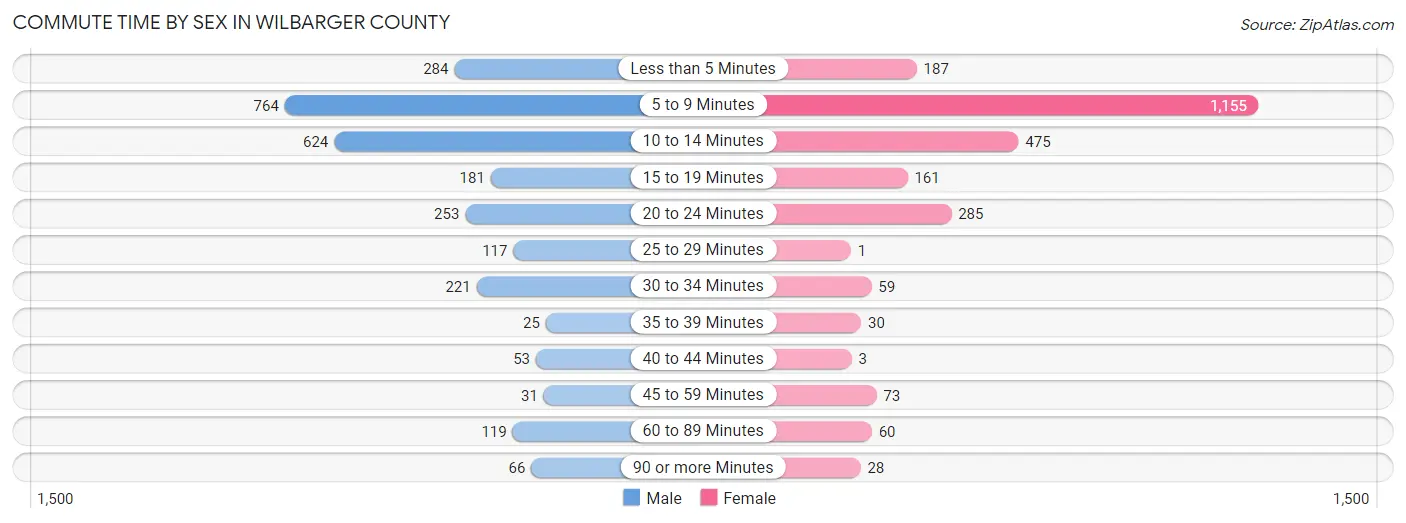
| Commute Time | Male | Female |
| Less than 5 Minutes | 284 (10.4%) | 187 (7.4%) |
| 5 to 9 Minutes | 764 (27.9%) | 1,155 (45.9%) |
| 10 to 14 Minutes | 624 (22.8%) | 475 (18.9%) |
| 15 to 19 Minutes | 181 (6.6%) | 161 (6.4%) |
| 20 to 24 Minutes | 253 (9.2%) | 285 (11.3%) |
| 25 to 29 Minutes | 117 (4.3%) | 1 (0.0%) |
| 30 to 34 Minutes | 221 (8.1%) | 59 (2.3%) |
| 35 to 39 Minutes | 25 (0.9%) | 30 (1.2%) |
| 40 to 44 Minutes | 53 (1.9%) | 3 (0.1%) |
| 45 to 59 Minutes | 31 (1.1%) | 73 (2.9%) |
| 60 to 89 Minutes | 119 (4.3%) | 60 (2.4%) |
| 90 or more Minutes | 66 (2.4%) | 28 (1.1%) |
Time of Departure to Work by Sex in Wilbarger County
The most frequent times of departure to work in Wilbarger County are 6:00 AM to 6:29 AM (416, 15.2%) for males and 7:30 AM to 7:59 AM (518, 20.6%) for females.
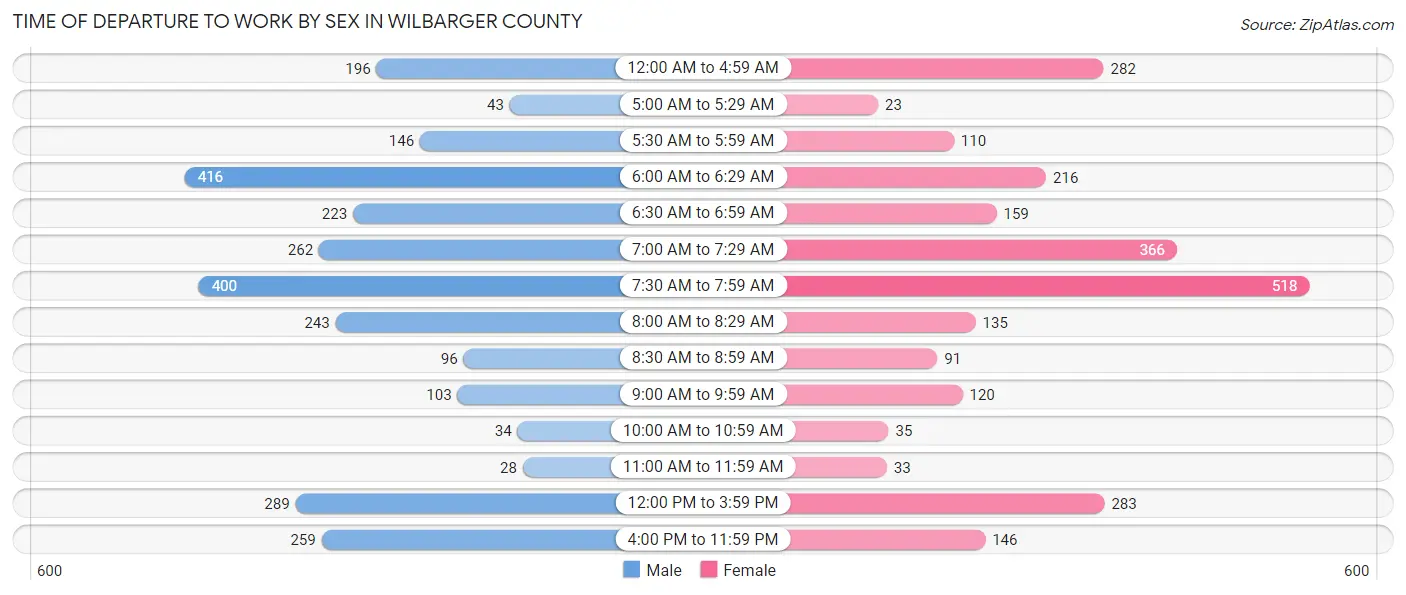
| Time of Departure | Male | Female |
| 12:00 AM to 4:59 AM | 196 (7.2%) | 282 (11.2%) |
| 5:00 AM to 5:29 AM | 43 (1.6%) | 23 (0.9%) |
| 5:30 AM to 5:59 AM | 146 (5.3%) | 110 (4.4%) |
| 6:00 AM to 6:29 AM | 416 (15.2%) | 216 (8.6%) |
| 6:30 AM to 6:59 AM | 223 (8.1%) | 159 (6.3%) |
| 7:00 AM to 7:29 AM | 262 (9.6%) | 366 (14.5%) |
| 7:30 AM to 7:59 AM | 400 (14.6%) | 518 (20.6%) |
| 8:00 AM to 8:29 AM | 243 (8.9%) | 135 (5.4%) |
| 8:30 AM to 8:59 AM | 96 (3.5%) | 91 (3.6%) |
| 9:00 AM to 9:59 AM | 103 (3.8%) | 120 (4.8%) |
| 10:00 AM to 10:59 AM | 34 (1.2%) | 35 (1.4%) |
| 11:00 AM to 11:59 AM | 28 (1.0%) | 33 (1.3%) |
| 12:00 PM to 3:59 PM | 289 (10.6%) | 283 (11.2%) |
| 4:00 PM to 11:59 PM | 259 (9.5%) | 146 (5.8%) |
| Total | 2,738 (100.0%) | 2,517 (100.0%) |
Housing Occupancy in Wilbarger County
Occupancy by Ownership in Wilbarger County
Of the total 4,626 dwellings in Wilbarger County, owner-occupied units account for 2,735 (59.1%), while renter-occupied units make up 1,891 (40.9%).
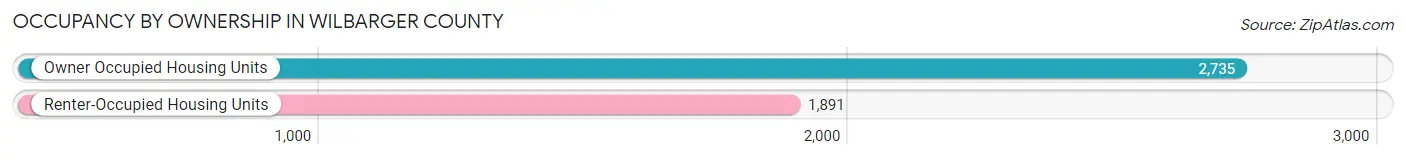
| Occupancy | # Housing Units | % Housing Units |
| Owner Occupied Housing Units | 2,735 | 59.1% |
| Renter-Occupied Housing Units | 1,891 | 40.9% |
| Total Occupied Housing Units | 4,626 | 100.0% |
Occupancy by Household Size in Wilbarger County
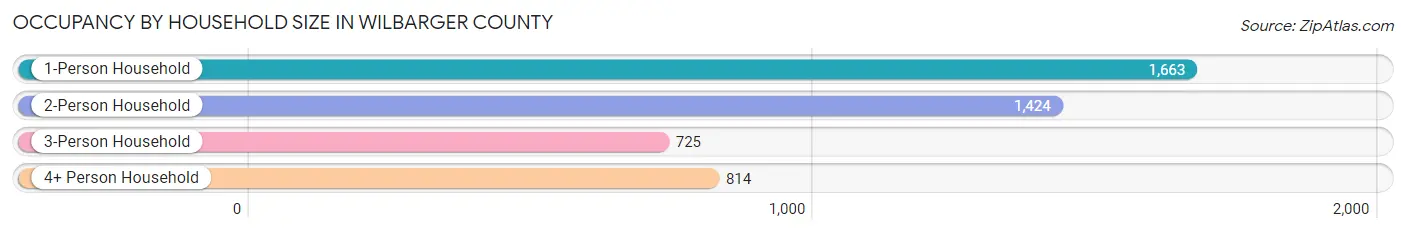
| Household Size | # Housing Units | % Housing Units |
| 1-Person Household | 1,663 | 35.9% |
| 2-Person Household | 1,424 | 30.8% |
| 3-Person Household | 725 | 15.7% |
| 4+ Person Household | 814 | 17.6% |
| Total Housing Units | 4,626 | 100.0% |
Occupancy by Ownership by Household Size in Wilbarger County
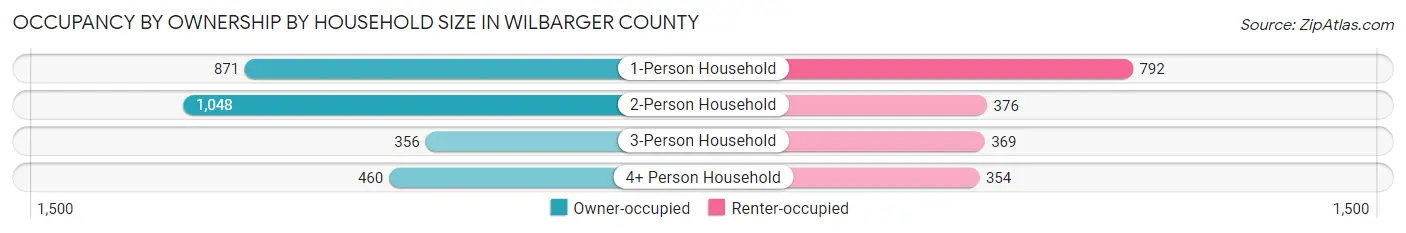
| Household Size | Owner-occupied | Renter-occupied |
| 1-Person Household | 871 (52.4%) | 792 (47.6%) |
| 2-Person Household | 1,048 (73.6%) | 376 (26.4%) |
| 3-Person Household | 356 (49.1%) | 369 (50.9%) |
| 4+ Person Household | 460 (56.5%) | 354 (43.5%) |
| Total Housing Units | 2,735 (59.1%) | 1,891 (40.9%) |
Occupancy by Educational Attainment in Wilbarger County
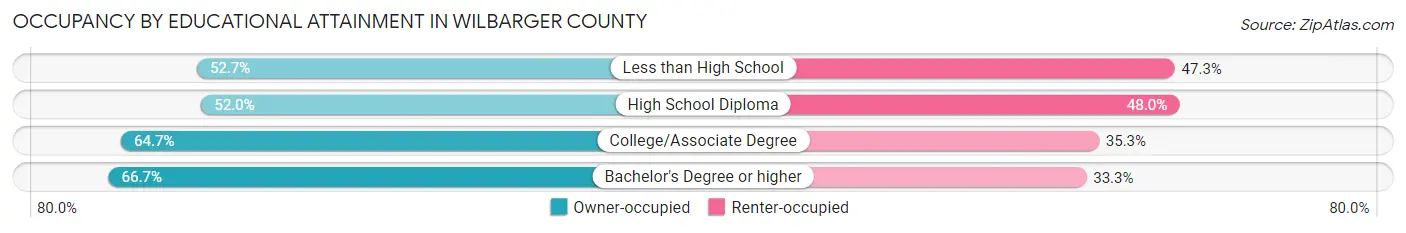
| Household Size | Owner-occupied | Renter-occupied |
| Less than High School | 435 (52.7%) | 391 (47.3%) |
| High School Diploma | 715 (52.0%) | 661 (48.0%) |
| College/Associate Degree | 1,009 (64.7%) | 551 (35.3%) |
| Bachelor's Degree or higher | 576 (66.7%) | 288 (33.3%) |
Occupancy by Age of Householder in Wilbarger County
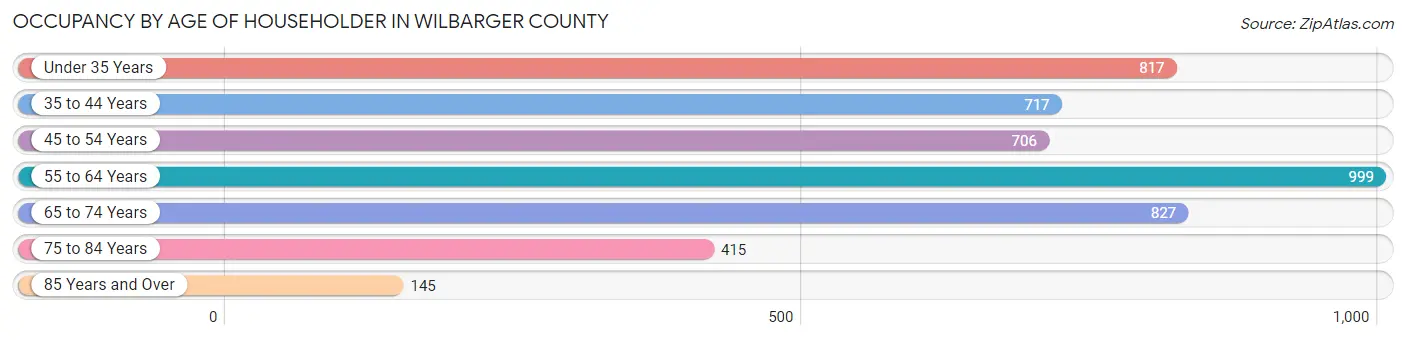
| Age Bracket | # Households | % Households |
| Under 35 Years | 817 | 17.7% |
| 35 to 44 Years | 717 | 15.5% |
| 45 to 54 Years | 706 | 15.3% |
| 55 to 64 Years | 999 | 21.6% |
| 65 to 74 Years | 827 | 17.9% |
| 75 to 84 Years | 415 | 9.0% |
| 85 Years and Over | 145 | 3.1% |
| Total | 4,626 | 100.0% |
Housing Finances in Wilbarger County
Median Income by Occupancy in Wilbarger County
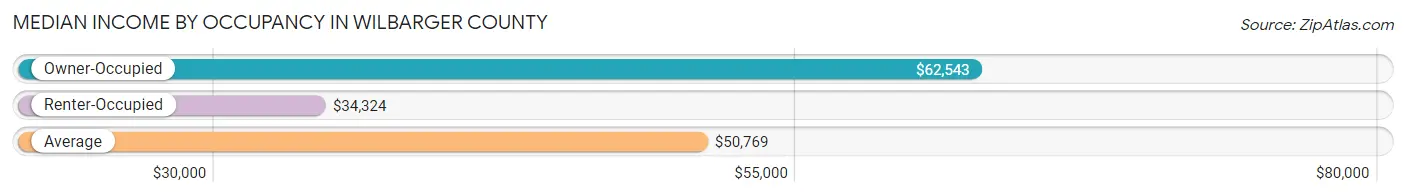
| Occupancy Type | # Households | Median Income |
| Owner-Occupied | 2,735 (59.1%) | $62,543 |
| Renter-Occupied | 1,891 (40.9%) | $34,324 |
| Average | 4,626 (100.0%) | $50,769 |
Occupancy by Householder Income Bracket in Wilbarger County
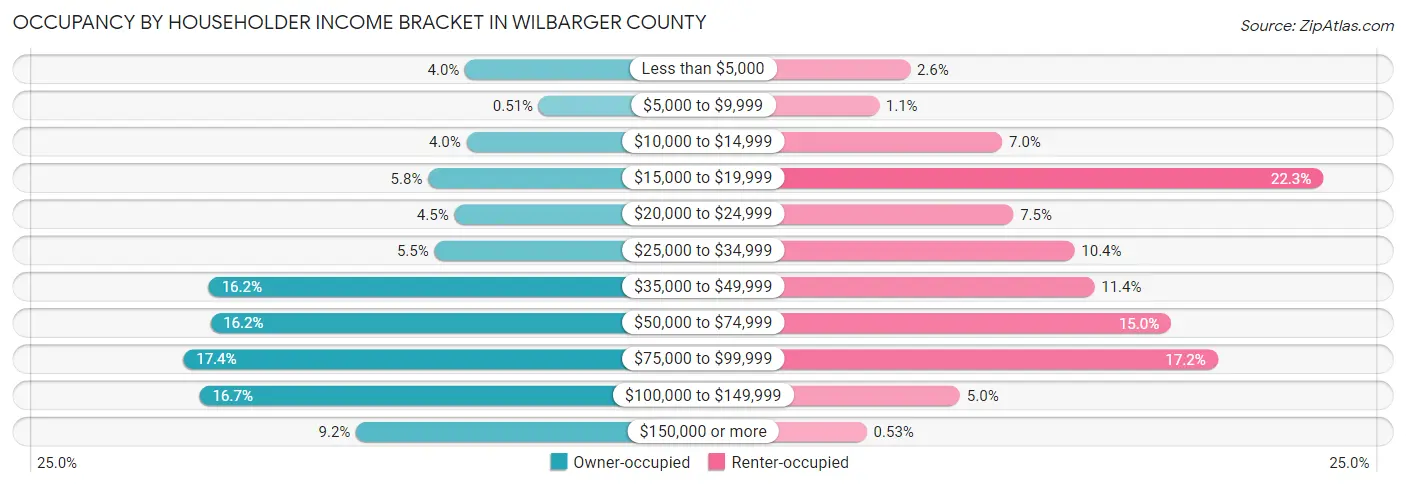
| Income Bracket | Owner-occupied | Renter-occupied |
| Less than $5,000 | 110 (4.0%) | 49 (2.6%) |
| $5,000 to $9,999 | 14 (0.5%) | 21 (1.1%) |
| $10,000 to $14,999 | 108 (4.0%) | 132 (7.0%) |
| $15,000 to $19,999 | 158 (5.8%) | 421 (22.3%) |
| $20,000 to $24,999 | 124 (4.5%) | 142 (7.5%) |
| $25,000 to $34,999 | 150 (5.5%) | 197 (10.4%) |
| $35,000 to $49,999 | 444 (16.2%) | 215 (11.4%) |
| $50,000 to $74,999 | 442 (16.2%) | 284 (15.0%) |
| $75,000 to $99,999 | 477 (17.4%) | 326 (17.2%) |
| $100,000 to $149,999 | 456 (16.7%) | 94 (5.0%) |
| $150,000 or more | 252 (9.2%) | 10 (0.5%) |
| Total | 2,735 (100.0%) | 1,891 (100.0%) |
Monthly Housing Cost Tiers in Wilbarger County
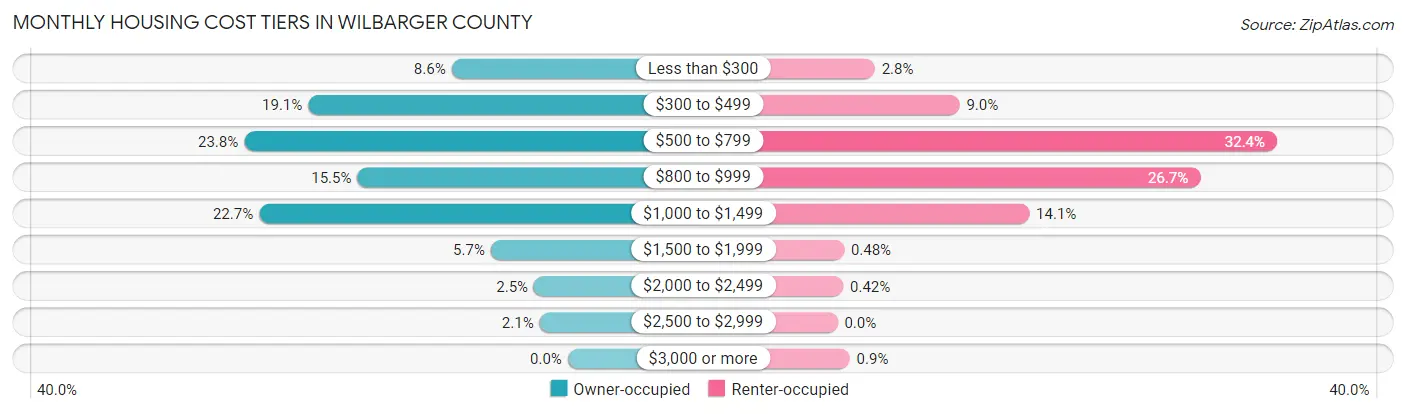
| Monthly Cost | Owner-occupied | Renter-occupied |
| Less than $300 | 234 (8.6%) | 52 (2.8%) |
| $300 to $499 | 523 (19.1%) | 170 (9.0%) |
| $500 to $799 | 652 (23.8%) | 612 (32.4%) |
| $800 to $999 | 424 (15.5%) | 505 (26.7%) |
| $1,000 to $1,499 | 622 (22.7%) | 267 (14.1%) |
| $1,500 to $1,999 | 155 (5.7%) | 9 (0.5%) |
| $2,000 to $2,499 | 68 (2.5%) | 8 (0.4%) |
| $2,500 to $2,999 | 57 (2.1%) | 0 (0.0%) |
| $3,000 or more | 0 (0.0%) | 17 (0.9%) |
| Total | 2,735 (100.0%) | 1,891 (100.0%) |
Physical Housing Characteristics in Wilbarger County
Housing Structures in Wilbarger County
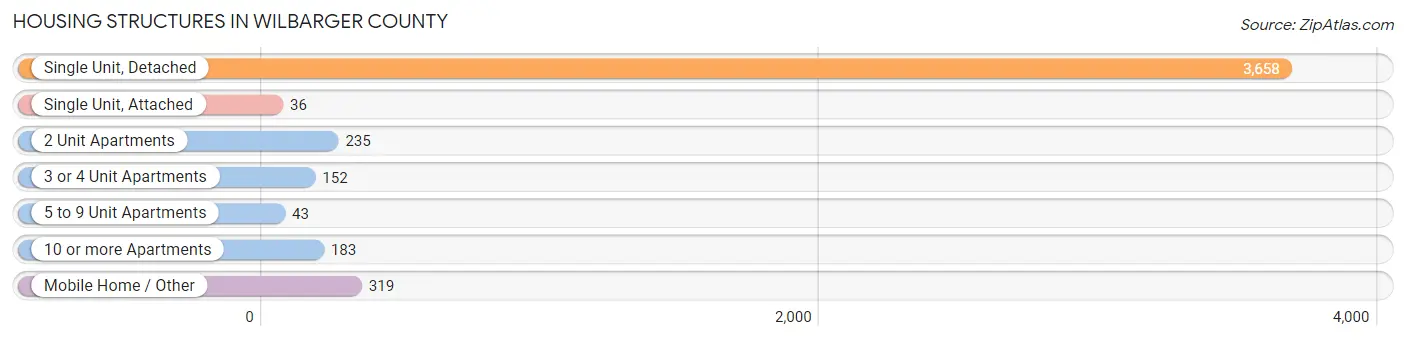
| Structure Type | # Housing Units | % Housing Units |
| Single Unit, Detached | 3,658 | 79.1% |
| Single Unit, Attached | 36 | 0.8% |
| 2 Unit Apartments | 235 | 5.1% |
| 3 or 4 Unit Apartments | 152 | 3.3% |
| 5 to 9 Unit Apartments | 43 | 0.9% |
| 10 or more Apartments | 183 | 4.0% |
| Mobile Home / Other | 319 | 6.9% |
| Total | 4,626 | 100.0% |
Housing Structures by Occupancy in Wilbarger County
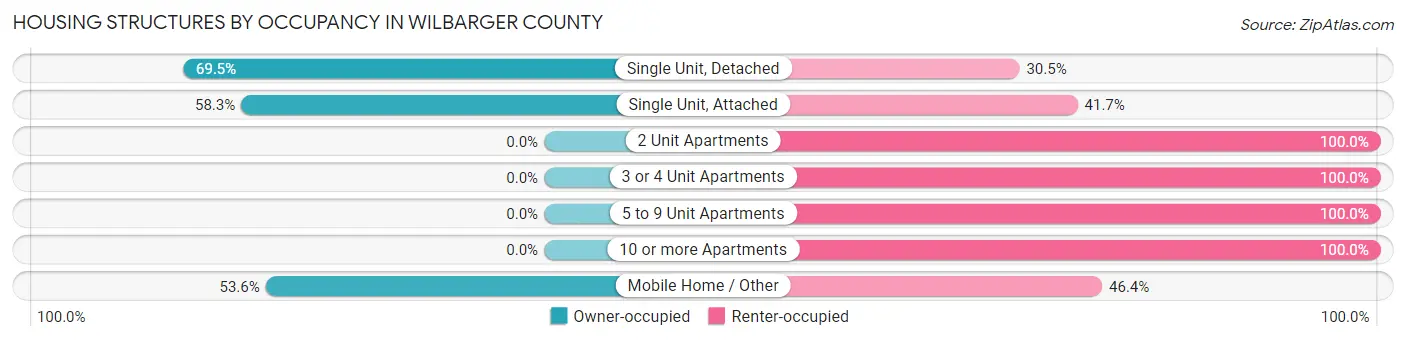
| Structure Type | Owner-occupied | Renter-occupied |
| Single Unit, Detached | 2,543 (69.5%) | 1,115 (30.5%) |
| Single Unit, Attached | 21 (58.3%) | 15 (41.7%) |
| 2 Unit Apartments | 0 (0.0%) | 235 (100.0%) |
| 3 or 4 Unit Apartments | 0 (0.0%) | 152 (100.0%) |
| 5 to 9 Unit Apartments | 0 (0.0%) | 43 (100.0%) |
| 10 or more Apartments | 0 (0.0%) | 183 (100.0%) |
| Mobile Home / Other | 171 (53.6%) | 148 (46.4%) |
| Total | 2,735 (59.1%) | 1,891 (40.9%) |
Housing Structures by Number of Rooms in Wilbarger County

| Number of Rooms | Owner-occupied | Renter-occupied |
| 1 Room | 3 (0.1%) | 14 (0.7%) |
| 2 or 3 Rooms | 114 (4.2%) | 298 (15.8%) |
| 4 or 5 Rooms | 1,235 (45.2%) | 1,073 (56.7%) |
| 6 or 7 Rooms | 1,034 (37.8%) | 472 (25.0%) |
| 8 or more Rooms | 349 (12.8%) | 34 (1.8%) |
| Total | 2,735 (100.0%) | 1,891 (100.0%) |
Housing Structure by Heating Type in Wilbarger County
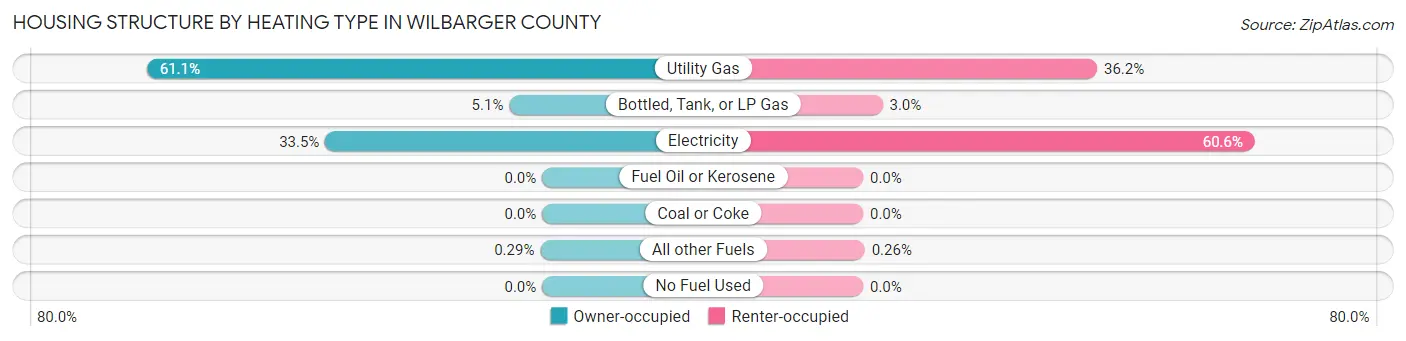
| Heating Type | Owner-occupied | Renter-occupied |
| Utility Gas | 1,671 (61.1%) | 684 (36.2%) |
| Bottled, Tank, or LP Gas | 139 (5.1%) | 57 (3.0%) |
| Electricity | 917 (33.5%) | 1,145 (60.6%) |
| Fuel Oil or Kerosene | 0 (0.0%) | 0 (0.0%) |
| Coal or Coke | 0 (0.0%) | 0 (0.0%) |
| All other Fuels | 8 (0.3%) | 5 (0.3%) |
| No Fuel Used | 0 (0.0%) | 0 (0.0%) |
| Total | 2,735 (100.0%) | 1,891 (100.0%) |
Household Vehicle Usage in Wilbarger County
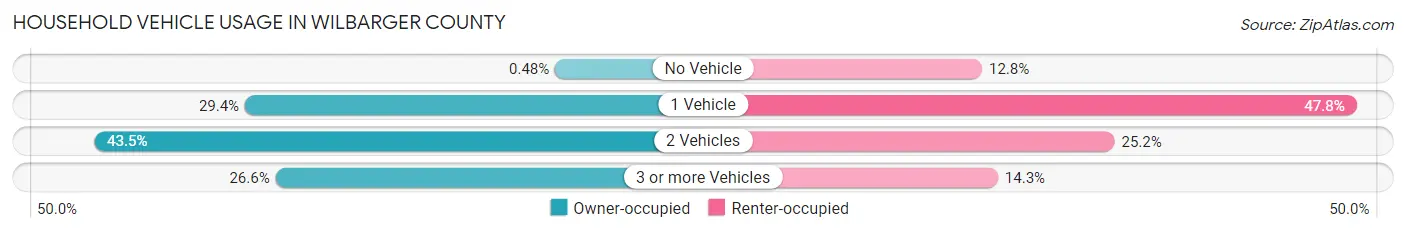
| Vehicles per Household | Owner-occupied | Renter-occupied |
| No Vehicle | 13 (0.5%) | 242 (12.8%) |
| 1 Vehicle | 805 (29.4%) | 903 (47.7%) |
| 2 Vehicles | 1,190 (43.5%) | 476 (25.2%) |
| 3 or more Vehicles | 727 (26.6%) | 270 (14.3%) |
| Total | 2,735 (100.0%) | 1,891 (100.0%) |
Real Estate & Mortgages in Wilbarger County
Real Estate and Mortgage Overview in Wilbarger County
| Characteristic | Without Mortgage | With Mortgage |
| Housing Units | 1,601 | 1,134 |
| Median Property Value | $71,700 | $99,600 |
| Median Household Income | $46,632 | $84 |
| Monthly Housing Costs | $516 | $0 |
| Real Estate Taxes | $1,008 | $76 |
Property Value by Mortgage Status in Wilbarger County
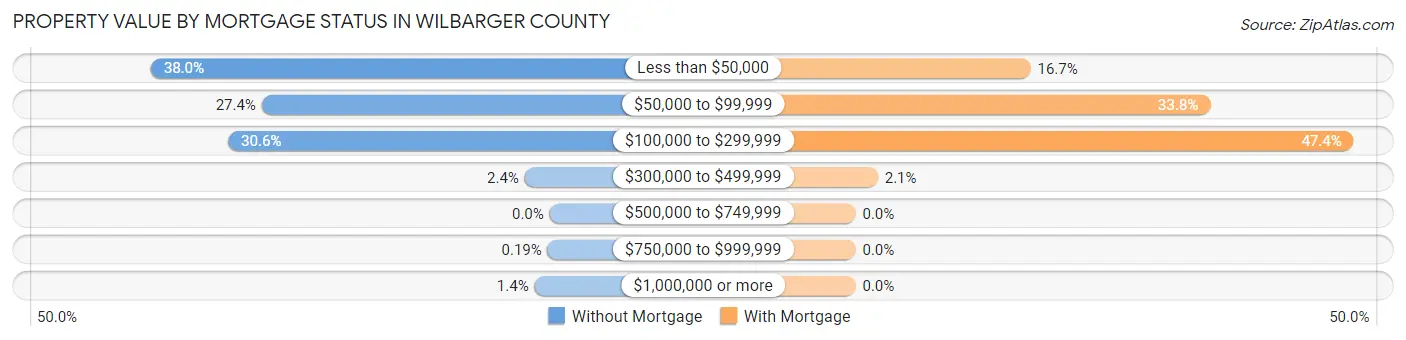
| Property Value | Without Mortgage | With Mortgage |
| Less than $50,000 | 608 (38.0%) | 189 (16.7%) |
| $50,000 to $99,999 | 439 (27.4%) | 383 (33.8%) |
| $100,000 to $299,999 | 490 (30.6%) | 538 (47.4%) |
| $300,000 to $499,999 | 38 (2.4%) | 24 (2.1%) |
| $500,000 to $749,999 | 0 (0.0%) | 0 (0.0%) |
| $750,000 to $999,999 | 3 (0.2%) | 0 (0.0%) |
| $1,000,000 or more | 23 (1.4%) | 0 (0.0%) |
| Total | 1,601 (100.0%) | 1,134 (100.0%) |
Household Income by Mortgage Status in Wilbarger County
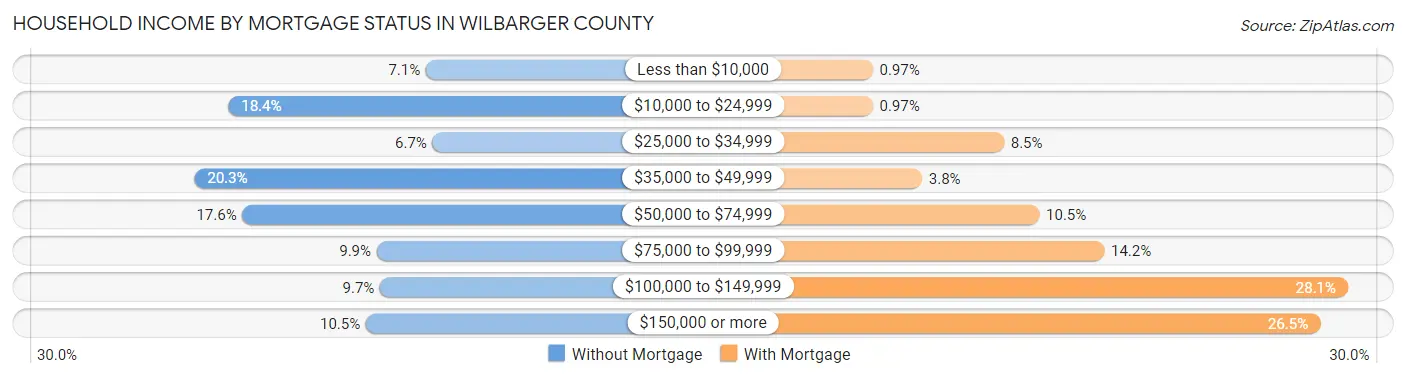
| Household Income | Without Mortgage | With Mortgage |
| Less than $10,000 | 113 (7.1%) | 11 (1.0%) |
| $10,000 to $24,999 | 294 (18.4%) | 11 (1.0%) |
| $25,000 to $34,999 | 107 (6.7%) | 96 (8.5%) |
| $35,000 to $49,999 | 325 (20.3%) | 43 (3.8%) |
| $50,000 to $74,999 | 281 (17.5%) | 119 (10.5%) |
| $75,000 to $99,999 | 158 (9.9%) | 161 (14.2%) |
| $100,000 to $149,999 | 155 (9.7%) | 319 (28.1%) |
| $150,000 or more | 168 (10.5%) | 301 (26.5%) |
| Total | 1,601 (100.0%) | 1,134 (100.0%) |
Property Value to Household Income Ratio in Wilbarger County
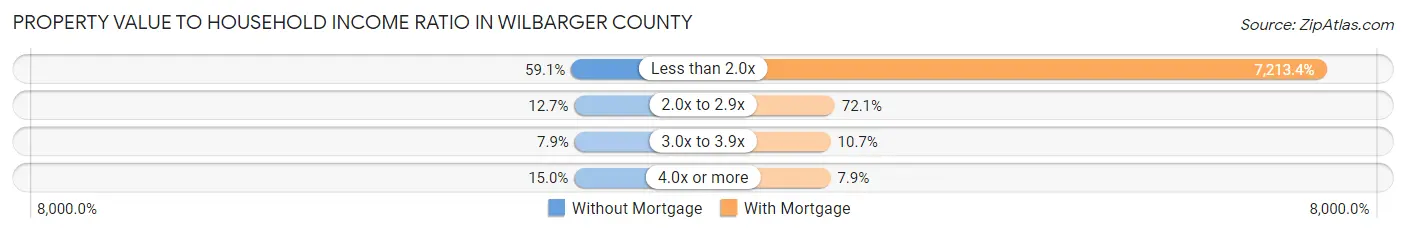
| Value-to-Income Ratio | Without Mortgage | With Mortgage |
| Less than 2.0x | 946 (59.1%) | 81,800 (7,213.4%) |
| 2.0x to 2.9x | 204 (12.7%) | 817 (72.1%) |
| 3.0x to 3.9x | 126 (7.9%) | 121 (10.7%) |
| 4.0x or more | 240 (15.0%) | 90 (7.9%) |
| Total | 1,601 (100.0%) | 1,134 (100.0%) |
Real Estate Taxes by Mortgage Status in Wilbarger County
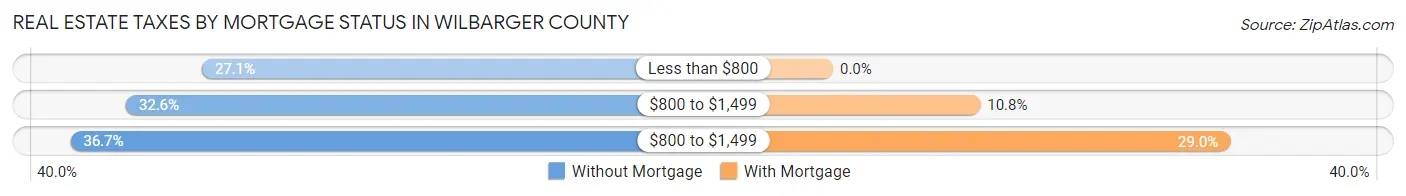
| Property Taxes | Without Mortgage | With Mortgage |
| Less than $800 | 433 (27.1%) | 0 (0.0%) |
| $800 to $1,499 | 522 (32.6%) | 122 (10.8%) |
| $800 to $1,499 | 587 (36.7%) | 329 (29.0%) |
| Total | 1,601 (100.0%) | 1,134 (100.0%) |
Health & Disability in Wilbarger County
Health Insurance Coverage by Age in Wilbarger County
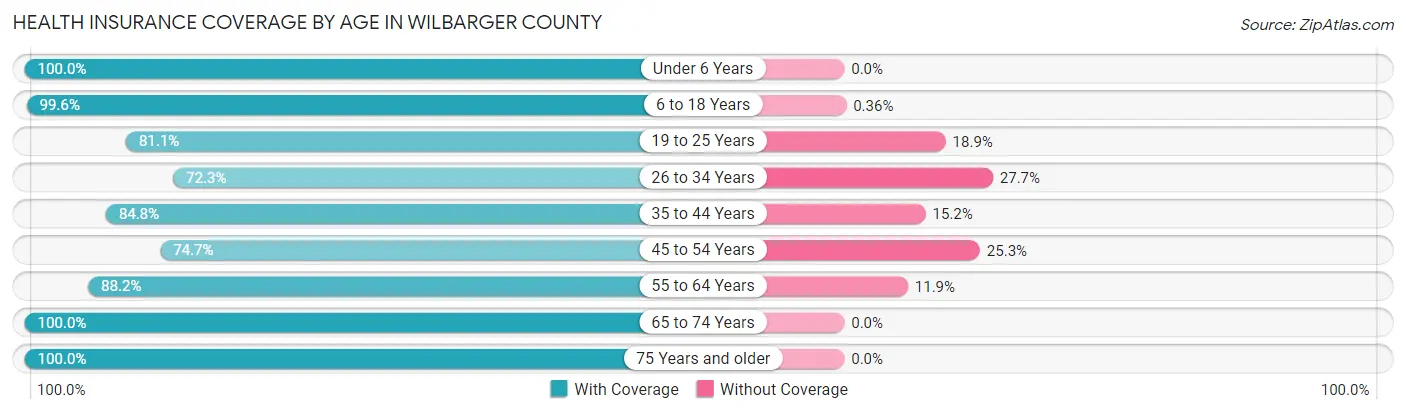
| Age Bracket | With Coverage | Without Coverage |
| Under 6 Years | 969 (100.0%) | 0 (0.0%) |
| 6 to 18 Years | 2,237 (99.6%) | 8 (0.4%) |
| 19 to 25 Years | 781 (81.1%) | 182 (18.9%) |
| 26 to 34 Years | 1,151 (72.3%) | 441 (27.7%) |
| 35 to 44 Years | 1,158 (84.8%) | 207 (15.2%) |
| 45 to 54 Years | 1,093 (74.7%) | 370 (25.3%) |
| 55 to 64 Years | 1,503 (88.1%) | 202 (11.8%) |
| 65 to 74 Years | 1,296 (100.0%) | 0 (0.0%) |
| 75 Years and older | 754 (100.0%) | 0 (0.0%) |
| Total | 10,942 (88.6%) | 1,410 (11.4%) |
Health Insurance Coverage by Citizenship Status in Wilbarger County

| Citizenship Status | With Coverage | Without Coverage |
| Native Born | 969 (100.0%) | 0 (0.0%) |
| Foreign Born, Citizen | 2,237 (99.6%) | 8 (0.4%) |
| Foreign Born, not a Citizen | 781 (81.1%) | 182 (18.9%) |
Health Insurance Coverage by Household Income in Wilbarger County
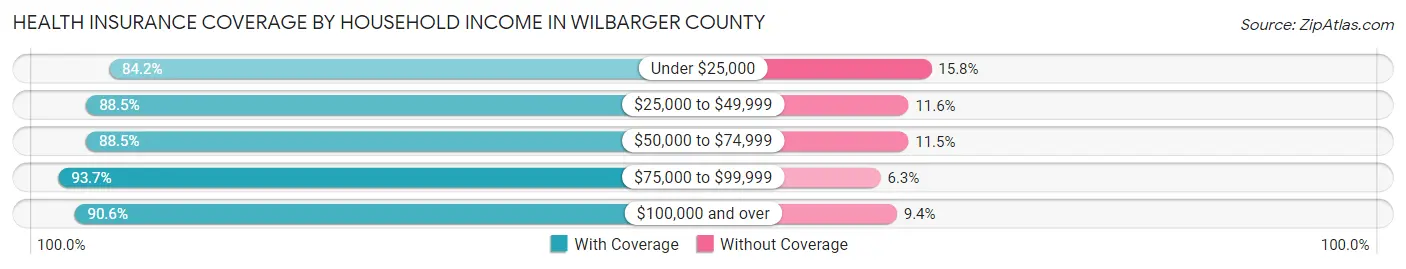
| Household Income | With Coverage | Without Coverage |
| Under $25,000 | 1,674 (84.2%) | 315 (15.8%) |
| $25,000 to $49,999 | 2,320 (88.4%) | 303 (11.6%) |
| $50,000 to $74,999 | 1,751 (88.5%) | 228 (11.5%) |
| $75,000 to $99,999 | 2,326 (93.7%) | 157 (6.3%) |
| $100,000 and over | 2,467 (90.6%) | 255 (9.4%) |
Public vs Private Health Insurance Coverage by Age in Wilbarger County
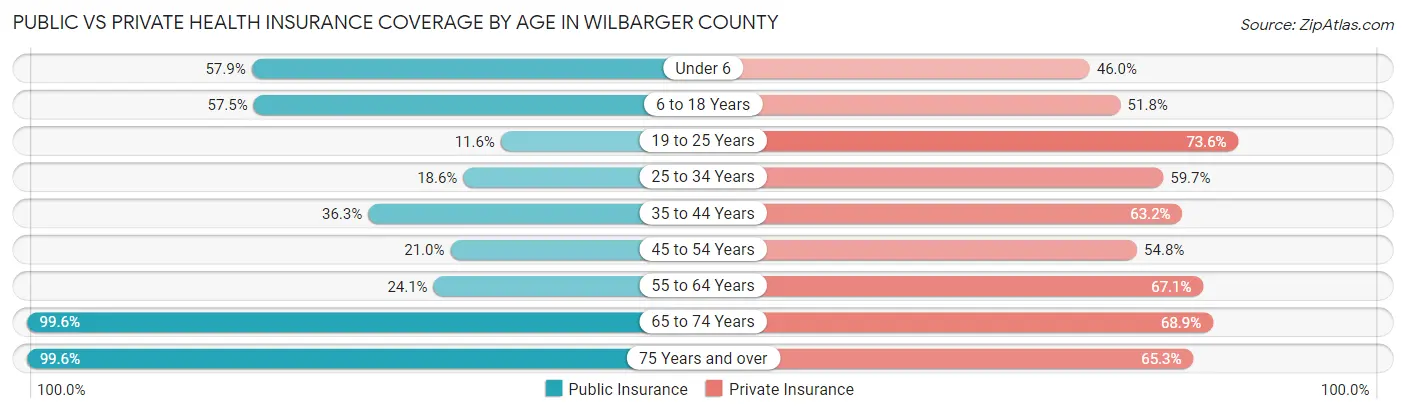
| Age Bracket | Public Insurance | Private Insurance |
| Under 6 | 561 (57.9%) | 446 (46.0%) |
| 6 to 18 Years | 1,291 (57.5%) | 1,162 (51.8%) |
| 19 to 25 Years | 112 (11.6%) | 709 (73.6%) |
| 25 to 34 Years | 296 (18.6%) | 950 (59.7%) |
| 35 to 44 Years | 495 (36.3%) | 863 (63.2%) |
| 45 to 54 Years | 307 (21.0%) | 802 (54.8%) |
| 55 to 64 Years | 411 (24.1%) | 1,144 (67.1%) |
| 65 to 74 Years | 1,291 (99.6%) | 893 (68.9%) |
| 75 Years and over | 751 (99.6%) | 492 (65.2%) |
| Total | 5,515 (44.7%) | 7,461 (60.4%) |
Disability Status by Sex by Age in Wilbarger County
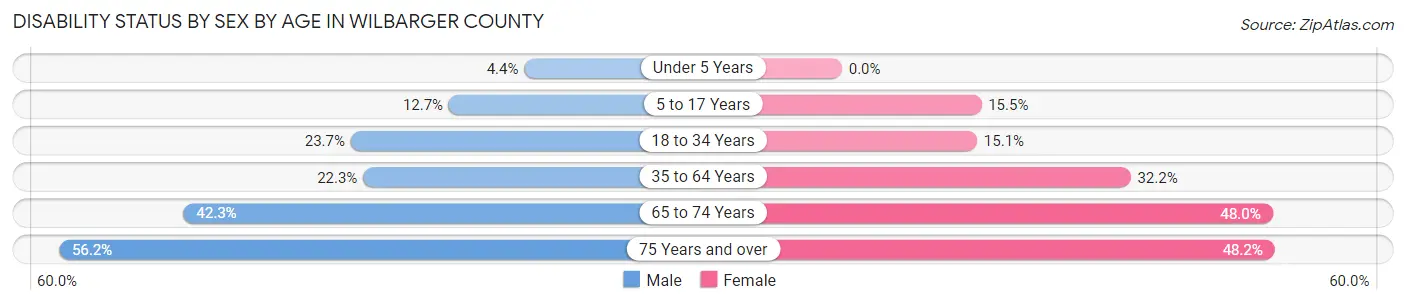
| Age Bracket | Male | Female |
| Under 5 Years | 16 (4.3%) | 0 (0.0%) |
| 5 to 17 Years | 147 (12.7%) | 137 (15.5%) |
| 18 to 34 Years | 321 (23.7%) | 231 (15.0%) |
| 35 to 64 Years | 496 (22.3%) | 742 (32.2%) |
| 65 to 74 Years | 267 (42.3%) | 319 (48.0%) |
| 75 Years and over | 173 (56.2%) | 215 (48.2%) |
Disability Class by Sex by Age in Wilbarger County
Disability Class: Hearing Difficulty
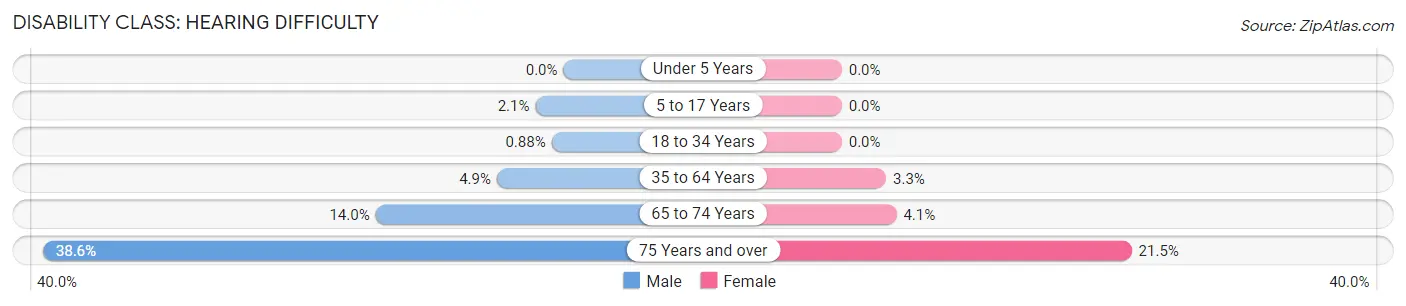
| Age Bracket | Male | Female |
| Under 5 Years | 0 (0.0%) | 0 (0.0%) |
| 5 to 17 Years | 24 (2.1%) | 0 (0.0%) |
| 18 to 34 Years | 12 (0.9%) | 0 (0.0%) |
| 35 to 64 Years | 110 (4.9%) | 76 (3.3%) |
| 65 to 74 Years | 88 (14.0%) | 27 (4.1%) |
| 75 Years and over | 119 (38.6%) | 96 (21.5%) |
Disability Class: Vision Difficulty
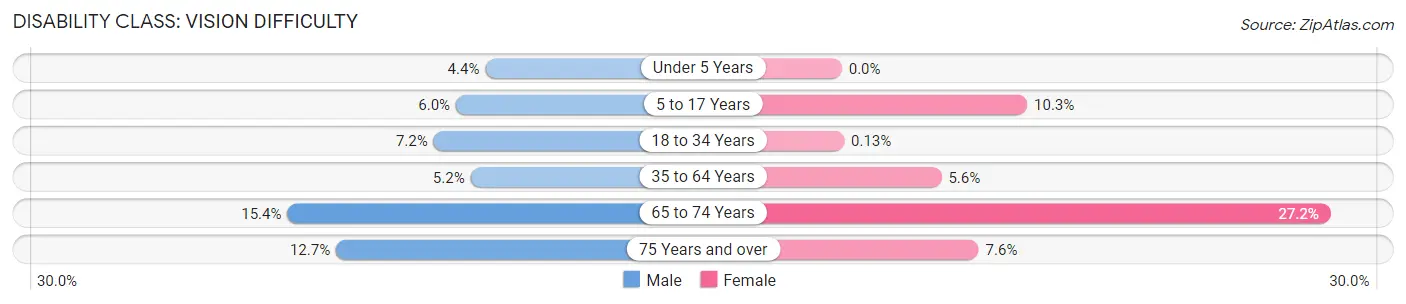
| Age Bracket | Male | Female |
| Under 5 Years | 16 (4.3%) | 0 (0.0%) |
| 5 to 17 Years | 69 (6.0%) | 91 (10.3%) |
| 18 to 34 Years | 98 (7.2%) | 2 (0.1%) |
| 35 to 64 Years | 115 (5.2%) | 128 (5.6%) |
| 65 to 74 Years | 97 (15.4%) | 181 (27.2%) |
| 75 Years and over | 39 (12.7%) | 34 (7.6%) |
Disability Class: Cognitive Difficulty
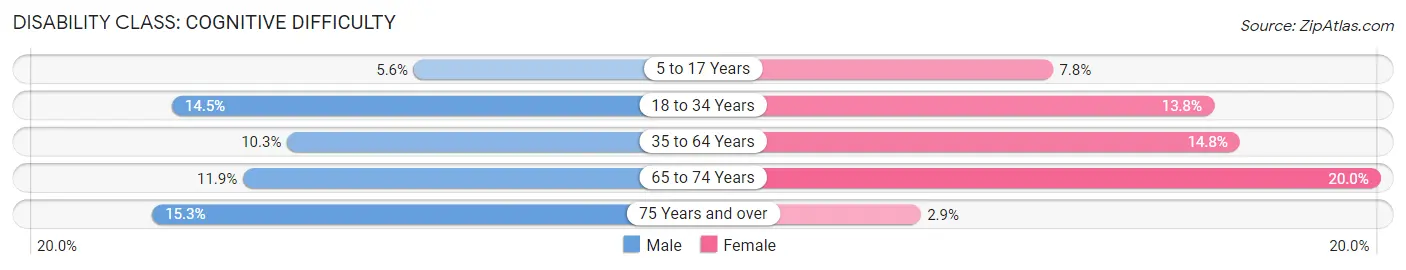
| Age Bracket | Male | Female |
| 5 to 17 Years | 64 (5.6%) | 69 (7.8%) |
| 18 to 34 Years | 197 (14.5%) | 212 (13.8%) |
| 35 to 64 Years | 228 (10.2%) | 341 (14.8%) |
| 65 to 74 Years | 75 (11.9%) | 133 (20.0%) |
| 75 Years and over | 47 (15.3%) | 13 (2.9%) |
Disability Class: Ambulatory Difficulty
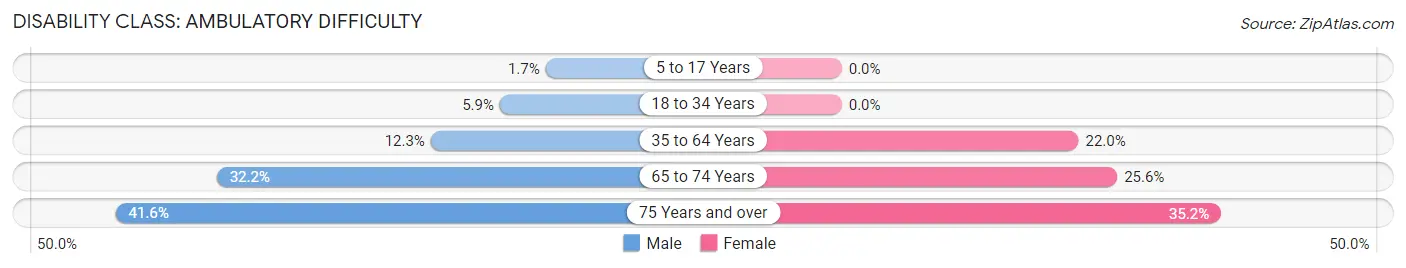
| Age Bracket | Male | Female |
| 5 to 17 Years | 19 (1.7%) | 0 (0.0%) |
| 18 to 34 Years | 80 (5.9%) | 0 (0.0%) |
| 35 to 64 Years | 274 (12.3%) | 507 (22.0%) |
| 65 to 74 Years | 203 (32.2%) | 170 (25.6%) |
| 75 Years and over | 128 (41.6%) | 157 (35.2%) |
Disability Class: Self-Care Difficulty
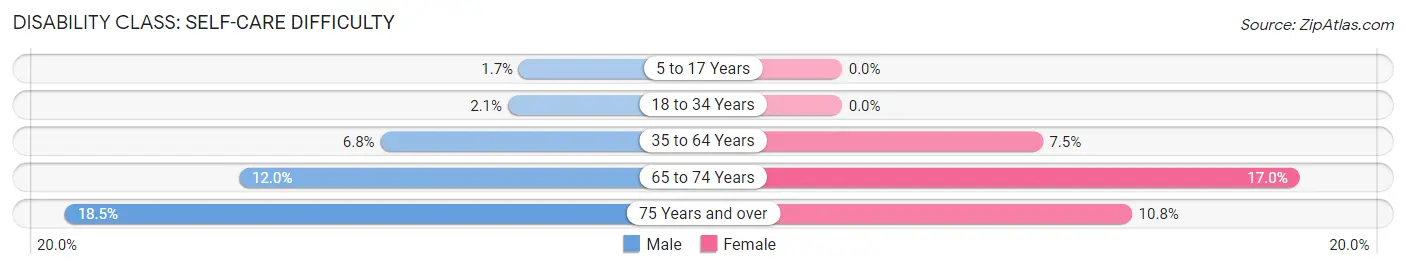
| Age Bracket | Male | Female |
| 5 to 17 Years | 19 (1.7%) | 0 (0.0%) |
| 18 to 34 Years | 28 (2.1%) | 0 (0.0%) |
| 35 to 64 Years | 151 (6.8%) | 172 (7.4%) |
| 65 to 74 Years | 76 (12.0%) | 113 (17.0%) |
| 75 Years and over | 57 (18.5%) | 48 (10.8%) |
Technology Access in Wilbarger County
Computing Device Access in Wilbarger County
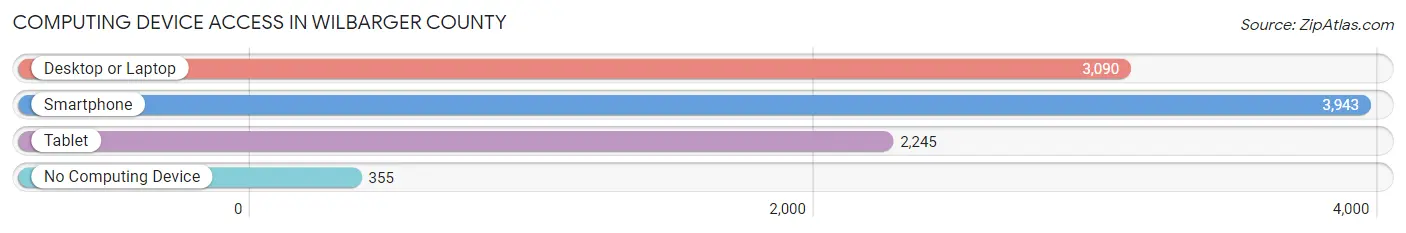
| Device Type | # Households | % Households |
| Desktop or Laptop | 3,090 | 66.8% |
| Smartphone | 3,943 | 85.2% |
| Tablet | 2,245 | 48.5% |
| No Computing Device | 355 | 7.7% |
| Total | 4,626 | 100.0% |
Internet Access in Wilbarger County
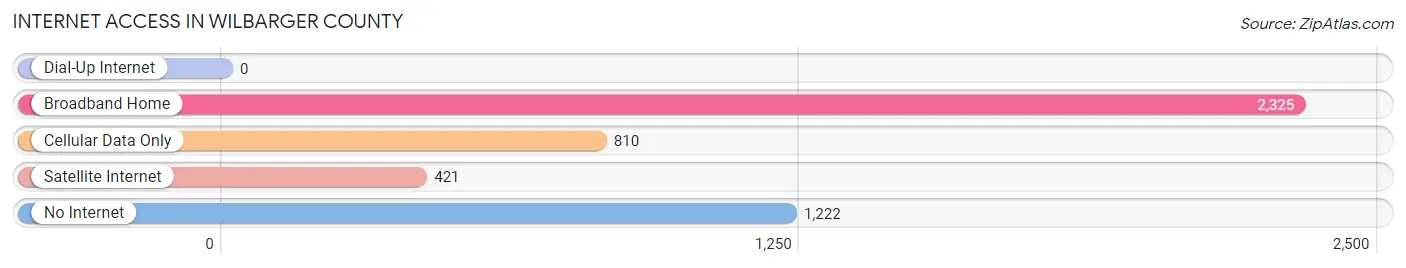
| Internet Type | # Households | % Households |
| Dial-Up Internet | 0 | 0.0% |
| Broadband Home | 2,325 | 50.3% |
| Cellular Data Only | 810 | 17.5% |
| Satellite Internet | 421 | 9.1% |
| No Internet | 1,222 | 26.4% |
| Total | 4,626 | 100.0% |
Wilbarger County Summary
Wilbarger County is located in the north-central region of Texas, and is part of the Wichita Falls Metropolitan Statistical Area. The county is bordered by Foard County to the north, Hardeman County to the east, Wichita County to the south, and Tillman County, Oklahoma to the west. Wilbarger County covers an area of 902 square miles, and has a population of 13,535 as of the 2010 census.
History
Wilbarger County was established in 1858, and was named for Josiah Wilbarger, a Texas Ranger who was killed by Comanche Indians in 1833. The county was originally part of Fannin County, and was later divided into Wilbarger and Foard Counties. The county seat is Vernon, which was established in 1876.
Geography
Wilbarger County is located in the north-central region of Texas, and is part of the Wichita Falls Metropolitan Statistical Area. The county is bordered by Foard County to the north, Hardeman County to the east, Wichita County to the south, and Tillman County, Oklahoma to the west. Wilbarger County covers an area of 902 square miles, and has a population of 13,535 as of the 2010 census.
The terrain of Wilbarger County is mostly flat, with some rolling hills in the western part of the county. The county is drained by the Red River, which forms the western border of the county. The county is also home to several small lakes, including Lake Kemp, Lake Diversion, and Lake Arrowhead.
Economy
The economy of Wilbarger County is largely based on agriculture. The county is home to several large farms, which produce a variety of crops, including cotton, wheat, corn, and sorghum. The county is also home to several oil and gas fields, which provide jobs for many of the county's residents.
In addition to agriculture and oil and gas, Wilbarger County is home to several manufacturing companies, including a steel mill, a paper mill, and a plastics plant. The county is also home to several retail stores, restaurants, and other businesses.
Demographics
As of the 2010 census, Wilbarger County had a population of 13,535. The racial makeup of the county was 79.3% White, 11.2% Black or African American, 0.7% Native American, 0.3% Asian, 0.1% Pacific Islander, 6.3% from other races, and 2.3% from two or more races. Hispanic or Latino of any race were 13.7% of the population.
The median income for a household in Wilbarger County was $37,945, and the median income for a family was $45,938. The per capita income for the county was $18,945. About 14.2% of families and 17.7% of the population were below the poverty line, including 24.2% of those under age 18 and 11.7% of those age 65 or over.
Common Questions
What is Per Capita Income in Wilbarger County?
Per Capita income in Wilbarger County is $24,291.
What is the Median Family Income in Wilbarger County?
Median Family Income in Wilbarger County is $63,611.
What is the Median Household income in Wilbarger County?
Median Household Income in Wilbarger County is $50,769.
What is Income or Wage Gap in Wilbarger County?
Income or Wage Gap in Wilbarger County is 12.3%.
Women in Wilbarger County earn 87.7 cents for every dollar earned by a man.
What is Inequality or Gini Index in Wilbarger County?
Inequality or Gini Index in Wilbarger County is 0.41.
What is the Total Population of Wilbarger County?
Total Population of Wilbarger County is 12,795.
What is the Total Male Population of Wilbarger County?
Total Male Population of Wilbarger County is 6,305.
What is the Total Female Population of Wilbarger County?
Total Female Population of Wilbarger County is 6,490.
What is the Ratio of Males per 100 Females in Wilbarger County?
There are 97.15 Males per 100 Females in Wilbarger County.
What is the Ratio of Females per 100 Males in Wilbarger County?
There are 102.93 Females per 100 Males in Wilbarger County.
What is the Median Population Age in Wilbarger County?
Median Population Age in Wilbarger County is 37.2 Years.
What is the Average Family Size in Wilbarger County
Average Family Size in Wilbarger County is 3.3 People.
What is the Average Household Size in Wilbarger County
Average Household Size in Wilbarger County is 2.5 People.
How Large is the Labor Force in Wilbarger County?
There are 6,063 People in the Labor Forcein in Wilbarger County.
What is the Percentage of People in the Labor Force in Wilbarger County?
58.3% of People are in the Labor Force in Wilbarger County.
What is the Unemployment Rate in Wilbarger County?
Unemployment Rate in Wilbarger County is 9.3%.