Wichita County, TX Map & Demographics
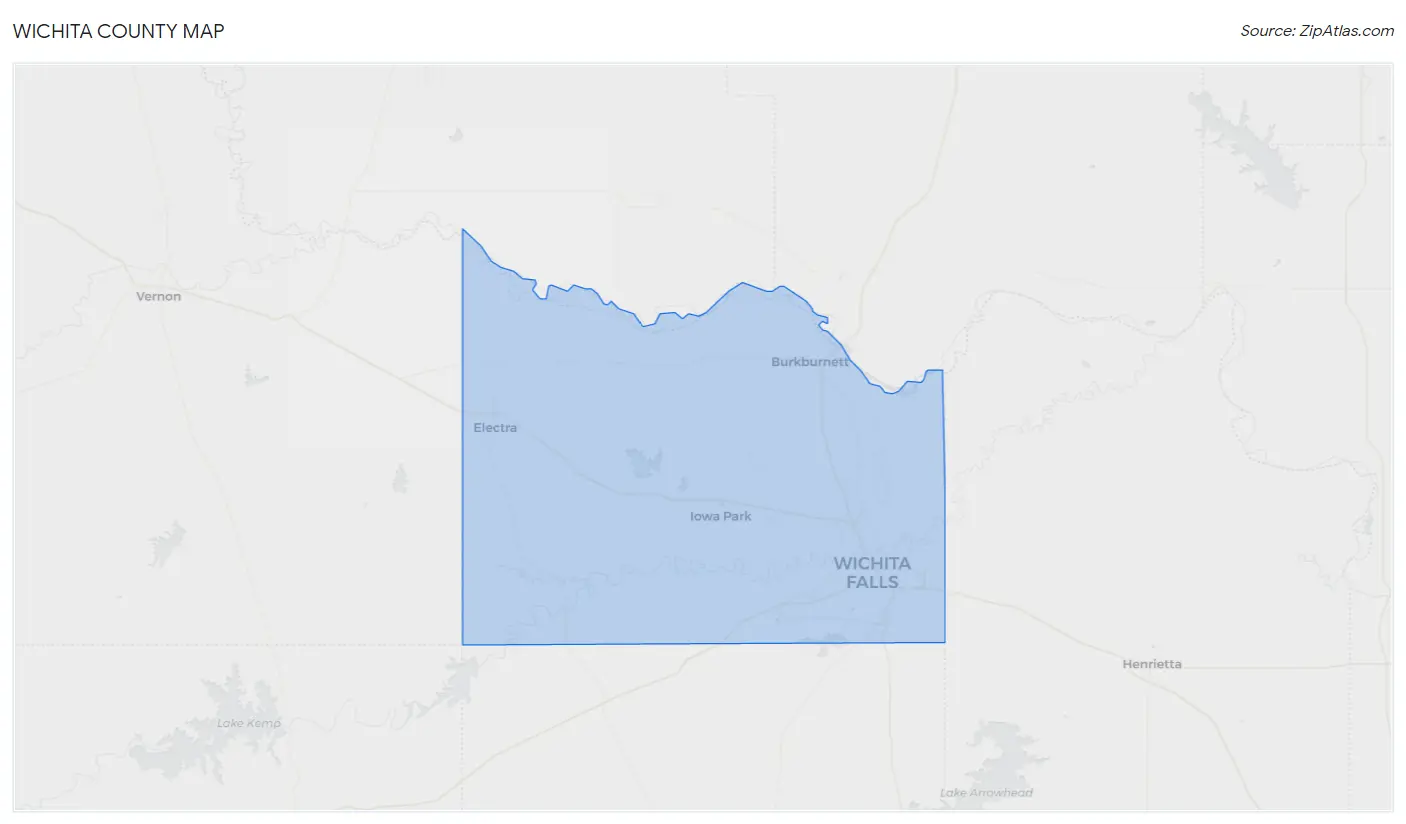
Wichita County Map
Wichita County Overview
$30,834
PER CAPITA INCOME
$76,888
AVG FAMILY INCOME
$58,862
AVG HOUSEHOLD INCOME
24.6%
WAGE / INCOME GAP [ % ]
75.4¢/ $1
WAGE / INCOME GAP [ $ ]
$11,247
FAMILY INCOME DEFICIT
0.46
INEQUALITY / GINI INDEX
129,584
TOTAL POPULATION
67,086
MALE POPULATION
62,498
FEMALE POPULATION
107.34
MALES / 100 FEMALES
93.16
FEMALES / 100 MALES
34.8
MEDIAN AGE
3.0
AVG FAMILY SIZE
2.4
AVG HOUSEHOLD SIZE
65,794
LABOR FORCE [ PEOPLE ]
63.6%
PERCENT IN LABOR FORCE
4.2%
UNEMPLOYMENT RATE
Wichita County Area Codes
Income in Wichita County
Income Overview in Wichita County
Per Capita Income in Wichita County is $30,834, while median incomes of families and households are $76,888 and $58,862 respectively.
| Characteristic | Number | Measure |
| Per Capita Income | 129,584 | $30,834 |
| Median Family Income | 30,544 | $76,888 |
| Mean Family Income | 30,544 | $95,206 |
| Median Household Income | 48,604 | $58,862 |
| Mean Household Income | 48,604 | $78,508 |
| Income Deficit | 30,544 | $11,247 |
| Wage / Income Gap (%) | 129,584 | 24.63% |
| Wage / Income Gap ($) | 129,584 | 75.37¢ per $1 |
| Gini / Inequality Index | 129,584 | 0.46 |
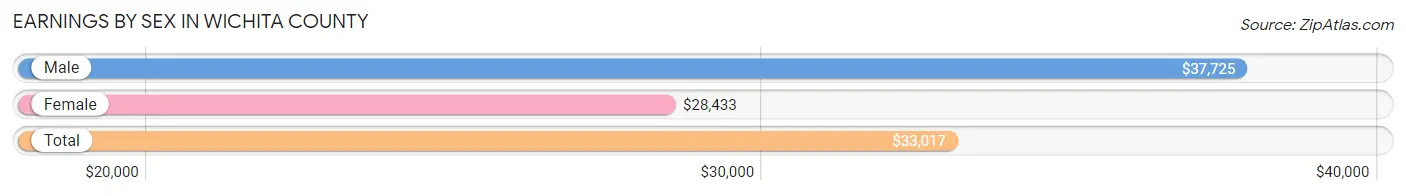
Earnings by Sex in Wichita County
Average Earnings in Wichita County are $33,017, $37,725 for men and $28,433 for women, a difference of 24.6%.
| Sex | Number | Average Earnings |
| Male | 37,456 (54.5%) | $37,725 |
| Female | 31,288 (45.5%) | $28,433 |
| Total | 68,744 (100.0%) | $33,017 |
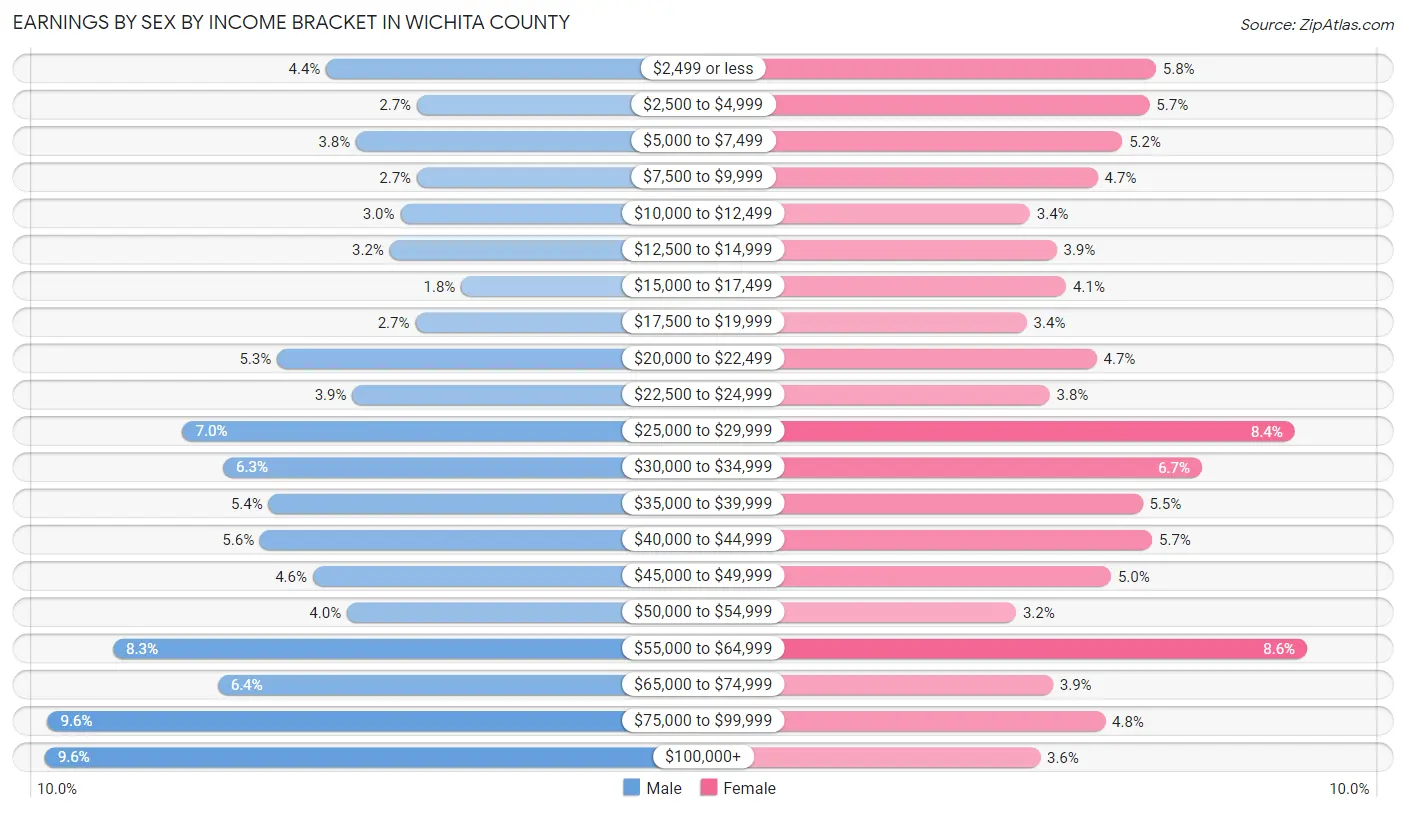
Earnings by Sex by Income Bracket in Wichita County
The most common earnings brackets in Wichita County are $100,000+ for men (3,604 | 9.6%) and $55,000 to $64,999 for women (2,697 | 8.6%).
| Income | Male | Female |
| $2,499 or less | 1,629 (4.3%) | 1,811 (5.8%) |
| $2,500 to $4,999 | 993 (2.6%) | 1,774 (5.7%) |
| $5,000 to $7,499 | 1,420 (3.8%) | 1,615 (5.2%) |
| $7,500 to $9,999 | 992 (2.6%) | 1,469 (4.7%) |
| $10,000 to $12,499 | 1,108 (3.0%) | 1,072 (3.4%) |
| $12,500 to $14,999 | 1,185 (3.2%) | 1,230 (3.9%) |
| $15,000 to $17,499 | 682 (1.8%) | 1,286 (4.1%) |
| $17,500 to $19,999 | 1,003 (2.7%) | 1,054 (3.4%) |
| $20,000 to $22,499 | 1,975 (5.3%) | 1,464 (4.7%) |
| $22,500 to $24,999 | 1,446 (3.9%) | 1,190 (3.8%) |
| $25,000 to $29,999 | 2,638 (7.0%) | 2,624 (8.4%) |
| $30,000 to $34,999 | 2,352 (6.3%) | 2,082 (6.7%) |
| $35,000 to $39,999 | 2,034 (5.4%) | 1,733 (5.5%) |
| $40,000 to $44,999 | 2,092 (5.6%) | 1,791 (5.7%) |
| $45,000 to $49,999 | 1,724 (4.6%) | 1,549 (5.0%) |
| $50,000 to $54,999 | 1,482 (4.0%) | 991 (3.2%) |
| $55,000 to $64,999 | 3,123 (8.3%) | 2,697 (8.6%) |
| $65,000 to $74,999 | 2,390 (6.4%) | 1,209 (3.9%) |
| $75,000 to $99,999 | 3,584 (9.6%) | 1,513 (4.8%) |
| $100,000+ | 3,604 (9.6%) | 1,134 (3.6%) |
| Total | 37,456 (100.0%) | 31,288 (100.0%) |
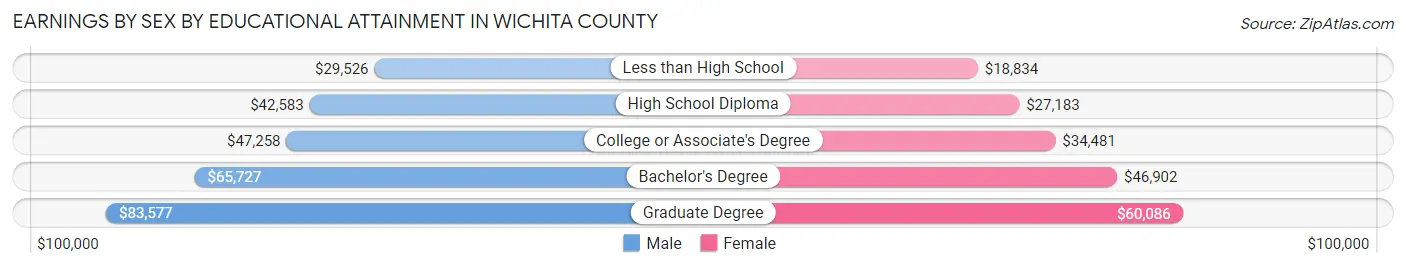
Earnings by Sex by Educational Attainment in Wichita County
Average earnings in Wichita County are $47,103 for men and $33,912 for women, a difference of 28.0%. Men with an educational attainment of graduate degree enjoy the highest average annual earnings of $83,577, while those with less than high school education earn the least with $29,526. Women with an educational attainment of graduate degree earn the most with the average annual earnings of $60,086, while those with less than high school education have the smallest earnings of $18,834.
| Educational Attainment | Male Income | Female Income |
| Less than High School | $29,526 | $18,834 |
| High School Diploma | $42,583 | $27,183 |
| College or Associate's Degree | $47,258 | $34,481 |
| Bachelor's Degree | $65,727 | $46,902 |
| Graduate Degree | $83,577 | $60,086 |
| Total | $47,103 | $33,912 |
Family Income in Wichita County
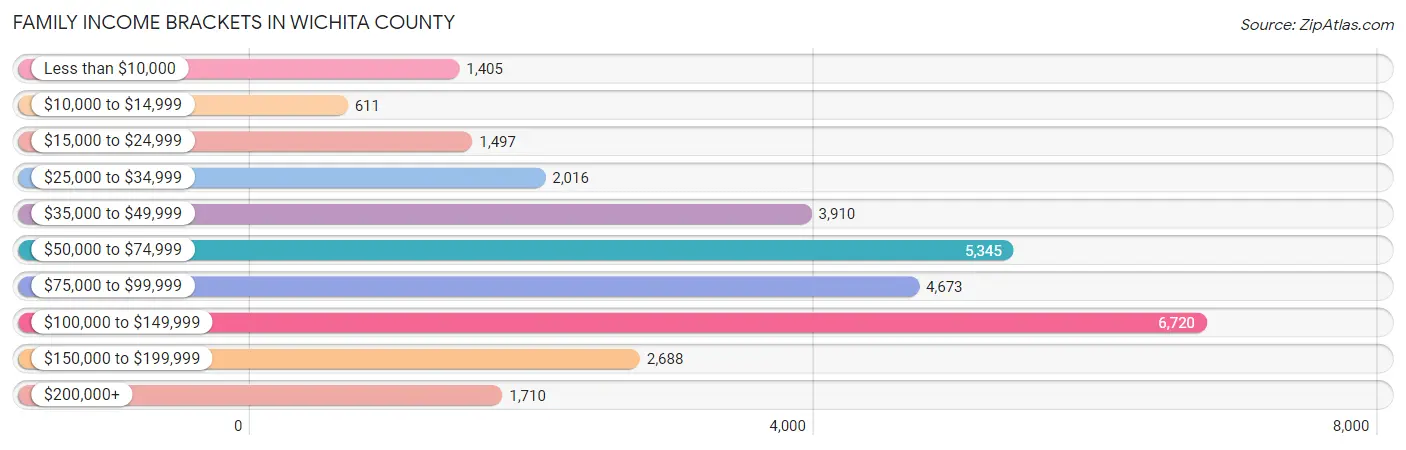
Family Income Brackets in Wichita County
According to the Wichita County family income data, there are 6,720 families falling into the $100,000 to $149,999 income range, which is the most common income bracket and makes up 22.0% of all families. Conversely, the $10,000 to $14,999 income bracket is the least frequent group with only 611 families (2.0%) belonging to this category.
| Income Bracket | # Families | % Families |
| Less than $10,000 | 1,405 | 4.6% |
| $10,000 to $14,999 | 611 | 2.0% |
| $15,000 to $24,999 | 1,497 | 4.9% |
| $25,000 to $34,999 | 2,016 | 6.6% |
| $35,000 to $49,999 | 3,910 | 12.8% |
| $50,000 to $74,999 | 5,345 | 17.5% |
| $75,000 to $99,999 | 4,673 | 15.3% |
| $100,000 to $149,999 | 6,720 | 22.0% |
| $150,000 to $199,999 | 2,688 | 8.8% |
| $200,000+ | 1,710 | 5.6% |
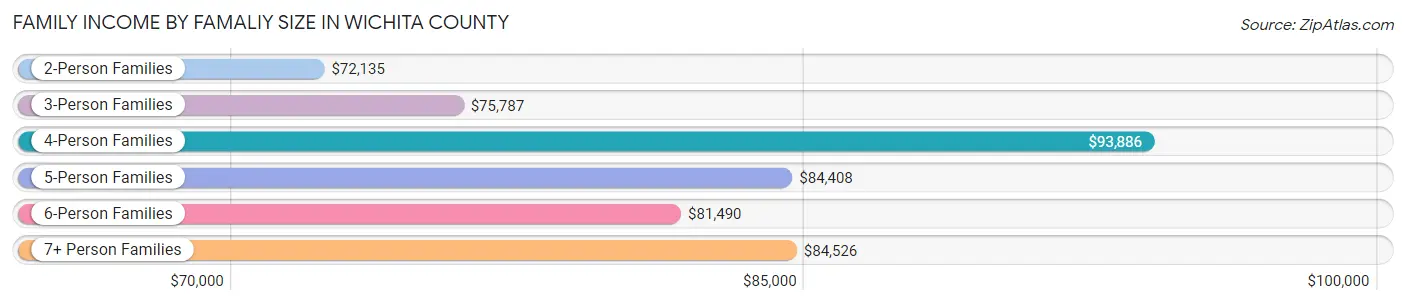
Family Income by Famaliy Size in Wichita County
4-person families (4,574 | 15.0%) account for the highest median family income in Wichita County with $93,886 per family, while 2-person families (16,250 | 53.2%) have the highest median income of $36,068 per family member.
| Income Bracket | # Families | Median Income |
| 2-Person Families | 16,250 (53.2%) | $72,135 |
| 3-Person Families | 6,460 (21.1%) | $75,787 |
| 4-Person Families | 4,574 (15.0%) | $93,886 |
| 5-Person Families | 2,140 (7.0%) | $84,408 |
| 6-Person Families | 689 (2.3%) | $81,490 |
| 7+ Person Families | 431 (1.4%) | $84,526 |
| Total | 30,544 (100.0%) | $76,888 |
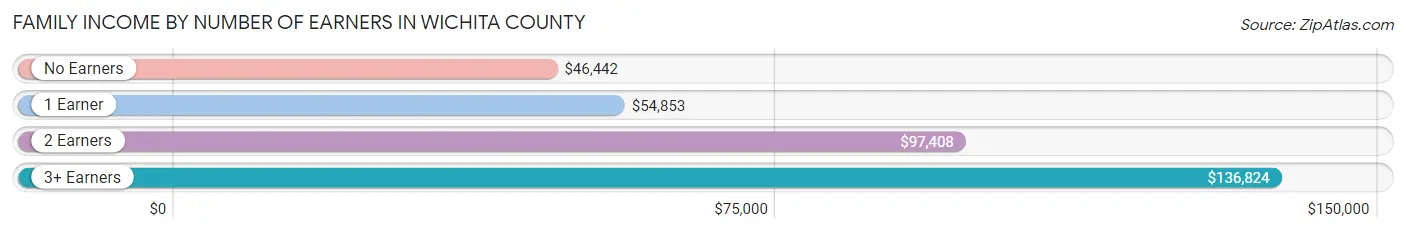
Family Income by Number of Earners in Wichita County
The median family income in Wichita County is $76,888, with families comprising 3+ earners (2,430) having the highest median family income of $136,824, while families with no earners (4,108) have the lowest median family income of $46,442, accounting for 8.0% and 13.5% of families, respectively.
| Number of Earners | # Families | Median Income |
| No Earners | 4,108 (13.5%) | $46,442 |
| 1 Earner | 10,406 (34.1%) | $54,853 |
| 2 Earners | 13,600 (44.5%) | $97,408 |
| 3+ Earners | 2,430 (8.0%) | $136,824 |
| Total | 30,544 (100.0%) | $76,888 |
Household Income in Wichita County
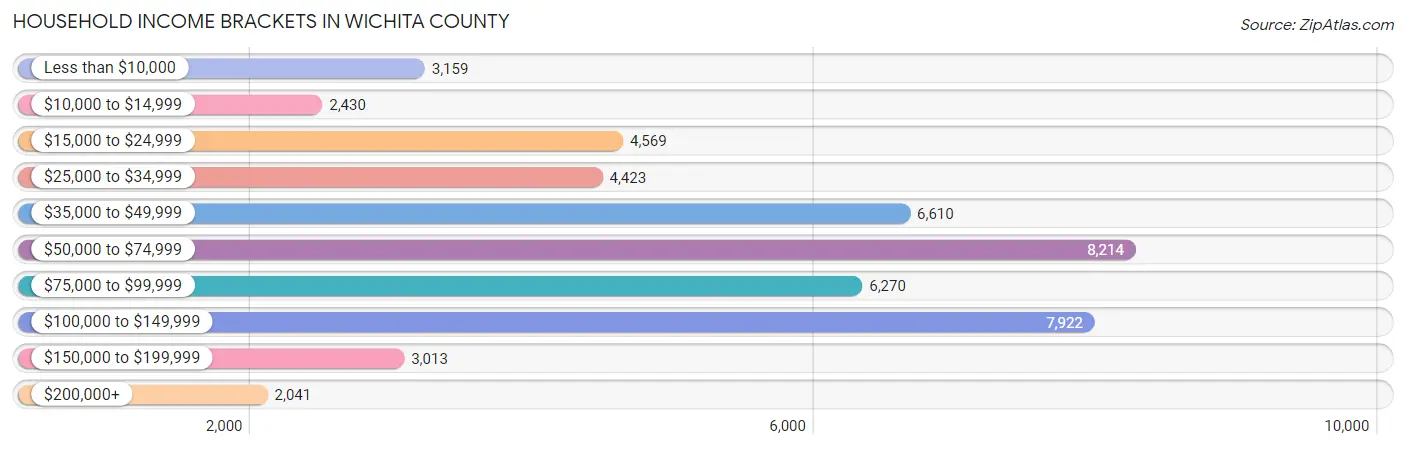
Household Income Brackets in Wichita County
With 8,214 households falling in the category, the $50,000 to $74,999 income range is the most frequent in Wichita County, accounting for 16.9% of all households. In contrast, only 2,041 households (4.2%) fall into the $200,000+ income bracket, making it the least populous group.
| Income Bracket | # Households | % Households |
| Less than $10,000 | 3,159 | 6.5% |
| $10,000 to $14,999 | 2,430 | 5.0% |
| $15,000 to $24,999 | 4,569 | 9.4% |
| $25,000 to $34,999 | 4,423 | 9.1% |
| $35,000 to $49,999 | 6,610 | 13.6% |
| $50,000 to $74,999 | 8,214 | 16.9% |
| $75,000 to $99,999 | 6,270 | 12.9% |
| $100,000 to $149,999 | 7,922 | 16.3% |
| $150,000 to $199,999 | 3,013 | 6.2% |
| $200,000+ | 2,041 | 4.2% |
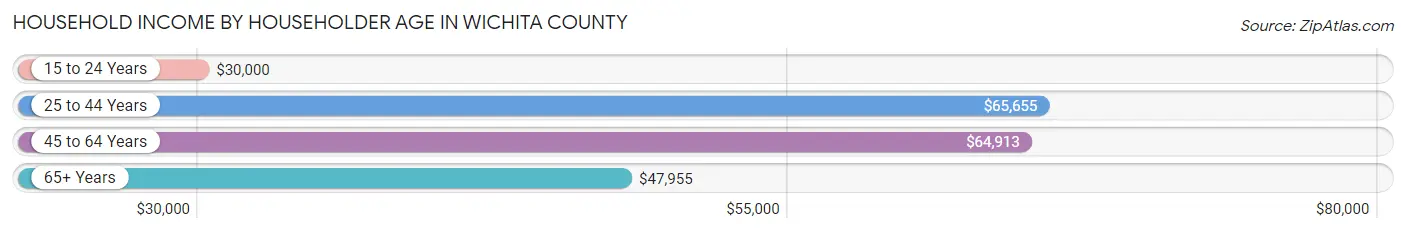
Household Income by Householder Age in Wichita County
The median household income in Wichita County is $58,862, with the highest median household income of $65,655 found in the 25 to 44 years age bracket for the primary householder. A total of 16,753 households (34.5%) fall into this category. Meanwhile, the 15 to 24 years age bracket for the primary householder has the lowest median household income of $30,000, with 2,914 households (6.0%) in this group.
| Income Bracket | # Households | Median Income |
| 15 to 24 Years | 2,914 (6.0%) | $30,000 |
| 25 to 44 Years | 16,753 (34.5%) | $65,655 |
| 45 to 64 Years | 16,271 (33.5%) | $64,913 |
| 65+ Years | 12,666 (26.1%) | $47,955 |
| Total | 48,604 (100.0%) | $58,862 |
Poverty in Wichita County
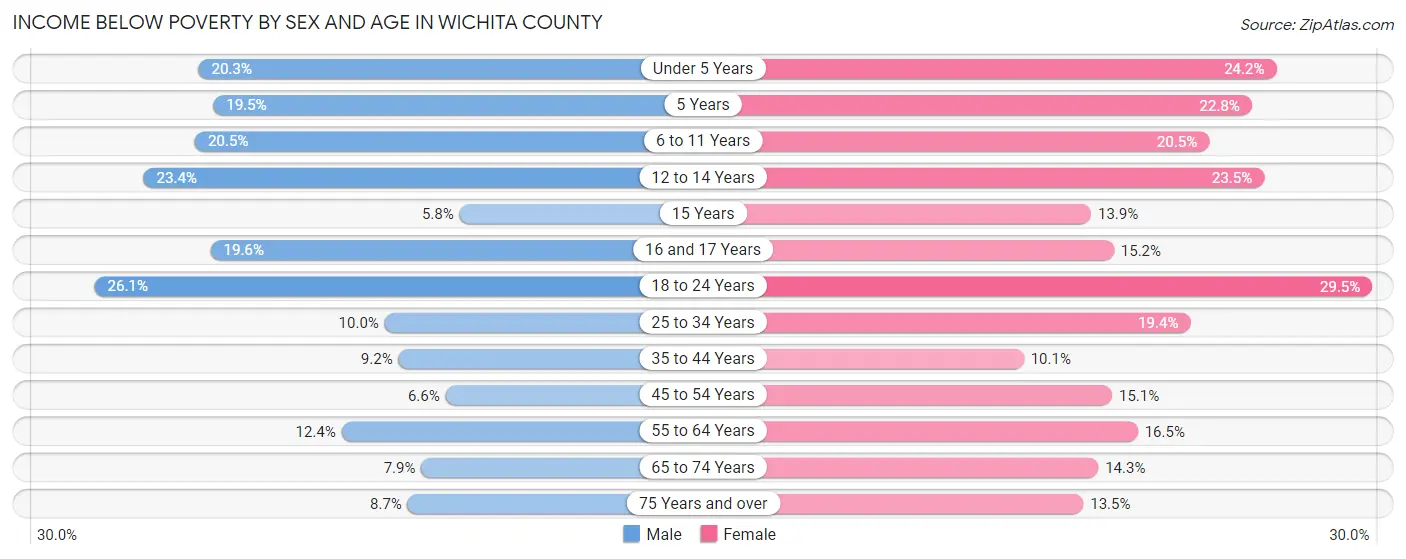
Income Below Poverty by Sex and Age in Wichita County
With 13.6% poverty level for males and 17.8% for females among the residents of Wichita County, 18 to 24 year old males and 18 to 24 year old females are the most vulnerable to poverty, with 1,384 males (26.1%) and 1,628 females (29.5%) in their respective age groups living below the poverty level.
| Age Bracket | Male | Female |
| Under 5 Years | 834 (20.3%) | 917 (24.2%) |
| 5 Years | 175 (19.5%) | 123 (22.8%) |
| 6 to 11 Years | 1,051 (20.5%) | 1,017 (20.4%) |
| 12 to 14 Years | 549 (23.4%) | 593 (23.5%) |
| 15 Years | 45 (5.8%) | 103 (13.9%) |
| 16 and 17 Years | 292 (19.6%) | 237 (15.1%) |
| 18 to 24 Years | 1,384 (26.1%) | 1,628 (29.5%) |
| 25 to 34 Years | 880 (10.0%) | 1,646 (19.4%) |
| 35 to 44 Years | 642 (9.2%) | 742 (10.1%) |
| 45 to 54 Years | 413 (6.6%) | 957 (15.0%) |
| 55 to 64 Years | 889 (12.3%) | 1,281 (16.5%) |
| 65 to 74 Years | 410 (7.9%) | 807 (14.3%) |
| 75 Years and over | 259 (8.7%) | 609 (13.5%) |
| Total | 7,823 (13.6%) | 10,660 (17.8%) |
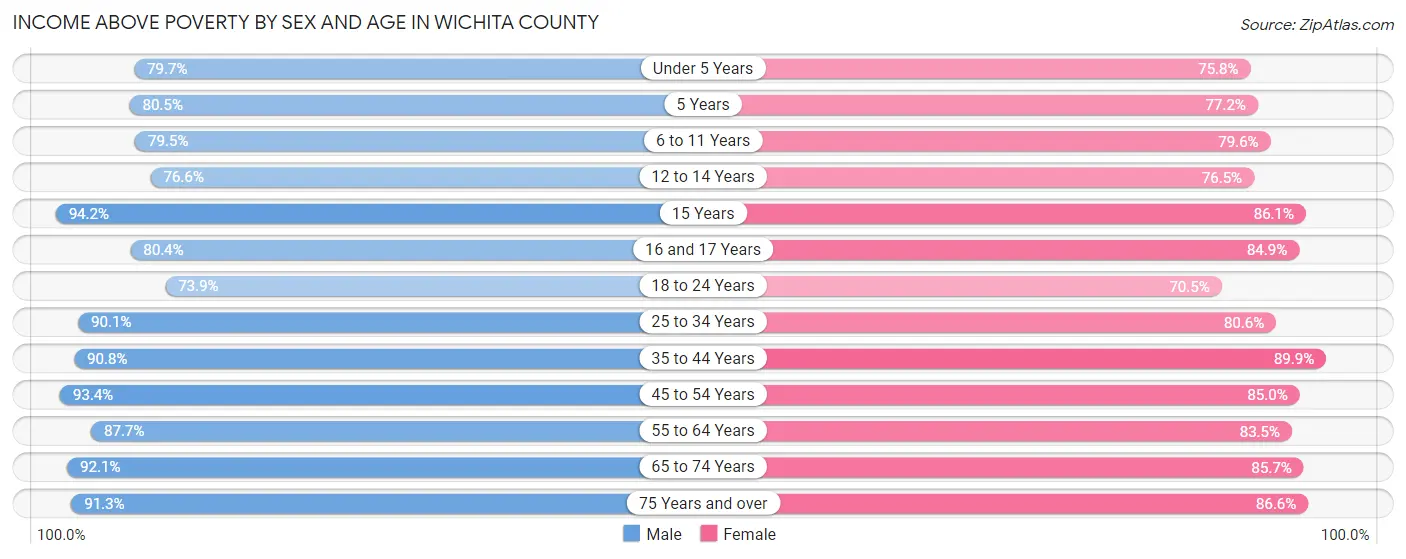
Income Above Poverty by Sex and Age in Wichita County
According to the poverty statistics in Wichita County, males aged 15 years and females aged 35 to 44 years are the age groups that are most secure financially, with 94.2% of males and 89.9% of females in these age groups living above the poverty line.
| Age Bracket | Male | Female |
| Under 5 Years | 3,273 (79.7%) | 2,874 (75.8%) |
| 5 Years | 723 (80.5%) | 416 (77.2%) |
| 6 to 11 Years | 4,073 (79.5%) | 3,956 (79.5%) |
| 12 to 14 Years | 1,800 (76.6%) | 1,929 (76.5%) |
| 15 Years | 733 (94.2%) | 639 (86.1%) |
| 16 and 17 Years | 1,195 (80.4%) | 1,327 (84.9%) |
| 18 to 24 Years | 3,919 (73.9%) | 3,885 (70.5%) |
| 25 to 34 Years | 7,967 (90.0%) | 6,837 (80.6%) |
| 35 to 44 Years | 6,348 (90.8%) | 6,582 (89.9%) |
| 45 to 54 Years | 5,887 (93.4%) | 5,401 (85.0%) |
| 55 to 64 Years | 6,310 (87.6%) | 6,494 (83.5%) |
| 65 to 74 Years | 4,774 (92.1%) | 4,846 (85.7%) |
| 75 Years and over | 2,730 (91.3%) | 3,920 (86.6%) |
| Total | 49,732 (86.4%) | 49,106 (82.2%) |
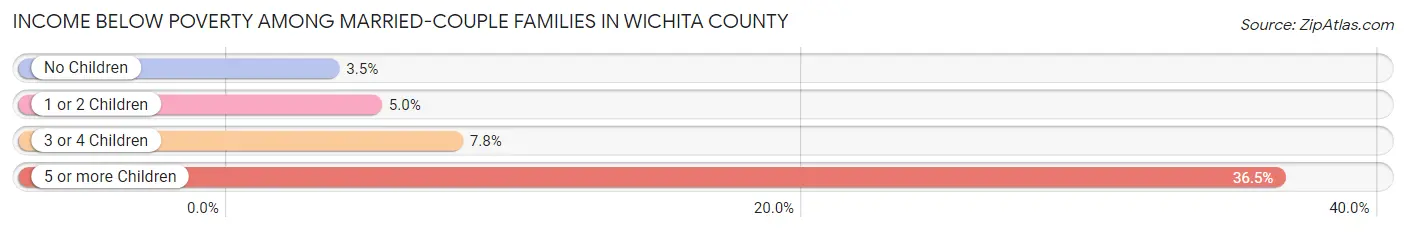
Income Below Poverty Among Married-Couple Families in Wichita County
The poverty statistics for married-couple families in Wichita County show that 4.5% or 950 of the total 21,222 families live below the poverty line. Families with 5 or more children have the highest poverty rate of 36.5%, comprising of 35 families. On the other hand, families with no children have the lowest poverty rate of 3.5%, which includes 442 families.
| Children | Above Poverty | Below Poverty |
| No Children | 12,089 (96.5%) | 442 (3.5%) |
| 1 or 2 Children | 6,745 (95.0%) | 356 (5.0%) |
| 3 or 4 Children | 1,377 (92.2%) | 117 (7.8%) |
| 5 or more Children | 61 (63.5%) | 35 (36.5%) |
| Total | 20,272 (95.5%) | 950 (4.5%) |
Income Below Poverty Among Single-Parent Households in Wichita County
According to the poverty data in Wichita County, 15.3% or 413 single-father households and 29.1% or 1,925 single-mother households are living below the poverty line. Among single-father households, those with 5 or more children have the highest poverty rate, with 53 households (65.4%) experiencing poverty. Likewise, among single-mother households, those with 5 or more children have the highest poverty rate, with 86 households (86.9%) falling below the poverty line.
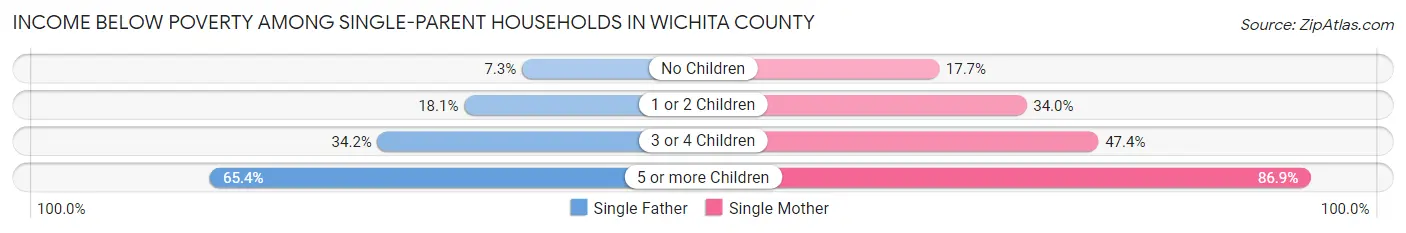
| Children | Single Father | Single Mother |
| No Children | 98 (7.3%) | 510 (17.7%) |
| 1 or 2 Children | 199 (18.1%) | 1,017 (34.0%) |
| 3 or 4 Children | 63 (34.2%) | 312 (47.4%) |
| 5 or more Children | 53 (65.4%) | 86 (86.9%) |
| Total | 413 (15.3%) | 1,925 (29.1%) |
Income Below Poverty Among Married-Couple vs Single-Parent Households in Wichita County
The poverty data for Wichita County shows that 950 of the married-couple family households (4.5%) and 2,338 of the single-parent households (25.1%) are living below the poverty level. Within the married-couple family households, those with 5 or more children have the highest poverty rate, with 35 households (36.5%) falling below the poverty line. Among the single-parent households, those with 5 or more children have the highest poverty rate, with 139 household (77.2%) living below poverty.
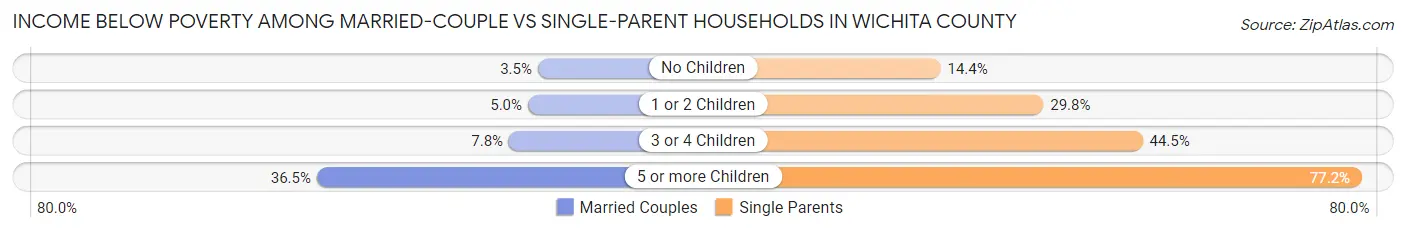
| Children | Married-Couple Families | Single-Parent Households |
| No Children | 442 (3.5%) | 608 (14.4%) |
| 1 or 2 Children | 356 (5.0%) | 1,216 (29.7%) |
| 3 or 4 Children | 117 (7.8%) | 375 (44.5%) |
| 5 or more Children | 35 (36.5%) | 139 (77.2%) |
| Total | 950 (4.5%) | 2,338 (25.1%) |
Race in Wichita County
The most populous races in Wichita County are White / Caucasian (98,200 | 75.8%), Hispanic or Latino (26,413 | 20.4%), and Black / African American (12,983 | 10.0%).
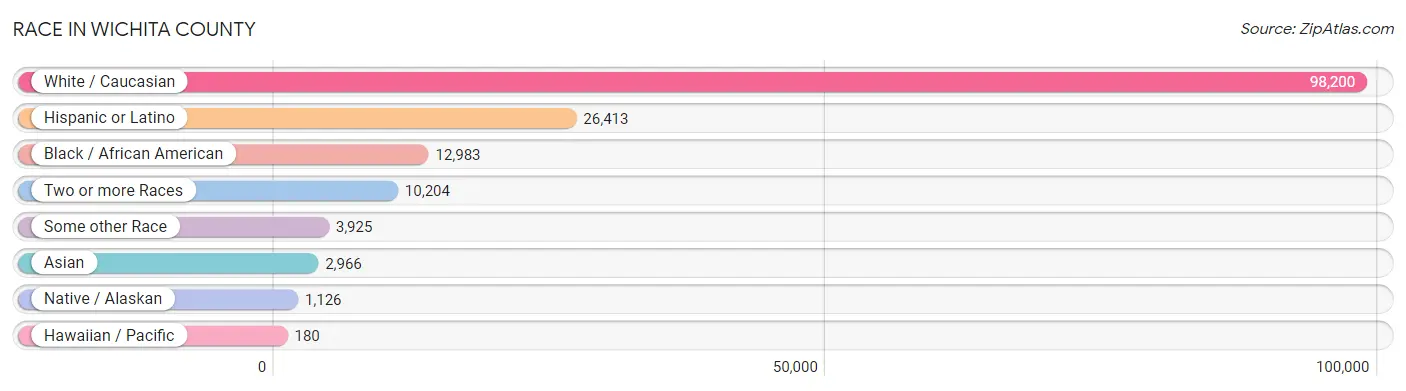
| Race | # Population | % Population |
| Asian | 2,966 | 2.3% |
| Black / African American | 12,983 | 10.0% |
| Hawaiian / Pacific | 180 | 0.1% |
| Hispanic or Latino | 26,413 | 20.4% |
| Native / Alaskan | 1,126 | 0.9% |
| White / Caucasian | 98,200 | 75.8% |
| Two or more Races | 10,204 | 7.9% |
| Some other Race | 3,925 | 3.0% |
| Total | 129,584 | 100.0% |
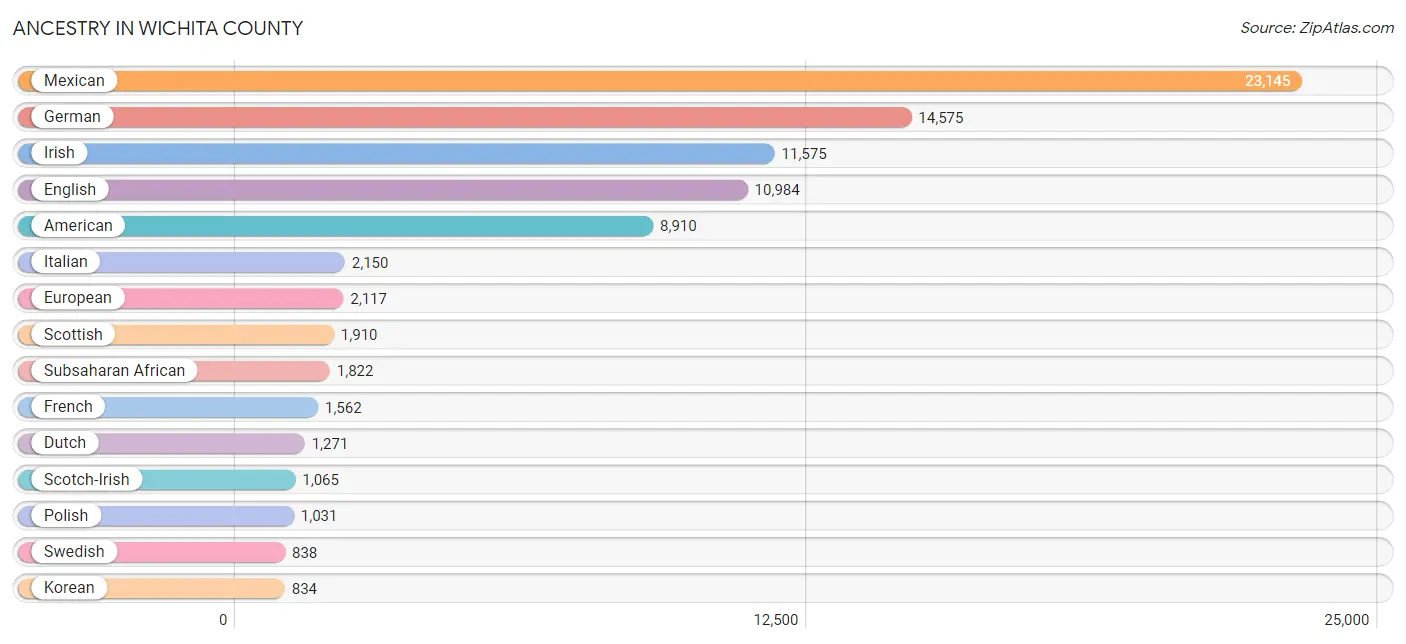
Ancestry in Wichita County
The most populous ancestries reported in Wichita County are Mexican (23,145 | 17.9%), German (14,575 | 11.3%), Irish (11,575 | 8.9%), English (10,984 | 8.5%), and American (8,910 | 6.9%), together accounting for 53.4% of all Wichita County residents.
| Ancestry | # Population | % Population |
| African | 705 | 0.5% |
| American | 8,910 | 6.9% |
| Apache | 168 | 0.1% |
| Arab | 187 | 0.1% |
| Arapaho | 10 | 0.0% |
| Armenian | 16 | 0.0% |
| Assyrian / Chaldean / Syriac | 43 | 0.0% |
| Australian | 3 | 0.0% |
| Austrian | 65 | 0.1% |
| Bahamian | 37 | 0.0% |
| Belgian | 12 | 0.0% |
| Bhutanese | 382 | 0.3% |
| Blackfeet | 105 | 0.1% |
| Brazilian | 54 | 0.0% |
| British | 642 | 0.5% |
| British West Indian | 104 | 0.1% |
| Burmese | 507 | 0.4% |
| Cajun | 73 | 0.1% |
| Canadian | 115 | 0.1% |
| Central American | 621 | 0.5% |
| Central American Indian | 149 | 0.1% |
| Cherokee | 336 | 0.3% |
| Chickasaw | 87 | 0.1% |
| Chilean | 10 | 0.0% |
| Chippewa | 23 | 0.0% |
| Choctaw | 361 | 0.3% |
| Colombian | 137 | 0.1% |
| Comanche | 72 | 0.1% |
| Creek | 47 | 0.0% |
| Croatian | 105 | 0.1% |
| Cuban | 255 | 0.2% |
| Czech | 331 | 0.3% |
| Czechoslovakian | 148 | 0.1% |
| Danish | 254 | 0.2% |
| Dominican | 81 | 0.1% |
| Dutch | 1,271 | 1.0% |
| Dutch West Indian | 42 | 0.0% |
| Eastern European | 53 | 0.0% |
| Ecuadorian | 7 | 0.0% |
| Egyptian | 2 | 0.0% |
| English | 10,984 | 8.5% |
| Estonian | 5 | 0.0% |
| European | 2,117 | 1.6% |
| Finnish | 155 | 0.1% |
| French | 1,562 | 1.2% |
| French Canadian | 379 | 0.3% |
| German | 14,575 | 11.3% |
| Ghanaian | 36 | 0.0% |
| Greek | 106 | 0.1% |
| Guamanian / Chamorro | 86 | 0.1% |
| Guatemalan | 171 | 0.1% |
| Honduran | 81 | 0.1% |
| Hungarian | 64 | 0.1% |
| Indian (Asian) | 359 | 0.3% |
| Indonesian | 18 | 0.0% |
| Iranian | 8 | 0.0% |
| Irish | 11,575 | 8.9% |
| Iroquois | 2 | 0.0% |
| Italian | 2,150 | 1.7% |
| Jamaican | 85 | 0.1% |
| Japanese | 351 | 0.3% |
| Kenyan | 3 | 0.0% |
| Kiowa | 10 | 0.0% |
| Korean | 834 | 0.6% |
| Lebanese | 168 | 0.1% |
| Lithuanian | 134 | 0.1% |
| Lumbee | 24 | 0.0% |
| Malaysian | 27 | 0.0% |
| Mexican | 23,145 | 17.9% |
| Mexican American Indian | 303 | 0.2% |
| Native Hawaiian | 139 | 0.1% |
| Navajo | 77 | 0.1% |
| Nicaraguan | 13 | 0.0% |
| Nigerian | 493 | 0.4% |
| Northern European | 79 | 0.1% |
| Norwegian | 822 | 0.6% |
| Pakistani | 201 | 0.2% |
| Panamanian | 46 | 0.0% |
| Pennsylvania German | 10 | 0.0% |
| Peruvian | 41 | 0.0% |
| Pima | 21 | 0.0% |
| Polish | 1,031 | 0.8% |
| Portuguese | 133 | 0.1% |
| Puerto Rican | 798 | 0.6% |
| Romanian | 20 | 0.0% |
| Russian | 167 | 0.1% |
| Salvadoran | 310 | 0.2% |
| Samoan | 58 | 0.0% |
| Scandinavian | 380 | 0.3% |
| Scotch-Irish | 1,065 | 0.8% |
| Scottish | 1,910 | 1.5% |
| Seminole | 32 | 0.0% |
| Serbian | 132 | 0.1% |
| Sioux | 29 | 0.0% |
| Slavic | 36 | 0.0% |
| Slovak | 14 | 0.0% |
| Slovene | 14 | 0.0% |
| Somali | 7 | 0.0% |
| South African | 48 | 0.0% |
| South American | 290 | 0.2% |
| South American Indian | 25 | 0.0% |
| Spaniard | 253 | 0.2% |
| Spanish | 354 | 0.3% |
| Spanish American | 5 | 0.0% |
| Spanish American Indian | 7 | 0.0% |
| Sri Lankan | 776 | 0.6% |
| Subsaharan African | 1,822 | 1.4% |
| Sudanese | 5 | 0.0% |
| Swedish | 838 | 0.6% |
| Swiss | 190 | 0.2% |
| Thai | 440 | 0.3% |
| Tlingit-Haida | 27 | 0.0% |
| Trinidadian and Tobagonian | 7 | 0.0% |
| Ugandan | 10 | 0.0% |
| Ukrainian | 24 | 0.0% |
| Venezuelan | 95 | 0.1% |
| Welsh | 491 | 0.4% |
| West Indian | 84 | 0.1% |
| Yugoslavian | 33 | 0.0% |
| Zimbabwean | 54 | 0.0% | View All 120 Rows |
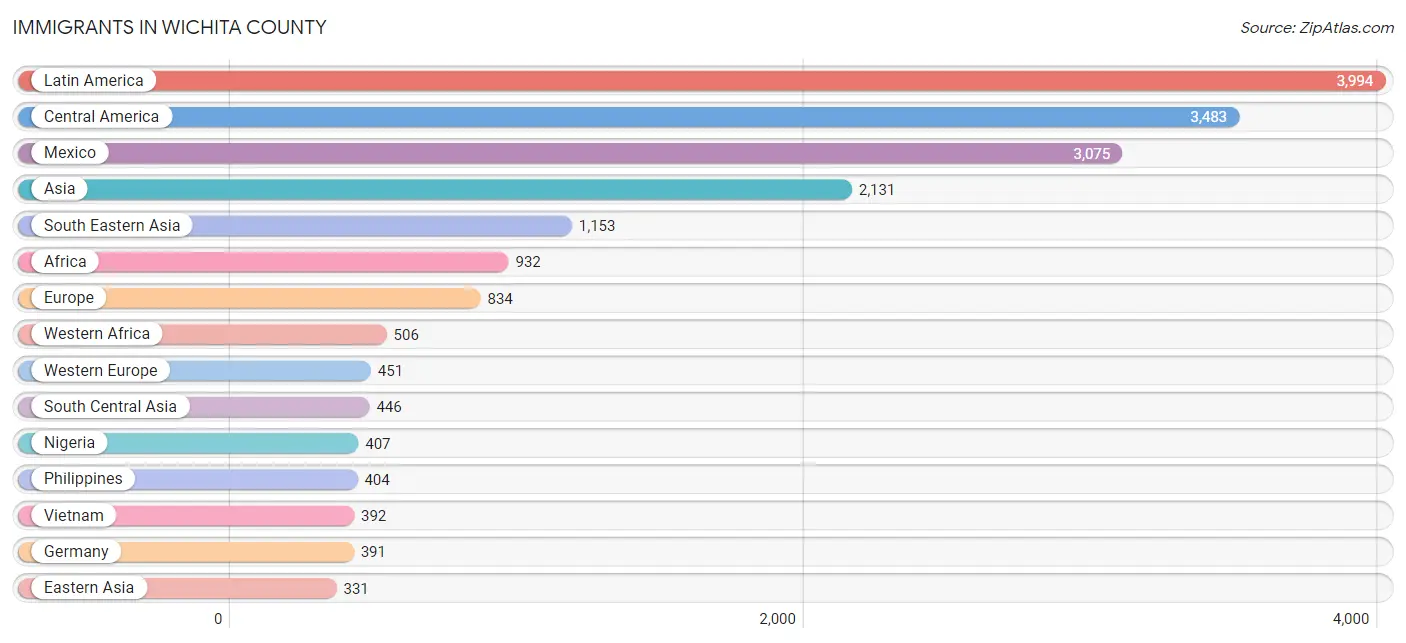
Immigrants in Wichita County
The most numerous immigrant groups reported in Wichita County came from Latin America (3,994 | 3.1%), Central America (3,483 | 2.7%), Mexico (3,075 | 2.4%), Asia (2,131 | 1.6%), and South Eastern Asia (1,153 | 0.9%), together accounting for 10.7% of all Wichita County residents.
| Immigration Origin | # Population | % Population |
| Africa | 932 | 0.7% |
| Asia | 2,131 | 1.6% |
| Australia | 26 | 0.0% |
| Azores | 11 | 0.0% |
| Bahamas | 60 | 0.1% |
| Bangladesh | 35 | 0.0% |
| Belgium | 12 | 0.0% |
| Brazil | 16 | 0.0% |
| Cambodia | 154 | 0.1% |
| Cameroon | 207 | 0.2% |
| Canada | 124 | 0.1% |
| Caribbean | 306 | 0.2% |
| Central America | 3,483 | 2.7% |
| Chile | 10 | 0.0% |
| China | 177 | 0.1% |
| Colombia | 74 | 0.1% |
| Croatia | 19 | 0.0% |
| Cuba | 32 | 0.0% |
| Czechoslovakia | 28 | 0.0% |
| Denmark | 5 | 0.0% |
| Dominica | 30 | 0.0% |
| Dominican Republic | 18 | 0.0% |
| Eastern Africa | 128 | 0.1% |
| Eastern Asia | 331 | 0.3% |
| Eastern Europe | 53 | 0.0% |
| Ecuador | 7 | 0.0% |
| El Salvador | 236 | 0.2% |
| England | 73 | 0.1% |
| Europe | 834 | 0.6% |
| France | 28 | 0.0% |
| Germany | 391 | 0.3% |
| Ghana | 21 | 0.0% |
| Greece | 19 | 0.0% |
| Grenada | 83 | 0.1% |
| Guatemala | 151 | 0.1% |
| Guyana | 17 | 0.0% |
| Honduras | 8 | 0.0% |
| Hong Kong | 14 | 0.0% |
| India | 194 | 0.2% |
| Iran | 8 | 0.0% |
| Ireland | 41 | 0.0% |
| Italy | 38 | 0.0% |
| Jamaica | 24 | 0.0% |
| Japan | 71 | 0.1% |
| Kenya | 25 | 0.0% |
| Korea | 83 | 0.1% |
| Laos | 14 | 0.0% |
| Latin America | 3,994 | 3.1% |
| Malaysia | 46 | 0.0% |
| Mexico | 3,075 | 2.4% |
| Middle Africa | 247 | 0.2% |
| Nepal | 160 | 0.1% |
| Netherlands | 20 | 0.0% |
| Nicaragua | 13 | 0.0% |
| Nigeria | 407 | 0.3% |
| Northern Europe | 206 | 0.2% |
| Oceania | 26 | 0.0% |
| Pakistan | 49 | 0.0% |
| Peru | 29 | 0.0% |
| Philippines | 404 | 0.3% |
| Portugal | 11 | 0.0% |
| Russia | 6 | 0.0% |
| Saudi Arabia | 201 | 0.2% |
| Singapore | 14 | 0.0% |
| Somalia | 7 | 0.0% |
| South Africa | 12 | 0.0% |
| South America | 205 | 0.2% |
| South Central Asia | 446 | 0.3% |
| South Eastern Asia | 1,153 | 0.9% |
| Southern Europe | 68 | 0.1% |
| Sweden | 9 | 0.0% |
| Thailand | 121 | 0.1% |
| Trinidad and Tobago | 11 | 0.0% |
| Venezuela | 52 | 0.0% |
| Vietnam | 392 | 0.3% |
| Western Africa | 506 | 0.4% |
| Western Asia | 201 | 0.2% |
| Western Europe | 451 | 0.4% |
| Zaire | 25 | 0.0% |
| Zimbabwe | 96 | 0.1% | View All 80 Rows |
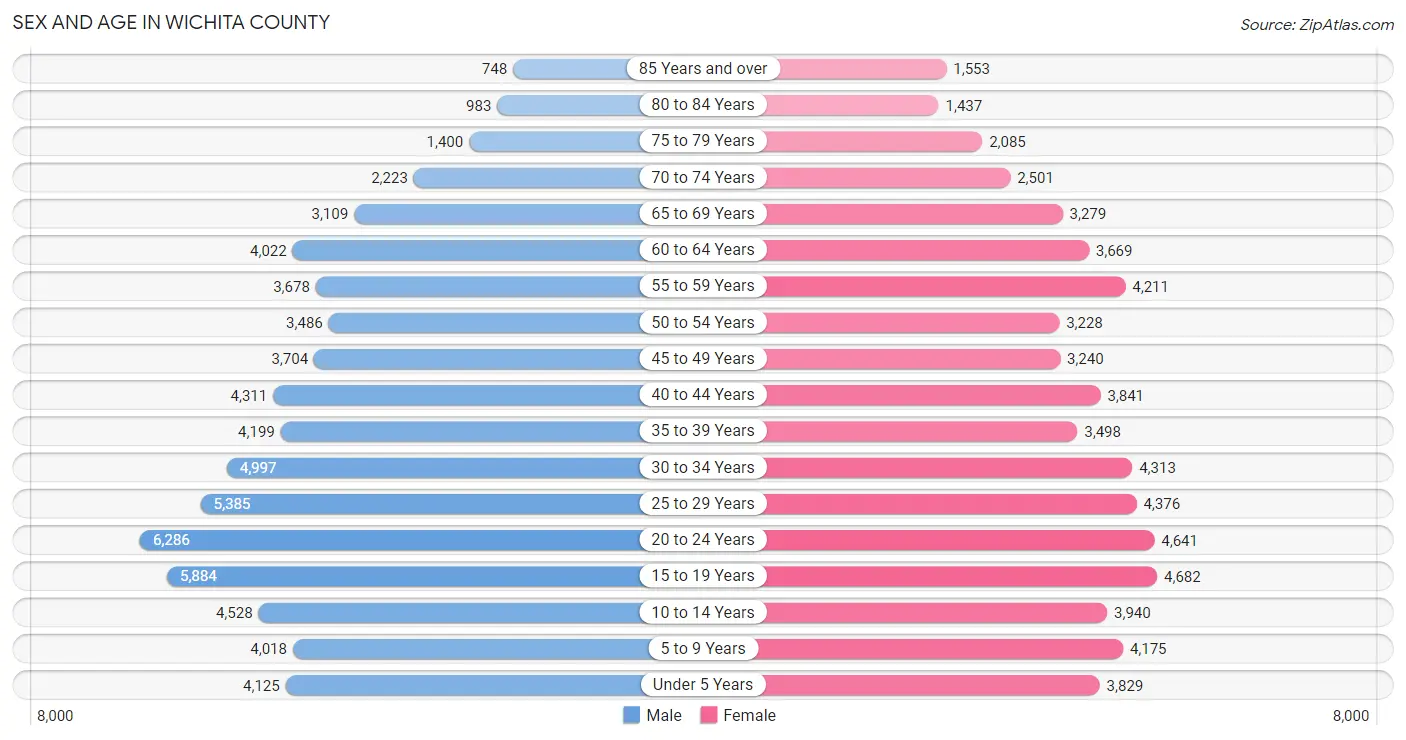
Sex and Age in Wichita County
Sex and Age in Wichita County
The most populous age groups in Wichita County are 20 to 24 Years (6,286 | 9.4%) for men and 15 to 19 Years (4,682 | 7.5%) for women.
| Age Bracket | Male | Female |
| Under 5 Years | 4,125 (6.1%) | 3,829 (6.1%) |
| 5 to 9 Years | 4,018 (6.0%) | 4,175 (6.7%) |
| 10 to 14 Years | 4,528 (6.8%) | 3,940 (6.3%) |
| 15 to 19 Years | 5,884 (8.8%) | 4,682 (7.5%) |
| 20 to 24 Years | 6,286 (9.4%) | 4,641 (7.4%) |
| 25 to 29 Years | 5,385 (8.0%) | 4,376 (7.0%) |
| 30 to 34 Years | 4,997 (7.4%) | 4,313 (6.9%) |
| 35 to 39 Years | 4,199 (6.3%) | 3,498 (5.6%) |
| 40 to 44 Years | 4,311 (6.4%) | 3,841 (6.1%) |
| 45 to 49 Years | 3,704 (5.5%) | 3,240 (5.2%) |
| 50 to 54 Years | 3,486 (5.2%) | 3,228 (5.2%) |
| 55 to 59 Years | 3,678 (5.5%) | 4,211 (6.7%) |
| 60 to 64 Years | 4,022 (6.0%) | 3,669 (5.9%) |
| 65 to 69 Years | 3,109 (4.6%) | 3,279 (5.2%) |
| 70 to 74 Years | 2,223 (3.3%) | 2,501 (4.0%) |
| 75 to 79 Years | 1,400 (2.1%) | 2,085 (3.3%) |
| 80 to 84 Years | 983 (1.5%) | 1,437 (2.3%) |
| 85 Years and over | 748 (1.1%) | 1,553 (2.5%) |
| Total | 67,086 (100.0%) | 62,498 (100.0%) |
Families and Households in Wichita County
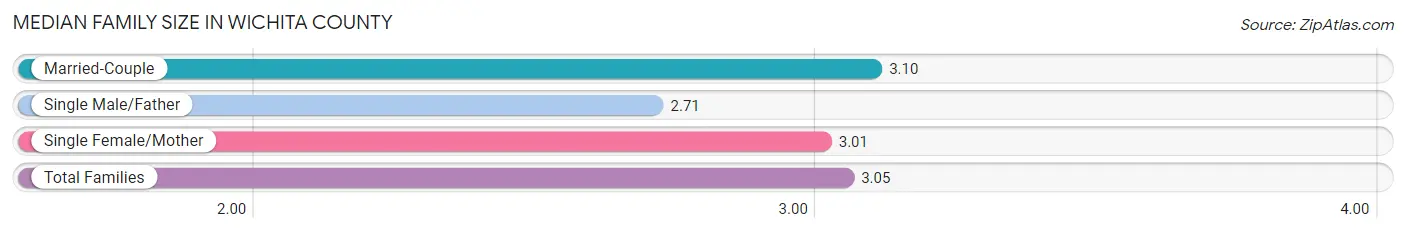
Median Family Size in Wichita County
The median family size in Wichita County is 3.05 persons per family, with married-couple families (21,222 | 69.5%) accounting for the largest median family size of 3.1 persons per family. On the other hand, single male/father families (2,699 | 8.8%) represent the smallest median family size with 2.71 persons per family.
| Family Type | # Families | Family Size |
| Married-Couple | 21,222 (69.5%) | 3.10 |
| Single Male/Father | 2,699 (8.8%) | 2.71 |
| Single Female/Mother | 6,623 (21.7%) | 3.01 |
| Total Families | 30,544 (100.0%) | 3.05 |
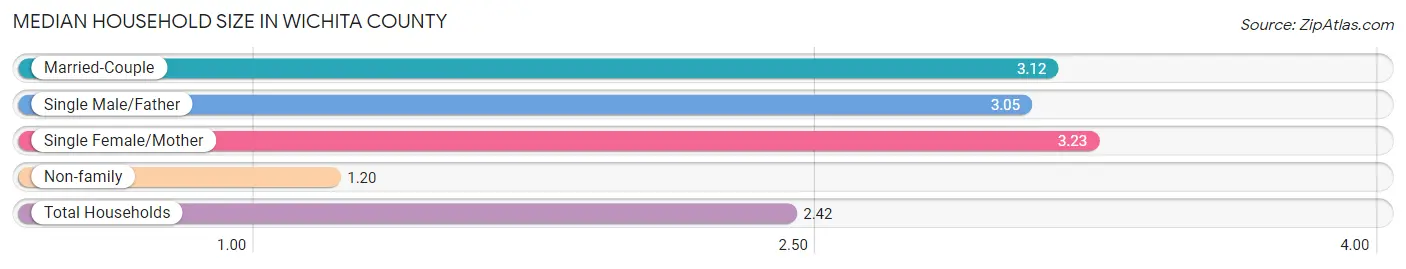
Median Household Size in Wichita County
The median household size in Wichita County is 2.42 persons per household, with single female/mother households (6,623 | 13.6%) accounting for the largest median household size of 3.23 persons per household. non-family households (18,060 | 37.2%) represent the smallest median household size with 1.20 persons per household.
| Household Type | # Households | Household Size |
| Married-Couple | 21,222 (43.7%) | 3.12 |
| Single Male/Father | 2,699 (5.6%) | 3.05 |
| Single Female/Mother | 6,623 (13.6%) | 3.23 |
| Non-family | 18,060 (37.2%) | 1.20 |
| Total Households | 48,604 (100.0%) | 2.42 |
Household Size by Marriage Status in Wichita County
Out of a total of 48,604 households in Wichita County, 30,544 (62.8%) are family households, while 18,060 (37.2%) are nonfamily households. The most numerous type of family households are 2-person households, comprising 14,861, and the most common type of nonfamily households are 1-person households, comprising 15,081.
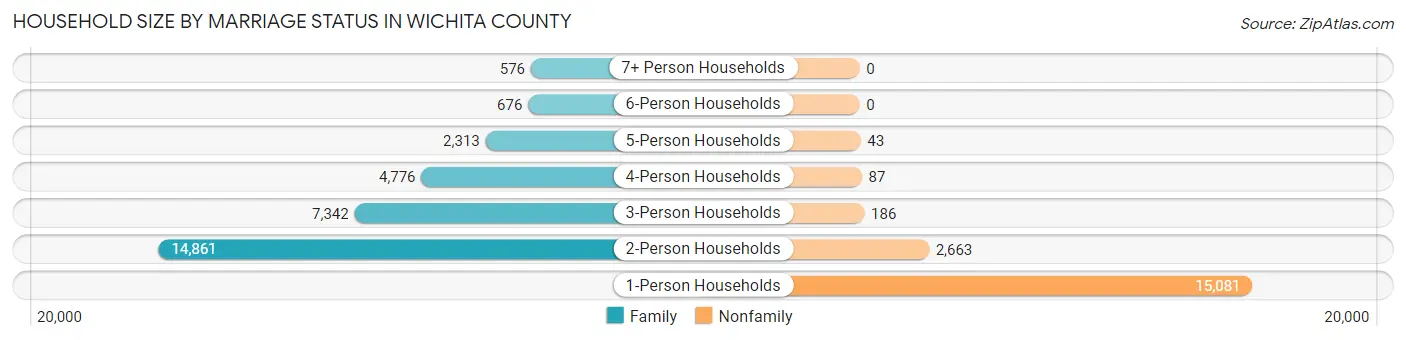
| Household Size | Family Households | Nonfamily Households |
| 1-Person Households | - | 15,081 (31.0%) |
| 2-Person Households | 14,861 (30.6%) | 2,663 (5.5%) |
| 3-Person Households | 7,342 (15.1%) | 186 (0.4%) |
| 4-Person Households | 4,776 (9.8%) | 87 (0.2%) |
| 5-Person Households | 2,313 (4.8%) | 43 (0.1%) |
| 6-Person Households | 676 (1.4%) | 0 (0.0%) |
| 7+ Person Households | 576 (1.2%) | 0 (0.0%) |
| Total | 30,544 (62.8%) | 18,060 (37.2%) |
Female Fertility in Wichita County
Fertility by Age in Wichita County
Average fertility rate in Wichita County is 46.0 births per 1,000 women. Women in the age bracket of 20 to 34 years have the highest fertility rate with 78.0 births per 1,000 women. Women in the age bracket of 20 to 34 years acount for 78.3% of all women with births.
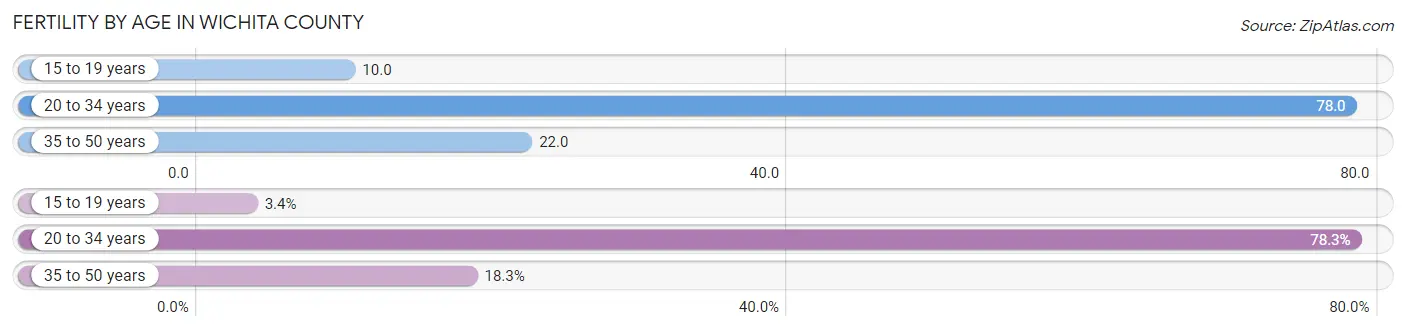
| Age Bracket | Women with Births | Births / 1,000 Women |
| 15 to 19 years | 45 (3.4%) | 10.0 |
| 20 to 34 years | 1,045 (78.3%) | 78.0 |
| 35 to 50 years | 244 (18.3%) | 22.0 |
| Total | 1,334 (100.0%) | 46.0 |
Fertility by Age by Marriage Status in Wichita County
69.3% of women with births (1,334) in Wichita County are married. The highest percentage of unmarried women with births falls into 15 to 19 years age bracket with 82.2% of them unmarried at the time of birth, while the lowest percentage of unmarried women with births belong to 20 to 34 years age bracket with 27.7% of them unmarried.
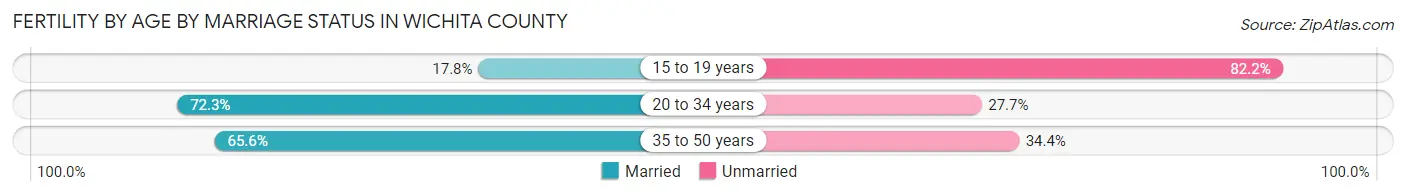
| Age Bracket | Married | Unmarried |
| 15 to 19 years | 8 (17.8%) | 37 (82.2%) |
| 20 to 34 years | 756 (72.3%) | 289 (27.7%) |
| 35 to 50 years | 160 (65.6%) | 84 (34.4%) |
| Total | 924 (69.3%) | 410 (30.7%) |
Fertility by Education in Wichita County
Average fertility rate in Wichita County is 46.0 births per 1,000 women. Women with the education attainment of bachelor's degree have the highest fertility rate of 58.0 births per 1,000 women, while women with the education attainment of less than high school have the lowest fertility at 34.0 births per 1,000 women. Women with the education attainment of college or associate's degree represent 37.6% of all women with births.
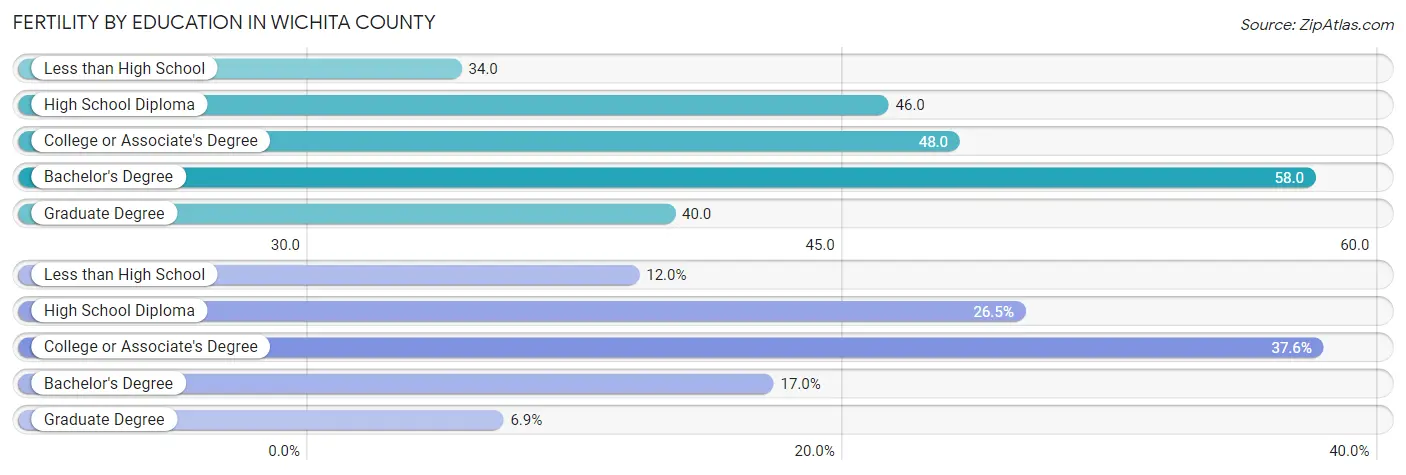
| Educational Attainment | Women with Births | Births / 1,000 Women |
| Less than High School | 160 (12.0%) | 34.0 |
| High School Diploma | 353 (26.5%) | 46.0 |
| College or Associate's Degree | 502 (37.6%) | 48.0 |
| Bachelor's Degree | 227 (17.0%) | 58.0 |
| Graduate Degree | 92 (6.9%) | 40.0 |
| Total | 1,334 (100.0%) | 46.0 |
Fertility by Education by Marriage Status in Wichita County
30.7% of women with births in Wichita County are unmarried. Women with the educational attainment of graduate degree are most likely to be married with 100.0% of them married at childbirth, while women with the educational attainment of less than high school are least likely to be married with 64.4% of them unmarried at childbirth.
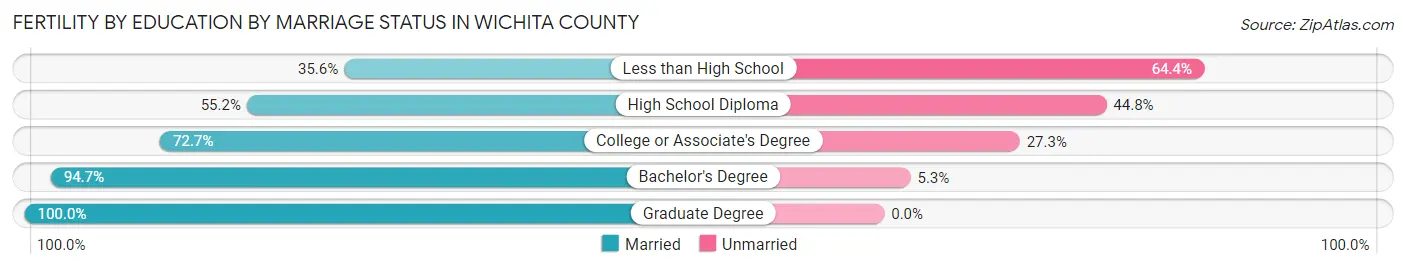
| Educational Attainment | Married | Unmarried |
| Less than High School | 57 (35.6%) | 103 (64.4%) |
| High School Diploma | 195 (55.2%) | 158 (44.8%) |
| College or Associate's Degree | 365 (72.7%) | 137 (27.3%) |
| Bachelor's Degree | 215 (94.7%) | 12 (5.3%) |
| Graduate Degree | 92 (100.0%) | 0 (0.0%) |
| Total | 924 (69.3%) | 410 (30.7%) |
Employment Characteristics in Wichita County
Employment by Class of Employer in Wichita County
Among the 62,261 employed individuals in Wichita County, private company employees (37,287 | 59.9%), federal government employees (8,342 | 13.4%), and not-for-profit organizations (4,388 | 7.0%) make up the most common classes of employment.
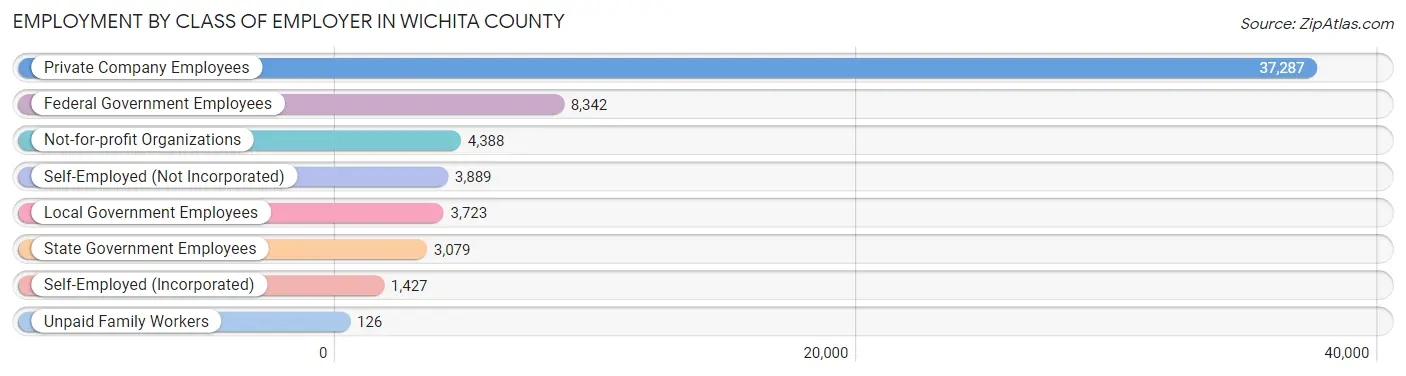
| Employer Class | # Employees | % Employees |
| Private Company Employees | 37,287 | 59.9% |
| Self-Employed (Incorporated) | 1,427 | 2.3% |
| Self-Employed (Not Incorporated) | 3,889 | 6.2% |
| Not-for-profit Organizations | 4,388 | 7.0% |
| Local Government Employees | 3,723 | 6.0% |
| State Government Employees | 3,079 | 5.0% |
| Federal Government Employees | 8,342 | 13.4% |
| Unpaid Family Workers | 126 | 0.2% |
| Total | 62,261 | 100.0% |
Employment Status by Age in Wichita County
According to the labor force statistics for Wichita County, out of the total population over 16 years of age (103,449), 63.6% or 65,794 individuals are in the labor force, with 4.2% or 2,763 of them unemployed. The age group with the highest labor force participation rate is 25 to 29 years, with 82.7% or 8,072 individuals in the labor force. Within the labor force, the 16 to 19 years age range has the highest percentage of unemployed individuals, with 11.8% or 606 of them being unemployed.
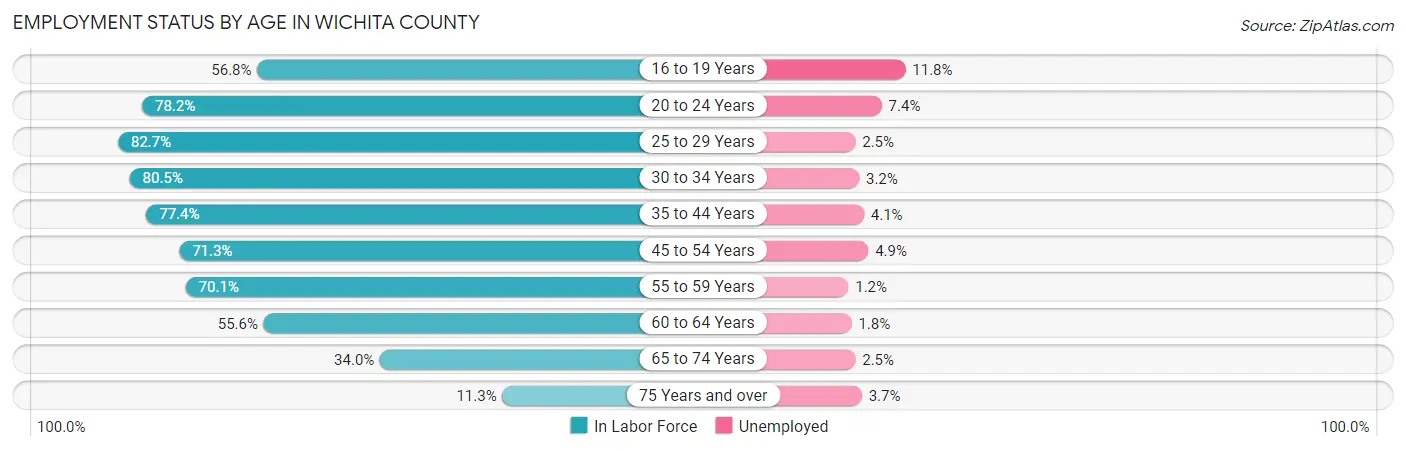
| Age Bracket | In Labor Force | Unemployed |
| 16 to 19 Years | 5,138 (56.8%) | 606 (11.8%) |
| 20 to 24 Years | 8,545 (78.2%) | 632 (7.4%) |
| 25 to 29 Years | 8,072 (82.7%) | 202 (2.5%) |
| 30 to 34 Years | 7,495 (80.5%) | 240 (3.2%) |
| 35 to 44 Years | 12,267 (77.4%) | 503 (4.1%) |
| 45 to 54 Years | 9,738 (71.3%) | 477 (4.9%) |
| 55 to 59 Years | 5,530 (70.1%) | 66 (1.2%) |
| 60 to 64 Years | 4,276 (55.6%) | 77 (1.8%) |
| 65 to 74 Years | 3,778 (34.0%) | 94 (2.5%) |
| 75 Years and over | 927 (11.3%) | 34 (3.7%) |
| Total | 65,794 (63.6%) | 2,763 (4.2%) |
Employment Status by Educational Attainment in Wichita County
According to labor force statistics for Wichita County, 73.8% of individuals (47,349) out of the total population between 25 and 64 years of age (64,158) are in the labor force, with 3.3% or 1,563 of them being unemployed. The group with the highest labor force participation rate are those with the educational attainment of bachelor's degree or higher, with 84.3% or 12,781 individuals in the labor force. Within the labor force, individuals with less than high school education have the highest percentage of unemployment, with 6.9% or 255 of them being unemployed.
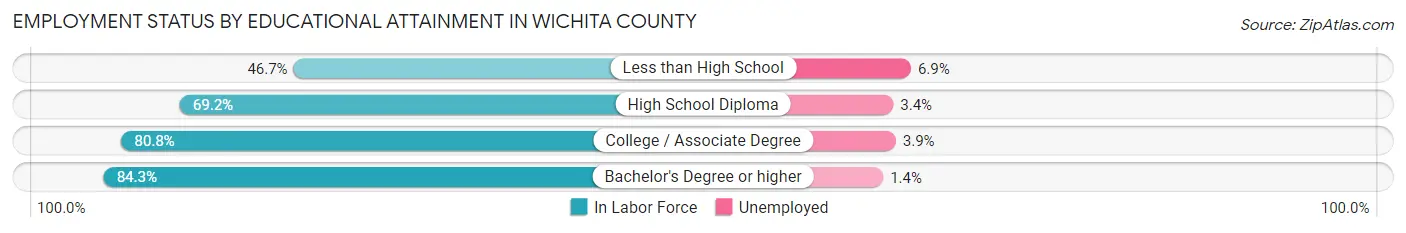
| Educational Attainment | In Labor Force | Unemployed |
| Less than High School | 3,698 (46.7%) | 546 (6.9%) |
| High School Diploma | 13,747 (69.2%) | 675 (3.4%) |
| College / Associate Degree | 17,139 (80.8%) | 827 (3.9%) |
| Bachelor's Degree or higher | 12,781 (84.3%) | 212 (1.4%) |
| Total | 47,349 (73.8%) | 2,117 (3.3%) |
Employment Occupations by Sex in Wichita County
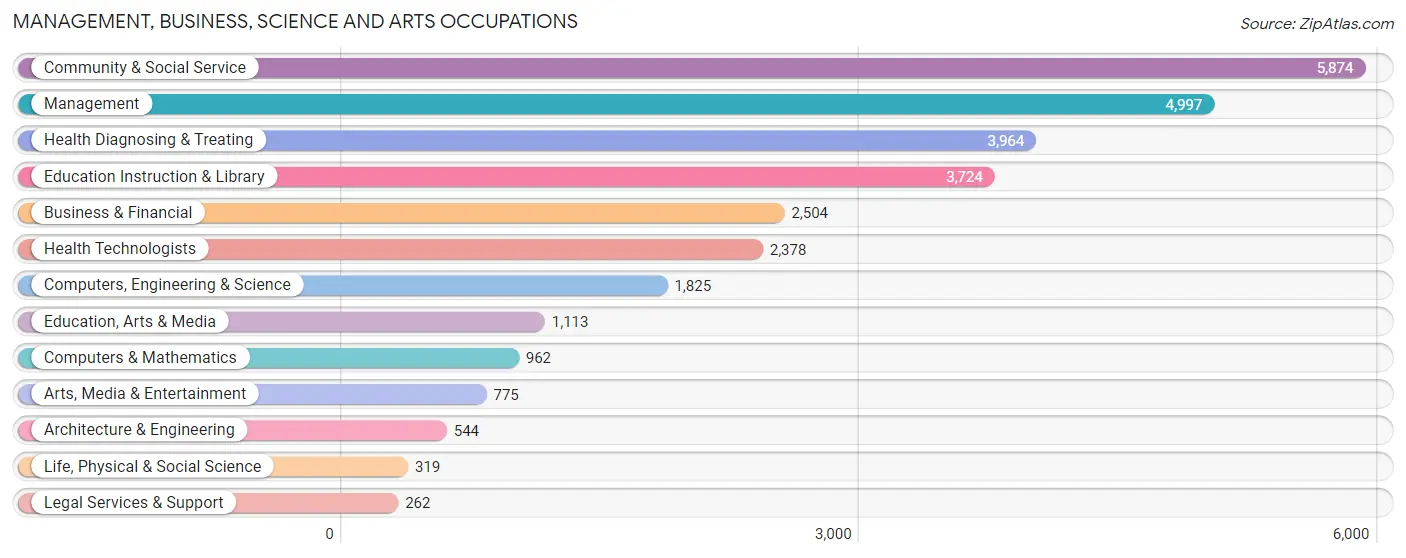
Management, Business, Science and Arts Occupations
The most common Management, Business, Science and Arts occupations in Wichita County are Community & Social Service (5,874 | 10.2%), Management (4,997 | 8.7%), Health Diagnosing & Treating (3,964 | 6.9%), Education Instruction & Library (3,724 | 6.5%), and Business & Financial (2,504 | 4.3%).
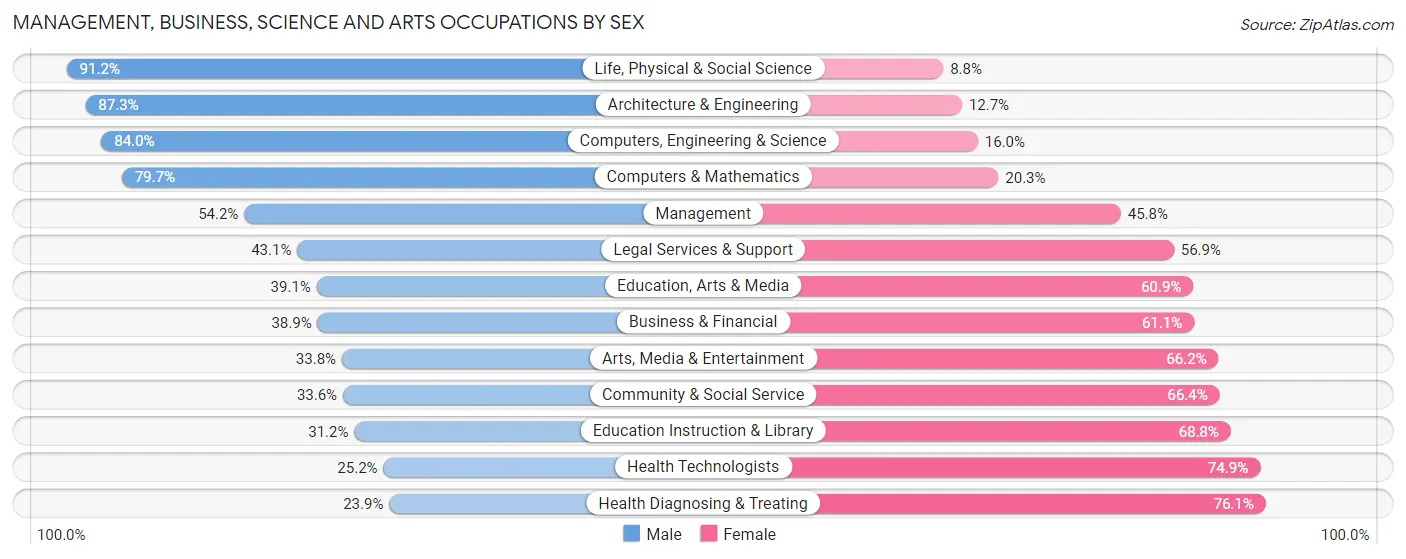
Management, Business, Science and Arts Occupations by Sex
Within the Management, Business, Science and Arts occupations in Wichita County, the most male-oriented occupations are Life, Physical & Social Science (91.2%), Architecture & Engineering (87.3%), and Computers, Engineering & Science (84.0%), while the most female-oriented occupations are Health Diagnosing & Treating (76.1%), Health Technologists (74.9%), and Education Instruction & Library (68.8%).
| Occupation | Male | Female |
| Management | 2,708 (54.2%) | 2,289 (45.8%) |
| Business & Financial | 974 (38.9%) | 1,530 (61.1%) |
| Computers, Engineering & Science | 1,533 (84.0%) | 292 (16.0%) |
| Computers & Mathematics | 767 (79.7%) | 195 (20.3%) |
| Architecture & Engineering | 475 (87.3%) | 69 (12.7%) |
| Life, Physical & Social Science | 291 (91.2%) | 28 (8.8%) |
| Community & Social Service | 1,973 (33.6%) | 3,901 (66.4%) |
| Education, Arts & Media | 435 (39.1%) | 678 (60.9%) |
| Legal Services & Support | 113 (43.1%) | 149 (56.9%) |
| Education Instruction & Library | 1,163 (31.2%) | 2,561 (68.8%) |
| Arts, Media & Entertainment | 262 (33.8%) | 513 (66.2%) |
| Health Diagnosing & Treating | 949 (23.9%) | 3,015 (76.1%) |
| Health Technologists | 598 (25.2%) | 1,780 (74.9%) |
| Total (Category) | 8,137 (42.5%) | 11,027 (57.5%) |
| Total (Overall) | 29,883 (51.8%) | 27,817 (48.2%) |
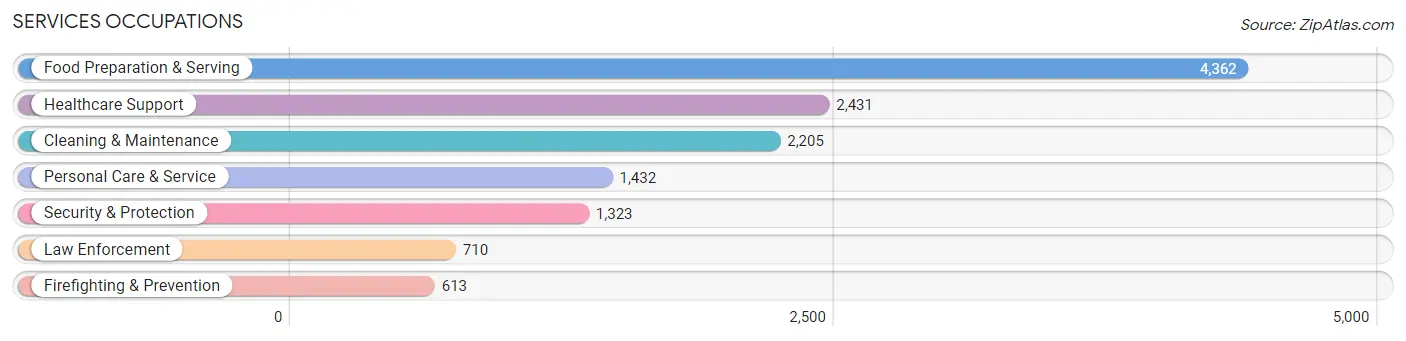
Services Occupations
The most common Services occupations in Wichita County are Food Preparation & Serving (4,362 | 7.6%), Healthcare Support (2,431 | 4.2%), Cleaning & Maintenance (2,205 | 3.8%), Personal Care & Service (1,432 | 2.5%), and Security & Protection (1,323 | 2.3%).
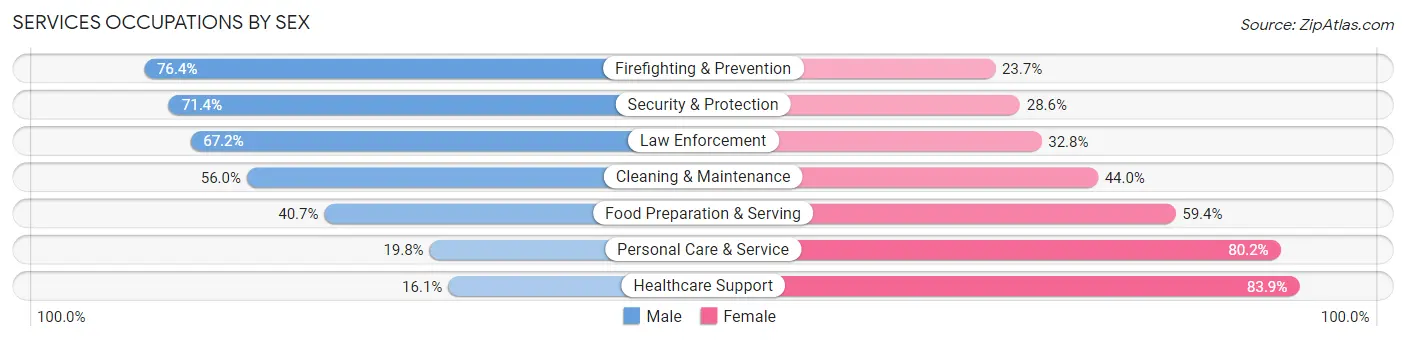
Services Occupations by Sex
Within the Services occupations in Wichita County, the most male-oriented occupations are Firefighting & Prevention (76.3%), Security & Protection (71.4%), and Law Enforcement (67.2%), while the most female-oriented occupations are Healthcare Support (83.9%), Personal Care & Service (80.2%), and Food Preparation & Serving (59.4%).
| Occupation | Male | Female |
| Healthcare Support | 392 (16.1%) | 2,039 (83.9%) |
| Security & Protection | 945 (71.4%) | 378 (28.6%) |
| Firefighting & Prevention | 468 (76.3%) | 145 (23.6%) |
| Law Enforcement | 477 (67.2%) | 233 (32.8%) |
| Food Preparation & Serving | 1,773 (40.6%) | 2,589 (59.4%) |
| Cleaning & Maintenance | 1,235 (56.0%) | 970 (44.0%) |
| Personal Care & Service | 284 (19.8%) | 1,148 (80.2%) |
| Total (Category) | 4,629 (39.4%) | 7,124 (60.6%) |
| Total (Overall) | 29,883 (51.8%) | 27,817 (48.2%) |
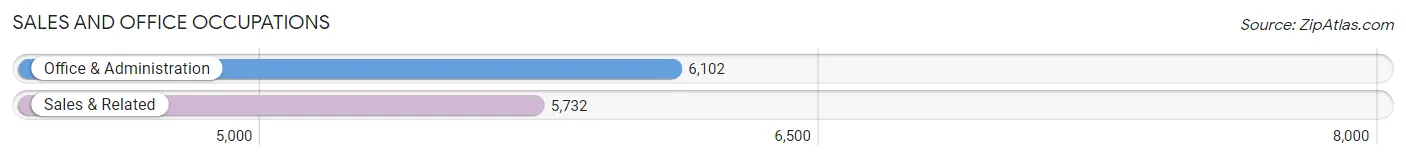
Sales and Office Occupations
The most common Sales and Office occupations in Wichita County are Office & Administration (6,102 | 10.6%), and Sales & Related (5,732 | 9.9%).
Sales and Office Occupations by Sex
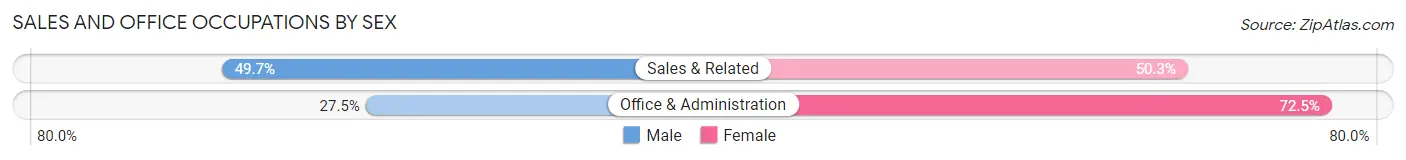
| Occupation | Male | Female |
| Sales & Related | 2,847 (49.7%) | 2,885 (50.3%) |
| Office & Administration | 1,680 (27.5%) | 4,422 (72.5%) |
| Total (Category) | 4,527 (38.3%) | 7,307 (61.8%) |
| Total (Overall) | 29,883 (51.8%) | 27,817 (48.2%) |
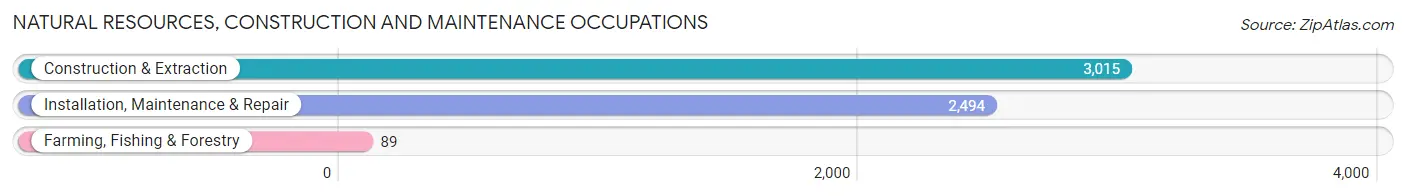
Natural Resources, Construction and Maintenance Occupations
The most common Natural Resources, Construction and Maintenance occupations in Wichita County are Construction & Extraction (3,015 | 5.2%), Installation, Maintenance & Repair (2,494 | 4.3%), and Farming, Fishing & Forestry (89 | 0.2%).
Natural Resources, Construction and Maintenance Occupations by Sex
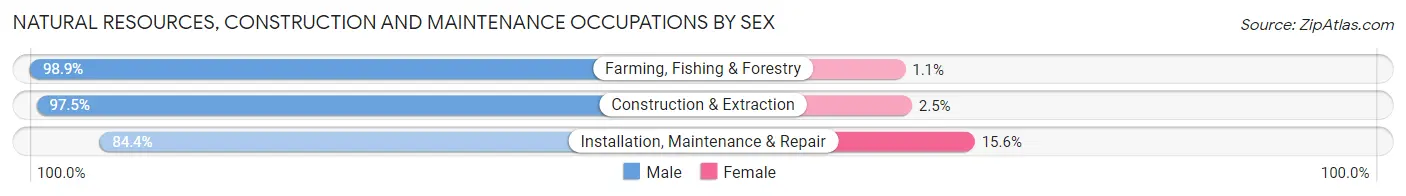
| Occupation | Male | Female |
| Farming, Fishing & Forestry | 88 (98.9%) | 1 (1.1%) |
| Construction & Extraction | 2,940 (97.5%) | 75 (2.5%) |
| Installation, Maintenance & Repair | 2,106 (84.4%) | 388 (15.6%) |
| Total (Category) | 5,134 (91.7%) | 464 (8.3%) |
| Total (Overall) | 29,883 (51.8%) | 27,817 (48.2%) |
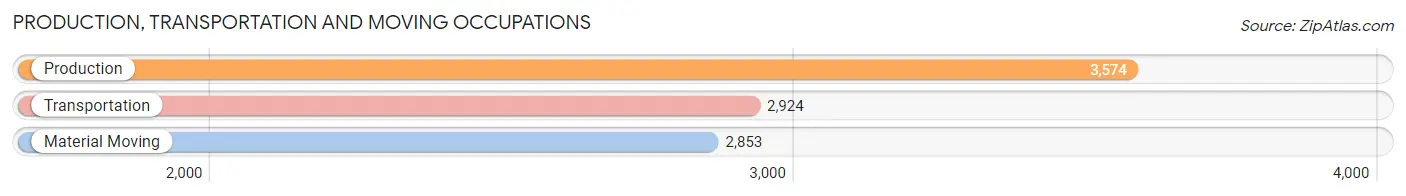
Production, Transportation and Moving Occupations
The most common Production, Transportation and Moving occupations in Wichita County are Production (3,574 | 6.2%), Transportation (2,924 | 5.1%), and Material Moving (2,853 | 4.9%).
Production, Transportation and Moving Occupations by Sex
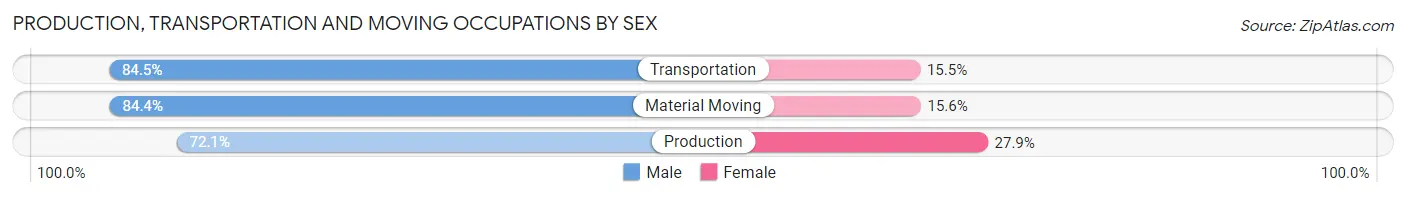
| Occupation | Male | Female |
| Production | 2,577 (72.1%) | 997 (27.9%) |
| Transportation | 2,471 (84.5%) | 453 (15.5%) |
| Material Moving | 2,408 (84.4%) | 445 (15.6%) |
| Total (Category) | 7,456 (79.7%) | 1,895 (20.3%) |
| Total (Overall) | 29,883 (51.8%) | 27,817 (48.2%) |
Employment Industries by Sex in Wichita County
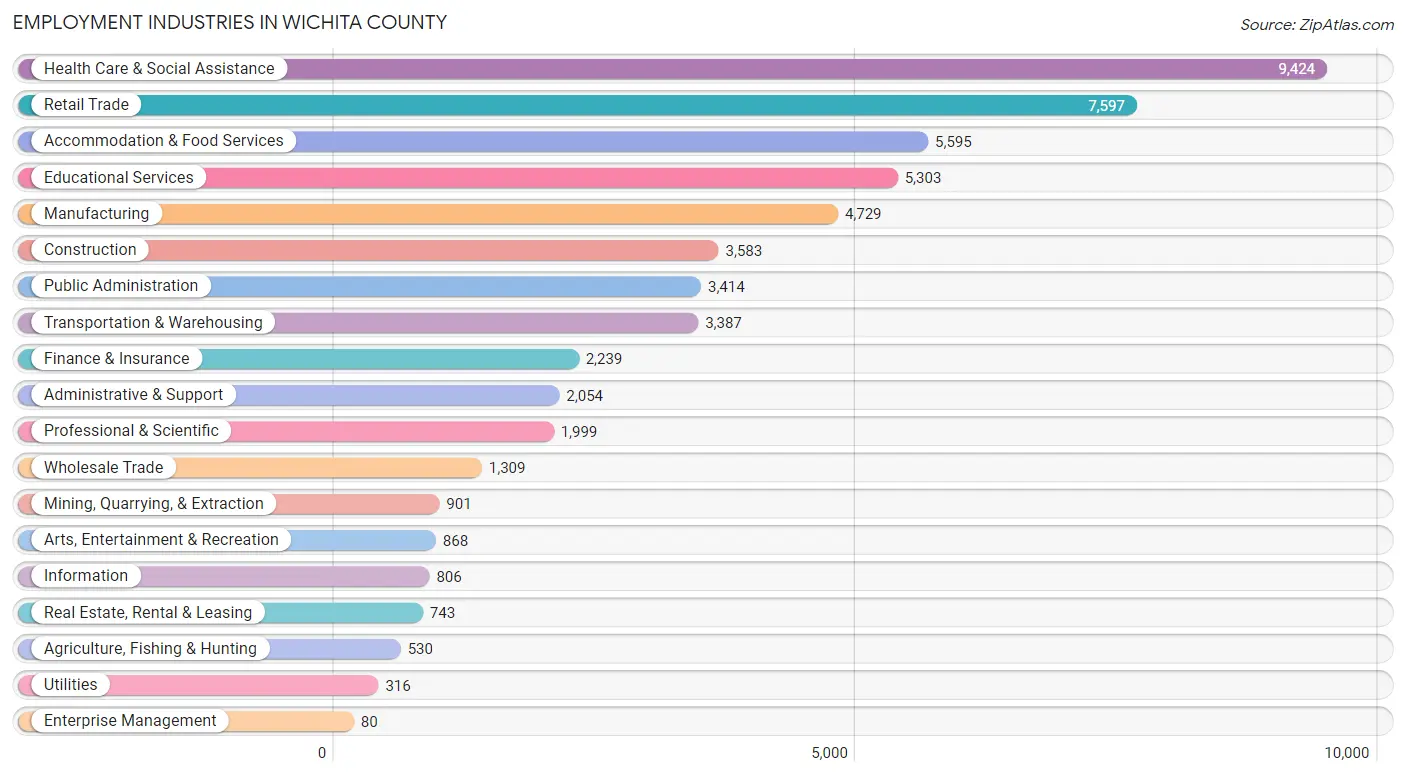
Employment Industries in Wichita County
The major employment industries in Wichita County include Health Care & Social Assistance (9,424 | 16.3%), Retail Trade (7,597 | 13.2%), Accommodation & Food Services (5,595 | 9.7%), Educational Services (5,303 | 9.2%), and Manufacturing (4,729 | 8.2%).
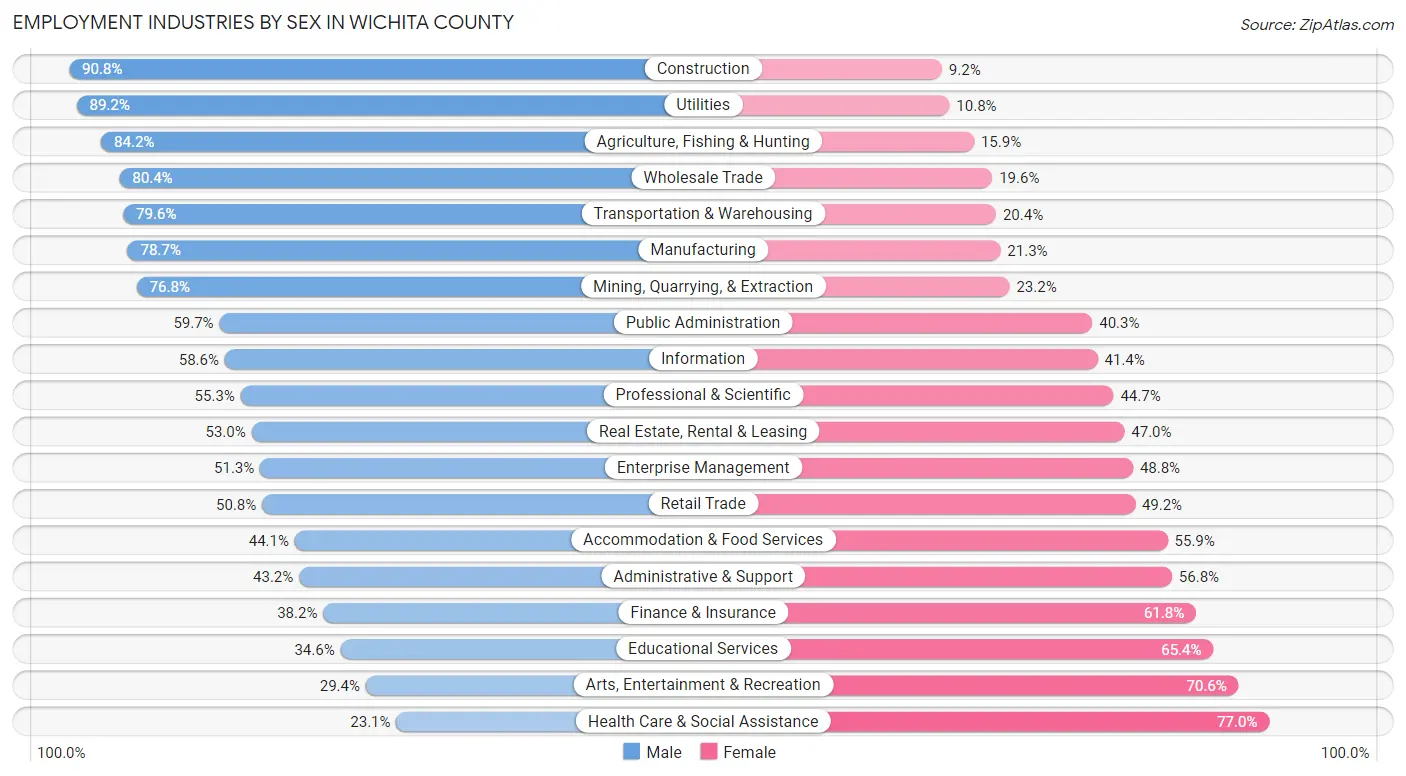
Employment Industries by Sex in Wichita County
The Wichita County industries that see more men than women are Construction (90.8%), Utilities (89.2%), and Agriculture, Fishing & Hunting (84.2%), whereas the industries that tend to have a higher number of women are Health Care & Social Assistance (76.9%), Arts, Entertainment & Recreation (70.6%), and Educational Services (65.4%).
| Industry | Male | Female |
| Agriculture, Fishing & Hunting | 446 (84.2%) | 84 (15.9%) |
| Mining, Quarrying, & Extraction | 692 (76.8%) | 209 (23.2%) |
| Construction | 3,253 (90.8%) | 330 (9.2%) |
| Manufacturing | 3,721 (78.7%) | 1,008 (21.3%) |
| Wholesale Trade | 1,052 (80.4%) | 257 (19.6%) |
| Retail Trade | 3,862 (50.8%) | 3,735 (49.2%) |
| Transportation & Warehousing | 2,696 (79.6%) | 691 (20.4%) |
| Utilities | 282 (89.2%) | 34 (10.8%) |
| Information | 472 (58.6%) | 334 (41.4%) |
| Finance & Insurance | 855 (38.2%) | 1,384 (61.8%) |
| Real Estate, Rental & Leasing | 394 (53.0%) | 349 (47.0%) |
| Professional & Scientific | 1,105 (55.3%) | 894 (44.7%) |
| Enterprise Management | 41 (51.2%) | 39 (48.7%) |
| Administrative & Support | 887 (43.2%) | 1,167 (56.8%) |
| Educational Services | 1,836 (34.6%) | 3,467 (65.4%) |
| Health Care & Social Assistance | 2,172 (23.1%) | 7,252 (76.9%) |
| Arts, Entertainment & Recreation | 255 (29.4%) | 613 (70.6%) |
| Accommodation & Food Services | 2,466 (44.1%) | 3,129 (55.9%) |
| Public Administration | 2,037 (59.7%) | 1,377 (40.3%) |
| Total | 29,883 (51.8%) | 27,817 (48.2%) |
Education in Wichita County
School Enrollment in Wichita County
The most common levels of schooling among the 31,497 students in Wichita County are college / undergraduate (7,387 | 23.4%), elementary school (6,697 | 21.3%), and middle school (6,538 | 20.8%).
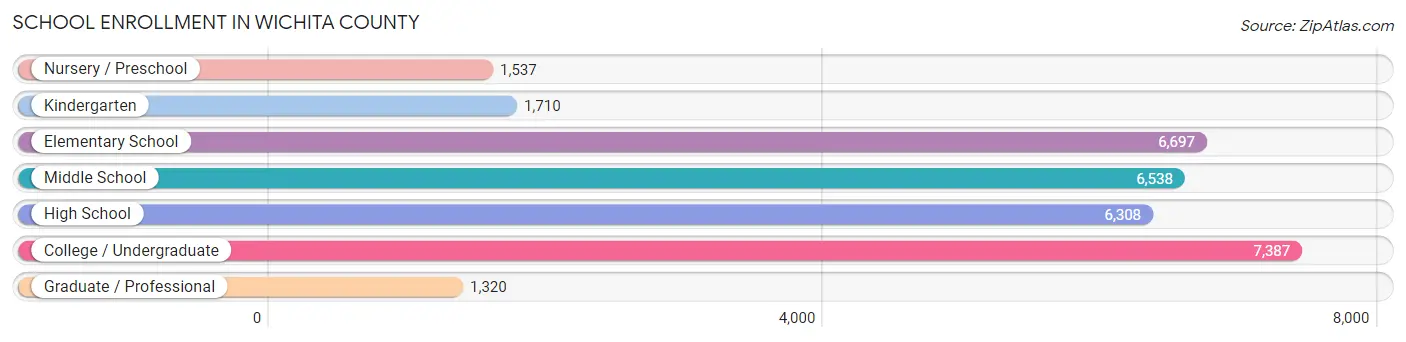
| School Level | # Students | % Students |
| Nursery / Preschool | 1,537 | 4.9% |
| Kindergarten | 1,710 | 5.4% |
| Elementary School | 6,697 | 21.3% |
| Middle School | 6,538 | 20.8% |
| High School | 6,308 | 20.0% |
| College / Undergraduate | 7,387 | 23.4% |
| Graduate / Professional | 1,320 | 4.2% |
| Total | 31,497 | 100.0% |
School Enrollment by Age by Funding Source in Wichita County
Out of a total of 31,497 students who are enrolled in schools in Wichita County, 3,087 (9.8%) attend a private institution, while the remaining 28,410 (90.2%) are enrolled in public schools. The age group of 35 years and over has the highest likelihood of being enrolled in private schools, with 391 (27.1% in the age bracket) enrolled. Conversely, the age group of 18 to 19 year olds has the lowest likelihood of being enrolled in a private school, with 2,278 (95.0% in the age bracket) attending a public institution.
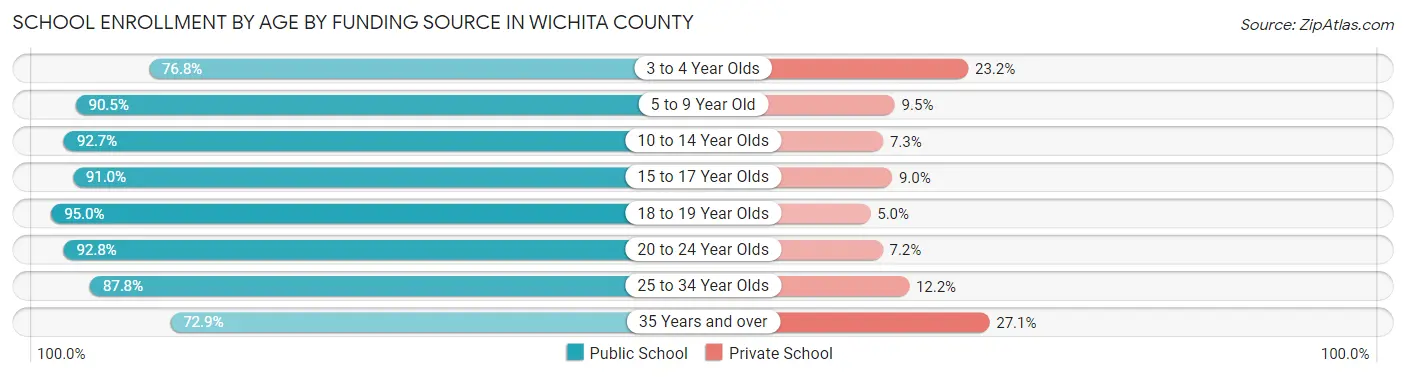
| Age Bracket | Public School | Private School |
| 3 to 4 Year Olds | 1,041 (76.8%) | 314 (23.2%) |
| 5 to 9 Year Old | 7,032 (90.5%) | 738 (9.5%) |
| 10 to 14 Year Olds | 7,663 (92.7%) | 605 (7.3%) |
| 15 to 17 Year Olds | 3,942 (91.0%) | 390 (9.0%) |
| 18 to 19 Year Olds | 2,278 (95.0%) | 119 (5.0%) |
| 20 to 24 Year Olds | 3,346 (92.8%) | 261 (7.2%) |
| 25 to 34 Year Olds | 2,044 (87.8%) | 283 (12.2%) |
| 35 Years and over | 1,050 (72.9%) | 391 (27.1%) |
| Total | 28,410 (90.2%) | 3,087 (9.8%) |
Educational Attainment by Field of Study in Wichita County
Business (3,918 | 18.6%), education (3,770 | 17.9%), science & technology (2,258 | 10.7%), arts & humanities (1,849 | 8.8%), and social sciences (1,351 | 6.4%) are the most common fields of study among 21,093 individuals in Wichita County who have obtained a bachelor's degree or higher.
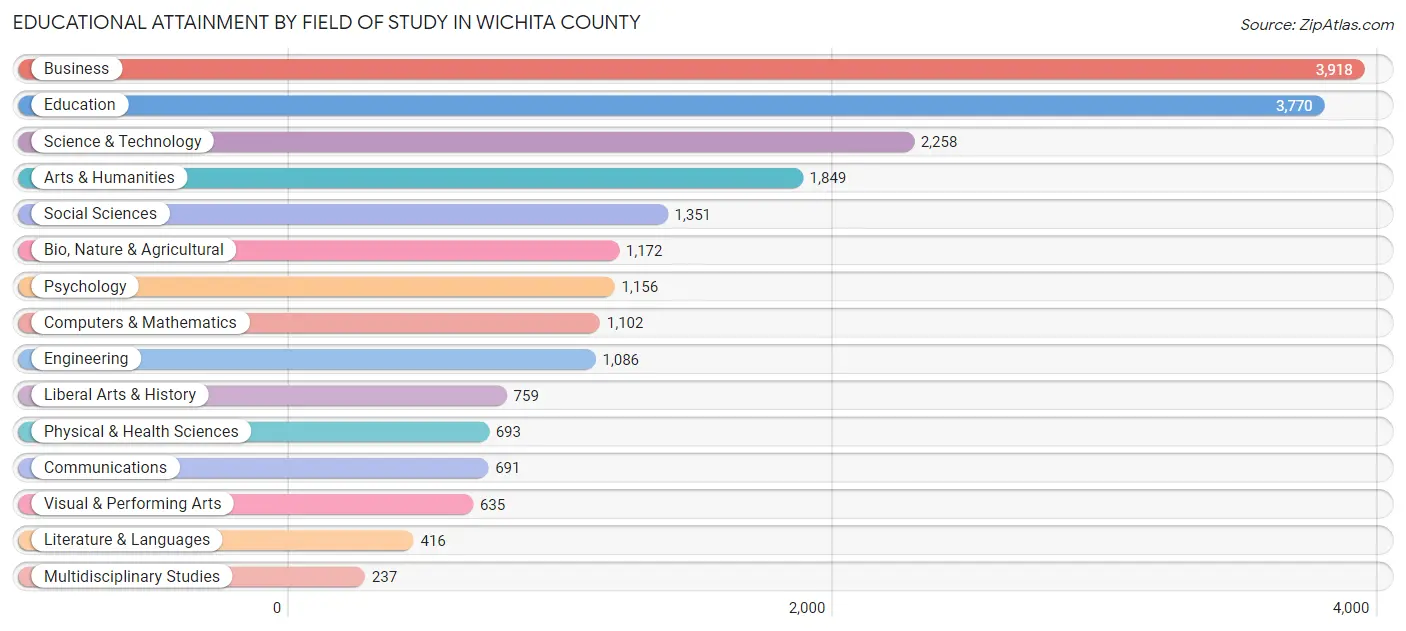
| Field of Study | # Graduates | % Graduates |
| Computers & Mathematics | 1,102 | 5.2% |
| Bio, Nature & Agricultural | 1,172 | 5.6% |
| Physical & Health Sciences | 693 | 3.3% |
| Psychology | 1,156 | 5.5% |
| Social Sciences | 1,351 | 6.4% |
| Engineering | 1,086 | 5.1% |
| Multidisciplinary Studies | 237 | 1.1% |
| Science & Technology | 2,258 | 10.7% |
| Business | 3,918 | 18.6% |
| Education | 3,770 | 17.9% |
| Literature & Languages | 416 | 2.0% |
| Liberal Arts & History | 759 | 3.6% |
| Visual & Performing Arts | 635 | 3.0% |
| Communications | 691 | 3.3% |
| Arts & Humanities | 1,849 | 8.8% |
| Total | 21,093 | 100.0% |
Transportation & Commute in Wichita County
Vehicle Availability by Sex in Wichita County
The most prevalent vehicle ownership categories in Wichita County are males with 2 vehicles (13,127, accounting for 43.8%) and females with 2 vehicles (11,444, making up 48.4%).
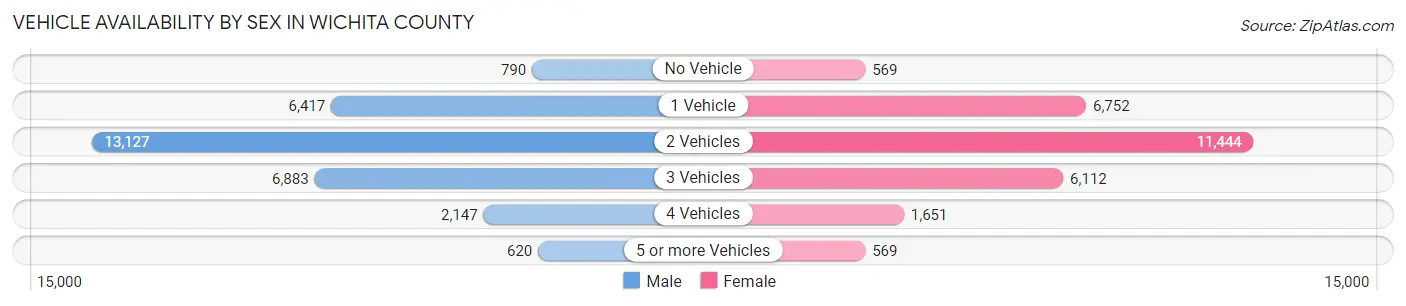
| Vehicles Available | Male | Female |
| No Vehicle | 790 (2.6%) | 569 (2.1%) |
| 1 Vehicle | 6,417 (21.4%) | 6,752 (24.9%) |
| 2 Vehicles | 13,127 (43.8%) | 11,444 (42.2%) |
| 3 Vehicles | 6,883 (23.0%) | 6,112 (22.6%) |
| 4 Vehicles | 2,147 (7.2%) | 1,651 (6.1%) |
| 5 or more Vehicles | 620 (2.1%) | 569 (2.1%) |
| Total | 29,984 (100.0%) | 27,097 (100.0%) |
Commute Time in Wichita County
The most frequently occuring commute durations in Wichita County are 10 to 14 minutes (15,999 commuters, 27.3%), 5 to 9 minutes (12,924 commuters, 22.0%), and 15 to 19 minutes (11,988 commuters, 20.4%).
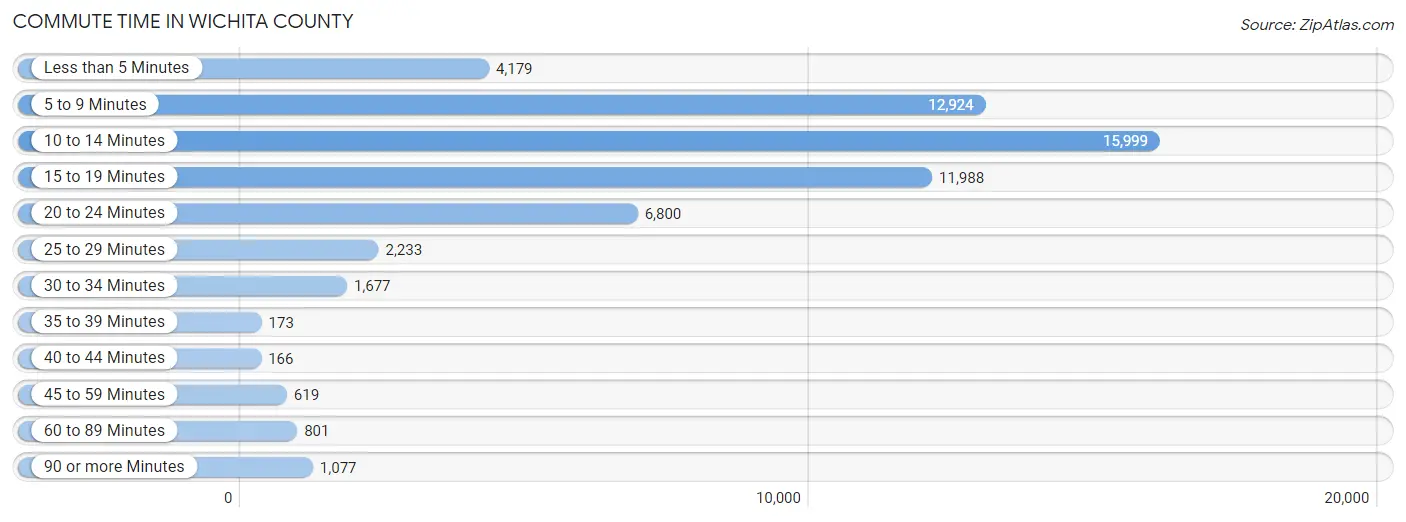
| Commute Time | # Commuters | % Commuters |
| Less than 5 Minutes | 4,179 | 7.1% |
| 5 to 9 Minutes | 12,924 | 22.0% |
| 10 to 14 Minutes | 15,999 | 27.3% |
| 15 to 19 Minutes | 11,988 | 20.4% |
| 20 to 24 Minutes | 6,800 | 11.6% |
| 25 to 29 Minutes | 2,233 | 3.8% |
| 30 to 34 Minutes | 1,677 | 2.9% |
| 35 to 39 Minutes | 173 | 0.3% |
| 40 to 44 Minutes | 166 | 0.3% |
| 45 to 59 Minutes | 619 | 1.1% |
| 60 to 89 Minutes | 801 | 1.4% |
| 90 or more Minutes | 1,077 | 1.8% |
Commute Time by Sex in Wichita County
The most common commute times in Wichita County are 10 to 14 minutes (8,950 commuters, 27.8%) for males and 10 to 14 minutes (7,049 commuters, 26.7%) for females.
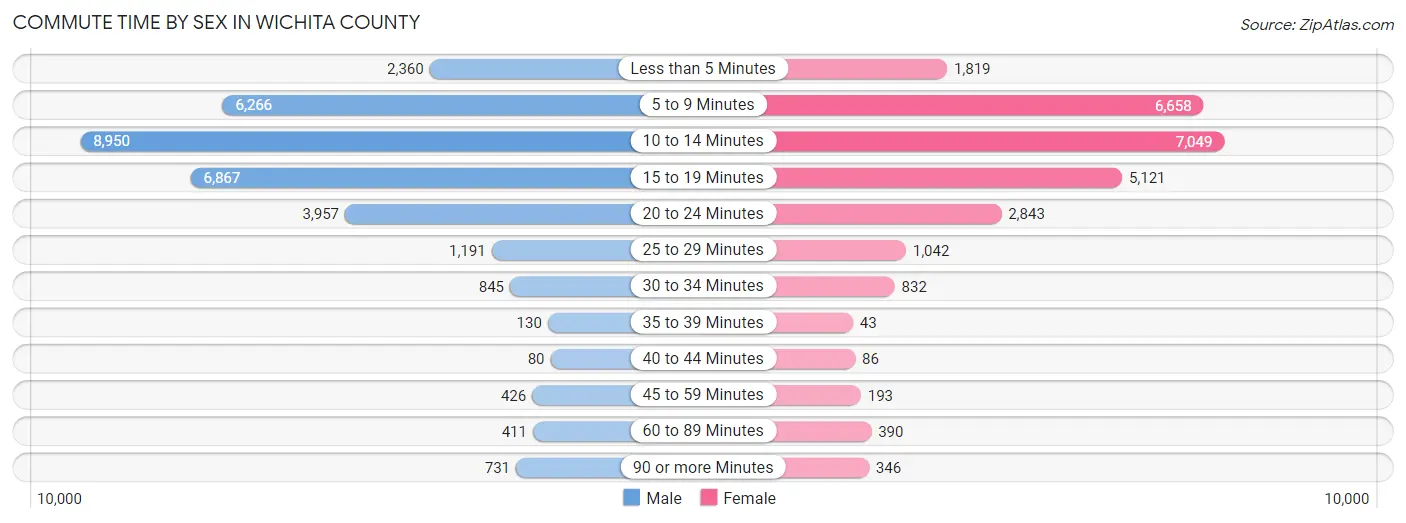
| Commute Time | Male | Female |
| Less than 5 Minutes | 2,360 (7.3%) | 1,819 (6.9%) |
| 5 to 9 Minutes | 6,266 (19.5%) | 6,658 (25.2%) |
| 10 to 14 Minutes | 8,950 (27.8%) | 7,049 (26.7%) |
| 15 to 19 Minutes | 6,867 (21.3%) | 5,121 (19.4%) |
| 20 to 24 Minutes | 3,957 (12.3%) | 2,843 (10.8%) |
| 25 to 29 Minutes | 1,191 (3.7%) | 1,042 (3.9%) |
| 30 to 34 Minutes | 845 (2.6%) | 832 (3.2%) |
| 35 to 39 Minutes | 130 (0.4%) | 43 (0.2%) |
| 40 to 44 Minutes | 80 (0.3%) | 86 (0.3%) |
| 45 to 59 Minutes | 426 (1.3%) | 193 (0.7%) |
| 60 to 89 Minutes | 411 (1.3%) | 390 (1.5%) |
| 90 or more Minutes | 731 (2.3%) | 346 (1.3%) |
Time of Departure to Work by Sex in Wichita County
The most frequent times of departure to work in Wichita County are 6:30 AM to 6:59 AM (5,088, 15.8%) for males and 7:30 AM to 7:59 AM (3,939, 14.9%) for females.
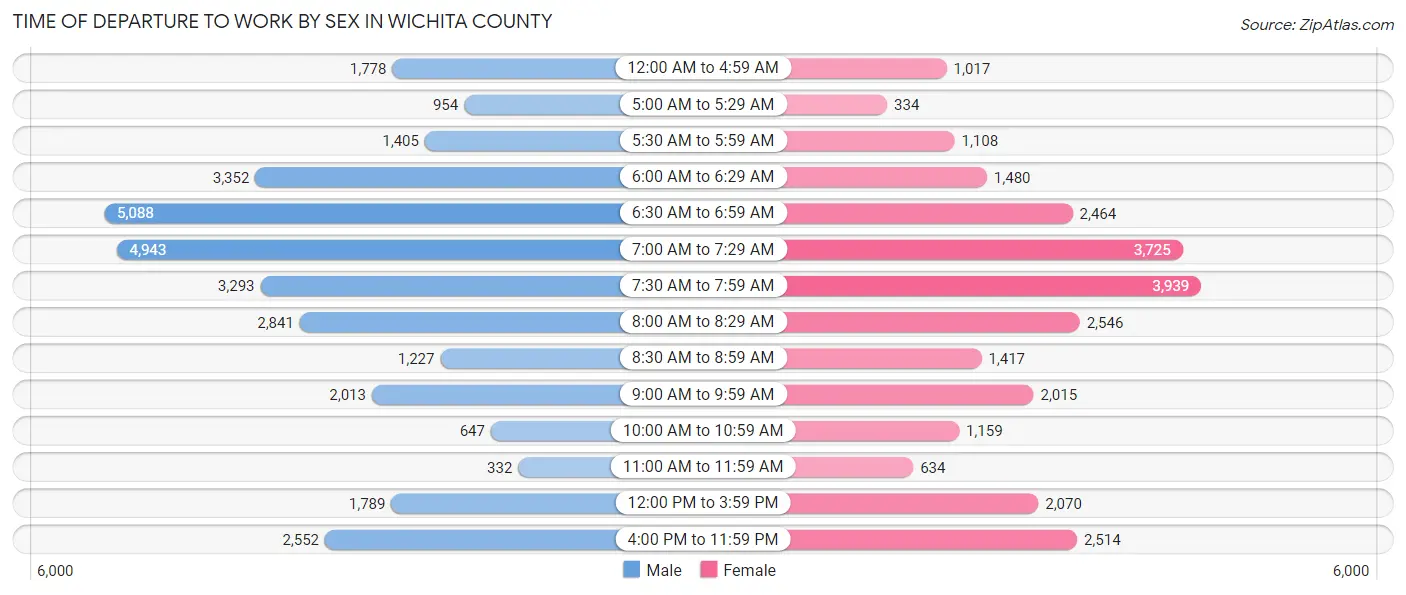
| Time of Departure | Male | Female |
| 12:00 AM to 4:59 AM | 1,778 (5.5%) | 1,017 (3.8%) |
| 5:00 AM to 5:29 AM | 954 (3.0%) | 334 (1.3%) |
| 5:30 AM to 5:59 AM | 1,405 (4.4%) | 1,108 (4.2%) |
| 6:00 AM to 6:29 AM | 3,352 (10.4%) | 1,480 (5.6%) |
| 6:30 AM to 6:59 AM | 5,088 (15.8%) | 2,464 (9.3%) |
| 7:00 AM to 7:29 AM | 4,943 (15.3%) | 3,725 (14.1%) |
| 7:30 AM to 7:59 AM | 3,293 (10.2%) | 3,939 (14.9%) |
| 8:00 AM to 8:29 AM | 2,841 (8.8%) | 2,546 (9.6%) |
| 8:30 AM to 8:59 AM | 1,227 (3.8%) | 1,417 (5.4%) |
| 9:00 AM to 9:59 AM | 2,013 (6.2%) | 2,015 (7.6%) |
| 10:00 AM to 10:59 AM | 647 (2.0%) | 1,159 (4.4%) |
| 11:00 AM to 11:59 AM | 332 (1.0%) | 634 (2.4%) |
| 12:00 PM to 3:59 PM | 1,789 (5.6%) | 2,070 (7.8%) |
| 4:00 PM to 11:59 PM | 2,552 (7.9%) | 2,514 (9.5%) |
| Total | 32,214 (100.0%) | 26,422 (100.0%) |
Housing Occupancy in Wichita County
Occupancy by Ownership in Wichita County
Of the total 48,604 dwellings in Wichita County, owner-occupied units account for 29,453 (60.6%), while renter-occupied units make up 19,151 (39.4%).
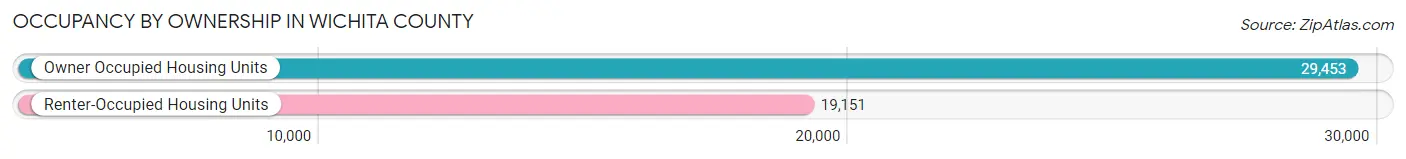
| Occupancy | # Housing Units | % Housing Units |
| Owner Occupied Housing Units | 29,453 | 60.6% |
| Renter-Occupied Housing Units | 19,151 | 39.4% |
| Total Occupied Housing Units | 48,604 | 100.0% |
Occupancy by Household Size in Wichita County
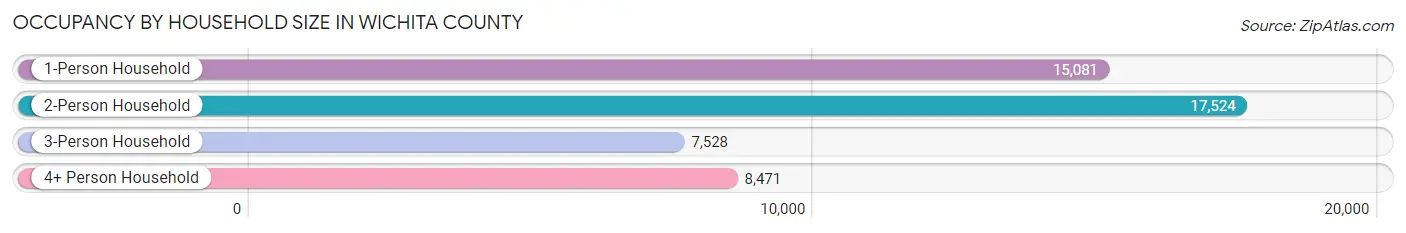
| Household Size | # Housing Units | % Housing Units |
| 1-Person Household | 15,081 | 31.0% |
| 2-Person Household | 17,524 | 36.0% |
| 3-Person Household | 7,528 | 15.5% |
| 4+ Person Household | 8,471 | 17.4% |
| Total Housing Units | 48,604 | 100.0% |
Occupancy by Ownership by Household Size in Wichita County
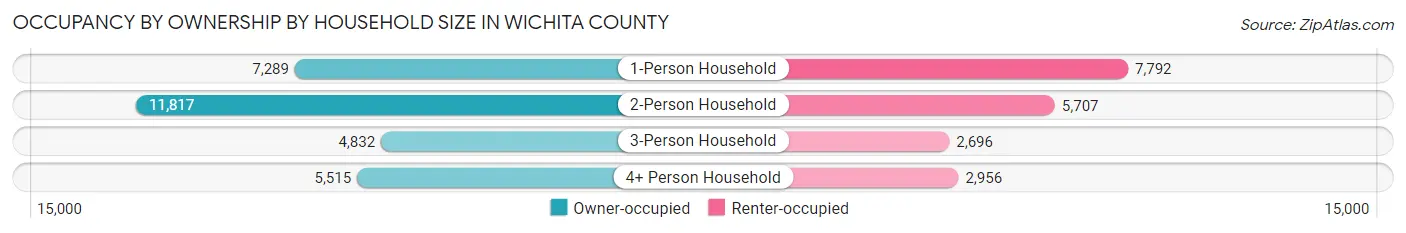
| Household Size | Owner-occupied | Renter-occupied |
| 1-Person Household | 7,289 (48.3%) | 7,792 (51.7%) |
| 2-Person Household | 11,817 (67.4%) | 5,707 (32.6%) |
| 3-Person Household | 4,832 (64.2%) | 2,696 (35.8%) |
| 4+ Person Household | 5,515 (65.1%) | 2,956 (34.9%) |
| Total Housing Units | 29,453 (60.6%) | 19,151 (39.4%) |
Occupancy by Educational Attainment in Wichita County
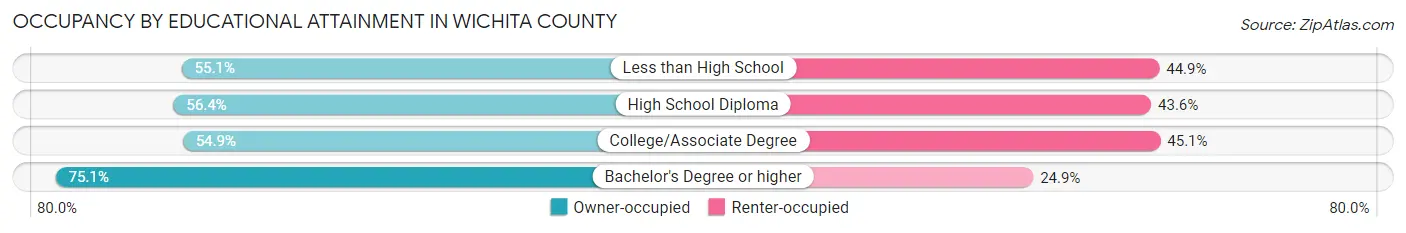
| Household Size | Owner-occupied | Renter-occupied |
| Less than High School | 2,661 (55.1%) | 2,169 (44.9%) |
| High School Diploma | 7,806 (56.4%) | 6,038 (43.6%) |
| College/Associate Degree | 9,496 (54.9%) | 7,795 (45.1%) |
| Bachelor's Degree or higher | 9,490 (75.1%) | 3,149 (24.9%) |
Occupancy by Age of Householder in Wichita County
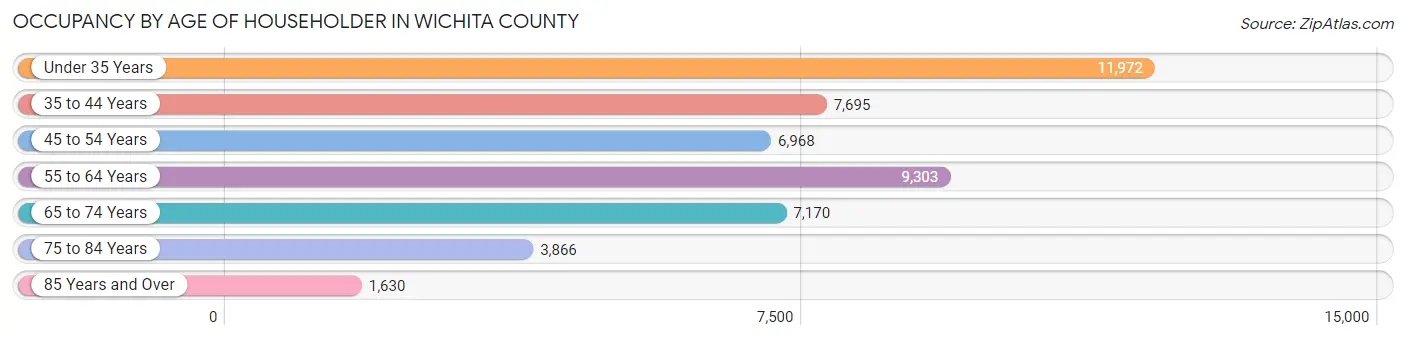
| Age Bracket | # Households | % Households |
| Under 35 Years | 11,972 | 24.6% |
| 35 to 44 Years | 7,695 | 15.8% |
| 45 to 54 Years | 6,968 | 14.3% |
| 55 to 64 Years | 9,303 | 19.1% |
| 65 to 74 Years | 7,170 | 14.7% |
| 75 to 84 Years | 3,866 | 8.0% |
| 85 Years and Over | 1,630 | 3.4% |
| Total | 48,604 | 100.0% |
Housing Finances in Wichita County
Median Income by Occupancy in Wichita County
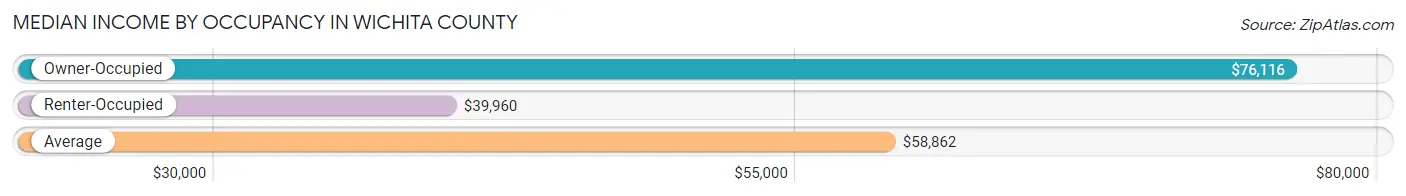
| Occupancy Type | # Households | Median Income |
| Owner-Occupied | 29,453 (60.6%) | $76,116 |
| Renter-Occupied | 19,151 (39.4%) | $39,960 |
| Average | 48,604 (100.0%) | $58,862 |
Occupancy by Householder Income Bracket in Wichita County
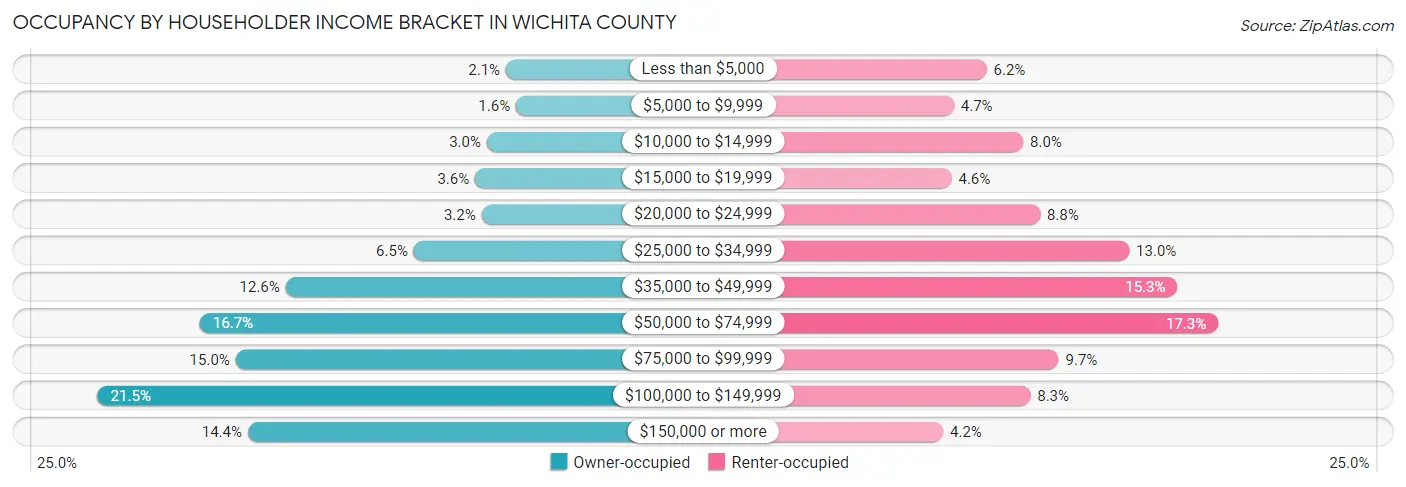
| Income Bracket | Owner-occupied | Renter-occupied |
| Less than $5,000 | 614 (2.1%) | 1,195 (6.2%) |
| $5,000 to $9,999 | 472 (1.6%) | 896 (4.7%) |
| $10,000 to $14,999 | 882 (3.0%) | 1,528 (8.0%) |
| $15,000 to $19,999 | 1,047 (3.5%) | 875 (4.6%) |
| $20,000 to $24,999 | 955 (3.2%) | 1,681 (8.8%) |
| $25,000 to $34,999 | 1,905 (6.5%) | 2,495 (13.0%) |
| $35,000 to $49,999 | 3,701 (12.6%) | 2,933 (15.3%) |
| $50,000 to $74,999 | 4,904 (16.7%) | 3,305 (17.3%) |
| $75,000 to $99,999 | 4,402 (14.9%) | 1,851 (9.7%) |
| $100,000 to $149,999 | 6,339 (21.5%) | 1,594 (8.3%) |
| $150,000 or more | 4,232 (14.4%) | 798 (4.2%) |
| Total | 29,453 (100.0%) | 19,151 (100.0%) |
Monthly Housing Cost Tiers in Wichita County
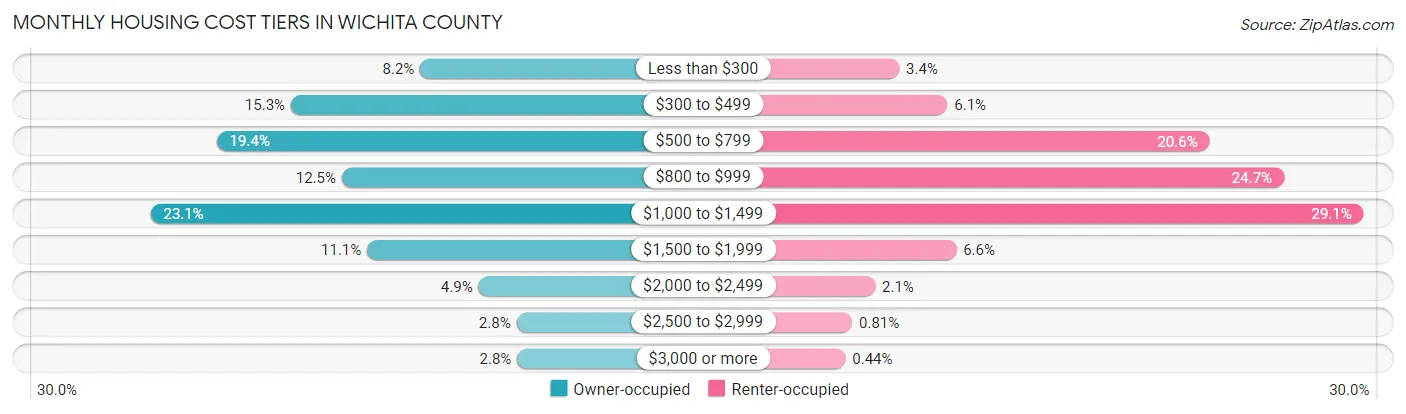
| Monthly Cost | Owner-occupied | Renter-occupied |
| Less than $300 | 2,400 (8.2%) | 654 (3.4%) |
| $300 to $499 | 4,504 (15.3%) | 1,163 (6.1%) |
| $500 to $799 | 5,714 (19.4%) | 3,936 (20.5%) |
| $800 to $999 | 3,677 (12.5%) | 4,723 (24.7%) |
| $1,000 to $1,499 | 6,788 (23.1%) | 5,565 (29.1%) |
| $1,500 to $1,999 | 3,263 (11.1%) | 1,256 (6.6%) |
| $2,000 to $2,499 | 1,451 (4.9%) | 399 (2.1%) |
| $2,500 to $2,999 | 833 (2.8%) | 156 (0.8%) |
| $3,000 or more | 823 (2.8%) | 85 (0.4%) |
| Total | 29,453 (100.0%) | 19,151 (100.0%) |
Physical Housing Characteristics in Wichita County
Housing Structures in Wichita County
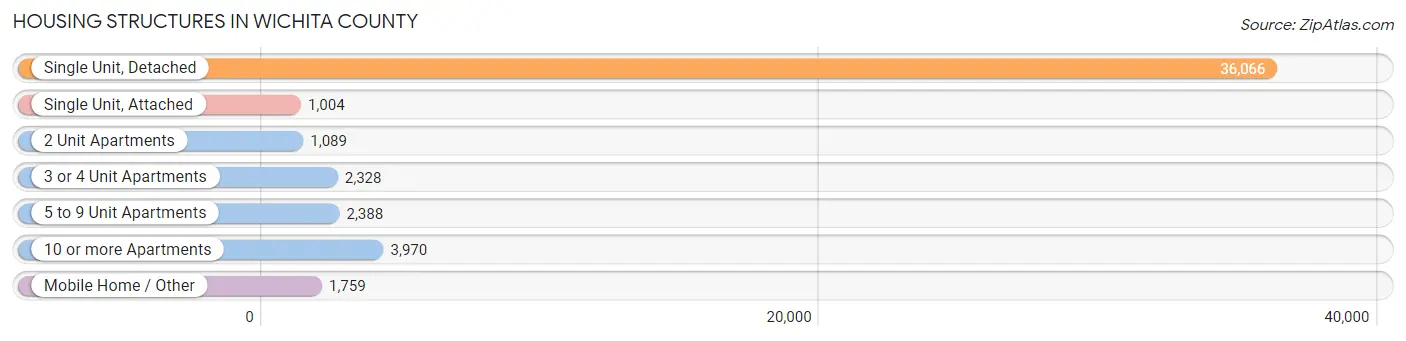
| Structure Type | # Housing Units | % Housing Units |
| Single Unit, Detached | 36,066 | 74.2% |
| Single Unit, Attached | 1,004 | 2.1% |
| 2 Unit Apartments | 1,089 | 2.2% |
| 3 or 4 Unit Apartments | 2,328 | 4.8% |
| 5 to 9 Unit Apartments | 2,388 | 4.9% |
| 10 or more Apartments | 3,970 | 8.2% |
| Mobile Home / Other | 1,759 | 3.6% |
| Total | 48,604 | 100.0% |
Housing Structures by Occupancy in Wichita County
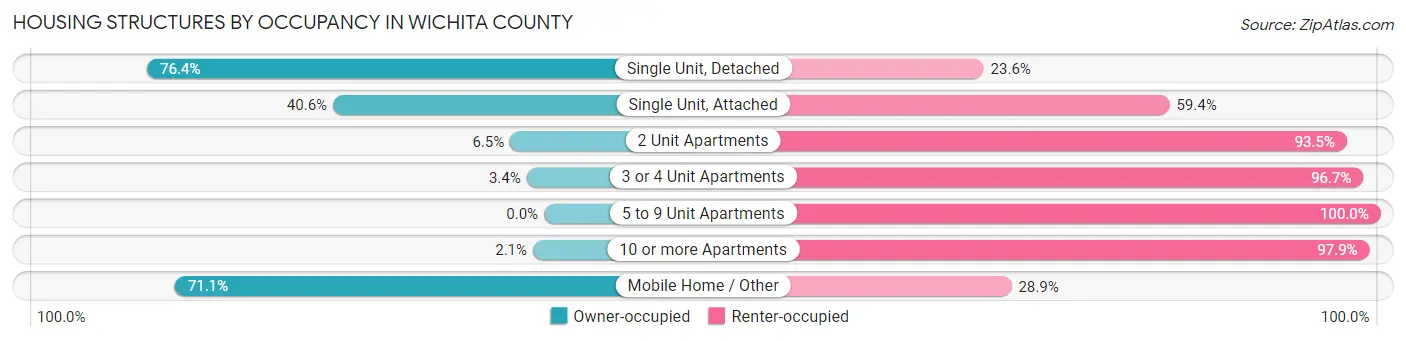
| Structure Type | Owner-occupied | Renter-occupied |
| Single Unit, Detached | 27,561 (76.4%) | 8,505 (23.6%) |
| Single Unit, Attached | 408 (40.6%) | 596 (59.4%) |
| 2 Unit Apartments | 71 (6.5%) | 1,018 (93.5%) |
| 3 or 4 Unit Apartments | 78 (3.4%) | 2,250 (96.7%) |
| 5 to 9 Unit Apartments | 0 (0.0%) | 2,388 (100.0%) |
| 10 or more Apartments | 85 (2.1%) | 3,885 (97.9%) |
| Mobile Home / Other | 1,250 (71.1%) | 509 (28.9%) |
| Total | 29,453 (60.6%) | 19,151 (39.4%) |
Housing Structures by Number of Rooms in Wichita County
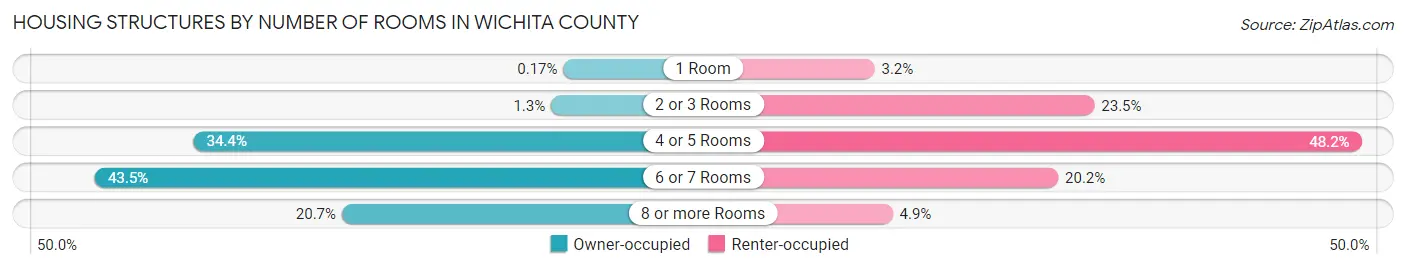
| Number of Rooms | Owner-occupied | Renter-occupied |
| 1 Room | 50 (0.2%) | 613 (3.2%) |
| 2 or 3 Rooms | 385 (1.3%) | 4,506 (23.5%) |
| 4 or 5 Rooms | 10,124 (34.4%) | 9,236 (48.2%) |
| 6 or 7 Rooms | 12,809 (43.5%) | 3,864 (20.2%) |
| 8 or more Rooms | 6,085 (20.7%) | 932 (4.9%) |
| Total | 29,453 (100.0%) | 19,151 (100.0%) |
Housing Structure by Heating Type in Wichita County
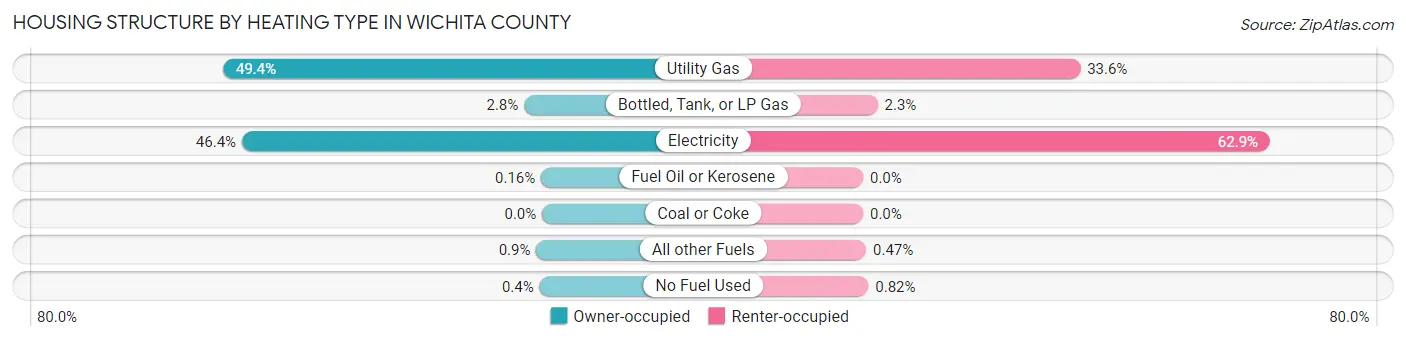
| Heating Type | Owner-occupied | Renter-occupied |
| Utility Gas | 14,538 (49.4%) | 6,429 (33.6%) |
| Bottled, Tank, or LP Gas | 818 (2.8%) | 431 (2.2%) |
| Electricity | 13,668 (46.4%) | 12,044 (62.9%) |
| Fuel Oil or Kerosene | 46 (0.2%) | 0 (0.0%) |
| Coal or Coke | 0 (0.0%) | 0 (0.0%) |
| All other Fuels | 265 (0.9%) | 90 (0.5%) |
| No Fuel Used | 118 (0.4%) | 157 (0.8%) |
| Total | 29,453 (100.0%) | 19,151 (100.0%) |
Household Vehicle Usage in Wichita County
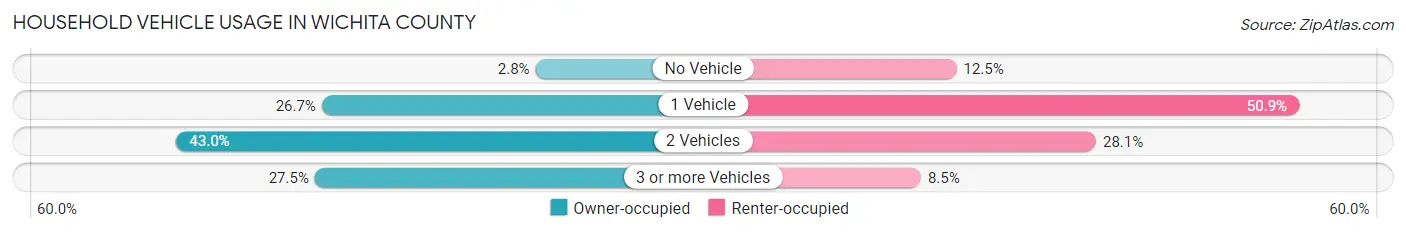
| Vehicles per Household | Owner-occupied | Renter-occupied |
| No Vehicle | 820 (2.8%) | 2,393 (12.5%) |
| 1 Vehicle | 7,869 (26.7%) | 9,738 (50.8%) |
| 2 Vehicles | 12,663 (43.0%) | 5,388 (28.1%) |
| 3 or more Vehicles | 8,101 (27.5%) | 1,632 (8.5%) |
| Total | 29,453 (100.0%) | 19,151 (100.0%) |
Real Estate & Mortgages in Wichita County
Real Estate and Mortgage Overview in Wichita County
| Characteristic | Without Mortgage | With Mortgage |
| Housing Units | 14,686 | 14,767 |
| Median Property Value | $103,600 | $145,800 |
| Median Household Income | $59,789 | $2,753 |
| Monthly Housing Costs | $535 | $782 |
| Real Estate Taxes | $1,857 | $1,549 |
Property Value by Mortgage Status in Wichita County
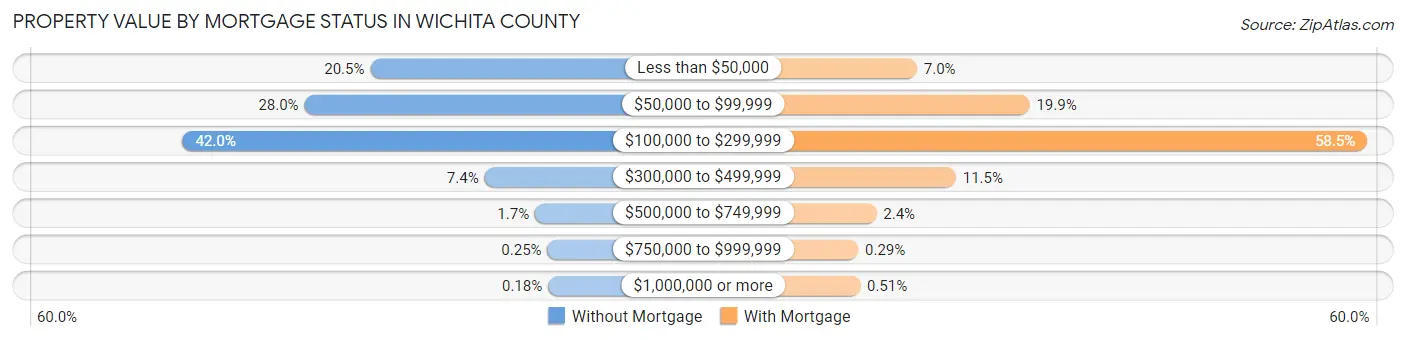
| Property Value | Without Mortgage | With Mortgage |
| Less than $50,000 | 3,009 (20.5%) | 1,035 (7.0%) |
| $50,000 to $99,999 | 4,115 (28.0%) | 2,935 (19.9%) |
| $100,000 to $299,999 | 6,161 (41.9%) | 8,634 (58.5%) |
| $300,000 to $499,999 | 1,093 (7.4%) | 1,692 (11.5%) |
| $500,000 to $749,999 | 245 (1.7%) | 352 (2.4%) |
| $750,000 to $999,999 | 36 (0.3%) | 43 (0.3%) |
| $1,000,000 or more | 27 (0.2%) | 76 (0.5%) |
| Total | 14,686 (100.0%) | 14,767 (100.0%) |
Household Income by Mortgage Status in Wichita County
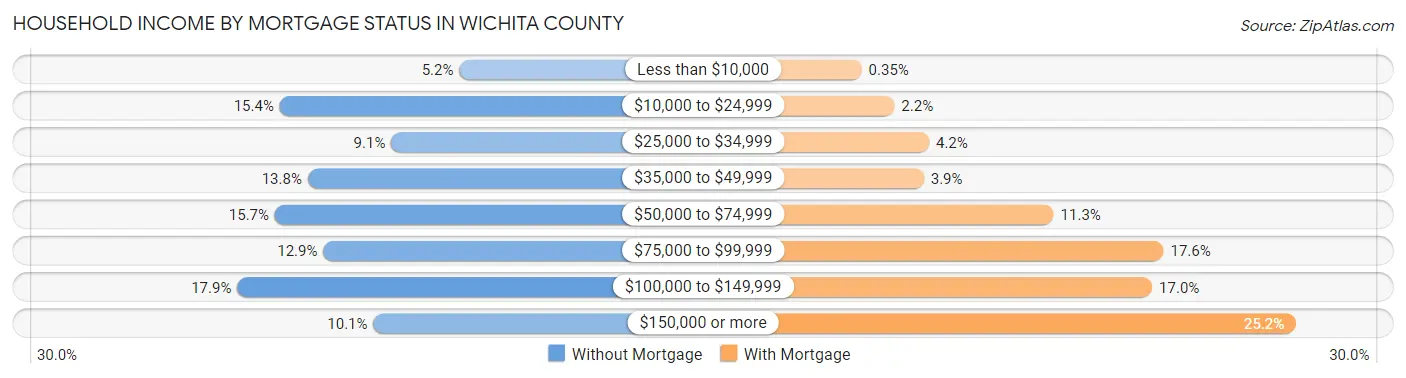
| Household Income | Without Mortgage | With Mortgage |
| Less than $10,000 | 758 (5.2%) | 51 (0.4%) |
| $10,000 to $24,999 | 2,264 (15.4%) | 328 (2.2%) |
| $25,000 to $34,999 | 1,329 (9.0%) | 620 (4.2%) |
| $35,000 to $49,999 | 2,030 (13.8%) | 576 (3.9%) |
| $50,000 to $74,999 | 2,305 (15.7%) | 1,671 (11.3%) |
| $75,000 to $99,999 | 1,899 (12.9%) | 2,599 (17.6%) |
| $100,000 to $149,999 | 2,622 (17.8%) | 2,503 (17.0%) |
| $150,000 or more | 1,479 (10.1%) | 3,717 (25.2%) |
| Total | 14,686 (100.0%) | 14,767 (100.0%) |
Property Value to Household Income Ratio in Wichita County
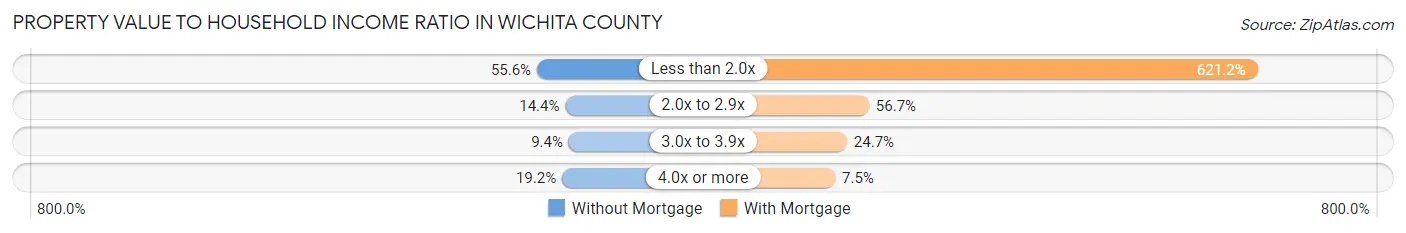
| Value-to-Income Ratio | Without Mortgage | With Mortgage |
| Less than 2.0x | 8,171 (55.6%) | 91,730 (621.2%) |
| 2.0x to 2.9x | 2,121 (14.4%) | 8,367 (56.7%) |
| 3.0x to 3.9x | 1,375 (9.4%) | 3,643 (24.7%) |
| 4.0x or more | 2,824 (19.2%) | 1,114 (7.5%) |
| Total | 14,686 (100.0%) | 14,767 (100.0%) |
Real Estate Taxes by Mortgage Status in Wichita County
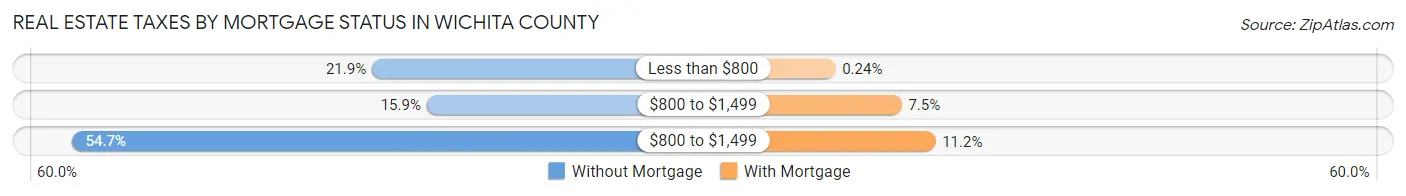
| Property Taxes | Without Mortgage | With Mortgage |
| Less than $800 | 3,221 (21.9%) | 35 (0.2%) |
| $800 to $1,499 | 2,340 (15.9%) | 1,108 (7.5%) |
| $800 to $1,499 | 8,038 (54.7%) | 1,654 (11.2%) |
| Total | 14,686 (100.0%) | 14,767 (100.0%) |
Health & Disability in Wichita County
Health Insurance Coverage by Age in Wichita County
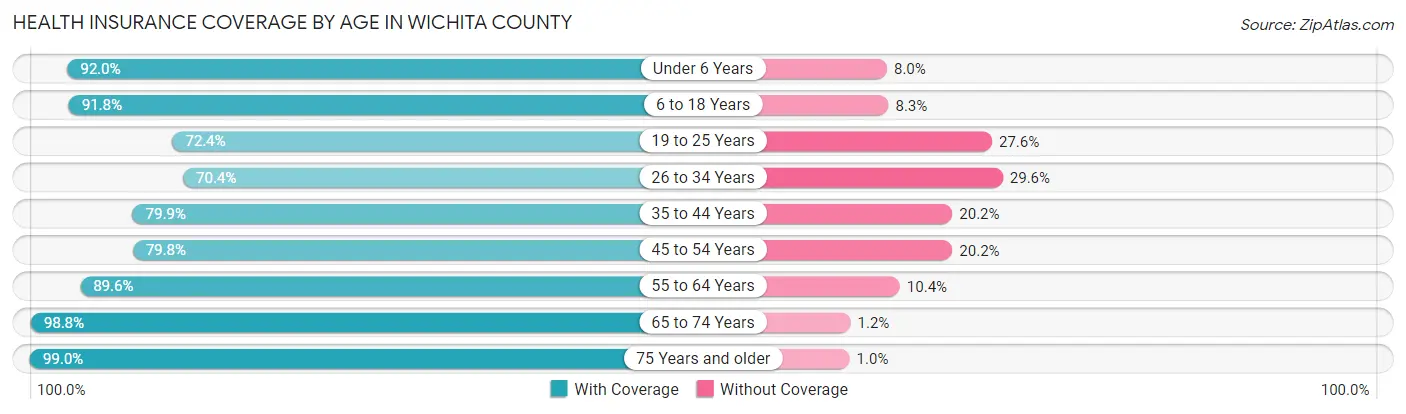
| Age Bracket | With Coverage | Without Coverage |
| Under 6 Years | 8,643 (92.0%) | 748 (8.0%) |
| 6 to 18 Years | 19,840 (91.7%) | 1,783 (8.3%) |
| 19 to 25 Years | 8,796 (72.4%) | 3,346 (27.6%) |
| 26 to 34 Years | 10,015 (70.4%) | 4,205 (29.6%) |
| 35 to 44 Years | 11,176 (79.8%) | 2,821 (20.2%) |
| 45 to 54 Years | 10,104 (79.8%) | 2,552 (20.2%) |
| 55 to 64 Years | 13,421 (89.6%) | 1,553 (10.4%) |
| 65 to 74 Years | 10,710 (98.8%) | 127 (1.2%) |
| 75 Years and older | 7,443 (99.0%) | 75 (1.0%) |
| Total | 100,148 (85.3%) | 17,210 (14.7%) |
Health Insurance Coverage by Citizenship Status in Wichita County
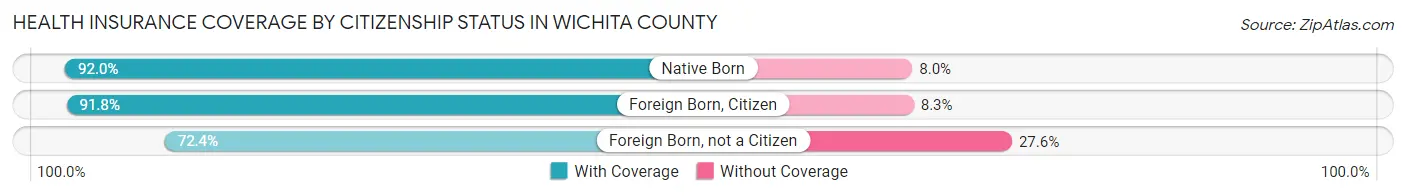
| Citizenship Status | With Coverage | Without Coverage |
| Native Born | 8,643 (92.0%) | 748 (8.0%) |
| Foreign Born, Citizen | 19,840 (91.7%) | 1,783 (8.3%) |
| Foreign Born, not a Citizen | 8,796 (72.4%) | 3,346 (27.6%) |
Health Insurance Coverage by Household Income in Wichita County
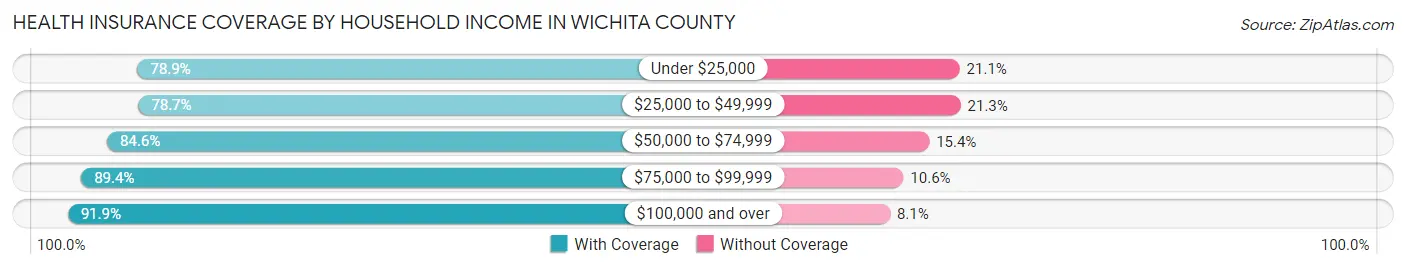
| Household Income | With Coverage | Without Coverage |
| Under $25,000 | 13,890 (78.9%) | 3,723 (21.1%) |
| $25,000 to $49,999 | 18,759 (78.7%) | 5,083 (21.3%) |
| $50,000 to $74,999 | 16,376 (84.6%) | 2,991 (15.4%) |
| $75,000 to $99,999 | 14,926 (89.4%) | 1,771 (10.6%) |
| $100,000 and over | 35,109 (91.9%) | 3,092 (8.1%) |
Public vs Private Health Insurance Coverage by Age in Wichita County
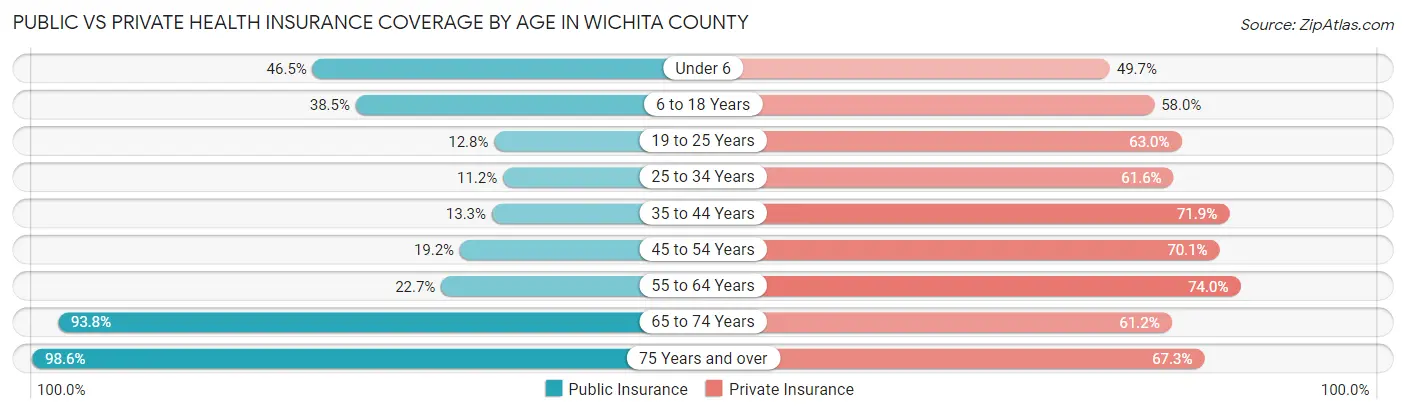
| Age Bracket | Public Insurance | Private Insurance |
| Under 6 | 4,370 (46.5%) | 4,671 (49.7%) |
| 6 to 18 Years | 8,332 (38.5%) | 12,540 (58.0%) |
| 19 to 25 Years | 1,556 (12.8%) | 7,651 (63.0%) |
| 25 to 34 Years | 1,592 (11.2%) | 8,753 (61.6%) |
| 35 to 44 Years | 1,857 (13.3%) | 10,058 (71.9%) |
| 45 to 54 Years | 2,429 (19.2%) | 8,871 (70.1%) |
| 55 to 64 Years | 3,394 (22.7%) | 11,074 (74.0%) |
| 65 to 74 Years | 10,168 (93.8%) | 6,632 (61.2%) |
| 75 Years and over | 7,412 (98.6%) | 5,057 (67.3%) |
| Total | 41,110 (35.0%) | 75,307 (64.2%) |
Disability Status by Sex by Age in Wichita County
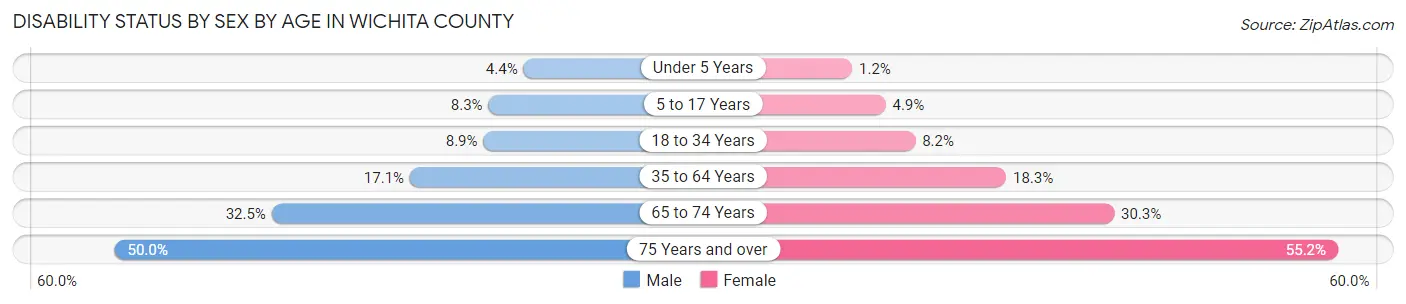
| Age Bracket | Male | Female |
| Under 5 Years | 183 (4.4%) | 44 (1.1%) |
| 5 to 17 Years | 900 (8.3%) | 507 (4.9%) |
| 18 to 34 Years | 1,211 (8.9%) | 1,195 (8.2%) |
| 35 to 64 Years | 3,456 (17.1%) | 3,914 (18.3%) |
| 65 to 74 Years | 1,684 (32.5%) | 1,714 (30.3%) |
| 75 Years and over | 1,494 (50.0%) | 2,502 (55.2%) |
Disability Class by Sex by Age in Wichita County
Disability Class: Hearing Difficulty
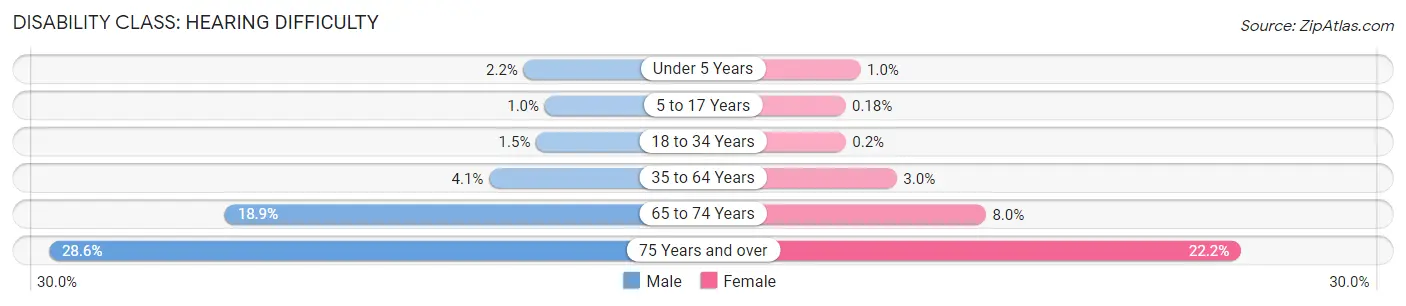
| Age Bracket | Male | Female |
| Under 5 Years | 91 (2.2%) | 39 (1.0%) |
| 5 to 17 Years | 111 (1.0%) | 19 (0.2%) |
| 18 to 34 Years | 205 (1.5%) | 29 (0.2%) |
| 35 to 64 Years | 836 (4.1%) | 651 (3.0%) |
| 65 to 74 Years | 977 (18.9%) | 452 (8.0%) |
| 75 Years and over | 856 (28.6%) | 1,007 (22.2%) |
Disability Class: Vision Difficulty
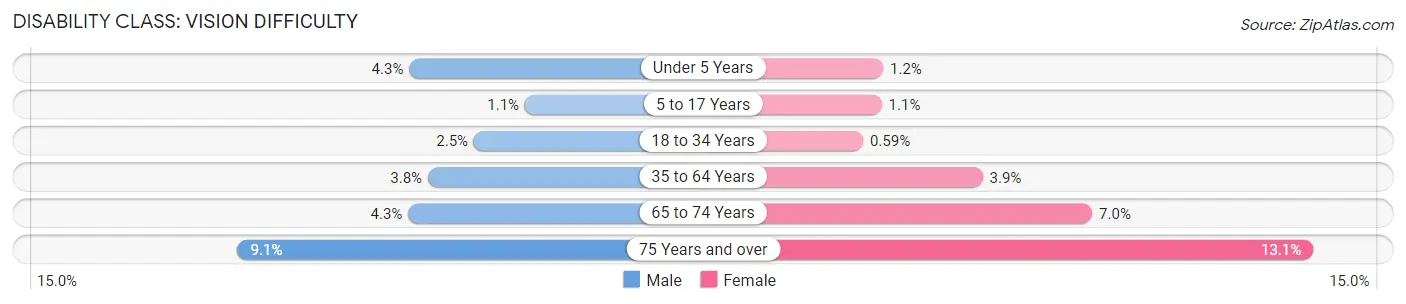
| Age Bracket | Male | Female |
| Under 5 Years | 177 (4.3%) | 44 (1.1%) |
| 5 to 17 Years | 115 (1.1%) | 116 (1.1%) |
| 18 to 34 Years | 339 (2.5%) | 86 (0.6%) |
| 35 to 64 Years | 762 (3.8%) | 840 (3.9%) |
| 65 to 74 Years | 224 (4.3%) | 394 (7.0%) |
| 75 Years and over | 271 (9.1%) | 594 (13.1%) |
Disability Class: Cognitive Difficulty
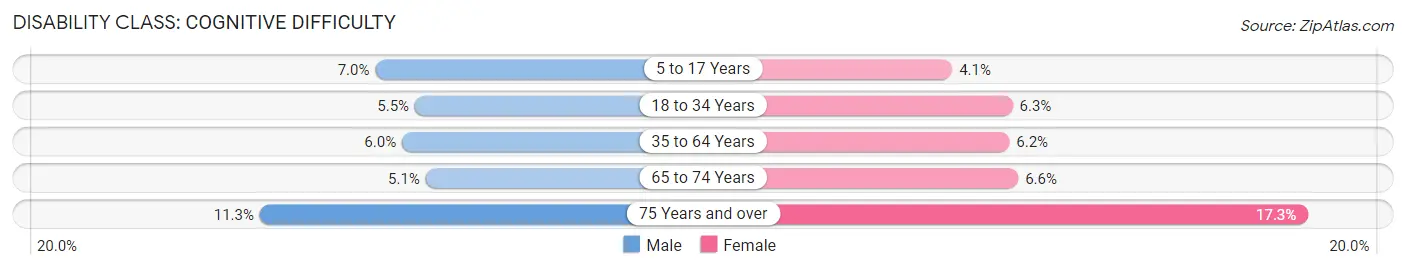
| Age Bracket | Male | Female |
| 5 to 17 Years | 754 (7.0%) | 427 (4.1%) |
| 18 to 34 Years | 749 (5.5%) | 926 (6.3%) |
| 35 to 64 Years | 1,212 (6.0%) | 1,331 (6.2%) |
| 65 to 74 Years | 265 (5.1%) | 370 (6.6%) |
| 75 Years and over | 337 (11.3%) | 784 (17.3%) |
Disability Class: Ambulatory Difficulty
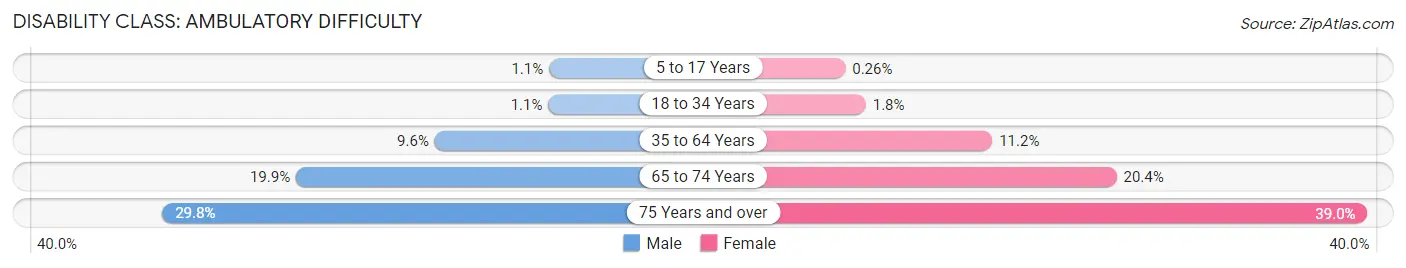
| Age Bracket | Male | Female |
| 5 to 17 Years | 114 (1.1%) | 27 (0.3%) |
| 18 to 34 Years | 152 (1.1%) | 260 (1.8%) |
| 35 to 64 Years | 1,931 (9.6%) | 2,391 (11.2%) |
| 65 to 74 Years | 1,029 (19.9%) | 1,153 (20.4%) |
| 75 Years and over | 890 (29.8%) | 1,767 (39.0%) |
Disability Class: Self-Care Difficulty
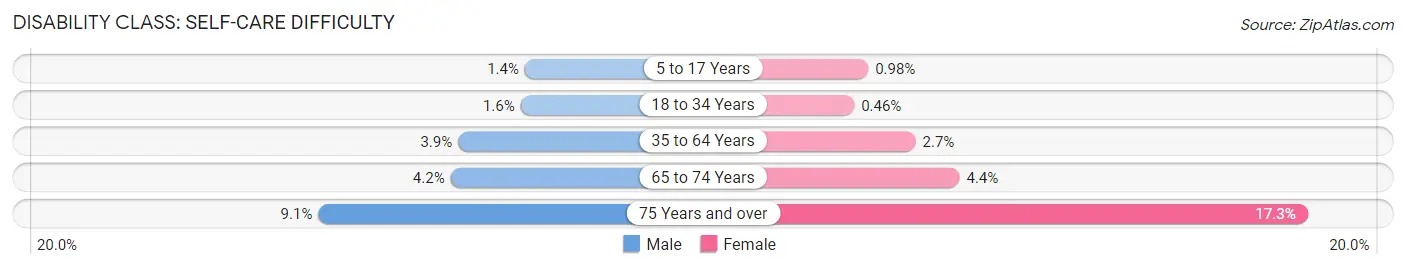
| Age Bracket | Male | Female |
| 5 to 17 Years | 154 (1.4%) | 102 (1.0%) |
| 18 to 34 Years | 216 (1.6%) | 67 (0.5%) |
| 35 to 64 Years | 790 (3.9%) | 586 (2.7%) |
| 65 to 74 Years | 217 (4.2%) | 247 (4.4%) |
| 75 Years and over | 272 (9.1%) | 783 (17.3%) |
Technology Access in Wichita County
Computing Device Access in Wichita County
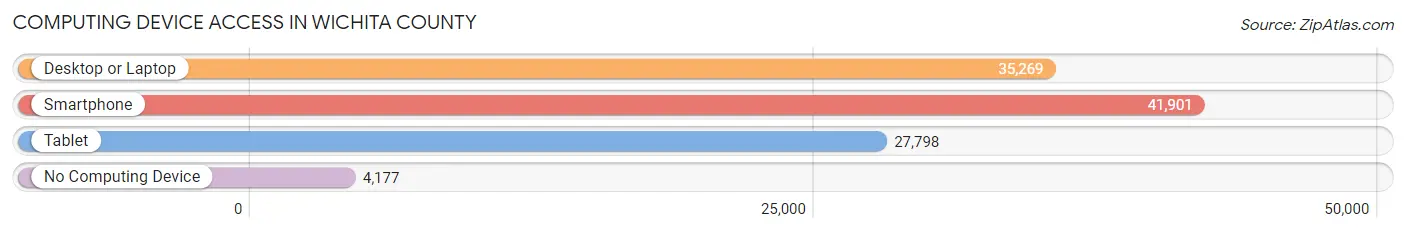
| Device Type | # Households | % Households |
| Desktop or Laptop | 35,269 | 72.6% |
| Smartphone | 41,901 | 86.2% |
| Tablet | 27,798 | 57.2% |
| No Computing Device | 4,177 | 8.6% |
| Total | 48,604 | 100.0% |
Internet Access in Wichita County
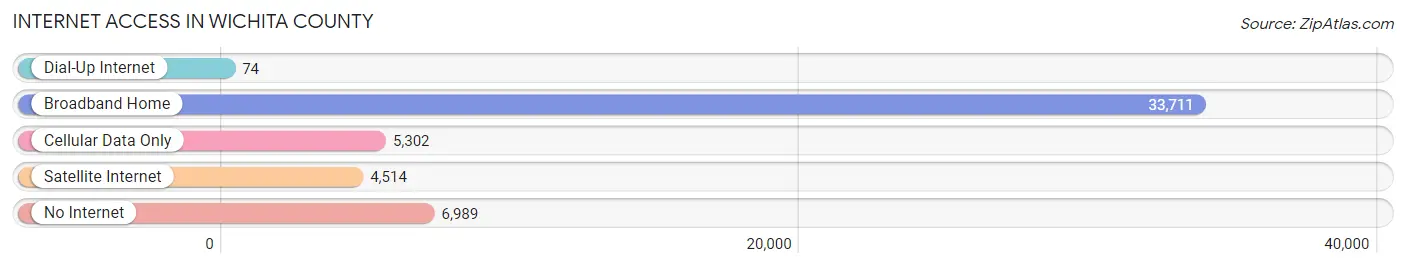
| Internet Type | # Households | % Households |
| Dial-Up Internet | 74 | 0.2% |
| Broadband Home | 33,711 | 69.4% |
| Cellular Data Only | 5,302 | 10.9% |
| Satellite Internet | 4,514 | 9.3% |
| No Internet | 6,989 | 14.4% |
| Total | 48,604 | 100.0% |
Wichita County Summary
Wichita County is located in the northern part of Texas, in the United States. It is part of the Wichita Falls Metropolitan Statistical Area and is bordered by Archer, Clay, Wilbarger, and Baylor counties. Wichita County is home to the cities of Wichita Falls, Burkburnett, Iowa Park, and Electra. The county seat is Wichita Falls.
History
Wichita County was established in 1858 and was named after the Wichita Native American tribe. The county was originally part of Fannin County, but was later divided into its own county. The first settlers in the area were ranchers and farmers, who were attracted to the area due to its fertile soil and abundant water sources.
In the late 19th century, Wichita Falls began to grow as a center for the oil and gas industry. The city was also home to a large military base, Sheppard Air Force Base, which was established in 1941.
Geography
Wichita County is located in the northern part of Texas, in the United States. It is part of the Wichita Falls Metropolitan Statistical Area and is bordered by Archer, Clay, Wilbarger, and Baylor counties. The county covers an area of 902 square miles and has a population of 131,500.
The terrain of Wichita County is mostly flat, with some rolling hills in the western part of the county. The county is home to several rivers, including the Wichita River, the Red River, and the Brazos River. The county also contains several lakes, including Lake Wichita, Lake Kemp, and Lake Arrowhead.
Economy
The economy of Wichita County is largely based on agriculture, oil and gas, and manufacturing. The county is home to several large oil and gas companies, including ConocoPhillips, Chevron, and ExxonMobil. The county is also home to several manufacturing companies, including Cargill, Tyson Foods, and JBS USA.
Agriculture is also an important part of the economy of Wichita County. The county is home to several large farms, which produce a variety of crops, including cotton, corn, wheat, and sorghum.
Demographics
As of the 2010 census, the population of Wichita County was 131,500. The racial makeup of the county was 79.2% White, 11.3% African American, 0.7% Native American, 1.2% Asian, 0.1% Pacific Islander, 5.2% from other races, and 2.4% from two or more races. Hispanic or Latino of any race were 13.2% of the population.
The median household income in Wichita County was $45,845, and the median family income was $54,845. The per capita income was $22,845. About 11.2% of the population was below the poverty line.
Common Questions
What is Per Capita Income in Wichita County?
Per Capita income in Wichita County is $30,834.
What is the Median Family Income in Wichita County?
Median Family Income in Wichita County is $76,888.
What is the Median Household income in Wichita County?
Median Household Income in Wichita County is $58,862.
What is Income or Wage Gap in Wichita County?
Income or Wage Gap in Wichita County is 24.6%.
Women in Wichita County earn 75.4 cents for every dollar earned by a man.
What is Family Income Deficit in Wichita County?
Family Income Deficit in Wichita County is $11,247.
Families that are below poverty line in Wichita County earn $11,247 less on average than the poverty threshold level.
What is Inequality or Gini Index in Wichita County?
Inequality or Gini Index in Wichita County is 0.46.
What is the Total Population of Wichita County?
Total Population of Wichita County is 129,584.
What is the Total Male Population of Wichita County?
Total Male Population of Wichita County is 67,086.
What is the Total Female Population of Wichita County?
Total Female Population of Wichita County is 62,498.
What is the Ratio of Males per 100 Females in Wichita County?
There are 107.34 Males per 100 Females in Wichita County.
What is the Ratio of Females per 100 Males in Wichita County?
There are 93.16 Females per 100 Males in Wichita County.
What is the Median Population Age in Wichita County?
Median Population Age in Wichita County is 34.8 Years.
What is the Average Family Size in Wichita County
Average Family Size in Wichita County is 3.0 People.
What is the Average Household Size in Wichita County
Average Household Size in Wichita County is 2.4 People.
How Large is the Labor Force in Wichita County?
There are 65,794 People in the Labor Forcein in Wichita County.
What is the Percentage of People in the Labor Force in Wichita County?
63.6% of People are in the Labor Force in Wichita County.
What is the Unemployment Rate in Wichita County?
Unemployment Rate in Wichita County is 4.2%.