Wheeler County, TX Map & Demographics
Wheeler County Overview
$30,454
PER CAPITA INCOME
$65,671
AVG FAMILY INCOME
$58,158
AVG HOUSEHOLD INCOME
52.0%
WAGE / INCOME GAP [ % ]
48.0¢/ $1
WAGE / INCOME GAP [ $ ]
0.43
INEQUALITY / GINI INDEX
4,980
TOTAL POPULATION
2,580
MALE POPULATION
2,400
FEMALE POPULATION
107.50
MALES / 100 FEMALES
93.02
FEMALES / 100 MALES
40.0
MEDIAN AGE
3.0
AVG FAMILY SIZE
2.6
AVG HOUSEHOLD SIZE
2,434
LABOR FORCE [ PEOPLE ]
61.9%
PERCENT IN LABOR FORCE
6.6%
UNEMPLOYMENT RATE
Wheeler County Area Codes
Income in Wheeler County
Income Overview in Wheeler County
Per Capita Income in Wheeler County is $30,454, while median incomes of families and households are $65,671 and $58,158 respectively.
| Characteristic | Number | Measure |
| Per Capita Income | 4,980 | $30,454 |
| Median Family Income | 1,435 | $65,671 |
| Mean Family Income | 1,435 | $81,313 |
| Median Household Income | 1,908 | $58,158 |
| Mean Household Income | 1,908 | $75,121 |
| Income Deficit | 1,435 | $0 |
| Wage / Income Gap (%) | 4,980 | 51.99% |
| Wage / Income Gap ($) | 4,980 | 48.01¢ per $1 |
| Gini / Inequality Index | 4,980 | 0.43 |
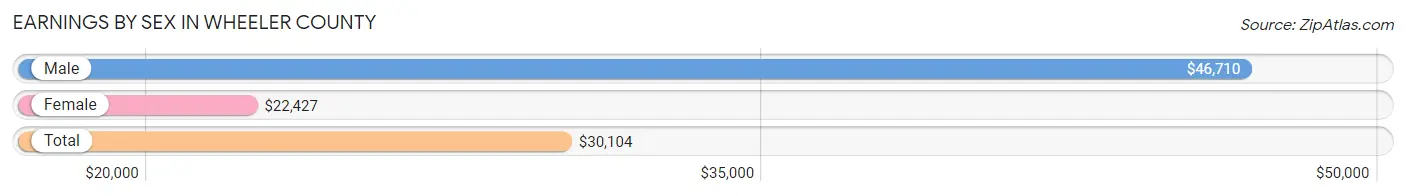
Earnings by Sex in Wheeler County
Average Earnings in Wheeler County are $30,104, $46,710 for men and $22,427 for women, a difference of 52.0%.
| Sex | Number | Average Earnings |
| Male | 1,379 (54.3%) | $46,710 |
| Female | 1,160 (45.7%) | $22,427 |
| Total | 2,539 (100.0%) | $30,104 |
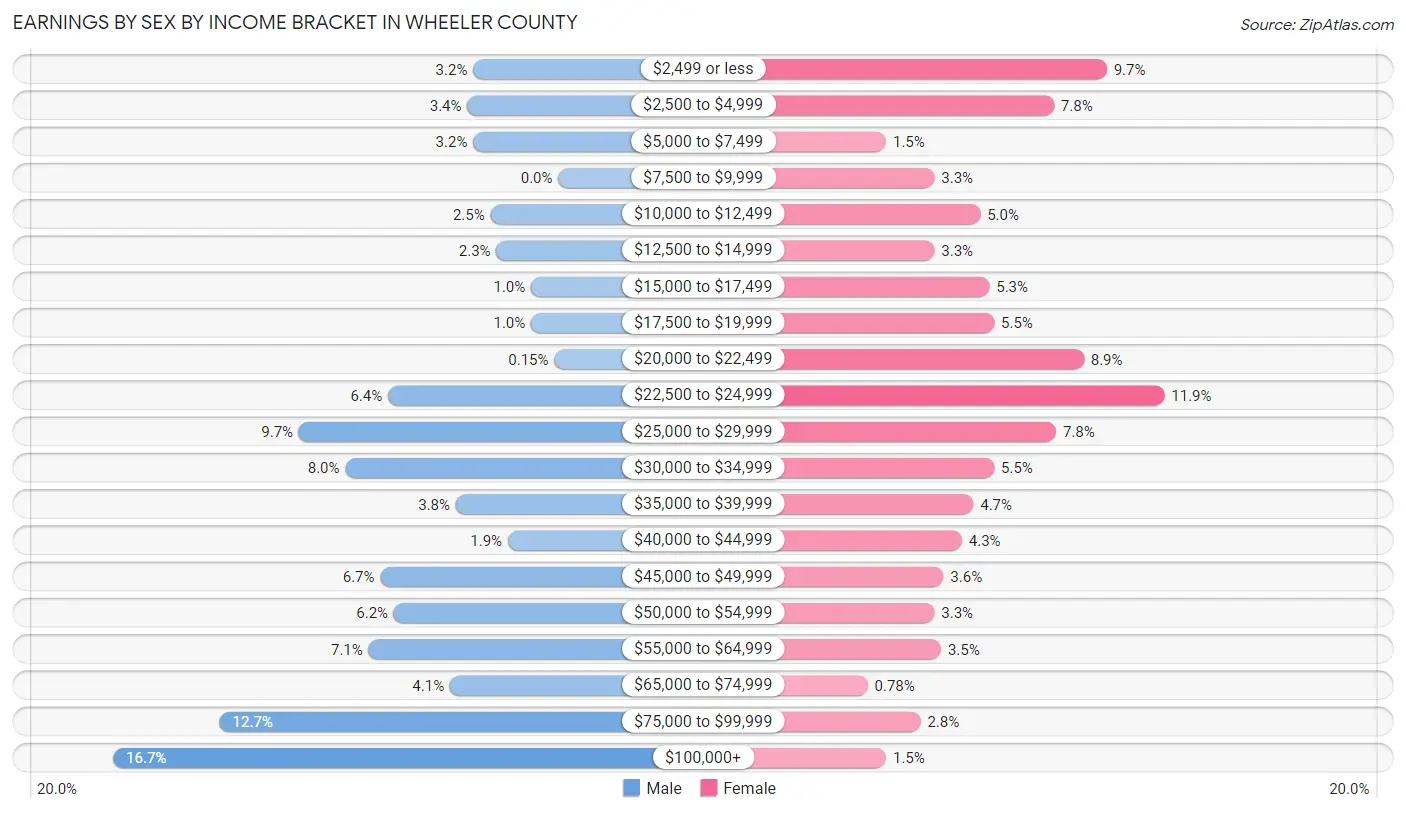
Earnings by Sex by Income Bracket in Wheeler County
The most common earnings brackets in Wheeler County are $100,000+ for men (230 | 16.7%) and $22,500 to $24,999 for women (138 | 11.9%).
| Income | Male | Female |
| $2,499 or less | 44 (3.2%) | 113 (9.7%) |
| $2,500 to $4,999 | 47 (3.4%) | 90 (7.8%) |
| $5,000 to $7,499 | 44 (3.2%) | 17 (1.5%) |
| $7,500 to $9,999 | 0 (0.0%) | 38 (3.3%) |
| $10,000 to $12,499 | 35 (2.5%) | 58 (5.0%) |
| $12,500 to $14,999 | 32 (2.3%) | 38 (3.3%) |
| $15,000 to $17,499 | 14 (1.0%) | 62 (5.3%) |
| $17,500 to $19,999 | 14 (1.0%) | 64 (5.5%) |
| $20,000 to $22,499 | 2 (0.2%) | 103 (8.9%) |
| $22,500 to $24,999 | 88 (6.4%) | 138 (11.9%) |
| $25,000 to $29,999 | 134 (9.7%) | 91 (7.8%) |
| $30,000 to $34,999 | 110 (8.0%) | 64 (5.5%) |
| $35,000 to $39,999 | 53 (3.8%) | 55 (4.7%) |
| $40,000 to $44,999 | 26 (1.9%) | 50 (4.3%) |
| $45,000 to $49,999 | 92 (6.7%) | 42 (3.6%) |
| $50,000 to $54,999 | 85 (6.2%) | 38 (3.3%) |
| $55,000 to $64,999 | 98 (7.1%) | 41 (3.5%) |
| $65,000 to $74,999 | 56 (4.1%) | 9 (0.8%) |
| $75,000 to $99,999 | 175 (12.7%) | 32 (2.8%) |
| $100,000+ | 230 (16.7%) | 17 (1.5%) |
| Total | 1,379 (100.0%) | 1,160 (100.0%) |
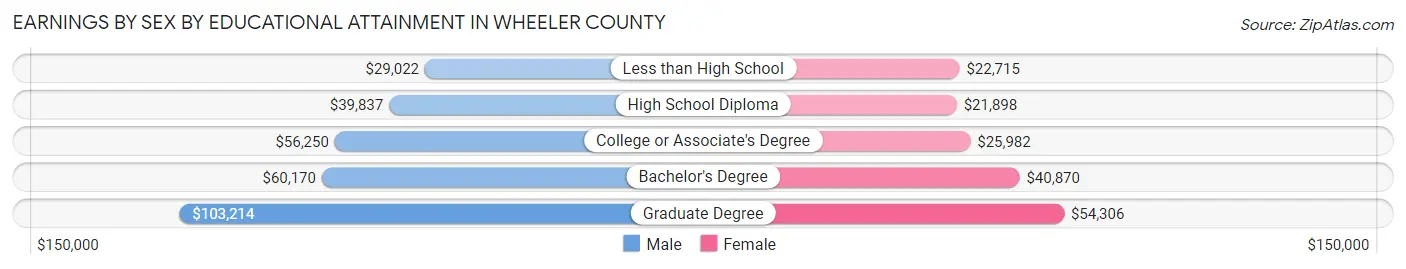
Earnings by Sex by Educational Attainment in Wheeler County
Average earnings in Wheeler County are $50,335 for men and $23,397 for women, a difference of 53.5%. Men with an educational attainment of graduate degree enjoy the highest average annual earnings of $103,214, while those with less than high school education earn the least with $29,022. Women with an educational attainment of graduate degree earn the most with the average annual earnings of $54,306, while those with high school diploma education have the smallest earnings of $21,898.
| Educational Attainment | Male Income | Female Income |
| Less than High School | $29,022 | $22,715 |
| High School Diploma | $39,837 | $21,898 |
| College or Associate's Degree | $56,250 | $25,982 |
| Bachelor's Degree | $60,170 | $40,870 |
| Graduate Degree | $103,214 | $54,306 |
| Total | $50,335 | $23,397 |
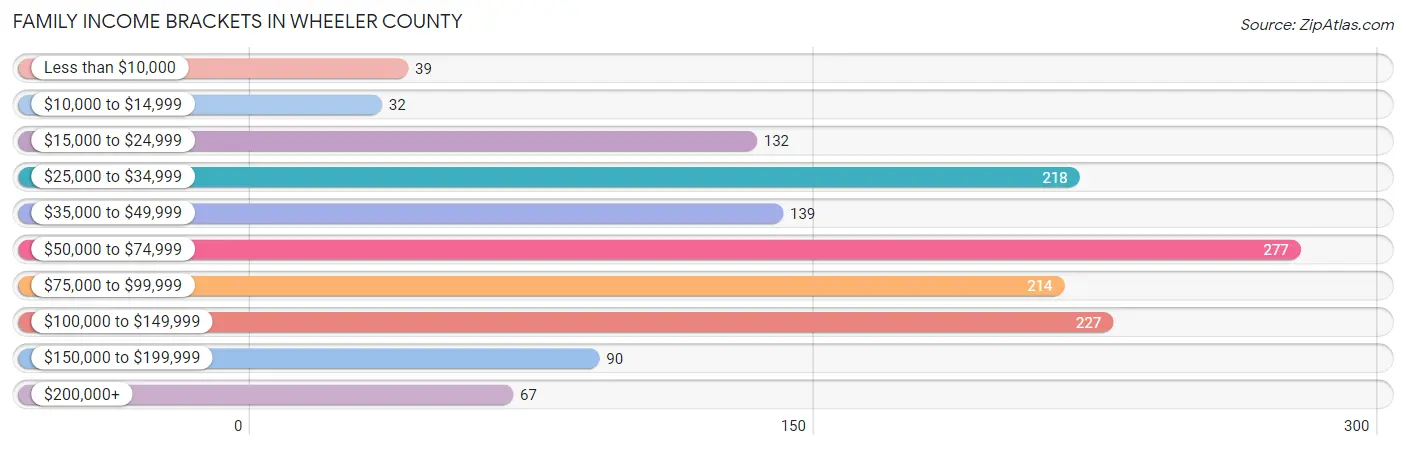
Family Income in Wheeler County
Family Income Brackets in Wheeler County
According to the Wheeler County family income data, there are 277 families falling into the $50,000 to $74,999 income range, which is the most common income bracket and makes up 19.3% of all families. Conversely, the $10,000 to $14,999 income bracket is the least frequent group with only 32 families (2.2%) belonging to this category.
| Income Bracket | # Families | % Families |
| Less than $10,000 | 39 | 2.7% |
| $10,000 to $14,999 | 32 | 2.2% |
| $15,000 to $24,999 | 132 | 9.2% |
| $25,000 to $34,999 | 218 | 15.2% |
| $35,000 to $49,999 | 139 | 9.7% |
| $50,000 to $74,999 | 277 | 19.3% |
| $75,000 to $99,999 | 214 | 14.9% |
| $100,000 to $149,999 | 227 | 15.8% |
| $150,000 to $199,999 | 90 | 6.3% |
| $200,000+ | 67 | 4.7% |
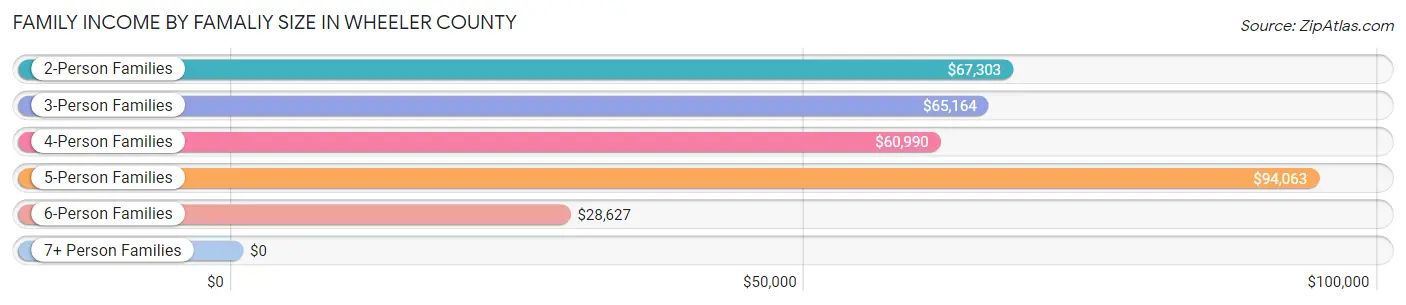
Family Income by Famaliy Size in Wheeler County
5-person families (115 | 8.0%) account for the highest median family income in Wheeler County with $94,063 per family, while 2-person families (679 | 47.3%) have the highest median income of $33,652 per family member.
| Income Bracket | # Families | Median Income |
| 2-Person Families | 679 (47.3%) | $67,303 |
| 3-Person Families | 267 (18.6%) | $65,164 |
| 4-Person Families | 193 (13.5%) | $60,990 |
| 5-Person Families | 115 (8.0%) | $94,063 |
| 6-Person Families | 164 (11.4%) | $28,627 |
| 7+ Person Families | 17 (1.2%) | $0 |
| Total | 1,435 (100.0%) | $65,671 |
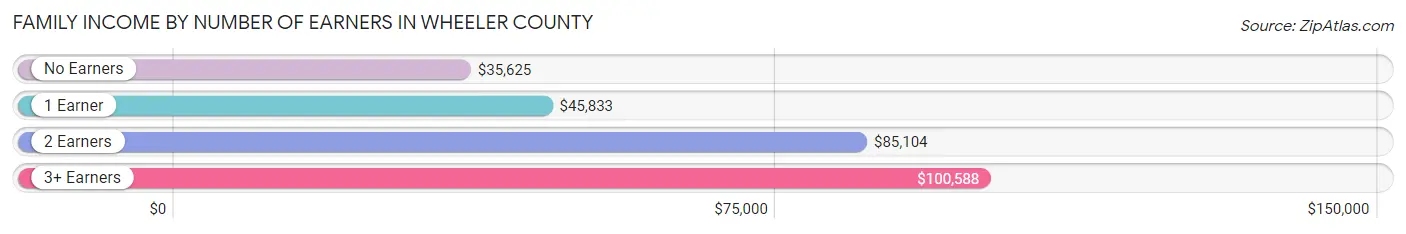
Family Income by Number of Earners in Wheeler County
The median family income in Wheeler County is $65,671, with families comprising 3+ earners (96) having the highest median family income of $100,588, while families with no earners (205) have the lowest median family income of $35,625, accounting for 6.7% and 14.3% of families, respectively.
| Number of Earners | # Families | Median Income |
| No Earners | 205 (14.3%) | $35,625 |
| 1 Earner | 520 (36.2%) | $45,833 |
| 2 Earners | 614 (42.8%) | $85,104 |
| 3+ Earners | 96 (6.7%) | $100,588 |
| Total | 1,435 (100.0%) | $65,671 |
Household Income in Wheeler County
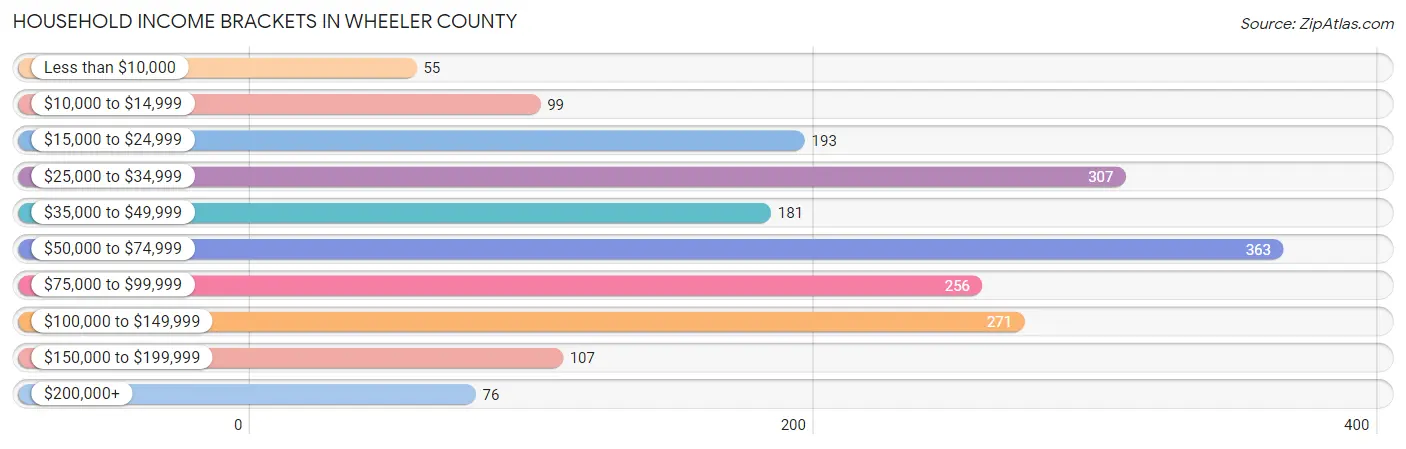
Household Income Brackets in Wheeler County
With 363 households falling in the category, the $50,000 to $74,999 income range is the most frequent in Wheeler County, accounting for 19.0% of all households. In contrast, only 55 households (2.9%) fall into the less than $10,000 income bracket, making it the least populous group.
| Income Bracket | # Households | % Households |
| Less than $10,000 | 55 | 2.9% |
| $10,000 to $14,999 | 99 | 5.2% |
| $15,000 to $24,999 | 193 | 10.1% |
| $25,000 to $34,999 | 307 | 16.1% |
| $35,000 to $49,999 | 181 | 9.5% |
| $50,000 to $74,999 | 363 | 19.0% |
| $75,000 to $99,999 | 256 | 13.4% |
| $100,000 to $149,999 | 271 | 14.2% |
| $150,000 to $199,999 | 107 | 5.6% |
| $200,000+ | 76 | 4.0% |
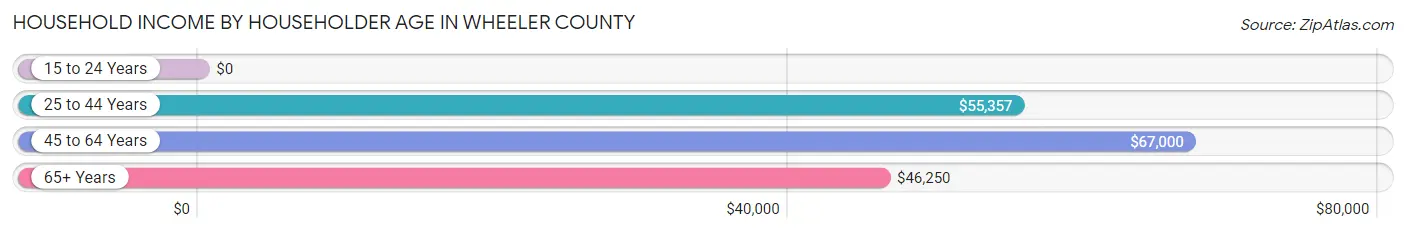
Household Income by Householder Age in Wheeler County
The median household income in Wheeler County is $58,158, with the highest median household income of $67,000 found in the 45 to 64 years age bracket for the primary householder. A total of 644 households (33.8%) fall into this category. Meanwhile, the 15 to 24 years age bracket for the primary householder has the lowest median household income of $0, with 53 households (2.8%) in this group.
| Income Bracket | # Households | Median Income |
| 15 to 24 Years | 53 (2.8%) | $0 |
| 25 to 44 Years | 640 (33.5%) | $55,357 |
| 45 to 64 Years | 644 (33.8%) | $67,000 |
| 65+ Years | 571 (29.9%) | $46,250 |
| Total | 1,908 (100.0%) | $58,158 |
Poverty in Wheeler County
Income Below Poverty by Sex and Age in Wheeler County
With 14.7% poverty level for males and 22.2% for females among the residents of Wheeler County, under 5 year old males and 5 year old females are the most vulnerable to poverty, with 87 males (39.4%) and 34 females (70.8%) in their respective age groups living below the poverty level.
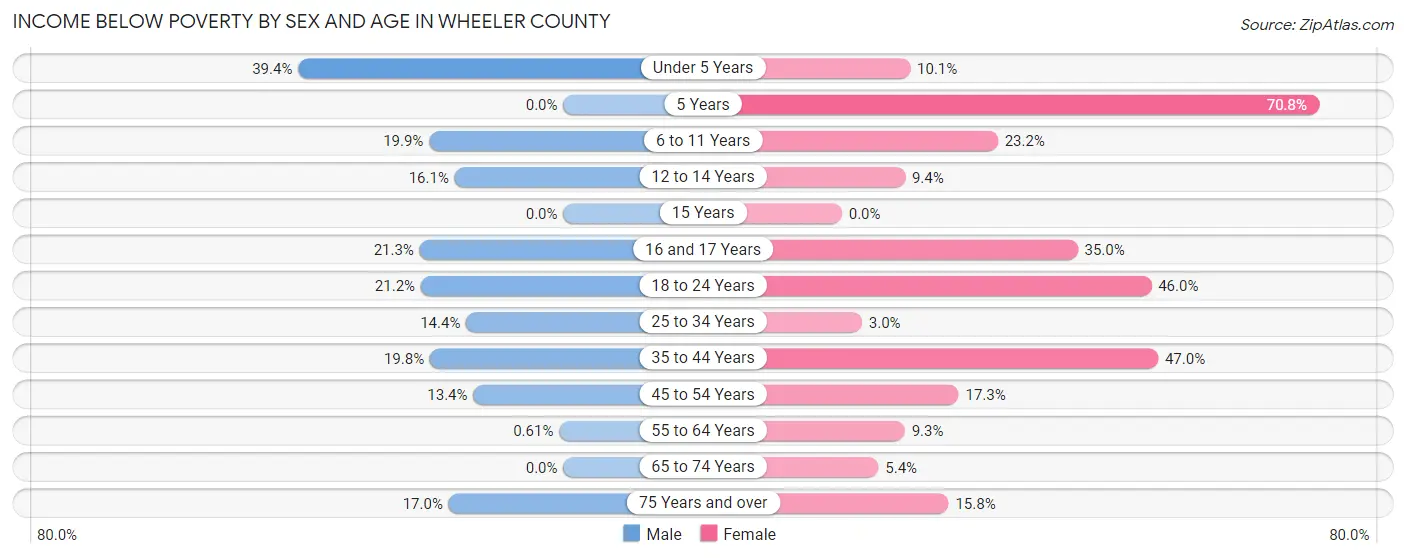
| Age Bracket | Male | Female |
| Under 5 Years | 87 (39.4%) | 7 (10.1%) |
| 5 Years | 0 (0.0%) | 34 (70.8%) |
| 6 to 11 Years | 50 (19.9%) | 47 (23.2%) |
| 12 to 14 Years | 15 (16.1%) | 6 (9.4%) |
| 15 Years | 0 (0.0%) | 0 (0.0%) |
| 16 and 17 Years | 16 (21.3%) | 35 (35.0%) |
| 18 to 24 Years | 33 (21.1%) | 68 (46.0%) |
| 25 to 34 Years | 45 (14.4%) | 7 (3.0%) |
| 35 to 44 Years | 58 (19.8%) | 200 (46.9%) |
| 45 to 54 Years | 33 (13.4%) | 43 (17.3%) |
| 55 to 64 Years | 2 (0.6%) | 31 (9.3%) |
| 65 to 74 Years | 0 (0.0%) | 15 (5.4%) |
| 75 Years and over | 32 (17.0%) | 32 (15.8%) |
| Total | 371 (14.7%) | 525 (22.2%) |
Income Above Poverty by Sex and Age in Wheeler County
According to the poverty statistics in Wheeler County, males aged 5 years and females aged 15 years are the age groups that are most secure financially, with 100.0% of males and 100.0% of females in these age groups living above the poverty line.
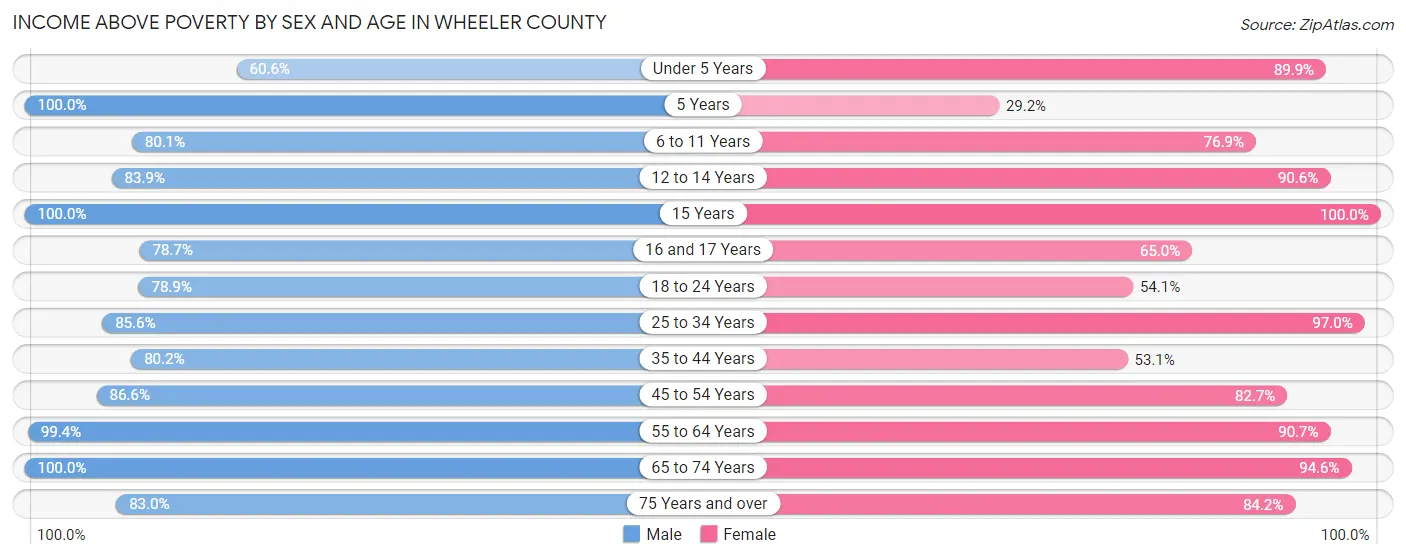
| Age Bracket | Male | Female |
| Under 5 Years | 134 (60.6%) | 62 (89.9%) |
| 5 Years | 47 (100.0%) | 14 (29.2%) |
| 6 to 11 Years | 201 (80.1%) | 156 (76.8%) |
| 12 to 14 Years | 78 (83.9%) | 58 (90.6%) |
| 15 Years | 22 (100.0%) | 19 (100.0%) |
| 16 and 17 Years | 59 (78.7%) | 65 (65.0%) |
| 18 to 24 Years | 123 (78.8%) | 80 (54.0%) |
| 25 to 34 Years | 267 (85.6%) | 228 (97.0%) |
| 35 to 44 Years | 235 (80.2%) | 226 (53.0%) |
| 45 to 54 Years | 214 (86.6%) | 205 (82.7%) |
| 55 to 64 Years | 327 (99.4%) | 301 (90.7%) |
| 65 to 74 Years | 283 (100.0%) | 261 (94.6%) |
| 75 Years and over | 156 (83.0%) | 170 (84.2%) |
| Total | 2,146 (85.3%) | 1,845 (77.8%) |
Income Below Poverty Among Married-Couple Families in Wheeler County
The poverty statistics for married-couple families in Wheeler County show that 8.6% or 92 of the total 1,074 families live below the poverty line. Families with 3 or 4 children have the highest poverty rate of 40.0%, comprising of 54 families. On the other hand, families with 5 or more children have the lowest poverty rate of 0.0%, which includes 0 families.
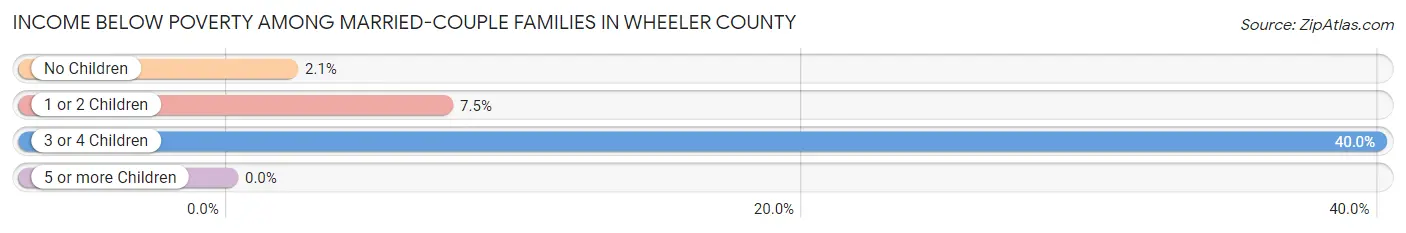
| Children | Above Poverty | Below Poverty |
| No Children | 563 (97.9%) | 12 (2.1%) |
| 1 or 2 Children | 321 (92.5%) | 26 (7.5%) |
| 3 or 4 Children | 81 (60.0%) | 54 (40.0%) |
| 5 or more Children | 17 (100.0%) | 0 (0.0%) |
| Total | 982 (91.4%) | 92 (8.6%) |
Income Below Poverty Among Single-Parent Households in Wheeler County
According to the poverty data in Wheeler County, 17.9% or 15 single-father households and 51.6% or 143 single-mother households are living below the poverty line. Among single-father households, those with 1 or 2 children have the highest poverty rate, with 15 households (26.8%) experiencing poverty. Likewise, among single-mother households, those with 5 or more children have the highest poverty rate, with 64 households (100.0%) falling below the poverty line.
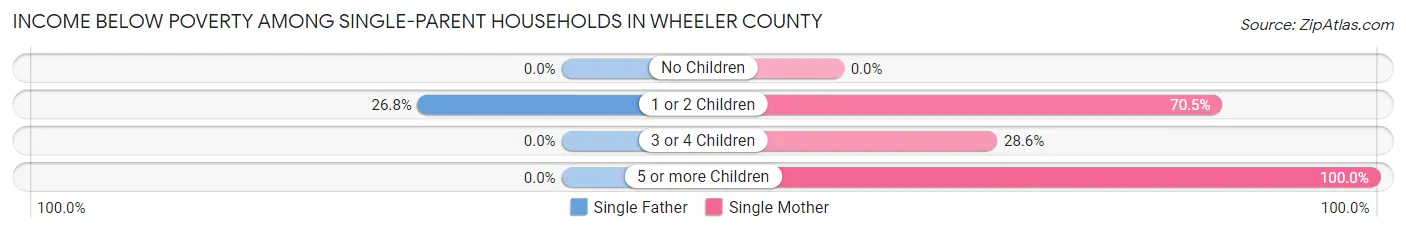
| Children | Single Father | Single Mother |
| No Children | 0 (0.0%) | 0 (0.0%) |
| 1 or 2 Children | 15 (26.8%) | 67 (70.5%) |
| 3 or 4 Children | 0 (0.0%) | 12 (28.6%) |
| 5 or more Children | 0 (0.0%) | 64 (100.0%) |
| Total | 15 (17.9%) | 143 (51.6%) |
Income Below Poverty Among Married-Couple vs Single-Parent Households in Wheeler County
The poverty data for Wheeler County shows that 92 of the married-couple family households (8.6%) and 158 of the single-parent households (43.8%) are living below the poverty level. Within the married-couple family households, those with 3 or 4 children have the highest poverty rate, with 54 households (40.0%) falling below the poverty line. Among the single-parent households, those with 5 or more children have the highest poverty rate, with 64 household (100.0%) living below poverty.
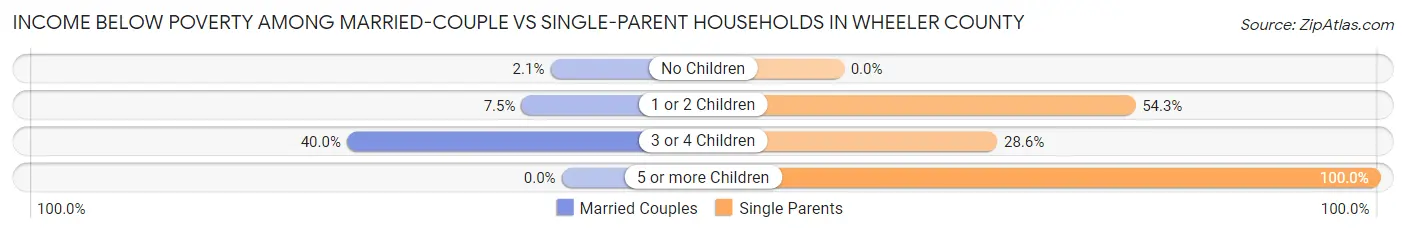
| Children | Married-Couple Families | Single-Parent Households |
| No Children | 12 (2.1%) | 0 (0.0%) |
| 1 or 2 Children | 26 (7.5%) | 82 (54.3%) |
| 3 or 4 Children | 54 (40.0%) | 12 (28.6%) |
| 5 or more Children | 0 (0.0%) | 64 (100.0%) |
| Total | 92 (8.6%) | 158 (43.8%) |
Race in Wheeler County
The most populous races in Wheeler County are White / Caucasian (4,248 | 85.3%), Hispanic or Latino (1,270 | 25.5%), and Two or more Races (375 | 7.5%).
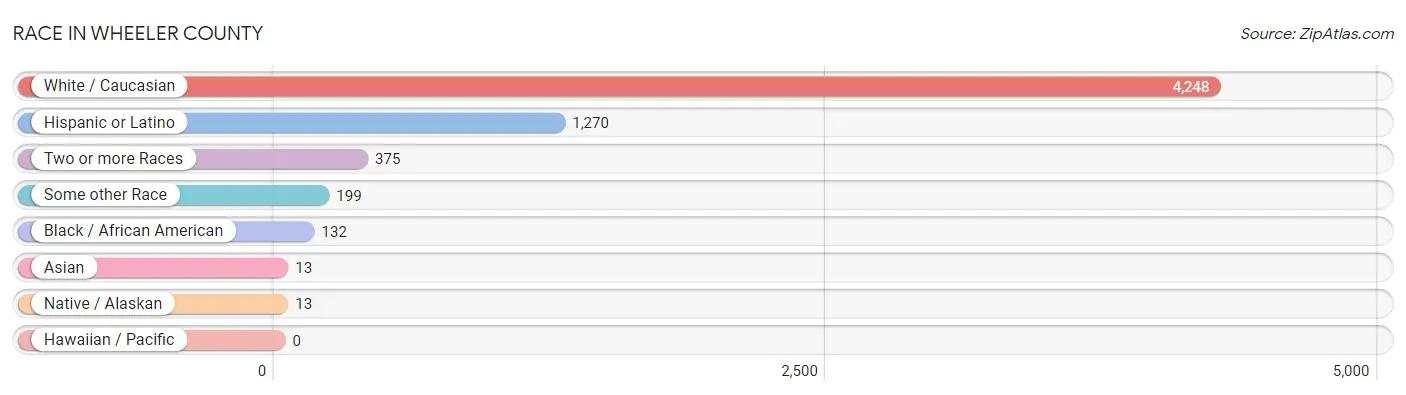
| Race | # Population | % Population |
| Asian | 13 | 0.3% |
| Black / African American | 132 | 2.6% |
| Hawaiian / Pacific | 0 | 0.0% |
| Hispanic or Latino | 1,270 | 25.5% |
| Native / Alaskan | 13 | 0.3% |
| White / Caucasian | 4,248 | 85.3% |
| Two or more Races | 375 | 7.5% |
| Some other Race | 199 | 4.0% |
| Total | 4,980 | 100.0% |
Ancestry in Wheeler County
The most populous ancestries reported in Wheeler County are Mexican (1,089 | 21.9%), Irish (609 | 12.2%), English (412 | 8.3%), German (394 | 7.9%), and American (205 | 4.1%), together accounting for 54.4% of all Wheeler County residents.
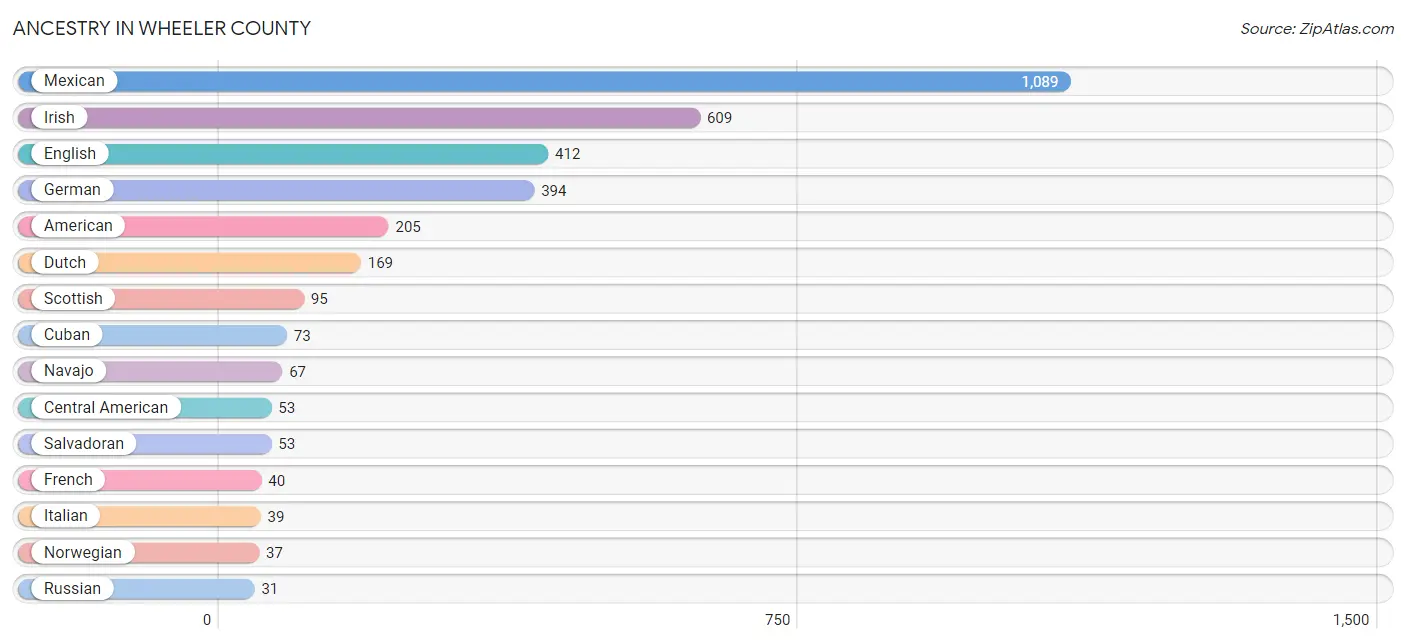
| Ancestry | # Population | % Population |
| American | 205 | 4.1% |
| Apache | 4 | 0.1% |
| Arab | 10 | 0.2% |
| Bhutanese | 16 | 0.3% |
| British | 14 | 0.3% |
| Burmese | 4 | 0.1% |
| Central American | 53 | 1.1% |
| Cherokee | 16 | 0.3% |
| Choctaw | 17 | 0.3% |
| Comanche | 6 | 0.1% |
| Cuban | 73 | 1.5% |
| Czech | 27 | 0.5% |
| Dutch | 169 | 3.4% |
| Eastern European | 5 | 0.1% |
| English | 412 | 8.3% |
| European | 8 | 0.2% |
| French | 40 | 0.8% |
| French Canadian | 30 | 0.6% |
| German | 394 | 7.9% |
| Greek | 2 | 0.0% |
| Indian (Asian) | 9 | 0.2% |
| Iraqi | 10 | 0.2% |
| Irish | 609 | 12.2% |
| Italian | 39 | 0.8% |
| Korean | 13 | 0.3% |
| Latvian | 4 | 0.1% |
| Mexican | 1,089 | 21.9% |
| Navajo | 67 | 1.3% |
| Northern European | 5 | 0.1% |
| Norwegian | 37 | 0.7% |
| Peruvian | 23 | 0.5% |
| Russian | 31 | 0.6% |
| Salvadoran | 53 | 1.1% |
| Samoan | 4 | 0.1% |
| Scandinavian | 17 | 0.3% |
| Scotch-Irish | 25 | 0.5% |
| Scottish | 95 | 1.9% |
| South American | 23 | 0.5% |
| Spanish | 14 | 0.3% |
| Swedish | 30 | 0.6% |
| Swiss | 6 | 0.1% |
| Welsh | 13 | 0.3% | View All 42 Rows |
Immigrants in Wheeler County
The most numerous immigrant groups reported in Wheeler County came from Latin America (406 | 8.2%), Central America (354 | 7.1%), Mexico (277 | 5.6%), Caribbean (52 | 1.0%), and Cuba (52 | 1.0%), together accounting for 22.9% of all Wheeler County residents.
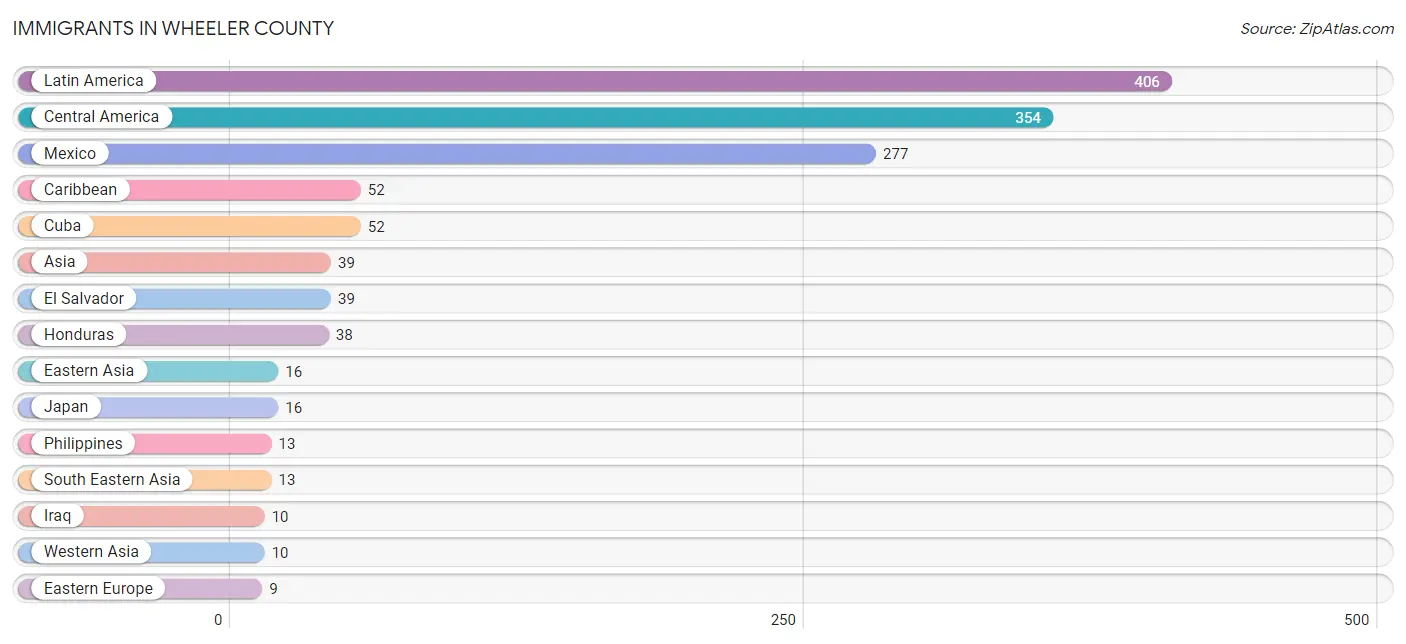
| Immigration Origin | # Population | % Population |
| Asia | 39 | 0.8% |
| Caribbean | 52 | 1.0% |
| Central America | 354 | 7.1% |
| Cuba | 52 | 1.0% |
| Eastern Asia | 16 | 0.3% |
| Eastern Europe | 9 | 0.2% |
| El Salvador | 39 | 0.8% |
| Europe | 9 | 0.2% |
| Honduras | 38 | 0.8% |
| Iraq | 10 | 0.2% |
| Japan | 16 | 0.3% |
| Latin America | 406 | 8.2% |
| Latvia | 9 | 0.2% |
| Mexico | 277 | 5.6% |
| Philippines | 13 | 0.3% |
| South Eastern Asia | 13 | 0.3% |
| Western Asia | 10 | 0.2% | View All 17 Rows |
Sex and Age in Wheeler County
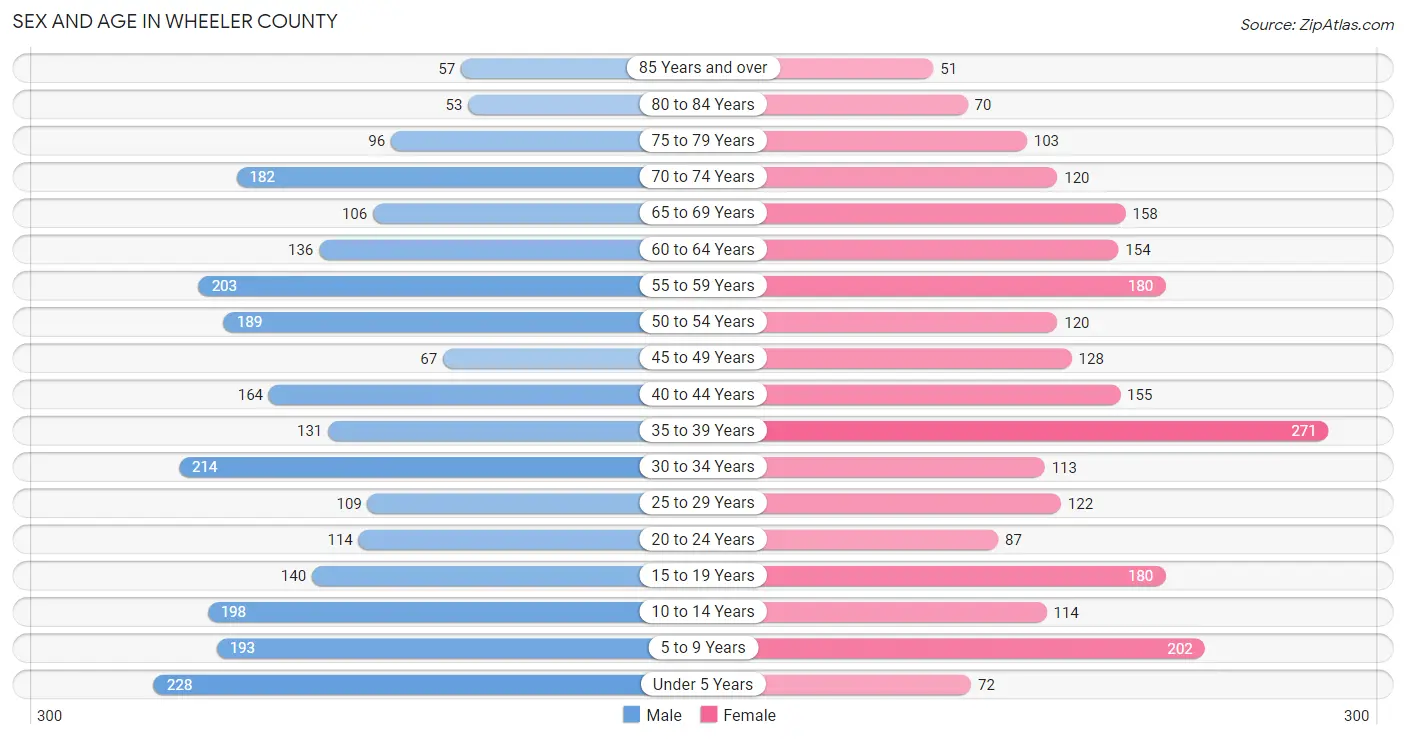
Sex and Age in Wheeler County
The most populous age groups in Wheeler County are Under 5 Years (228 | 8.8%) for men and 35 to 39 Years (271 | 11.3%) for women.
| Age Bracket | Male | Female |
| Under 5 Years | 228 (8.8%) | 72 (3.0%) |
| 5 to 9 Years | 193 (7.5%) | 202 (8.4%) |
| 10 to 14 Years | 198 (7.7%) | 114 (4.8%) |
| 15 to 19 Years | 140 (5.4%) | 180 (7.5%) |
| 20 to 24 Years | 114 (4.4%) | 87 (3.6%) |
| 25 to 29 Years | 109 (4.2%) | 122 (5.1%) |
| 30 to 34 Years | 214 (8.3%) | 113 (4.7%) |
| 35 to 39 Years | 131 (5.1%) | 271 (11.3%) |
| 40 to 44 Years | 164 (6.4%) | 155 (6.5%) |
| 45 to 49 Years | 67 (2.6%) | 128 (5.3%) |
| 50 to 54 Years | 189 (7.3%) | 120 (5.0%) |
| 55 to 59 Years | 203 (7.9%) | 180 (7.5%) |
| 60 to 64 Years | 136 (5.3%) | 154 (6.4%) |
| 65 to 69 Years | 106 (4.1%) | 158 (6.6%) |
| 70 to 74 Years | 182 (7.0%) | 120 (5.0%) |
| 75 to 79 Years | 96 (3.7%) | 103 (4.3%) |
| 80 to 84 Years | 53 (2.1%) | 70 (2.9%) |
| 85 Years and over | 57 (2.2%) | 51 (2.1%) |
| Total | 2,580 (100.0%) | 2,400 (100.0%) |
Families and Households in Wheeler County
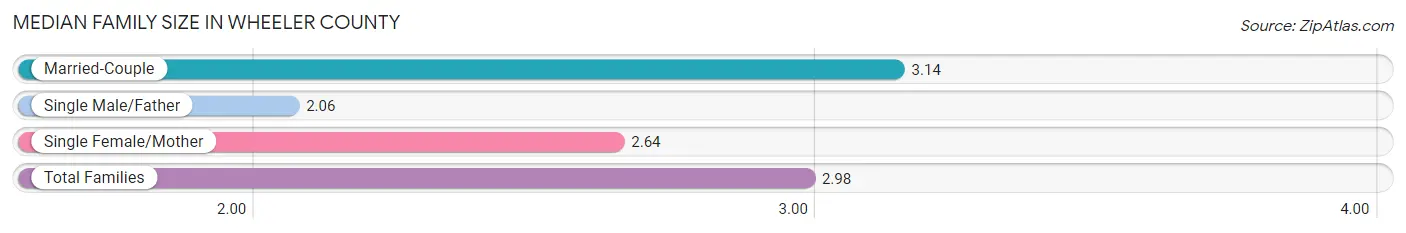
Median Family Size in Wheeler County
The median family size in Wheeler County is 2.98 persons per family, with married-couple families (1,074 | 74.8%) accounting for the largest median family size of 3.14 persons per family. On the other hand, single male/father families (84 | 5.9%) represent the smallest median family size with 2.06 persons per family.
| Family Type | # Families | Family Size |
| Married-Couple | 1,074 (74.8%) | 3.14 |
| Single Male/Father | 84 (5.9%) | 2.06 |
| Single Female/Mother | 277 (19.3%) | 2.64 |
| Total Families | 1,435 (100.0%) | 2.98 |
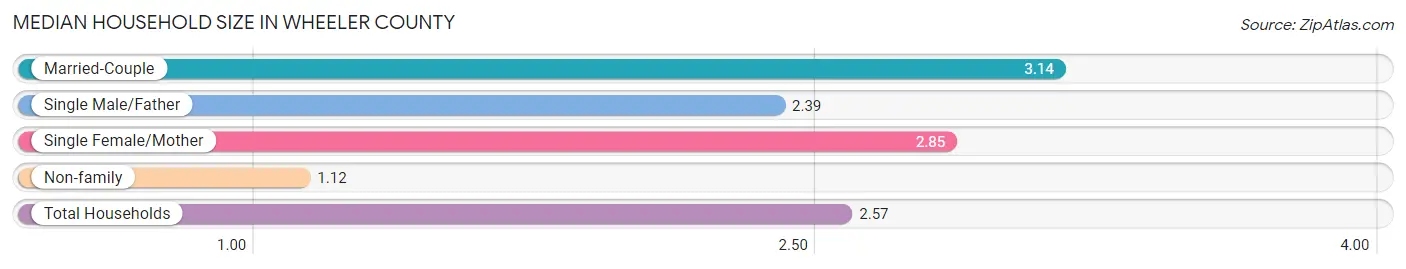
Median Household Size in Wheeler County
The median household size in Wheeler County is 2.57 persons per household, with married-couple households (1,074 | 56.3%) accounting for the largest median household size of 3.14 persons per household. non-family households (473 | 24.8%) represent the smallest median household size with 1.12 persons per household.
| Household Type | # Households | Household Size |
| Married-Couple | 1,074 (56.3%) | 3.14 |
| Single Male/Father | 84 (4.4%) | 2.39 |
| Single Female/Mother | 277 (14.5%) | 2.85 |
| Non-family | 473 (24.8%) | 1.12 |
| Total Households | 1,908 (100.0%) | 2.57 |
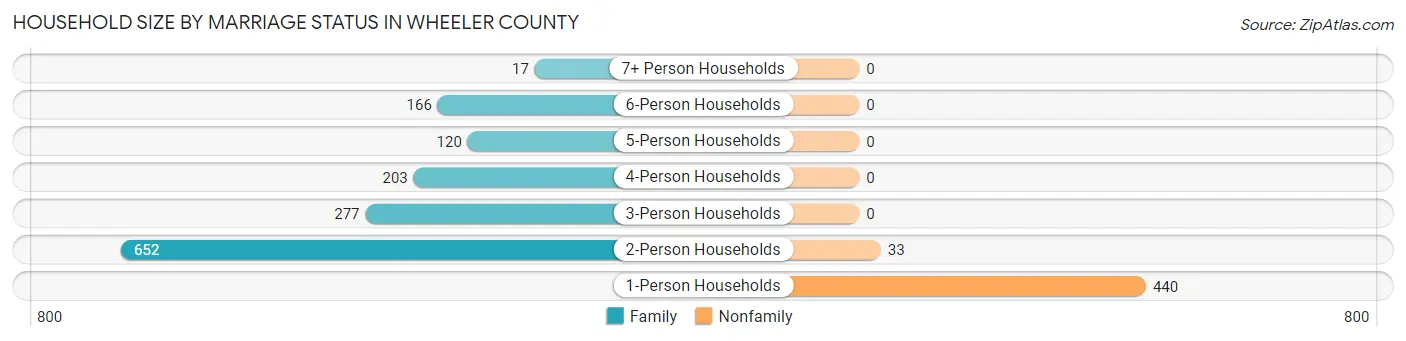
Household Size by Marriage Status in Wheeler County
Out of a total of 1,908 households in Wheeler County, 1,435 (75.2%) are family households, while 473 (24.8%) are nonfamily households. The most numerous type of family households are 2-person households, comprising 652, and the most common type of nonfamily households are 1-person households, comprising 440.
| Household Size | Family Households | Nonfamily Households |
| 1-Person Households | - | 440 (23.1%) |
| 2-Person Households | 652 (34.2%) | 33 (1.7%) |
| 3-Person Households | 277 (14.5%) | 0 (0.0%) |
| 4-Person Households | 203 (10.6%) | 0 (0.0%) |
| 5-Person Households | 120 (6.3%) | 0 (0.0%) |
| 6-Person Households | 166 (8.7%) | 0 (0.0%) |
| 7+ Person Households | 17 (0.9%) | 0 (0.0%) |
| Total | 1,435 (75.2%) | 473 (24.8%) |
Female Fertility in Wheeler County
Fertility by Age in Wheeler County
Average fertility rate in Wheeler County is 37.0 births per 1,000 women. Women in the age bracket of 20 to 34 years have the highest fertility rate with 124.0 births per 1,000 women. Women in the age bracket of 20 to 34 years acount for 97.6% of all women with births.
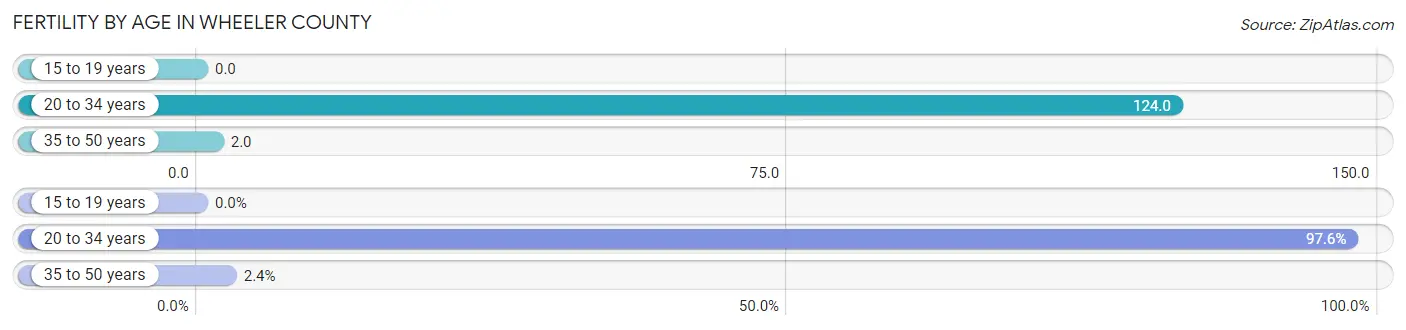
| Age Bracket | Women with Births | Births / 1,000 Women |
| 15 to 19 years | 0 (0.0%) | 0.0 |
| 20 to 34 years | 40 (97.6%) | 124.0 |
| 35 to 50 years | 1 (2.4%) | 2.0 |
| Total | 41 (100.0%) | 37.0 |
Fertility by Age by Marriage Status in Wheeler County
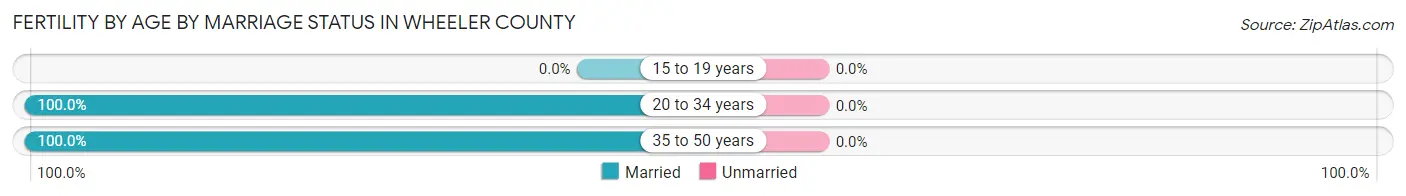
| Age Bracket | Married | Unmarried |
| 15 to 19 years | 0 (0.0%) | 0 (0.0%) |
| 20 to 34 years | 40 (100.0%) | 0 (0.0%) |
| 35 to 50 years | 1 (100.0%) | 0 (0.0%) |
| Total | 41 (100.0%) | 0 (0.0%) |
Fertility by Education in Wheeler County
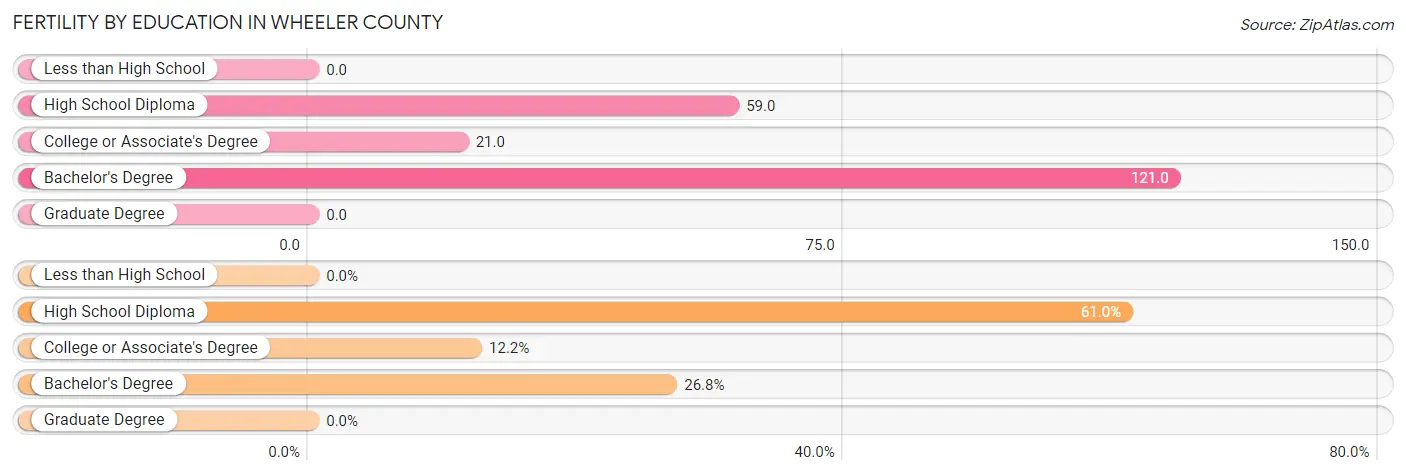
| Educational Attainment | Women with Births | Births / 1,000 Women |
| Less than High School | 0 (0.0%) | 0.0 |
| High School Diploma | 25 (61.0%) | 59.0 |
| College or Associate's Degree | 5 (12.2%) | 21.0 |
| Bachelor's Degree | 11 (26.8%) | 121.0 |
| Graduate Degree | 0 (0.0%) | 0.0 |
| Total | 41 (100.0%) | 37.0 |
Fertility by Education by Marriage Status in Wheeler County
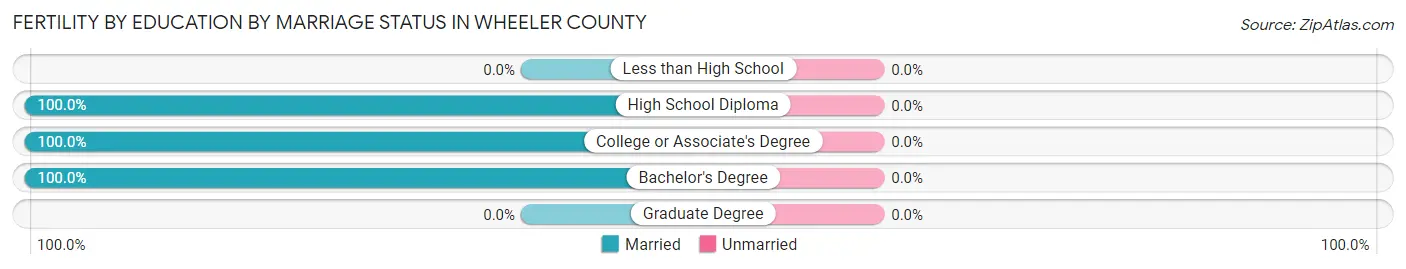
| Educational Attainment | Married | Unmarried |
| Less than High School | 0 (0.0%) | 0 (0.0%) |
| High School Diploma | 25 (100.0%) | 0 (0.0%) |
| College or Associate's Degree | 5 (100.0%) | 0 (0.0%) |
| Bachelor's Degree | 11 (100.0%) | 0 (0.0%) |
| Graduate Degree | 0 (0.0%) | 0 (0.0%) |
| Total | 41 (100.0%) | 0 (0.0%) |
Employment Characteristics in Wheeler County
Employment by Class of Employer in Wheeler County
Among the 2,269 employed individuals in Wheeler County, private company employees (1,358 | 59.9%), self-employed (not incorporated) (387 | 17.1%), and local government employees (263 | 11.6%) make up the most common classes of employment.
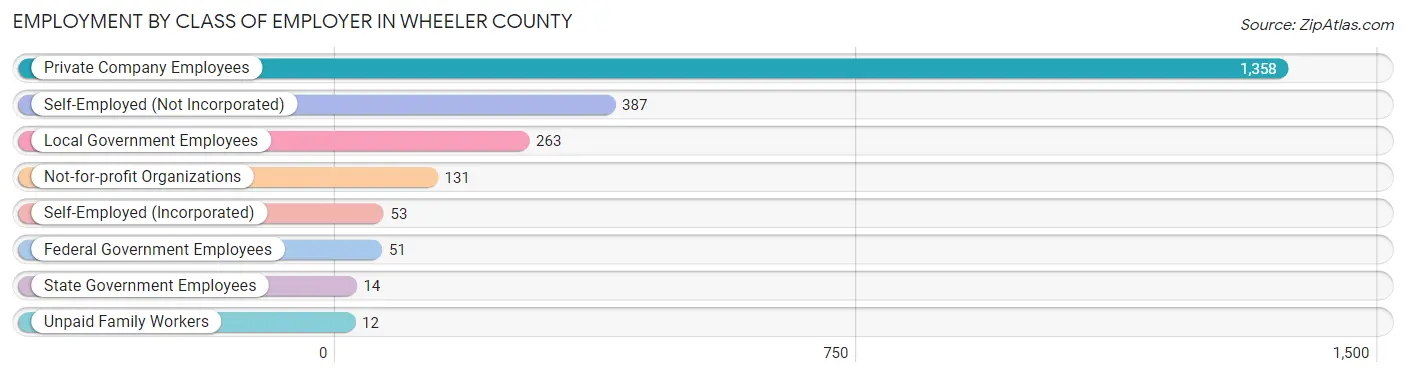
| Employer Class | # Employees | % Employees |
| Private Company Employees | 1,358 | 59.9% |
| Self-Employed (Incorporated) | 53 | 2.3% |
| Self-Employed (Not Incorporated) | 387 | 17.1% |
| Not-for-profit Organizations | 131 | 5.8% |
| Local Government Employees | 263 | 11.6% |
| State Government Employees | 14 | 0.6% |
| Federal Government Employees | 51 | 2.2% |
| Unpaid Family Workers | 12 | 0.5% |
| Total | 2,269 | 100.0% |
Employment Status by Age in Wheeler County
According to the labor force statistics for Wheeler County, out of the total population over 16 years of age (3,932), 61.9% or 2,434 individuals are in the labor force, with 6.6% or 161 of them unemployed. The age group with the highest labor force participation rate is 30 to 34 years, with 93.0% or 304 individuals in the labor force. Within the labor force, the 20 to 24 years age range has the highest percentage of unemployed individuals, with 18.1% or 27 of them being unemployed.
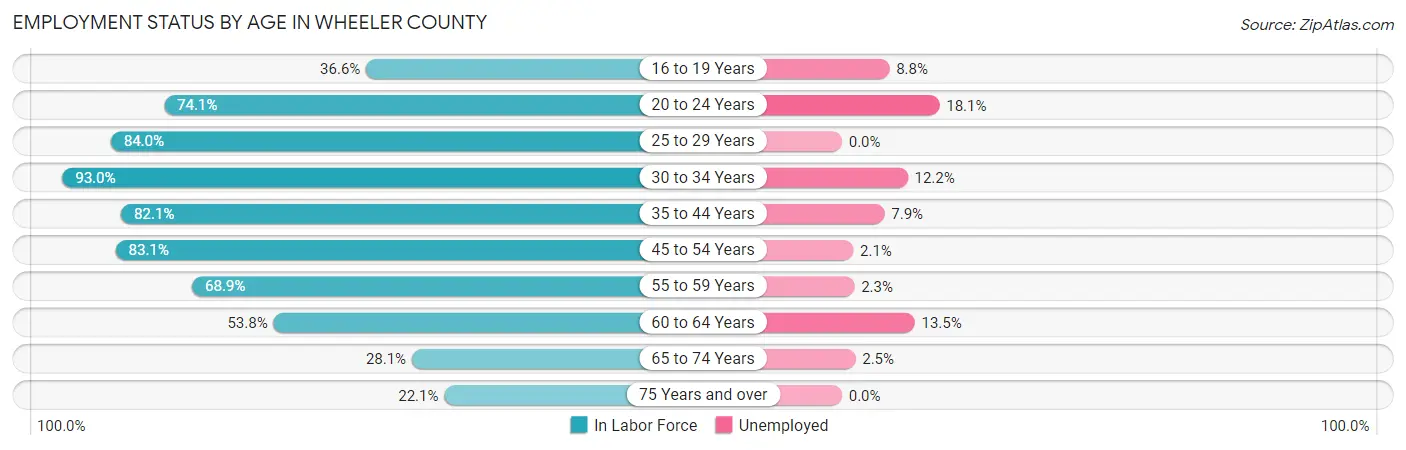
| Age Bracket | In Labor Force | Unemployed |
| 16 to 19 Years | 102 (36.6%) | 9 (8.8%) |
| 20 to 24 Years | 149 (74.1%) | 27 (18.1%) |
| 25 to 29 Years | 194 (84.0%) | 0 (0.0%) |
| 30 to 34 Years | 304 (93.0%) | 37 (12.2%) |
| 35 to 44 Years | 592 (82.1%) | 47 (7.9%) |
| 45 to 54 Years | 419 (83.1%) | 9 (2.1%) |
| 55 to 59 Years | 264 (68.9%) | 6 (2.3%) |
| 60 to 64 Years | 156 (53.8%) | 21 (13.5%) |
| 65 to 74 Years | 159 (28.1%) | 4 (2.5%) |
| 75 Years and over | 95 (22.1%) | 0 (0.0%) |
| Total | 2,434 (61.9%) | 161 (6.6%) |
Employment Status by Educational Attainment in Wheeler County
According to labor force statistics for Wheeler County, 78.5% of individuals (1,928) out of the total population between 25 and 64 years of age (2,456) are in the labor force, with 6.2% or 120 of them being unemployed. The group with the highest labor force participation rate are those with the educational attainment of bachelor's degree or higher, with 85.4% or 333 individuals in the labor force. Within the labor force, individuals with high school diploma education have the highest percentage of unemployment, with 11.1% or 78 of them being unemployed.
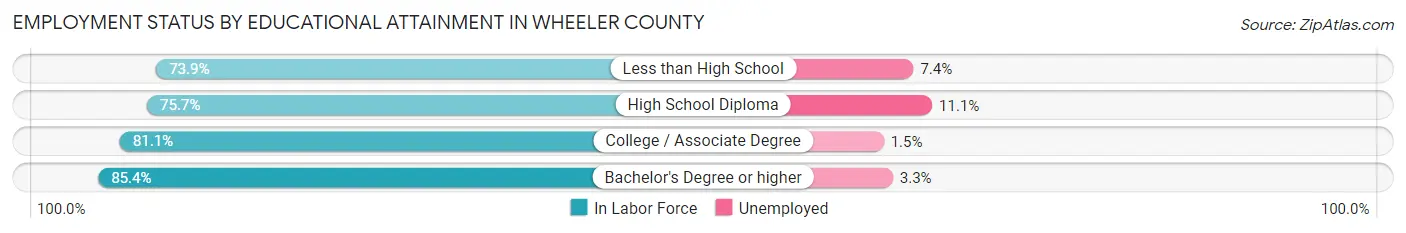
| Educational Attainment | In Labor Force | Unemployed |
| Less than High School | 297 (73.9%) | 30 (7.4%) |
| High School Diploma | 704 (75.7%) | 103 (11.1%) |
| College / Associate Degree | 595 (81.1%) | 11 (1.5%) |
| Bachelor's Degree or higher | 333 (85.4%) | 13 (3.3%) |
| Total | 1,928 (78.5%) | 152 (6.2%) |
Employment Occupations by Sex in Wheeler County
Management, Business, Science and Arts Occupations
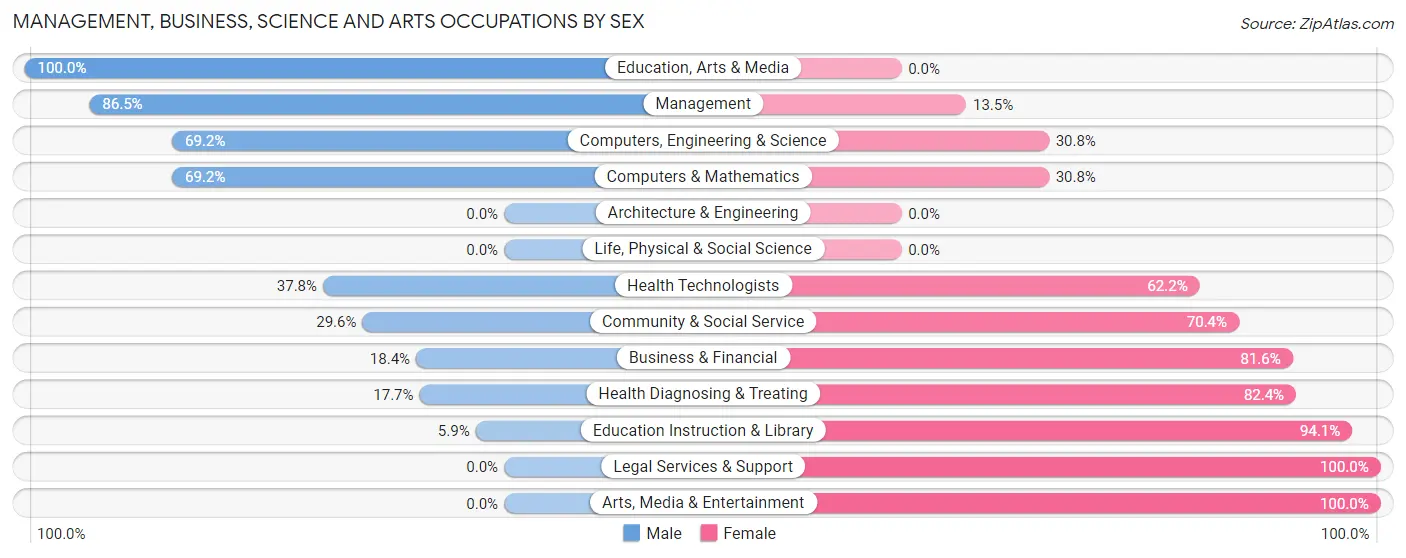
The most common Management, Business, Science and Arts occupations in Wheeler County are Management (266 | 11.7%), Community & Social Service (159 | 7.0%), Health Diagnosing & Treating (119 | 5.2%), Education Instruction & Library (101 | 4.4%), and Business & Financial (49 | 2.1%).
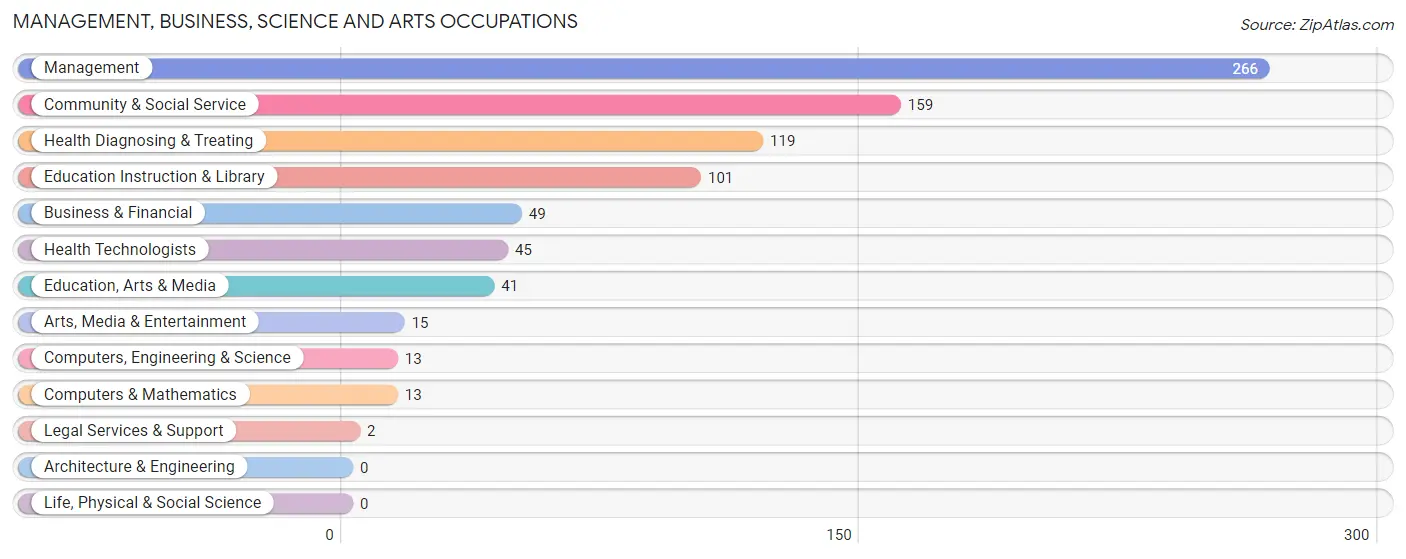
Management, Business, Science and Arts Occupations by Sex
Within the Management, Business, Science and Arts occupations in Wheeler County, the most male-oriented occupations are Education, Arts & Media (100.0%), Management (86.5%), and Computers, Engineering & Science (69.2%), while the most female-oriented occupations are Legal Services & Support (100.0%), Arts, Media & Entertainment (100.0%), and Education Instruction & Library (94.1%).
| Occupation | Male | Female |
| Management | 230 (86.5%) | 36 (13.5%) |
| Business & Financial | 9 (18.4%) | 40 (81.6%) |
| Computers, Engineering & Science | 9 (69.2%) | 4 (30.8%) |
| Computers & Mathematics | 9 (69.2%) | 4 (30.8%) |
| Architecture & Engineering | 0 (0.0%) | 0 (0.0%) |
| Life, Physical & Social Science | 0 (0.0%) | 0 (0.0%) |
| Community & Social Service | 47 (29.6%) | 112 (70.4%) |
| Education, Arts & Media | 41 (100.0%) | 0 (0.0%) |
| Legal Services & Support | 0 (0.0%) | 2 (100.0%) |
| Education Instruction & Library | 6 (5.9%) | 95 (94.1%) |
| Arts, Media & Entertainment | 0 (0.0%) | 15 (100.0%) |
| Health Diagnosing & Treating | 21 (17.6%) | 98 (82.4%) |
| Health Technologists | 17 (37.8%) | 28 (62.2%) |
| Total (Category) | 316 (52.1%) | 290 (47.8%) |
| Total (Overall) | 1,237 (54.4%) | 1,037 (45.6%) |
Services Occupations
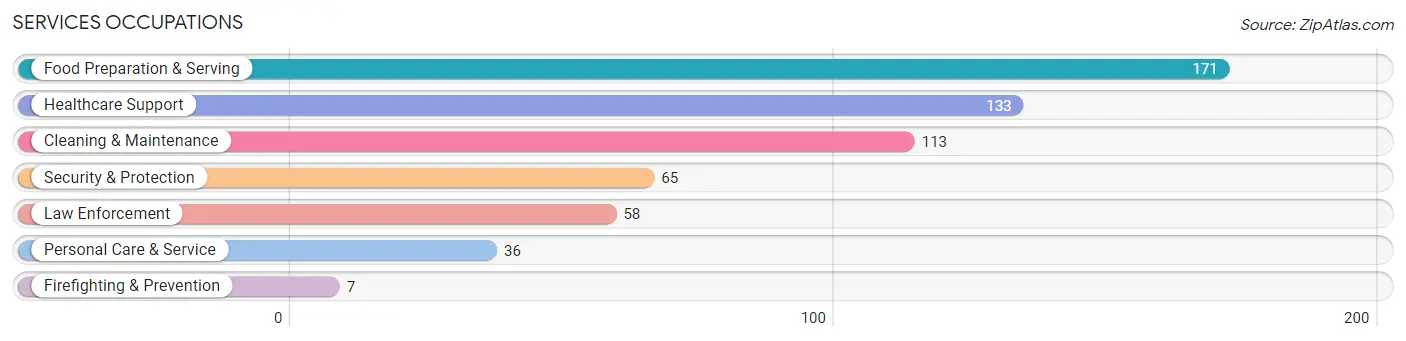
The most common Services occupations in Wheeler County are Food Preparation & Serving (171 | 7.5%), Healthcare Support (133 | 5.9%), Cleaning & Maintenance (113 | 5.0%), Security & Protection (65 | 2.9%), and Law Enforcement (58 | 2.5%).
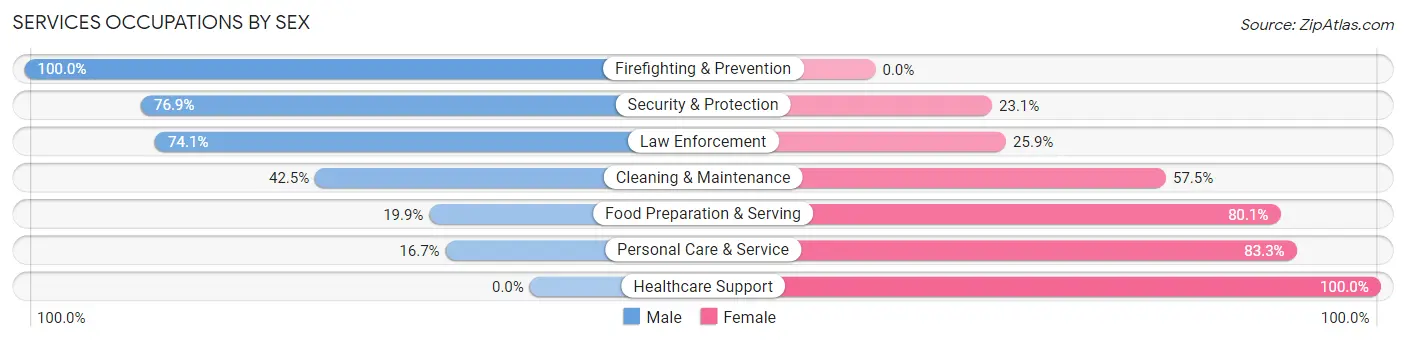
Services Occupations by Sex
Within the Services occupations in Wheeler County, the most male-oriented occupations are Firefighting & Prevention (100.0%), Security & Protection (76.9%), and Law Enforcement (74.1%), while the most female-oriented occupations are Healthcare Support (100.0%), Personal Care & Service (83.3%), and Food Preparation & Serving (80.1%).
| Occupation | Male | Female |
| Healthcare Support | 0 (0.0%) | 133 (100.0%) |
| Security & Protection | 50 (76.9%) | 15 (23.1%) |
| Firefighting & Prevention | 7 (100.0%) | 0 (0.0%) |
| Law Enforcement | 43 (74.1%) | 15 (25.9%) |
| Food Preparation & Serving | 34 (19.9%) | 137 (80.1%) |
| Cleaning & Maintenance | 48 (42.5%) | 65 (57.5%) |
| Personal Care & Service | 6 (16.7%) | 30 (83.3%) |
| Total (Category) | 138 (26.6%) | 380 (73.4%) |
| Total (Overall) | 1,237 (54.4%) | 1,037 (45.6%) |
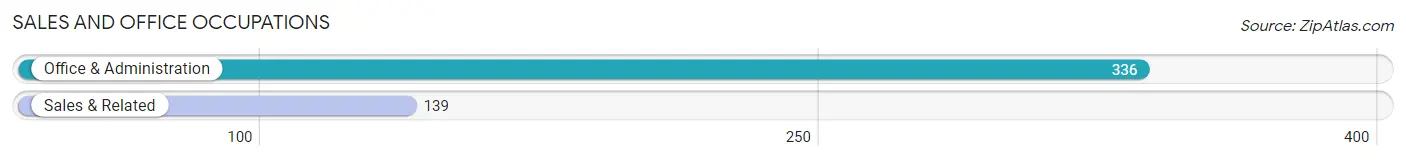
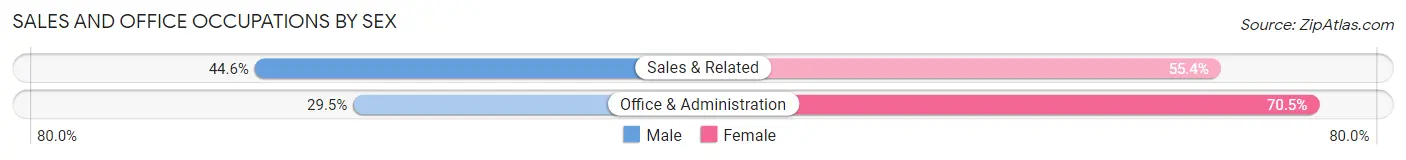
Sales and Office Occupations
The most common Sales and Office occupations in Wheeler County are Office & Administration (336 | 14.8%), and Sales & Related (139 | 6.1%).
Sales and Office Occupations by Sex
| Occupation | Male | Female |
| Sales & Related | 62 (44.6%) | 77 (55.4%) |
| Office & Administration | 99 (29.5%) | 237 (70.5%) |
| Total (Category) | 161 (33.9%) | 314 (66.1%) |
| Total (Overall) | 1,237 (54.4%) | 1,037 (45.6%) |
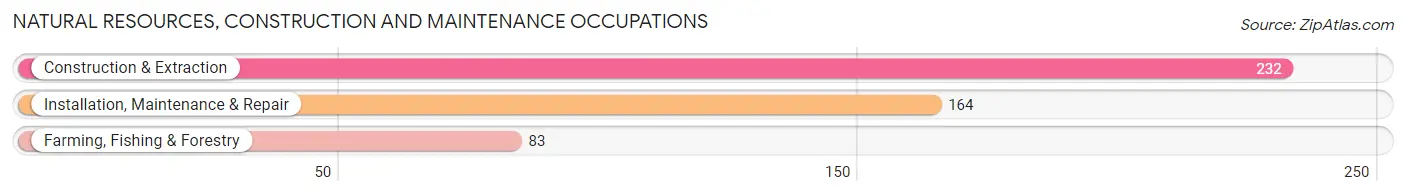
Natural Resources, Construction and Maintenance Occupations
The most common Natural Resources, Construction and Maintenance occupations in Wheeler County are Construction & Extraction (232 | 10.2%), Installation, Maintenance & Repair (164 | 7.2%), and Farming, Fishing & Forestry (83 | 3.6%).
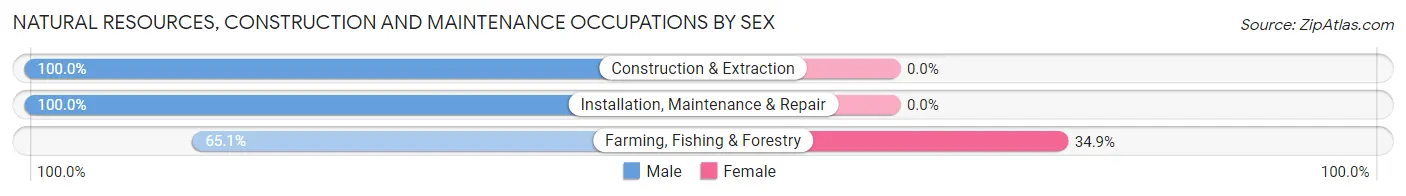
Natural Resources, Construction and Maintenance Occupations by Sex
| Occupation | Male | Female |
| Farming, Fishing & Forestry | 54 (65.1%) | 29 (34.9%) |
| Construction & Extraction | 232 (100.0%) | 0 (0.0%) |
| Installation, Maintenance & Repair | 164 (100.0%) | 0 (0.0%) |
| Total (Category) | 450 (94.0%) | 29 (6.0%) |
| Total (Overall) | 1,237 (54.4%) | 1,037 (45.6%) |
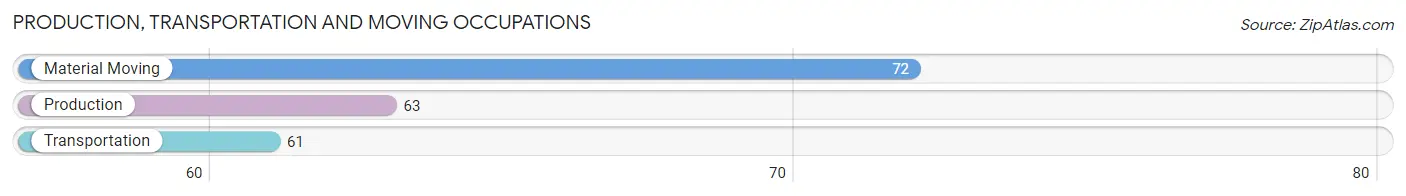
Production, Transportation and Moving Occupations
The most common Production, Transportation and Moving occupations in Wheeler County are Material Moving (72 | 3.2%), Production (63 | 2.8%), and Transportation (61 | 2.7%).
Production, Transportation and Moving Occupations by Sex

| Occupation | Male | Female |
| Production | 56 (88.9%) | 7 (11.1%) |
| Transportation | 61 (100.0%) | 0 (0.0%) |
| Material Moving | 55 (76.4%) | 17 (23.6%) |
| Total (Category) | 172 (87.8%) | 24 (12.2%) |
| Total (Overall) | 1,237 (54.4%) | 1,037 (45.6%) |
Employment Industries by Sex in Wheeler County
Employment Industries in Wheeler County
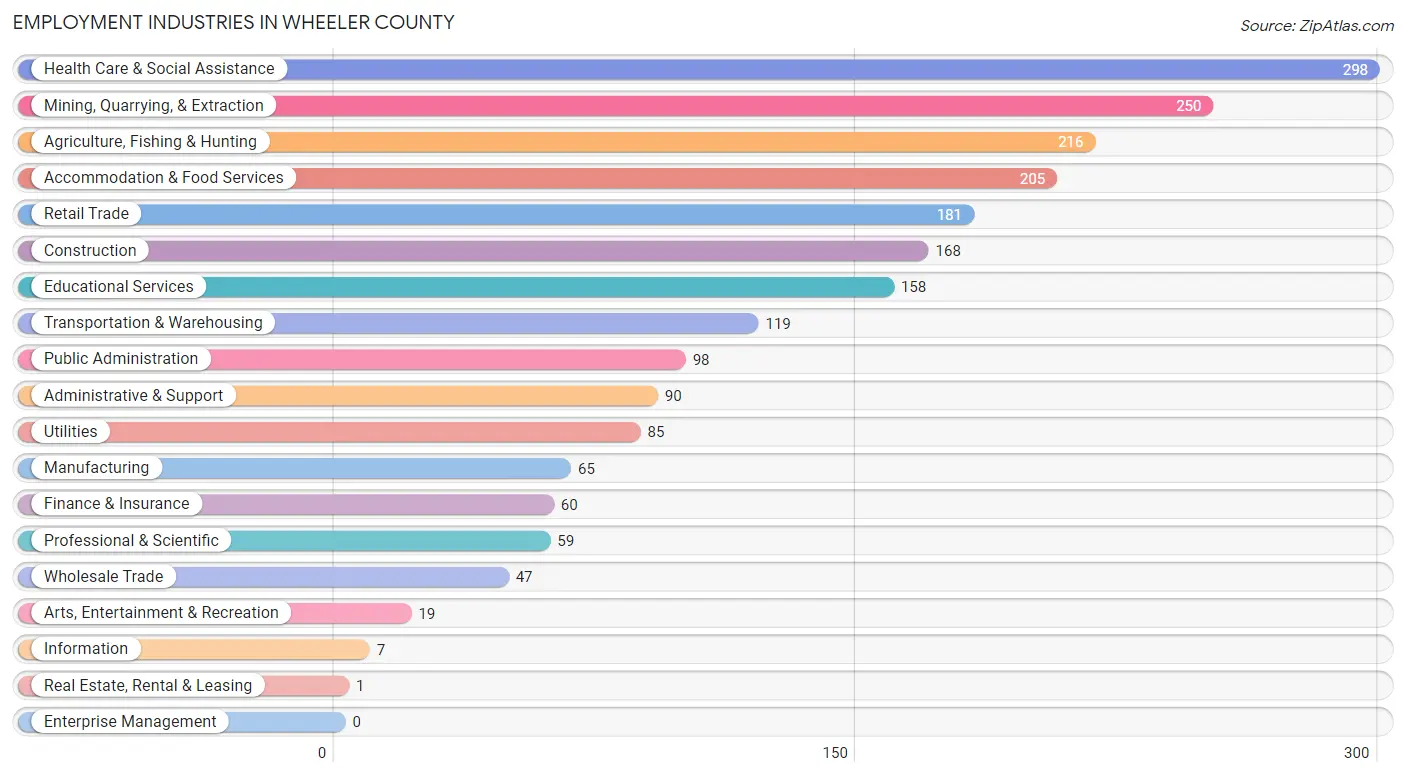
The major employment industries in Wheeler County include Health Care & Social Assistance (298 | 13.1%), Mining, Quarrying, & Extraction (250 | 11.0%), Agriculture, Fishing & Hunting (216 | 9.5%), Accommodation & Food Services (205 | 9.0%), and Retail Trade (181 | 8.0%).
Employment Industries by Sex in Wheeler County
The Wheeler County industries that see more men than women are Construction (92.9%), Agriculture, Fishing & Hunting (88.9%), and Transportation & Warehousing (85.7%), whereas the industries that tend to have a higher number of women are Information (100.0%), Real Estate, Rental & Leasing (100.0%), and Health Care & Social Assistance (87.9%).
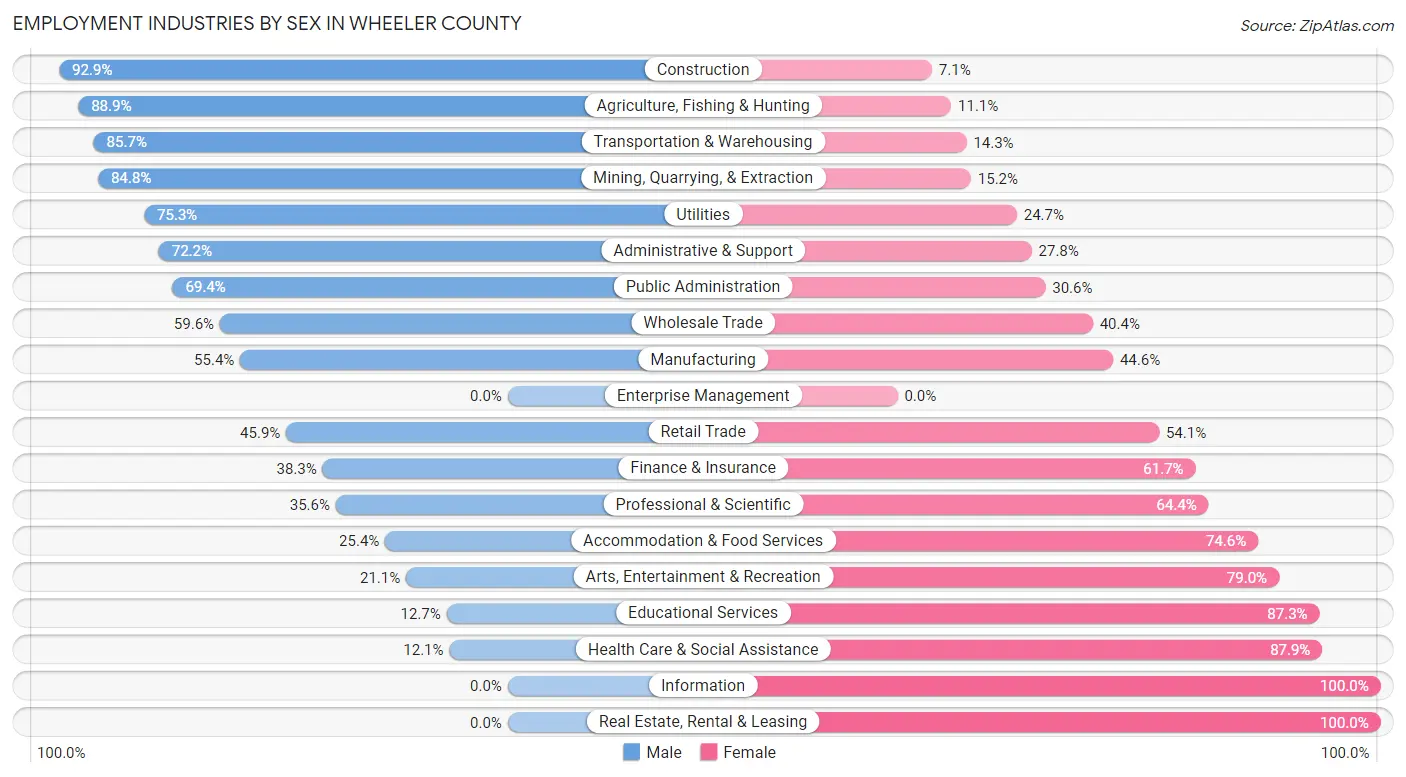
| Industry | Male | Female |
| Agriculture, Fishing & Hunting | 192 (88.9%) | 24 (11.1%) |
| Mining, Quarrying, & Extraction | 212 (84.8%) | 38 (15.2%) |
| Construction | 156 (92.9%) | 12 (7.1%) |
| Manufacturing | 36 (55.4%) | 29 (44.6%) |
| Wholesale Trade | 28 (59.6%) | 19 (40.4%) |
| Retail Trade | 83 (45.9%) | 98 (54.1%) |
| Transportation & Warehousing | 102 (85.7%) | 17 (14.3%) |
| Utilities | 64 (75.3%) | 21 (24.7%) |
| Information | 0 (0.0%) | 7 (100.0%) |
| Finance & Insurance | 23 (38.3%) | 37 (61.7%) |
| Real Estate, Rental & Leasing | 0 (0.0%) | 1 (100.0%) |
| Professional & Scientific | 21 (35.6%) | 38 (64.4%) |
| Enterprise Management | 0 (0.0%) | 0 (0.0%) |
| Administrative & Support | 65 (72.2%) | 25 (27.8%) |
| Educational Services | 20 (12.7%) | 138 (87.3%) |
| Health Care & Social Assistance | 36 (12.1%) | 262 (87.9%) |
| Arts, Entertainment & Recreation | 4 (21.0%) | 15 (78.9%) |
| Accommodation & Food Services | 52 (25.4%) | 153 (74.6%) |
| Public Administration | 68 (69.4%) | 30 (30.6%) |
| Total | 1,237 (54.4%) | 1,037 (45.6%) |
Education in Wheeler County
School Enrollment in Wheeler County
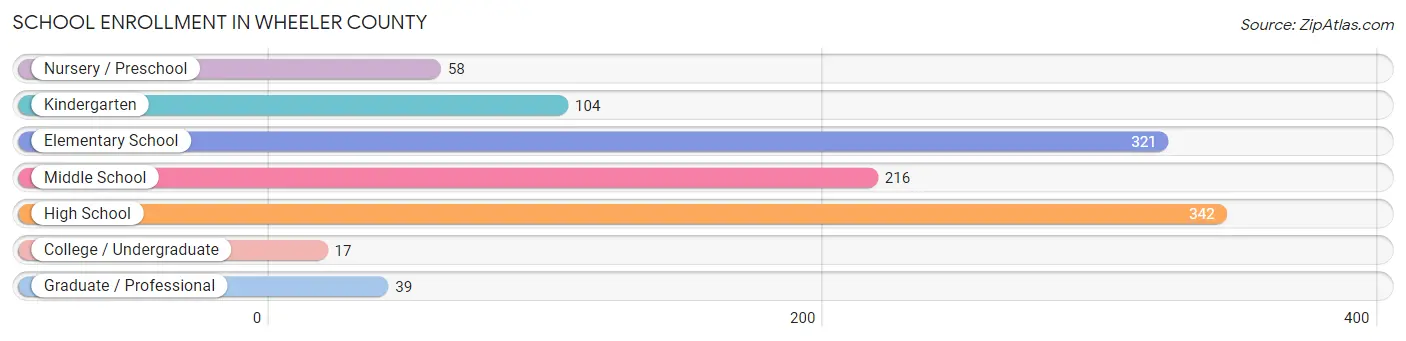
The most common levels of schooling among the 1,097 students in Wheeler County are high school (342 | 31.2%), elementary school (321 | 29.3%), and middle school (216 | 19.7%).
| School Level | # Students | % Students |
| Nursery / Preschool | 58 | 5.3% |
| Kindergarten | 104 | 9.5% |
| Elementary School | 321 | 29.3% |
| Middle School | 216 | 19.7% |
| High School | 342 | 31.2% |
| College / Undergraduate | 17 | 1.5% |
| Graduate / Professional | 39 | 3.6% |
| Total | 1,097 | 100.0% |
School Enrollment by Age by Funding Source in Wheeler County
Out of a total of 1,097 students who are enrolled in schools in Wheeler County, 29 (2.6%) attend a private institution, while the remaining 1,068 (97.4%) are enrolled in public schools. The age group of 10 to 14 year olds has the highest likelihood of being enrolled in private schools, with 20 (6.7% in the age bracket) enrolled. Conversely, the age group of 3 to 4 year olds has the lowest likelihood of being enrolled in a private school, with 40 (100.0% in the age bracket) attending a public institution.
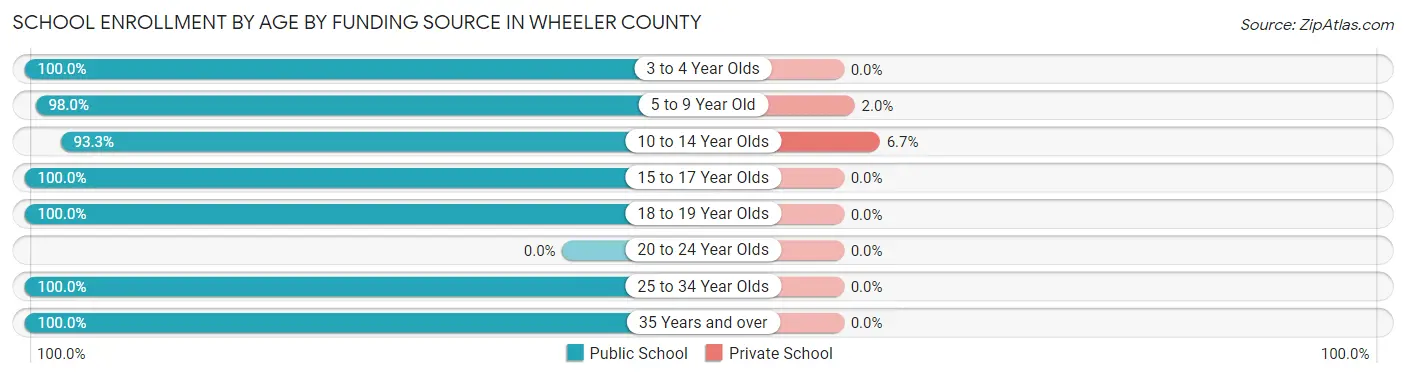
| Age Bracket | Public School | Private School |
| 3 to 4 Year Olds | 40 (100.0%) | 0 (0.0%) |
| 5 to 9 Year Old | 387 (98.0%) | 8 (2.0%) |
| 10 to 14 Year Olds | 278 (93.3%) | 20 (6.7%) |
| 15 to 17 Year Olds | 216 (100.0%) | 0 (0.0%) |
| 18 to 19 Year Olds | 94 (100.0%) | 0 (0.0%) |
| 20 to 24 Year Olds | 0 (0.0%) | 0 (0.0%) |
| 25 to 34 Year Olds | 6 (100.0%) | 0 (0.0%) |
| 35 Years and over | 48 (100.0%) | 0 (0.0%) |
| Total | 1,068 (97.4%) | 29 (2.6%) |
Educational Attainment by Field of Study in Wheeler County
Education (160 | 25.7%), science & technology (84 | 13.5%), business (78 | 12.5%), bio, nature & agricultural (63 | 10.1%), and liberal arts & history (58 | 9.3%) are the most common fields of study among 622 individuals in Wheeler County who have obtained a bachelor's degree or higher.
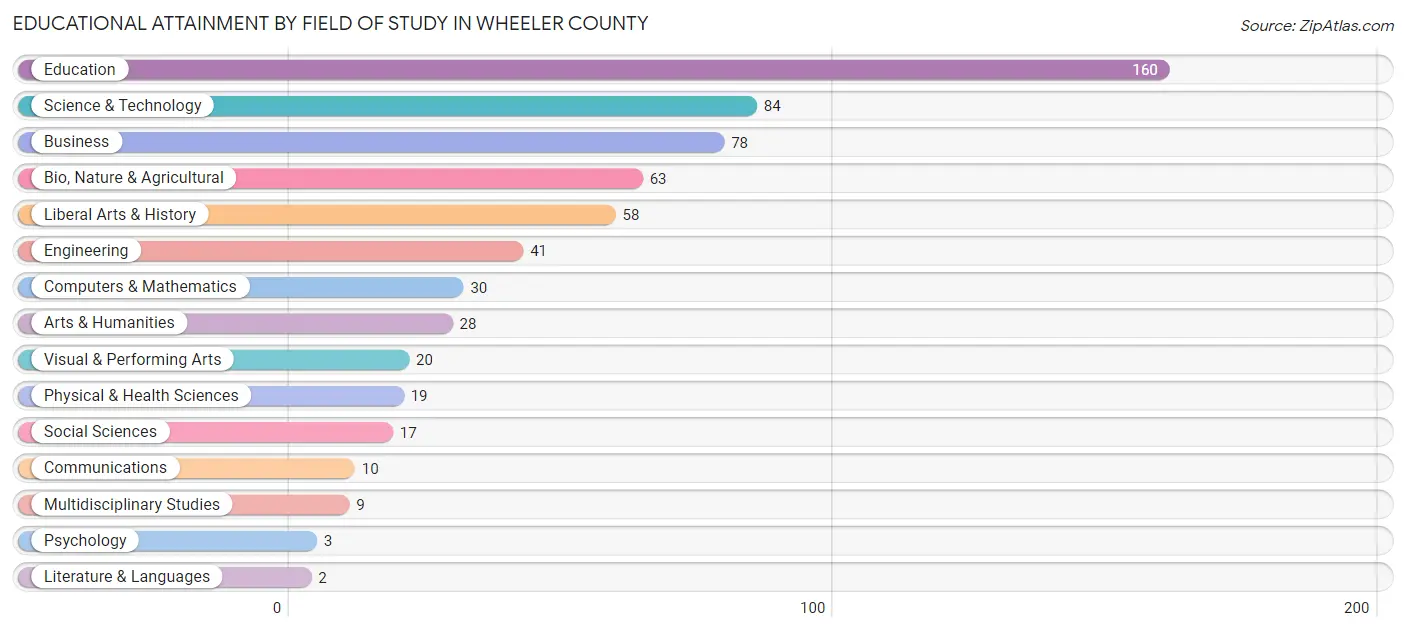
| Field of Study | # Graduates | % Graduates |
| Computers & Mathematics | 30 | 4.8% |
| Bio, Nature & Agricultural | 63 | 10.1% |
| Physical & Health Sciences | 19 | 3.0% |
| Psychology | 3 | 0.5% |
| Social Sciences | 17 | 2.7% |
| Engineering | 41 | 6.6% |
| Multidisciplinary Studies | 9 | 1.5% |
| Science & Technology | 84 | 13.5% |
| Business | 78 | 12.5% |
| Education | 160 | 25.7% |
| Literature & Languages | 2 | 0.3% |
| Liberal Arts & History | 58 | 9.3% |
| Visual & Performing Arts | 20 | 3.2% |
| Communications | 10 | 1.6% |
| Arts & Humanities | 28 | 4.5% |
| Total | 622 | 100.0% |
Transportation & Commute in Wheeler County
Vehicle Availability by Sex in Wheeler County
The most prevalent vehicle ownership categories in Wheeler County are males with 2 vehicles (525, accounting for 42.4%) and females with 2 vehicles (482, making up 50.9%).
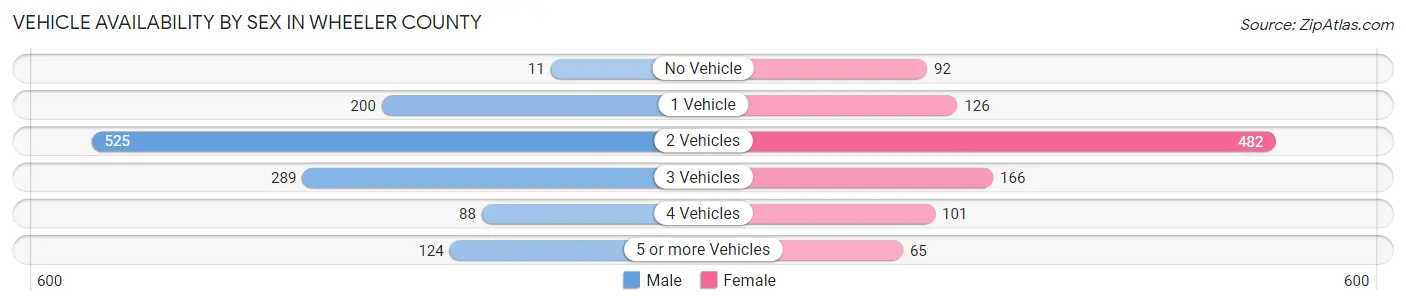
| Vehicles Available | Male | Female |
| No Vehicle | 11 (0.9%) | 92 (8.9%) |
| 1 Vehicle | 200 (16.2%) | 126 (12.2%) |
| 2 Vehicles | 525 (42.4%) | 482 (46.7%) |
| 3 Vehicles | 289 (23.4%) | 166 (16.1%) |
| 4 Vehicles | 88 (7.1%) | 101 (9.8%) |
| 5 or more Vehicles | 124 (10.0%) | 65 (6.3%) |
| Total | 1,237 (100.0%) | 1,032 (100.0%) |
Commute Time in Wheeler County
The most frequently occuring commute durations in Wheeler County are 5 to 9 minutes (413 commuters, 18.8%), less than 5 minutes (408 commuters, 18.6%), and 30 to 34 minutes (323 commuters, 14.7%).
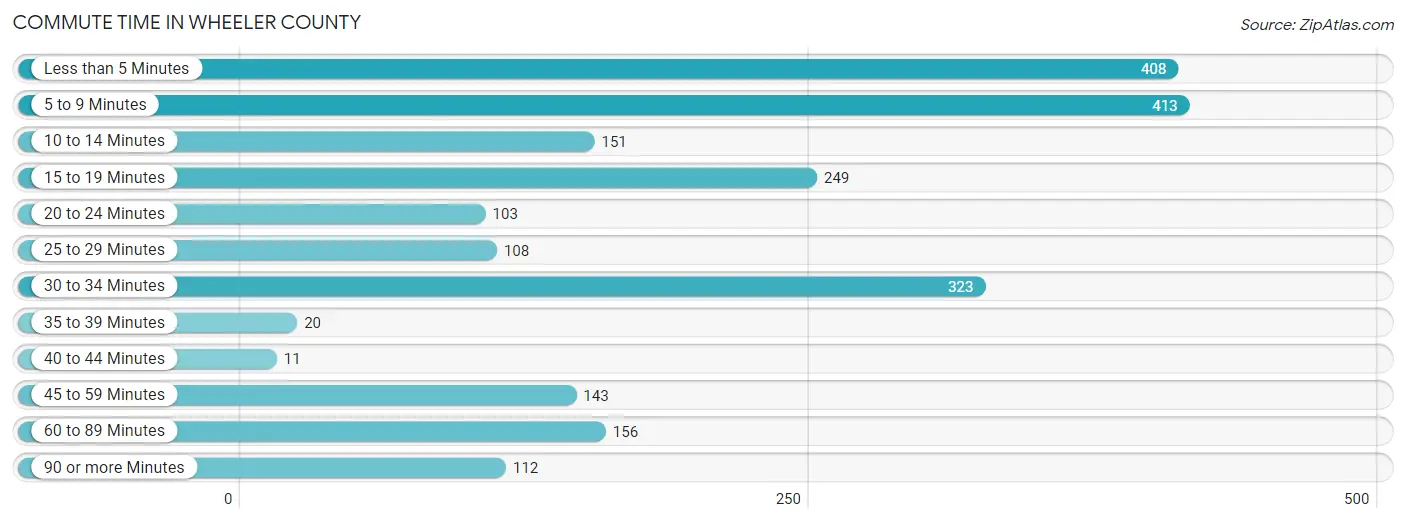
| Commute Time | # Commuters | % Commuters |
| Less than 5 Minutes | 408 | 18.6% |
| 5 to 9 Minutes | 413 | 18.8% |
| 10 to 14 Minutes | 151 | 6.9% |
| 15 to 19 Minutes | 249 | 11.3% |
| 20 to 24 Minutes | 103 | 4.7% |
| 25 to 29 Minutes | 108 | 4.9% |
| 30 to 34 Minutes | 323 | 14.7% |
| 35 to 39 Minutes | 20 | 0.9% |
| 40 to 44 Minutes | 11 | 0.5% |
| 45 to 59 Minutes | 143 | 6.5% |
| 60 to 89 Minutes | 156 | 7.1% |
| 90 or more Minutes | 112 | 5.1% |
Commute Time by Sex in Wheeler County
The most common commute times in Wheeler County are 5 to 9 minutes (228 commuters, 19.2%) for males and less than 5 minutes (242 commuters, 24.0%) for females.
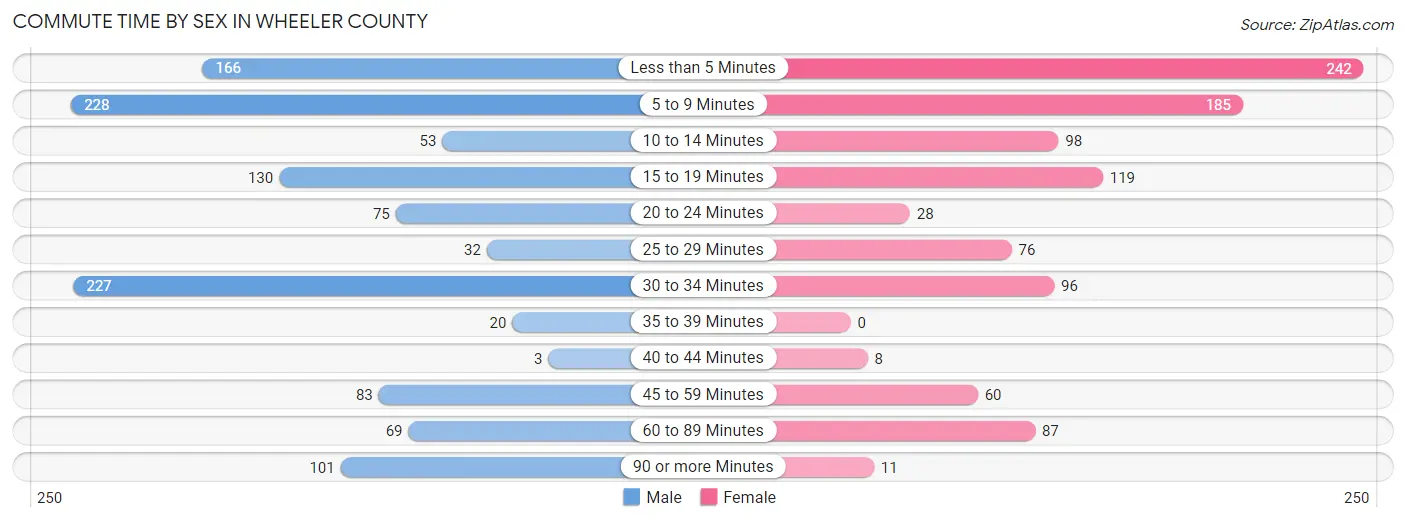
| Commute Time | Male | Female |
| Less than 5 Minutes | 166 (14.0%) | 242 (24.0%) |
| 5 to 9 Minutes | 228 (19.2%) | 185 (18.3%) |
| 10 to 14 Minutes | 53 (4.5%) | 98 (9.7%) |
| 15 to 19 Minutes | 130 (11.0%) | 119 (11.8%) |
| 20 to 24 Minutes | 75 (6.3%) | 28 (2.8%) |
| 25 to 29 Minutes | 32 (2.7%) | 76 (7.5%) |
| 30 to 34 Minutes | 227 (19.1%) | 96 (9.5%) |
| 35 to 39 Minutes | 20 (1.7%) | 0 (0.0%) |
| 40 to 44 Minutes | 3 (0.3%) | 8 (0.8%) |
| 45 to 59 Minutes | 83 (7.0%) | 60 (5.9%) |
| 60 to 89 Minutes | 69 (5.8%) | 87 (8.6%) |
| 90 or more Minutes | 101 (8.5%) | 11 (1.1%) |
Time of Departure to Work by Sex in Wheeler County
The most frequent times of departure to work in Wheeler County are 7:00 AM to 7:29 AM (289, 24.3%) for males and 7:00 AM to 7:29 AM (182, 18.0%) for females.
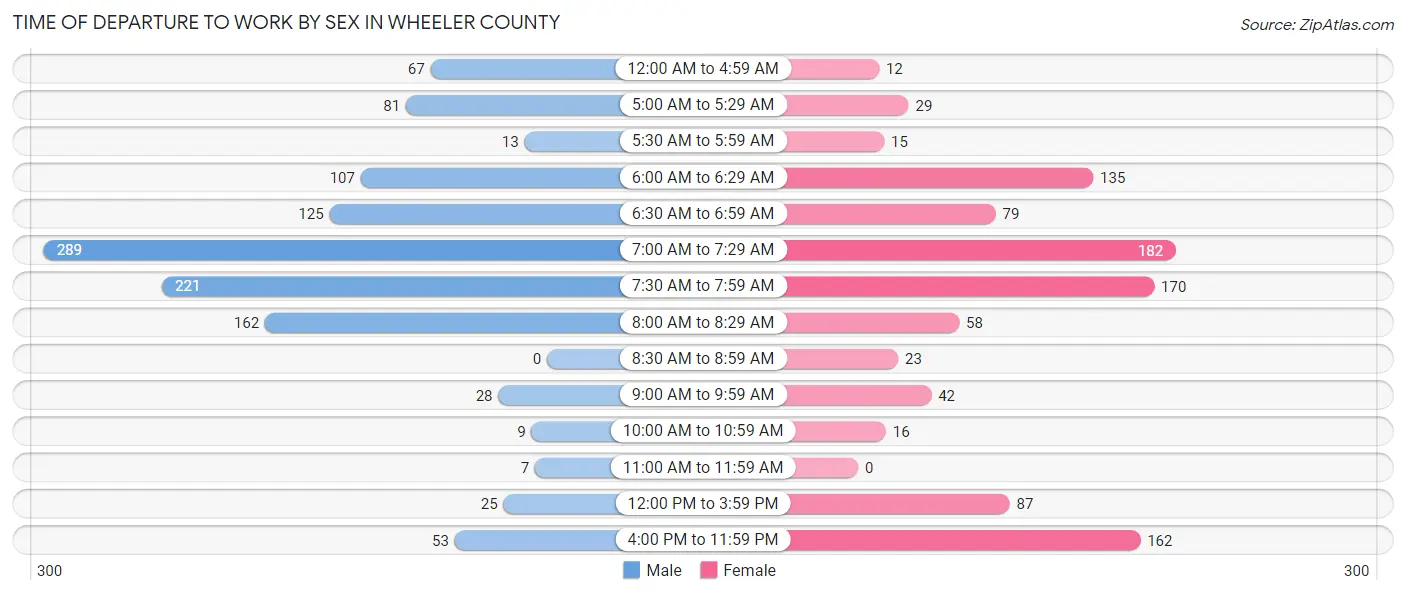
| Time of Departure | Male | Female |
| 12:00 AM to 4:59 AM | 67 (5.6%) | 12 (1.2%) |
| 5:00 AM to 5:29 AM | 81 (6.8%) | 29 (2.9%) |
| 5:30 AM to 5:59 AM | 13 (1.1%) | 15 (1.5%) |
| 6:00 AM to 6:29 AM | 107 (9.0%) | 135 (13.4%) |
| 6:30 AM to 6:59 AM | 125 (10.5%) | 79 (7.8%) |
| 7:00 AM to 7:29 AM | 289 (24.3%) | 182 (18.0%) |
| 7:30 AM to 7:59 AM | 221 (18.6%) | 170 (16.8%) |
| 8:00 AM to 8:29 AM | 162 (13.7%) | 58 (5.7%) |
| 8:30 AM to 8:59 AM | 0 (0.0%) | 23 (2.3%) |
| 9:00 AM to 9:59 AM | 28 (2.4%) | 42 (4.2%) |
| 10:00 AM to 10:59 AM | 9 (0.8%) | 16 (1.6%) |
| 11:00 AM to 11:59 AM | 7 (0.6%) | 0 (0.0%) |
| 12:00 PM to 3:59 PM | 25 (2.1%) | 87 (8.6%) |
| 4:00 PM to 11:59 PM | 53 (4.5%) | 162 (16.0%) |
| Total | 1,187 (100.0%) | 1,010 (100.0%) |
Housing Occupancy in Wheeler County
Occupancy by Ownership in Wheeler County
Of the total 1,908 dwellings in Wheeler County, owner-occupied units account for 1,403 (73.5%), while renter-occupied units make up 505 (26.5%).
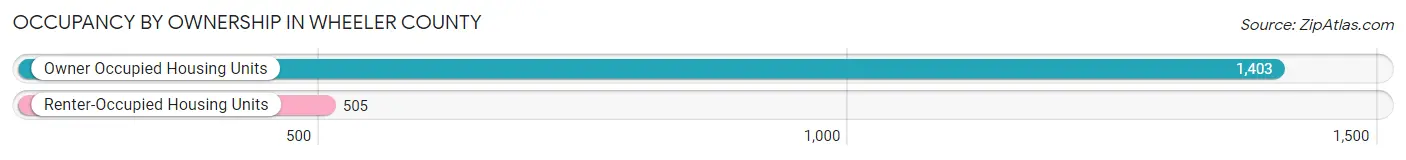
| Occupancy | # Housing Units | % Housing Units |
| Owner Occupied Housing Units | 1,403 | 73.5% |
| Renter-Occupied Housing Units | 505 | 26.5% |
| Total Occupied Housing Units | 1,908 | 100.0% |
Occupancy by Household Size in Wheeler County
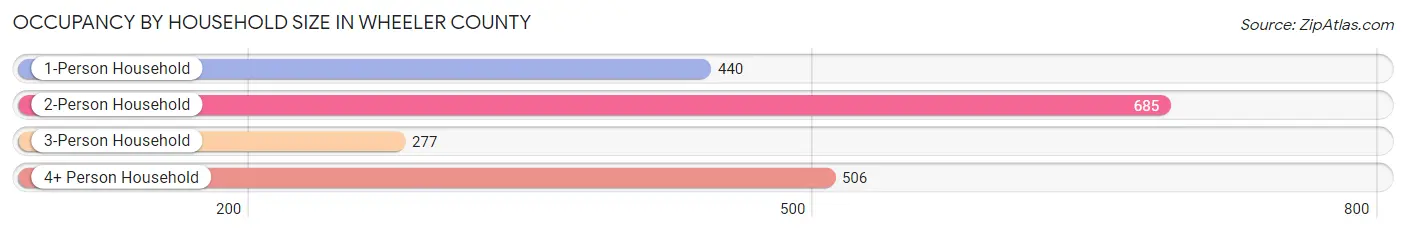
| Household Size | # Housing Units | % Housing Units |
| 1-Person Household | 440 | 23.1% |
| 2-Person Household | 685 | 35.9% |
| 3-Person Household | 277 | 14.5% |
| 4+ Person Household | 506 | 26.5% |
| Total Housing Units | 1,908 | 100.0% |
Occupancy by Ownership by Household Size in Wheeler County
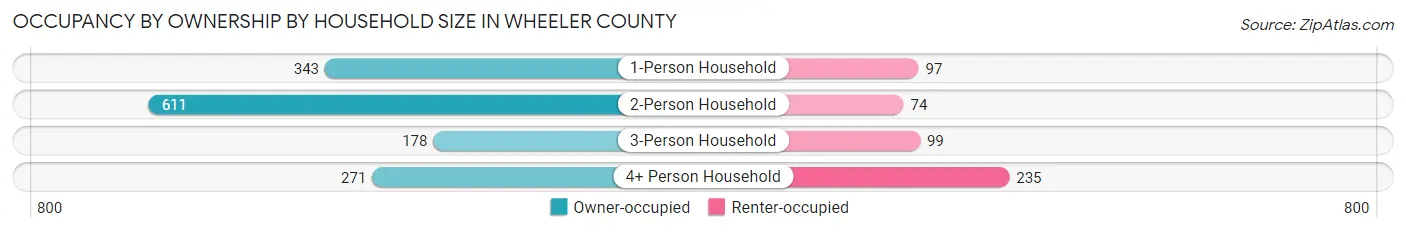
| Household Size | Owner-occupied | Renter-occupied |
| 1-Person Household | 343 (77.9%) | 97 (22.1%) |
| 2-Person Household | 611 (89.2%) | 74 (10.8%) |
| 3-Person Household | 178 (64.3%) | 99 (35.7%) |
| 4+ Person Household | 271 (53.6%) | 235 (46.4%) |
| Total Housing Units | 1,403 (73.5%) | 505 (26.5%) |
Occupancy by Educational Attainment in Wheeler County
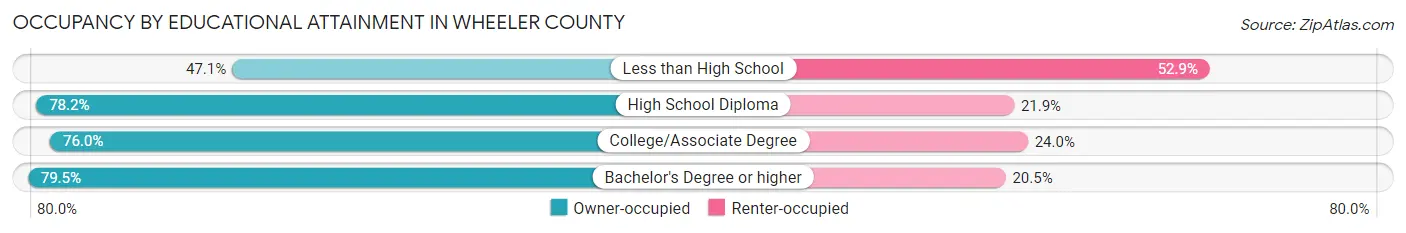
| Household Size | Owner-occupied | Renter-occupied |
| Less than High School | 122 (47.1%) | 137 (52.9%) |
| High School Diploma | 565 (78.1%) | 158 (21.8%) |
| College/Associate Degree | 433 (76.0%) | 137 (24.0%) |
| Bachelor's Degree or higher | 283 (79.5%) | 73 (20.5%) |
Occupancy by Age of Householder in Wheeler County
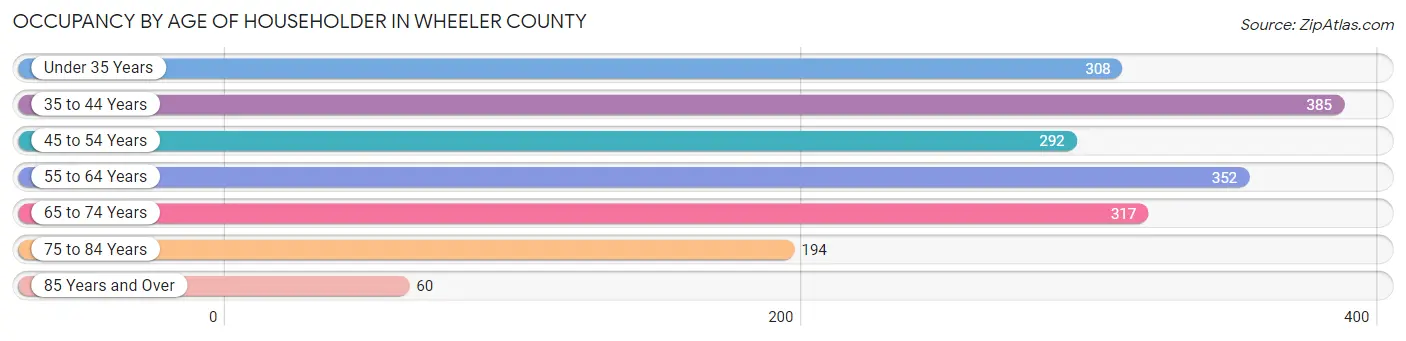
| Age Bracket | # Households | % Households |
| Under 35 Years | 308 | 16.1% |
| 35 to 44 Years | 385 | 20.2% |
| 45 to 54 Years | 292 | 15.3% |
| 55 to 64 Years | 352 | 18.4% |
| 65 to 74 Years | 317 | 16.6% |
| 75 to 84 Years | 194 | 10.2% |
| 85 Years and Over | 60 | 3.1% |
| Total | 1,908 | 100.0% |
Housing Finances in Wheeler County
Median Income by Occupancy in Wheeler County
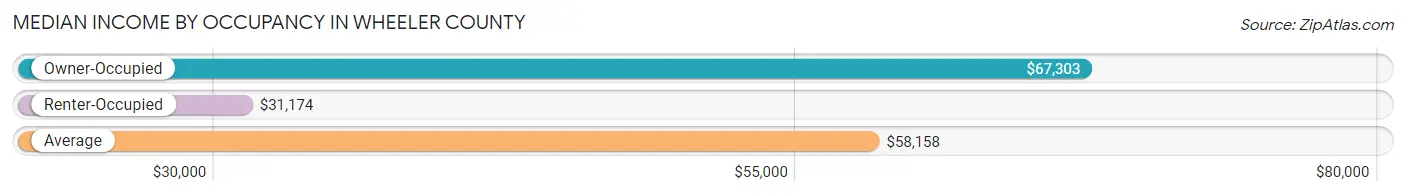
| Occupancy Type | # Households | Median Income |
| Owner-Occupied | 1,403 (73.5%) | $67,303 |
| Renter-Occupied | 505 (26.5%) | $31,174 |
| Average | 1,908 (100.0%) | $58,158 |
Occupancy by Householder Income Bracket in Wheeler County
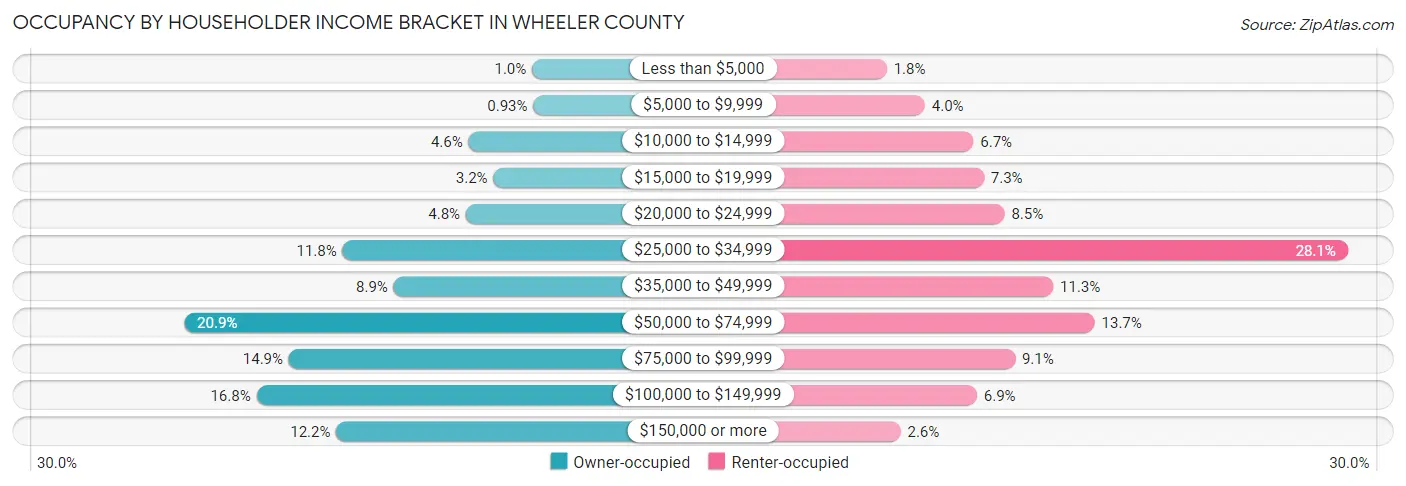
| Income Bracket | Owner-occupied | Renter-occupied |
| Less than $5,000 | 14 (1.0%) | 9 (1.8%) |
| $5,000 to $9,999 | 13 (0.9%) | 20 (4.0%) |
| $10,000 to $14,999 | 65 (4.6%) | 34 (6.7%) |
| $15,000 to $19,999 | 45 (3.2%) | 37 (7.3%) |
| $20,000 to $24,999 | 67 (4.8%) | 43 (8.5%) |
| $25,000 to $34,999 | 166 (11.8%) | 142 (28.1%) |
| $35,000 to $49,999 | 125 (8.9%) | 57 (11.3%) |
| $50,000 to $74,999 | 293 (20.9%) | 69 (13.7%) |
| $75,000 to $99,999 | 209 (14.9%) | 46 (9.1%) |
| $100,000 to $149,999 | 235 (16.8%) | 35 (6.9%) |
| $150,000 or more | 171 (12.2%) | 13 (2.6%) |
| Total | 1,403 (100.0%) | 505 (100.0%) |
Monthly Housing Cost Tiers in Wheeler County
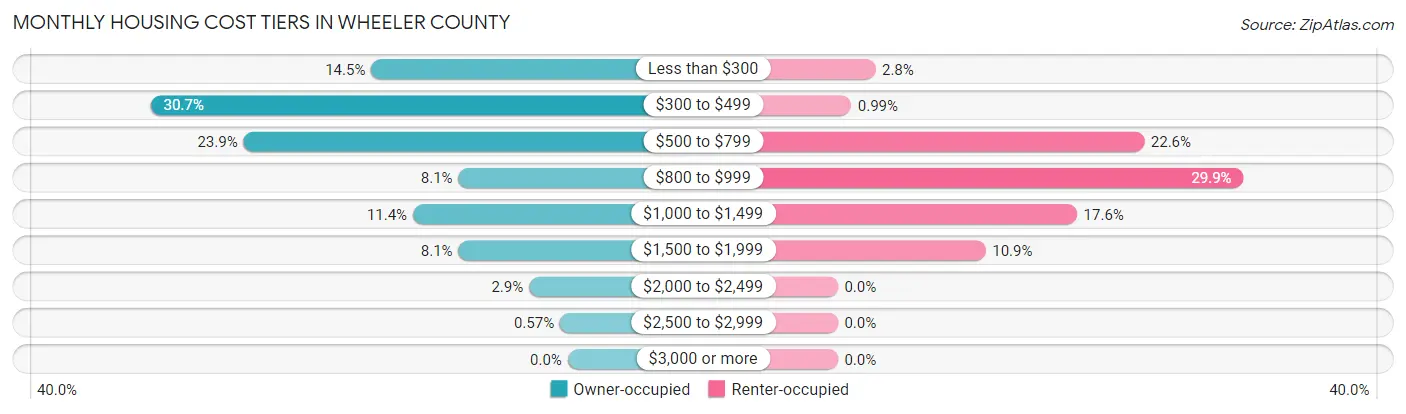
| Monthly Cost | Owner-occupied | Renter-occupied |
| Less than $300 | 203 (14.5%) | 14 (2.8%) |
| $300 to $499 | 431 (30.7%) | 5 (1.0%) |
| $500 to $799 | 335 (23.9%) | 114 (22.6%) |
| $800 to $999 | 113 (8.1%) | 151 (29.9%) |
| $1,000 to $1,499 | 160 (11.4%) | 89 (17.6%) |
| $1,500 to $1,999 | 113 (8.1%) | 55 (10.9%) |
| $2,000 to $2,499 | 40 (2.9%) | 0 (0.0%) |
| $2,500 to $2,999 | 8 (0.6%) | 0 (0.0%) |
| $3,000 or more | 0 (0.0%) | 0 (0.0%) |
| Total | 1,403 (100.0%) | 505 (100.0%) |
Physical Housing Characteristics in Wheeler County
Housing Structures in Wheeler County
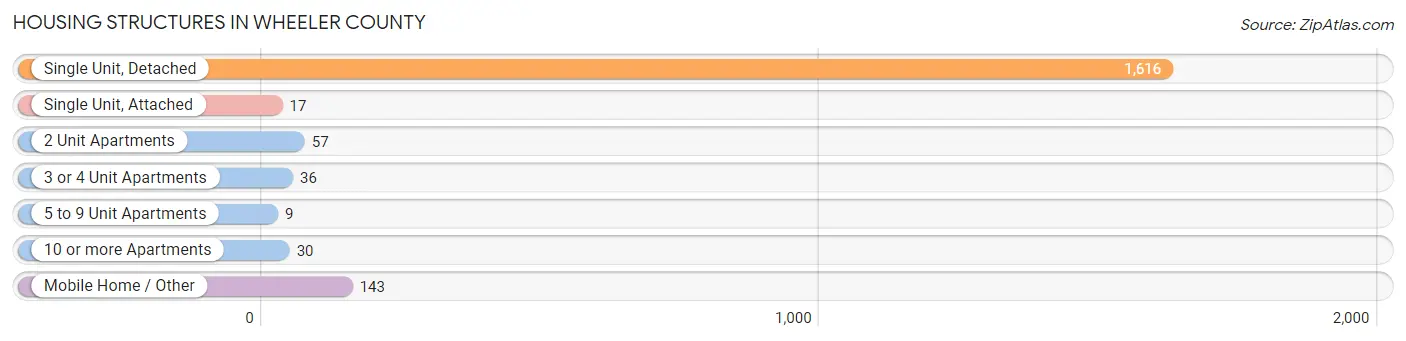
| Structure Type | # Housing Units | % Housing Units |
| Single Unit, Detached | 1,616 | 84.7% |
| Single Unit, Attached | 17 | 0.9% |
| 2 Unit Apartments | 57 | 3.0% |
| 3 or 4 Unit Apartments | 36 | 1.9% |
| 5 to 9 Unit Apartments | 9 | 0.5% |
| 10 or more Apartments | 30 | 1.6% |
| Mobile Home / Other | 143 | 7.5% |
| Total | 1,908 | 100.0% |
Housing Structures by Occupancy in Wheeler County
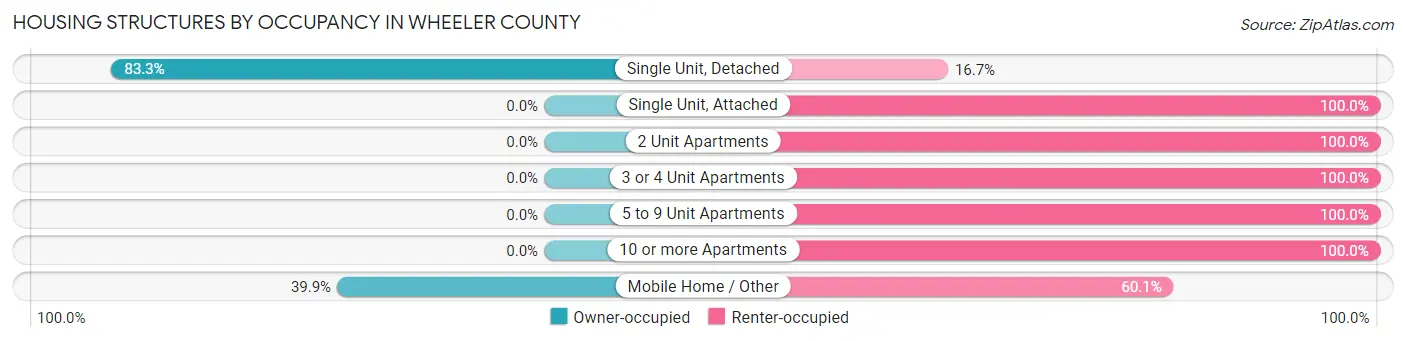
| Structure Type | Owner-occupied | Renter-occupied |
| Single Unit, Detached | 1,346 (83.3%) | 270 (16.7%) |
| Single Unit, Attached | 0 (0.0%) | 17 (100.0%) |
| 2 Unit Apartments | 0 (0.0%) | 57 (100.0%) |
| 3 or 4 Unit Apartments | 0 (0.0%) | 36 (100.0%) |
| 5 to 9 Unit Apartments | 0 (0.0%) | 9 (100.0%) |
| 10 or more Apartments | 0 (0.0%) | 30 (100.0%) |
| Mobile Home / Other | 57 (39.9%) | 86 (60.1%) |
| Total | 1,403 (73.5%) | 505 (26.5%) |
Housing Structures by Number of Rooms in Wheeler County
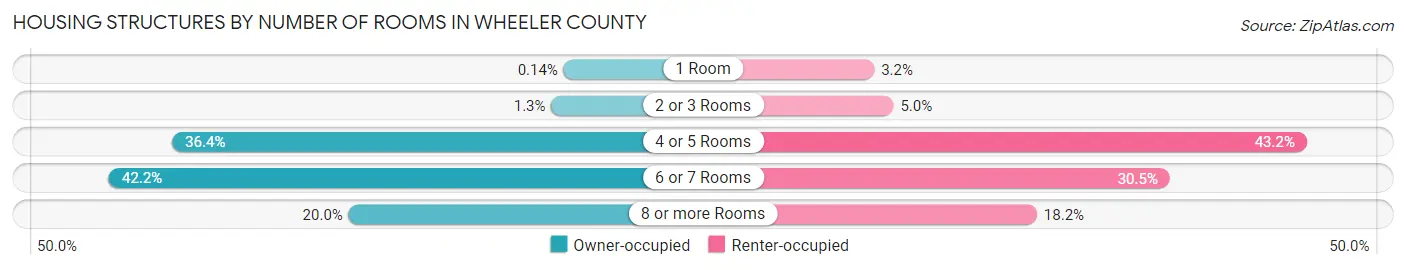
| Number of Rooms | Owner-occupied | Renter-occupied |
| 1 Room | 2 (0.1%) | 16 (3.2%) |
| 2 or 3 Rooms | 18 (1.3%) | 25 (5.0%) |
| 4 or 5 Rooms | 510 (36.3%) | 218 (43.2%) |
| 6 or 7 Rooms | 592 (42.2%) | 154 (30.5%) |
| 8 or more Rooms | 281 (20.0%) | 92 (18.2%) |
| Total | 1,403 (100.0%) | 505 (100.0%) |
Housing Structure by Heating Type in Wheeler County
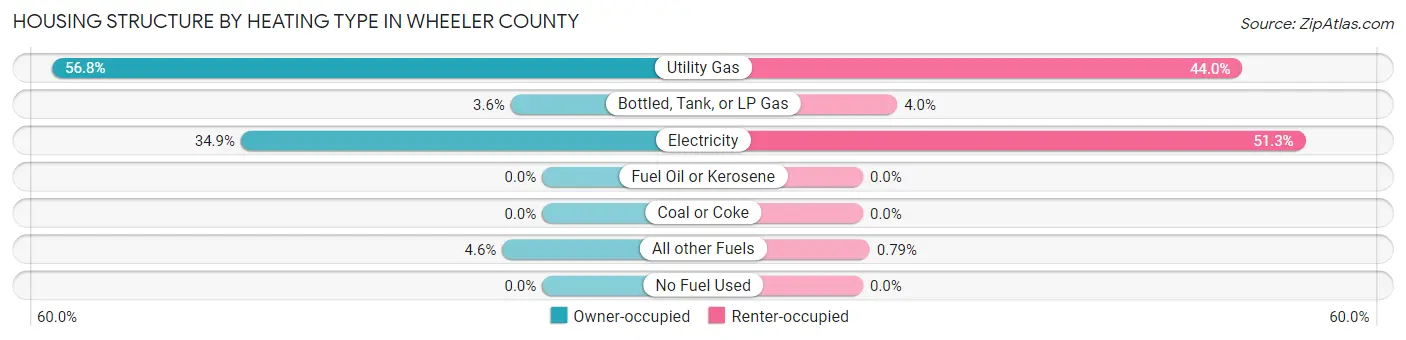
| Heating Type | Owner-occupied | Renter-occupied |
| Utility Gas | 797 (56.8%) | 222 (44.0%) |
| Bottled, Tank, or LP Gas | 51 (3.6%) | 20 (4.0%) |
| Electricity | 490 (34.9%) | 259 (51.3%) |
| Fuel Oil or Kerosene | 0 (0.0%) | 0 (0.0%) |
| Coal or Coke | 0 (0.0%) | 0 (0.0%) |
| All other Fuels | 65 (4.6%) | 4 (0.8%) |
| No Fuel Used | 0 (0.0%) | 0 (0.0%) |
| Total | 1,403 (100.0%) | 505 (100.0%) |
Household Vehicle Usage in Wheeler County
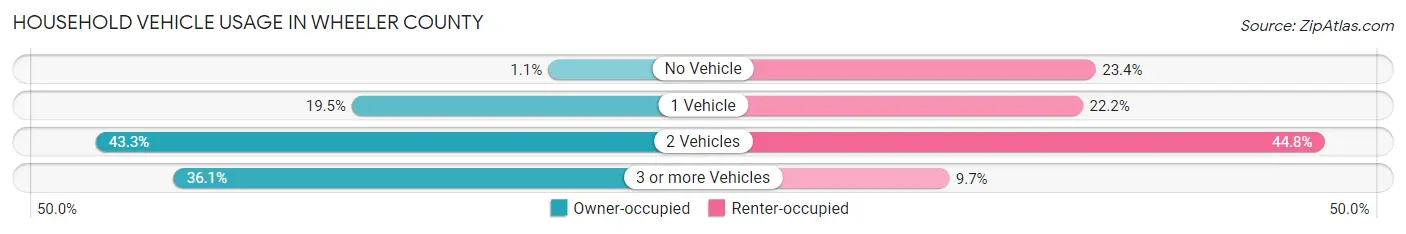
| Vehicles per Household | Owner-occupied | Renter-occupied |
| No Vehicle | 16 (1.1%) | 118 (23.4%) |
| 1 Vehicle | 273 (19.5%) | 112 (22.2%) |
| 2 Vehicles | 608 (43.3%) | 226 (44.8%) |
| 3 or more Vehicles | 506 (36.1%) | 49 (9.7%) |
| Total | 1,403 (100.0%) | 505 (100.0%) |
Real Estate & Mortgages in Wheeler County
Real Estate and Mortgage Overview in Wheeler County
| Characteristic | Without Mortgage | With Mortgage |
| Housing Units | 1,059 | 344 |
| Median Property Value | $100,300 | $123,300 |
| Median Household Income | $66,891 | $50 |
| Monthly Housing Costs | $450 | $0 |
| Real Estate Taxes | $1,356 | $9 |
Property Value by Mortgage Status in Wheeler County
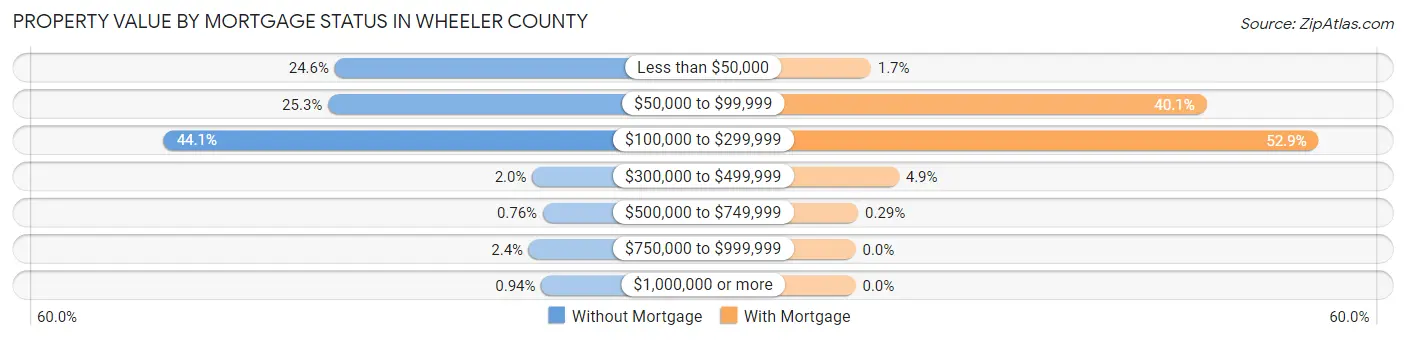
| Property Value | Without Mortgage | With Mortgage |
| Less than $50,000 | 260 (24.5%) | 6 (1.7%) |
| $50,000 to $99,999 | 268 (25.3%) | 138 (40.1%) |
| $100,000 to $299,999 | 467 (44.1%) | 182 (52.9%) |
| $300,000 to $499,999 | 21 (2.0%) | 17 (4.9%) |
| $500,000 to $749,999 | 8 (0.8%) | 1 (0.3%) |
| $750,000 to $999,999 | 25 (2.4%) | 0 (0.0%) |
| $1,000,000 or more | 10 (0.9%) | 0 (0.0%) |
| Total | 1,059 (100.0%) | 344 (100.0%) |
Household Income by Mortgage Status in Wheeler County
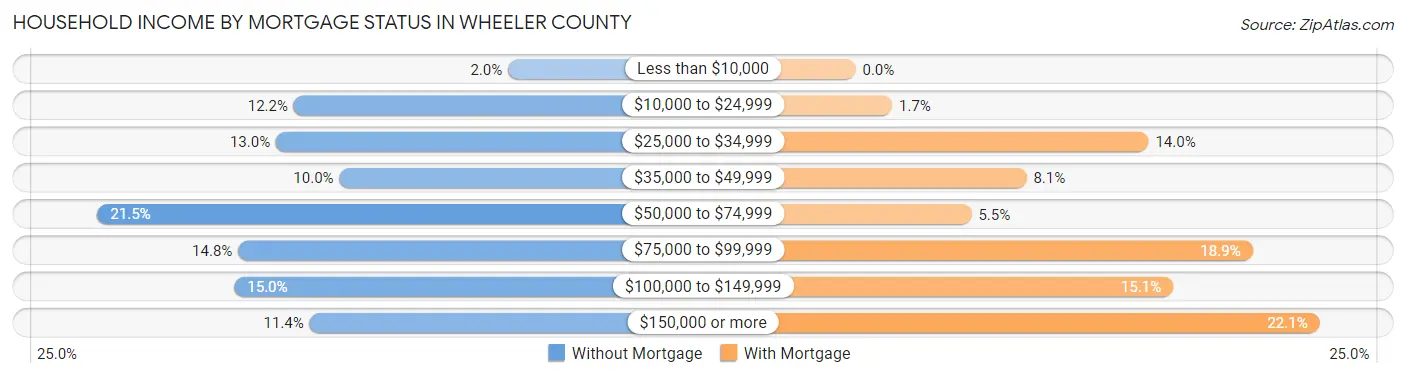
| Household Income | Without Mortgage | With Mortgage |
| Less than $10,000 | 21 (2.0%) | 0 (0.0%) |
| $10,000 to $24,999 | 129 (12.2%) | 6 (1.7%) |
| $25,000 to $34,999 | 138 (13.0%) | 48 (14.0%) |
| $35,000 to $49,999 | 106 (10.0%) | 28 (8.1%) |
| $50,000 to $74,999 | 228 (21.5%) | 19 (5.5%) |
| $75,000 to $99,999 | 157 (14.8%) | 65 (18.9%) |
| $100,000 to $149,999 | 159 (15.0%) | 52 (15.1%) |
| $150,000 or more | 121 (11.4%) | 76 (22.1%) |
| Total | 1,059 (100.0%) | 344 (100.0%) |
Property Value to Household Income Ratio in Wheeler County
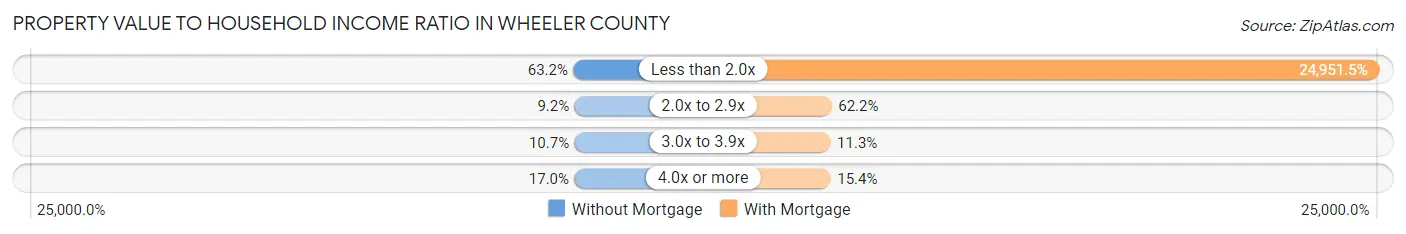
| Value-to-Income Ratio | Without Mortgage | With Mortgage |
| Less than 2.0x | 669 (63.2%) | 85,833 (24,951.4%) |
| 2.0x to 2.9x | 97 (9.2%) | 214 (62.2%) |
| 3.0x to 3.9x | 113 (10.7%) | 39 (11.3%) |
| 4.0x or more | 180 (17.0%) | 53 (15.4%) |
| Total | 1,059 (100.0%) | 344 (100.0%) |
Real Estate Taxes by Mortgage Status in Wheeler County
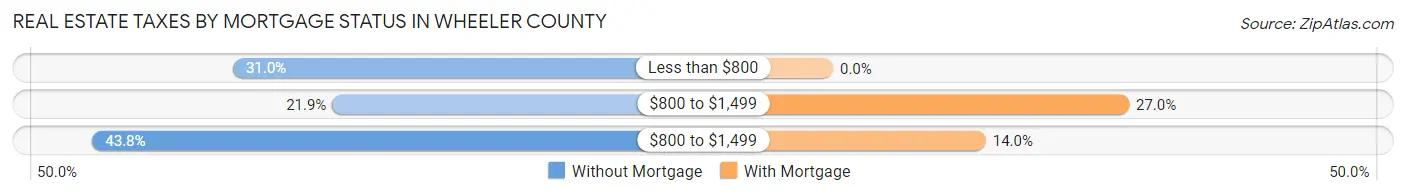
| Property Taxes | Without Mortgage | With Mortgage |
| Less than $800 | 328 (31.0%) | 0 (0.0%) |
| $800 to $1,499 | 232 (21.9%) | 93 (27.0%) |
| $800 to $1,499 | 464 (43.8%) | 48 (14.0%) |
| Total | 1,059 (100.0%) | 344 (100.0%) |
Health & Disability in Wheeler County
Health Insurance Coverage by Age in Wheeler County
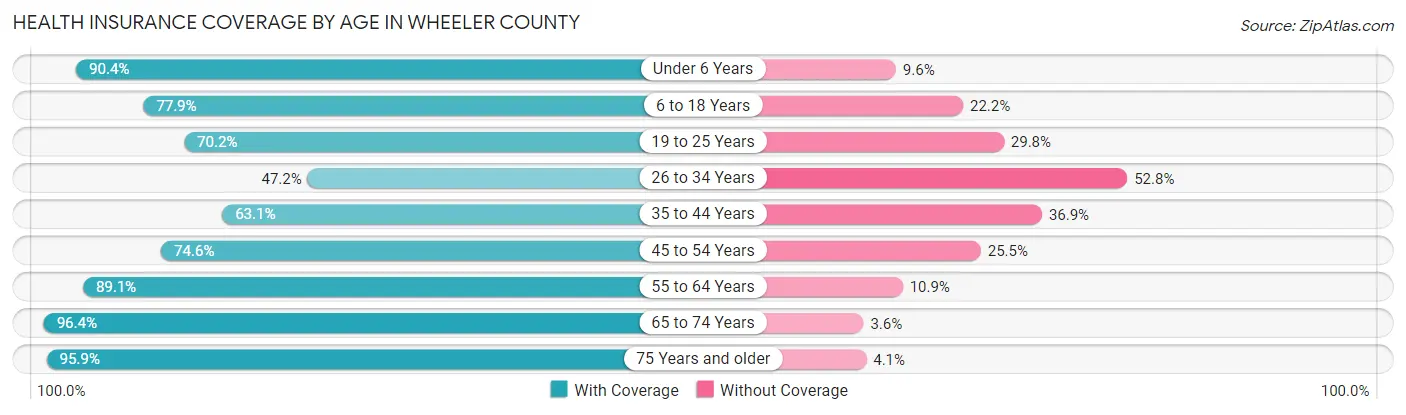
| Age Bracket | With Coverage | Without Coverage |
| Under 6 Years | 357 (90.4%) | 38 (9.6%) |
| 6 to 18 Years | 724 (77.8%) | 206 (22.2%) |
| 19 to 25 Years | 144 (70.2%) | 61 (29.8%) |
| 26 to 34 Years | 257 (47.2%) | 287 (52.8%) |
| 35 to 44 Years | 454 (63.1%) | 265 (36.9%) |
| 45 to 54 Years | 369 (74.6%) | 126 (25.5%) |
| 55 to 64 Years | 589 (89.1%) | 72 (10.9%) |
| 65 to 74 Years | 539 (96.4%) | 20 (3.6%) |
| 75 Years and older | 374 (95.9%) | 16 (4.1%) |
| Total | 3,807 (77.7%) | 1,091 (22.3%) |
Health Insurance Coverage by Citizenship Status in Wheeler County
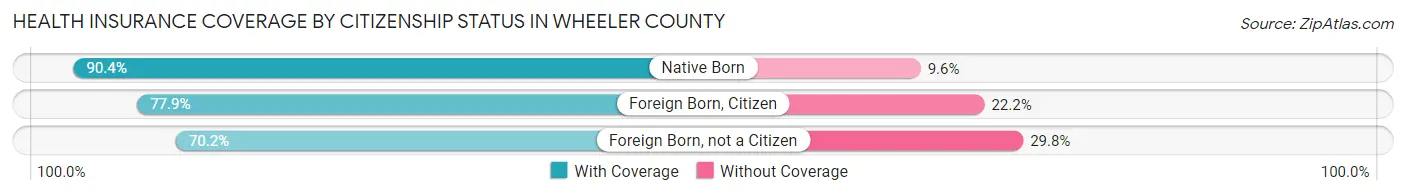
| Citizenship Status | With Coverage | Without Coverage |
| Native Born | 357 (90.4%) | 38 (9.6%) |
| Foreign Born, Citizen | 724 (77.8%) | 206 (22.2%) |
| Foreign Born, not a Citizen | 144 (70.2%) | 61 (29.8%) |
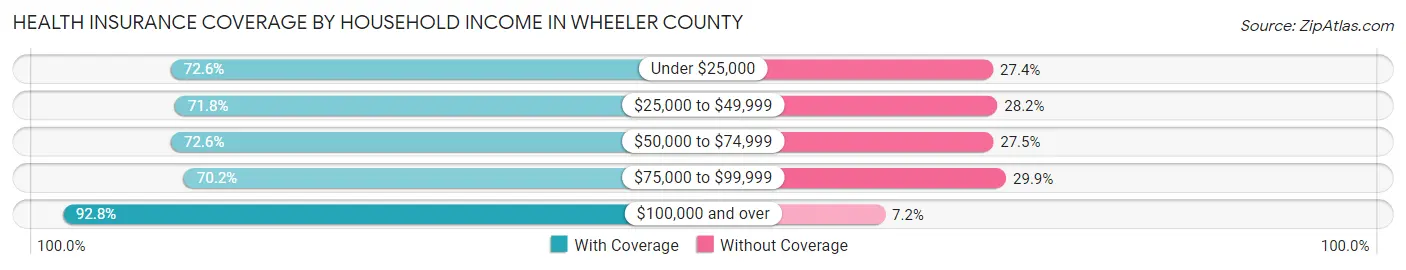
Health Insurance Coverage by Household Income in Wheeler County
| Household Income | With Coverage | Without Coverage |
| Under $25,000 | 524 (72.6%) | 198 (27.4%) |
| $25,000 to $49,999 | 827 (71.8%) | 325 (28.2%) |
| $50,000 to $74,999 | 674 (72.6%) | 255 (27.5%) |
| $75,000 to $99,999 | 503 (70.2%) | 214 (29.8%) |
| $100,000 and over | 1,279 (92.8%) | 99 (7.2%) |
Public vs Private Health Insurance Coverage by Age in Wheeler County
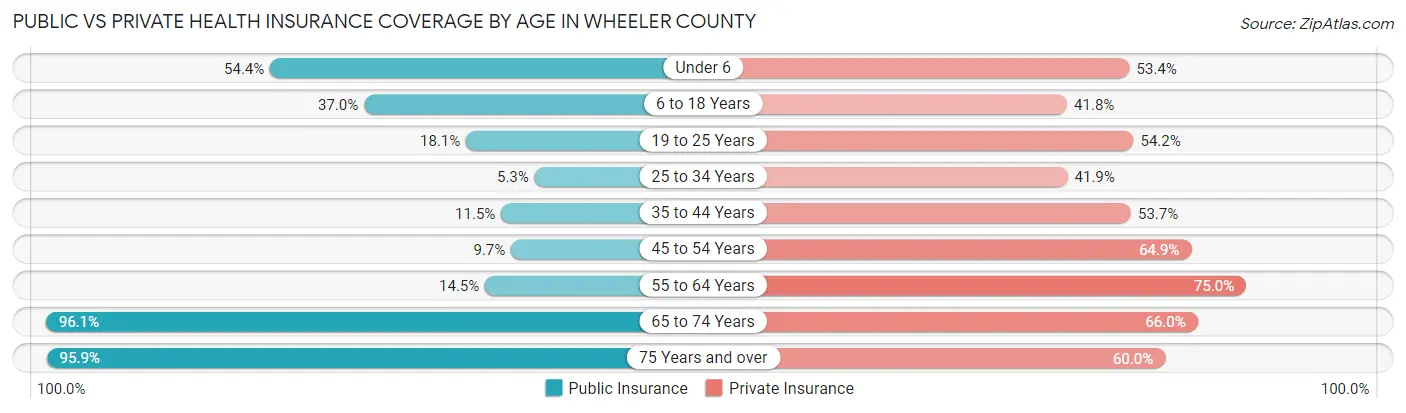
| Age Bracket | Public Insurance | Private Insurance |
| Under 6 | 215 (54.4%) | 211 (53.4%) |
| 6 to 18 Years | 344 (37.0%) | 389 (41.8%) |
| 19 to 25 Years | 37 (18.0%) | 111 (54.1%) |
| 25 to 34 Years | 29 (5.3%) | 228 (41.9%) |
| 35 to 44 Years | 83 (11.5%) | 386 (53.7%) |
| 45 to 54 Years | 48 (9.7%) | 321 (64.8%) |
| 55 to 64 Years | 96 (14.5%) | 496 (75.0%) |
| 65 to 74 Years | 537 (96.1%) | 369 (66.0%) |
| 75 Years and over | 374 (95.9%) | 234 (60.0%) |
| Total | 1,763 (36.0%) | 2,745 (56.0%) |
Disability Status by Sex by Age in Wheeler County
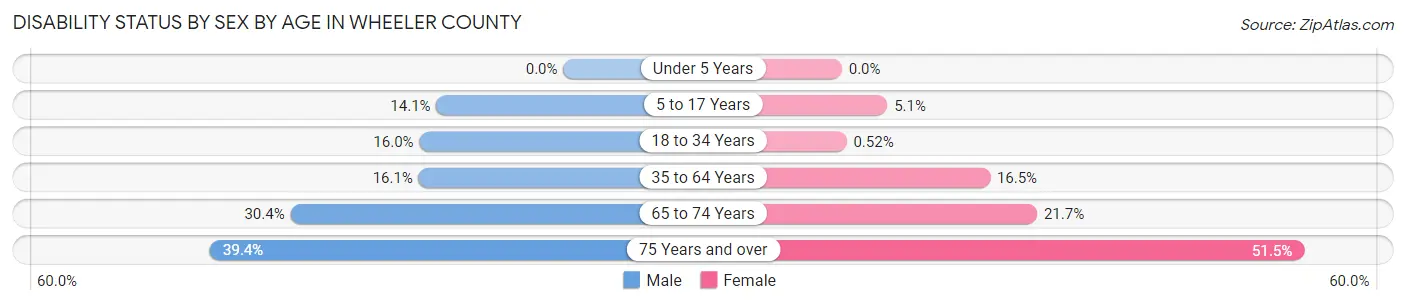
| Age Bracket | Male | Female |
| Under 5 Years | 0 (0.0%) | 0 (0.0%) |
| 5 to 17 Years | 69 (14.1%) | 22 (5.1%) |
| 18 to 34 Years | 75 (16.0%) | 2 (0.5%) |
| 35 to 64 Years | 140 (16.1%) | 166 (16.5%) |
| 65 to 74 Years | 86 (30.4%) | 60 (21.7%) |
| 75 Years and over | 74 (39.4%) | 104 (51.5%) |
Disability Class by Sex by Age in Wheeler County
Disability Class: Hearing Difficulty
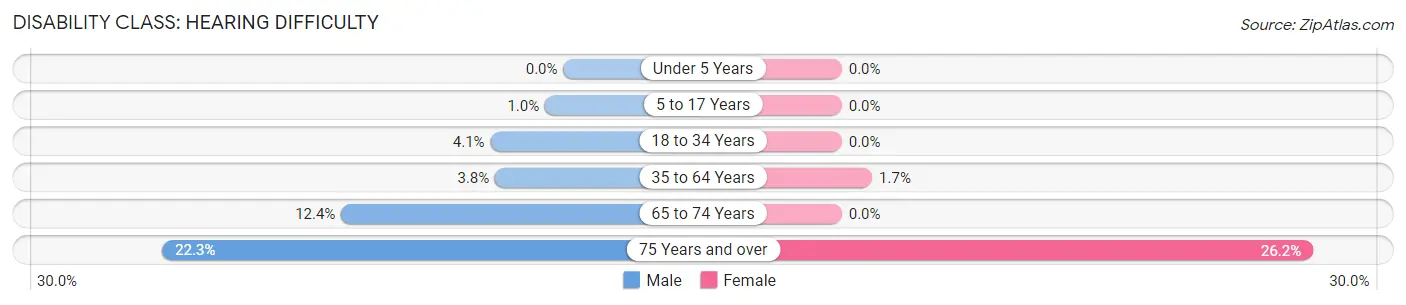
| Age Bracket | Male | Female |
| Under 5 Years | 0 (0.0%) | 0 (0.0%) |
| 5 to 17 Years | 5 (1.0%) | 0 (0.0%) |
| 18 to 34 Years | 19 (4.1%) | 0 (0.0%) |
| 35 to 64 Years | 33 (3.8%) | 17 (1.7%) |
| 65 to 74 Years | 35 (12.4%) | 0 (0.0%) |
| 75 Years and over | 42 (22.3%) | 53 (26.2%) |
Disability Class: Vision Difficulty

| Age Bracket | Male | Female |
| Under 5 Years | 0 (0.0%) | 0 (0.0%) |
| 5 to 17 Years | 18 (3.7%) | 0 (0.0%) |
| 18 to 34 Years | 28 (6.0%) | 0 (0.0%) |
| 35 to 64 Years | 33 (3.8%) | 17 (1.7%) |
| 65 to 74 Years | 20 (7.1%) | 6 (2.2%) |
| 75 Years and over | 4 (2.1%) | 9 (4.5%) |
Disability Class: Cognitive Difficulty
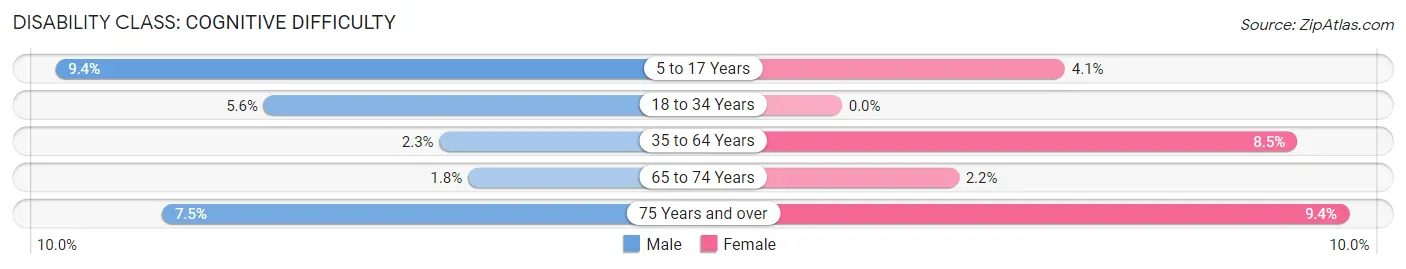
| Age Bracket | Male | Female |
| 5 to 17 Years | 46 (9.4%) | 18 (4.1%) |
| 18 to 34 Years | 26 (5.6%) | 0 (0.0%) |
| 35 to 64 Years | 20 (2.3%) | 85 (8.5%) |
| 65 to 74 Years | 5 (1.8%) | 6 (2.2%) |
| 75 Years and over | 14 (7.4%) | 19 (9.4%) |
Disability Class: Ambulatory Difficulty
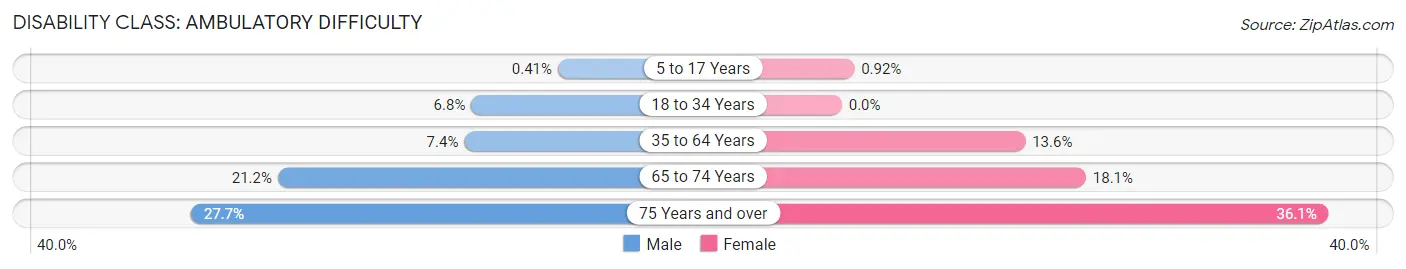
| Age Bracket | Male | Female |
| 5 to 17 Years | 2 (0.4%) | 4 (0.9%) |
| 18 to 34 Years | 32 (6.8%) | 0 (0.0%) |
| 35 to 64 Years | 64 (7.4%) | 137 (13.6%) |
| 65 to 74 Years | 60 (21.2%) | 50 (18.1%) |
| 75 Years and over | 52 (27.7%) | 73 (36.1%) |
Disability Class: Self-Care Difficulty
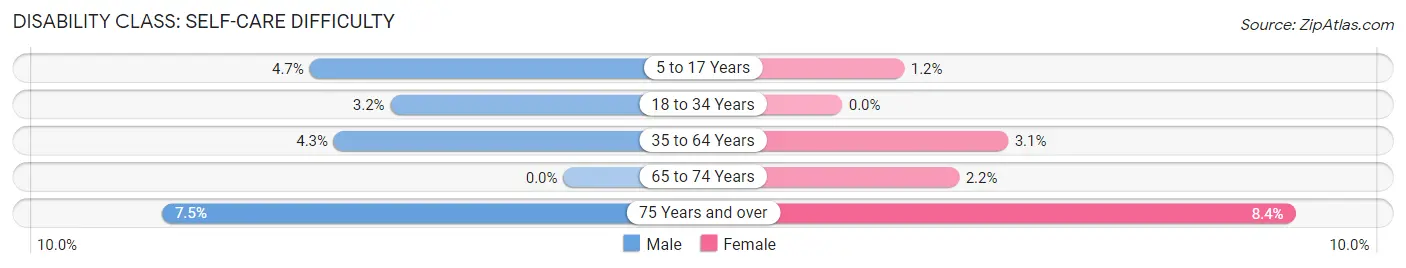
| Age Bracket | Male | Female |
| 5 to 17 Years | 23 (4.7%) | 5 (1.1%) |
| 18 to 34 Years | 15 (3.2%) | 0 (0.0%) |
| 35 to 64 Years | 37 (4.3%) | 31 (3.1%) |
| 65 to 74 Years | 0 (0.0%) | 6 (2.2%) |
| 75 Years and over | 14 (7.4%) | 17 (8.4%) |
Technology Access in Wheeler County
Computing Device Access in Wheeler County
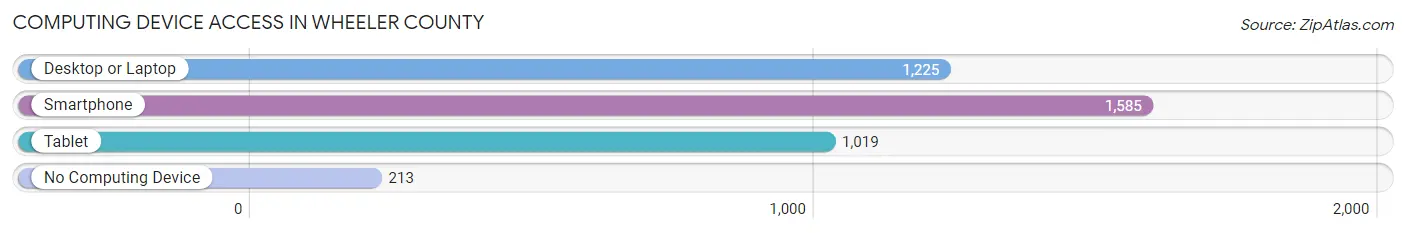
| Device Type | # Households | % Households |
| Desktop or Laptop | 1,225 | 64.2% |
| Smartphone | 1,585 | 83.1% |
| Tablet | 1,019 | 53.4% |
| No Computing Device | 213 | 11.2% |
| Total | 1,908 | 100.0% |
Internet Access in Wheeler County
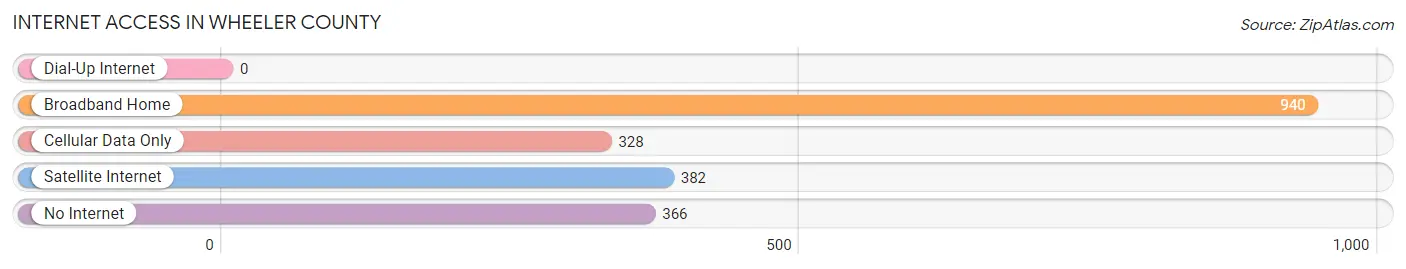
| Internet Type | # Households | % Households |
| Dial-Up Internet | 0 | 0.0% |
| Broadband Home | 940 | 49.3% |
| Cellular Data Only | 328 | 17.2% |
| Satellite Internet | 382 | 20.0% |
| No Internet | 366 | 19.2% |
| Total | 1,908 | 100.0% |
Wheeler County Summary
Wheeler County is located in the Texas Panhandle, in the northern part of the state. It is bordered by Collingsworth County to the north, Gray County to the east, Donley County to the south, and Roberts County to the west. The county seat is Wheeler, and the county has a total area of 902 square miles.
History
Wheeler County was established in 1876, and was named for Royal T. Wheeler, a Texas Supreme Court justice. The county was originally part of the Bexar District, and was later part of the Young County. In 1876, the Texas Legislature created Wheeler County from parts of Young and Bexar counties.
The first settlers in the area were ranchers, who were attracted by the abundance of grass and water. The first town in the county was Mobeetie, which was established in 1875. The town was a trading post for buffalo hunters and cowboys.
In 1879, the Texas and Pacific Railway was built through the county, and the town of Wheeler was established. The town was named after Royal T. Wheeler, and was designated as the county seat.
Geography
Wheeler County is located in the Texas Panhandle, in the northern part of the state. It is bordered by Collingsworth County to the north, Gray County to the east, Donley County to the south, and Roberts County to the west. The county has a total area of 902 square miles, of which 899 square miles is land and 3 square miles is water.
The terrain of the county is mostly flat, with some rolling hills. The county is part of the High Plains region, and is mostly covered in grasslands. The county is also home to several small lakes, including Lake Mobeetie and Lake Wheeler.
Economy
The economy of Wheeler County is largely based on agriculture. The county is home to several large ranches, and the main crops grown in the area are wheat, sorghum, and cotton. The county is also home to several oil and gas fields, and the oil and gas industry is a major contributor to the local economy.
In addition to agriculture and oil and gas, the county is also home to several manufacturing companies. The largest employers in the county are the Wheeler County Hospital, the Wheeler County Sheriff's Office, and the Wheeler County School District.
Demographics
As of the 2010 census, the population of Wheeler County was 5,410. The racial makeup of the county was 81.3% White, 0.7% African American, 0.7% Native American, 0.2% Asian, 0.1% Pacific Islander, 15.2% from other races, and 1.9% from two or more races. Hispanic or Latino of any race were 28.2% of the population.
The median income for a household in the county was $35,938, and the median income for a family was $41,944. The per capita income for the county was $17,845. About 16.2% of the population was below the poverty line.
Common Questions
What is Per Capita Income in Wheeler County?
Per Capita income in Wheeler County is $30,454.
What is the Median Family Income in Wheeler County?
Median Family Income in Wheeler County is $65,671.
What is the Median Household income in Wheeler County?
Median Household Income in Wheeler County is $58,158.
What is Income or Wage Gap in Wheeler County?
Income or Wage Gap in Wheeler County is 52.0%.
Women in Wheeler County earn 48.0 cents for every dollar earned by a man.
What is Inequality or Gini Index in Wheeler County?
Inequality or Gini Index in Wheeler County is 0.43.
What is the Total Population of Wheeler County?
Total Population of Wheeler County is 4,980.
What is the Total Male Population of Wheeler County?
Total Male Population of Wheeler County is 2,580.
What is the Total Female Population of Wheeler County?
Total Female Population of Wheeler County is 2,400.
What is the Ratio of Males per 100 Females in Wheeler County?
There are 107.50 Males per 100 Females in Wheeler County.
What is the Ratio of Females per 100 Males in Wheeler County?
There are 93.02 Females per 100 Males in Wheeler County.
What is the Median Population Age in Wheeler County?
Median Population Age in Wheeler County is 40.0 Years.
What is the Average Family Size in Wheeler County
Average Family Size in Wheeler County is 3.0 People.
What is the Average Household Size in Wheeler County
Average Household Size in Wheeler County is 2.6 People.
How Large is the Labor Force in Wheeler County?
There are 2,434 People in the Labor Forcein in Wheeler County.
What is the Percentage of People in the Labor Force in Wheeler County?
61.9% of People are in the Labor Force in Wheeler County.
What is the Unemployment Rate in Wheeler County?
Unemployment Rate in Wheeler County is 6.6%.