Wharton County, TX Map & Demographics
Wharton County Map
Wharton County Overview
$29,061
PER CAPITA INCOME
$71,647
AVG FAMILY INCOME
$59,712
AVG HOUSEHOLD INCOME
35.3%
WAGE / INCOME GAP [ % ]
64.7¢/ $1
WAGE / INCOME GAP [ $ ]
$10,796
FAMILY INCOME DEFICIT
0.45
INEQUALITY / GINI INDEX
41,614
TOTAL POPULATION
20,761
MALE POPULATION
20,853
FEMALE POPULATION
99.56
MALES / 100 FEMALES
100.44
FEMALES / 100 MALES
37.7
MEDIAN AGE
3.4
AVG FAMILY SIZE
2.7
AVG HOUSEHOLD SIZE
19,258
LABOR FORCE [ PEOPLE ]
59.7%
PERCENT IN LABOR FORCE
5.7%
UNEMPLOYMENT RATE
Income in Wharton County
Income Overview in Wharton County
Per Capita Income in Wharton County is $29,061, while median incomes of families and households are $71,647 and $59,712 respectively.
| Characteristic | Number | Measure |
| Per Capita Income | 41,614 | $29,061 |
| Median Family Income | 10,457 | $71,647 |
| Mean Family Income | 10,457 | $93,794 |
| Median Household Income | 15,148 | $59,712 |
| Mean Household Income | 15,148 | $78,675 |
| Income Deficit | 10,457 | $10,796 |
| Wage / Income Gap (%) | 41,614 | 35.34% |
| Wage / Income Gap ($) | 41,614 | 64.66¢ per $1 |
| Gini / Inequality Index | 41,614 | 0.45 |
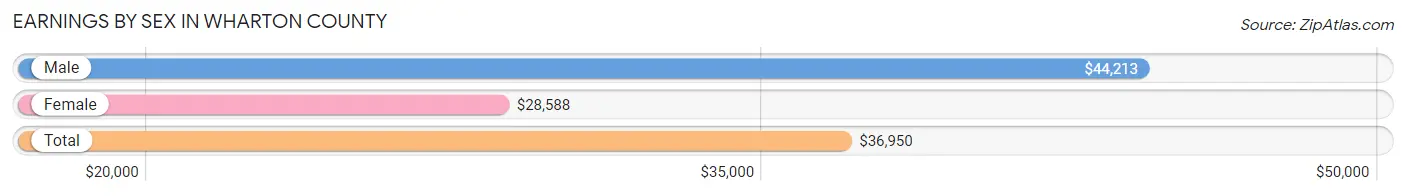
Earnings by Sex in Wharton County
Average Earnings in Wharton County are $36,950, $44,213 for men and $28,588 for women, a difference of 35.3%.
| Sex | Number | Average Earnings |
| Male | 10,833 (54.5%) | $44,213 |
| Female | 9,028 (45.5%) | $28,588 |
| Total | 19,861 (100.0%) | $36,950 |
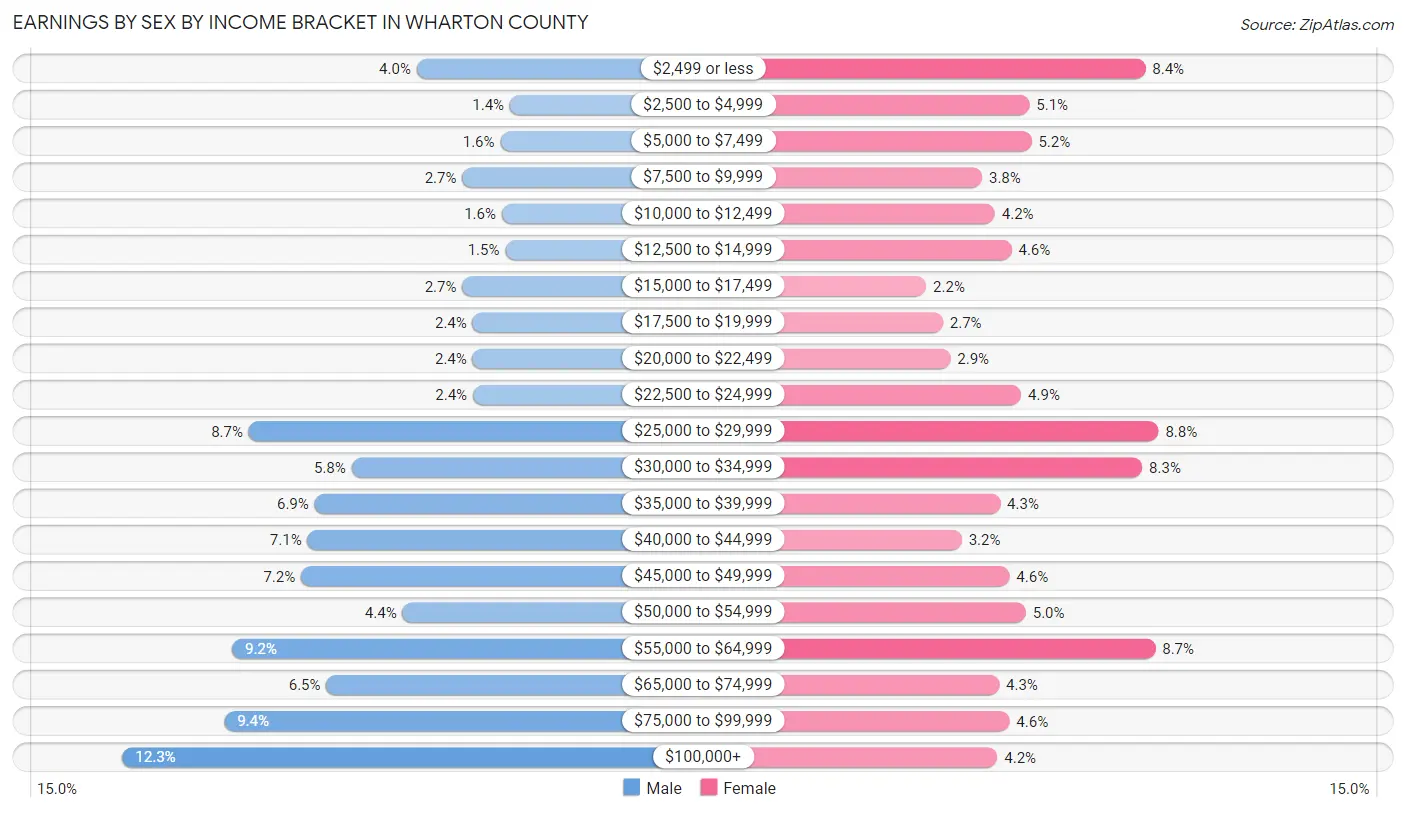
Earnings by Sex by Income Bracket in Wharton County
The most common earnings brackets in Wharton County are $100,000+ for men (1,327 | 12.2%) and $25,000 to $29,999 for women (791 | 8.8%).
| Income | Male | Female |
| $2,499 or less | 431 (4.0%) | 757 (8.4%) |
| $2,500 to $4,999 | 147 (1.4%) | 463 (5.1%) |
| $5,000 to $7,499 | 177 (1.6%) | 469 (5.2%) |
| $7,500 to $9,999 | 293 (2.7%) | 343 (3.8%) |
| $10,000 to $12,499 | 172 (1.6%) | 376 (4.2%) |
| $12,500 to $14,999 | 161 (1.5%) | 418 (4.6%) |
| $15,000 to $17,499 | 292 (2.7%) | 201 (2.2%) |
| $17,500 to $19,999 | 261 (2.4%) | 244 (2.7%) |
| $20,000 to $22,499 | 261 (2.4%) | 263 (2.9%) |
| $22,500 to $24,999 | 260 (2.4%) | 442 (4.9%) |
| $25,000 to $29,999 | 942 (8.7%) | 791 (8.8%) |
| $30,000 to $34,999 | 629 (5.8%) | 749 (8.3%) |
| $35,000 to $39,999 | 742 (6.9%) | 389 (4.3%) |
| $40,000 to $44,999 | 764 (7.0%) | 292 (3.2%) |
| $45,000 to $49,999 | 783 (7.2%) | 413 (4.6%) |
| $50,000 to $54,999 | 475 (4.4%) | 454 (5.0%) |
| $55,000 to $64,999 | 993 (9.2%) | 783 (8.7%) |
| $65,000 to $74,999 | 706 (6.5%) | 386 (4.3%) |
| $75,000 to $99,999 | 1,017 (9.4%) | 413 (4.6%) |
| $100,000+ | 1,327 (12.2%) | 382 (4.2%) |
| Total | 10,833 (100.0%) | 9,028 (100.0%) |
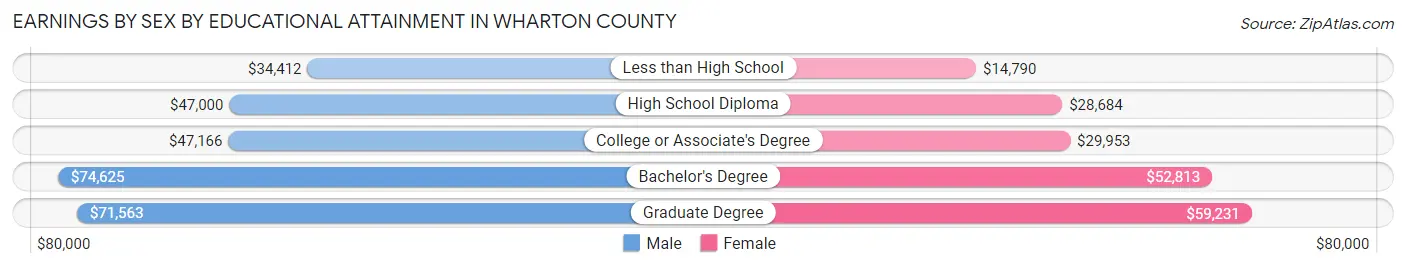
Earnings by Sex by Educational Attainment in Wharton County
Average earnings in Wharton County are $46,360 for men and $33,044 for women, a difference of 28.7%. Men with an educational attainment of bachelor's degree enjoy the highest average annual earnings of $74,625, while those with less than high school education earn the least with $34,412. Women with an educational attainment of graduate degree earn the most with the average annual earnings of $59,231, while those with less than high school education have the smallest earnings of $14,790.
| Educational Attainment | Male Income | Female Income |
| Less than High School | $34,412 | $14,790 |
| High School Diploma | $47,000 | $28,684 |
| College or Associate's Degree | $47,166 | $29,953 |
| Bachelor's Degree | $74,625 | $52,813 |
| Graduate Degree | $71,563 | $59,231 |
| Total | $46,360 | $33,044 |
Family Income in Wharton County
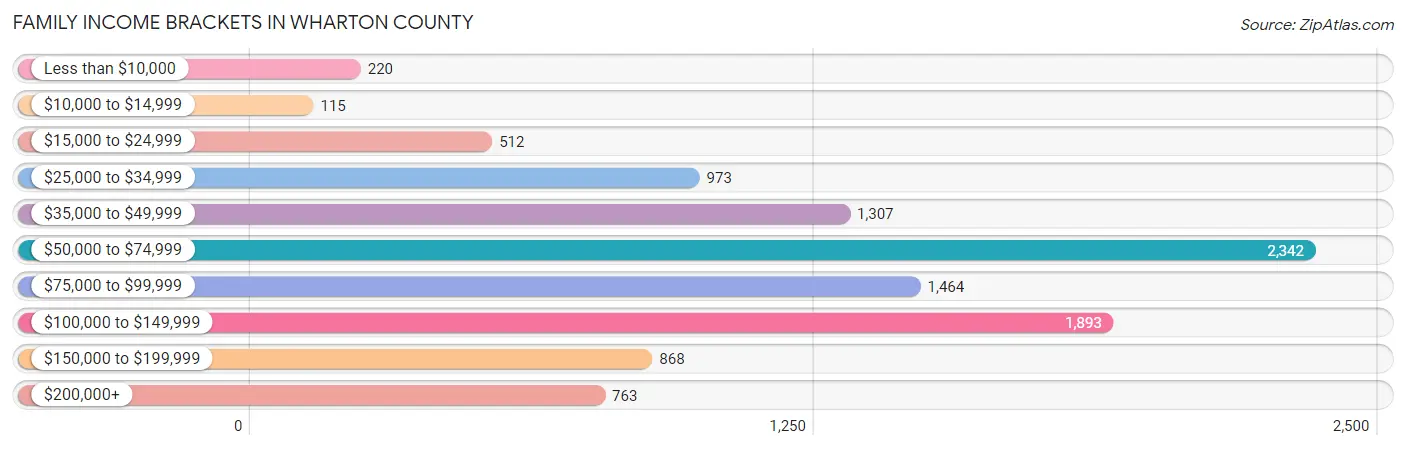
Family Income Brackets in Wharton County
According to the Wharton County family income data, there are 2,342 families falling into the $50,000 to $74,999 income range, which is the most common income bracket and makes up 22.4% of all families. Conversely, the $10,000 to $14,999 income bracket is the least frequent group with only 115 families (1.1%) belonging to this category.
| Income Bracket | # Families | % Families |
| Less than $10,000 | 220 | 2.1% |
| $10,000 to $14,999 | 115 | 1.1% |
| $15,000 to $24,999 | 512 | 4.9% |
| $25,000 to $34,999 | 973 | 9.3% |
| $35,000 to $49,999 | 1,307 | 12.5% |
| $50,000 to $74,999 | 2,342 | 22.4% |
| $75,000 to $99,999 | 1,464 | 14.0% |
| $100,000 to $149,999 | 1,893 | 18.1% |
| $150,000 to $199,999 | 868 | 8.3% |
| $200,000+ | 763 | 7.3% |
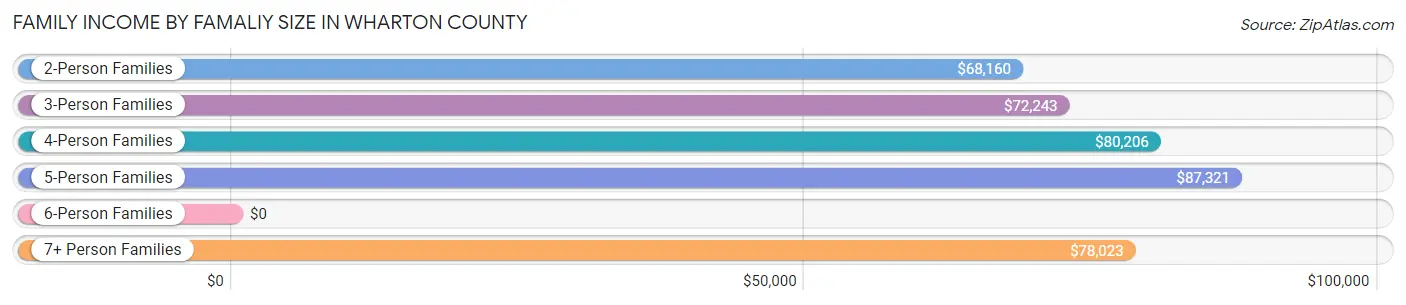
Family Income by Famaliy Size in Wharton County
5-person families (1,175 | 11.2%) account for the highest median family income in Wharton County with $87,321 per family, while 2-person families (4,394 | 42.0%) have the highest median income of $34,080 per family member.
| Income Bracket | # Families | Median Income |
| 2-Person Families | 4,394 (42.0%) | $68,160 |
| 3-Person Families | 2,032 (19.4%) | $72,243 |
| 4-Person Families | 2,261 (21.6%) | $80,206 |
| 5-Person Families | 1,175 (11.2%) | $87,321 |
| 6-Person Families | 356 (3.4%) | $0 |
| 7+ Person Families | 239 (2.3%) | $78,023 |
| Total | 10,457 (100.0%) | $71,647 |
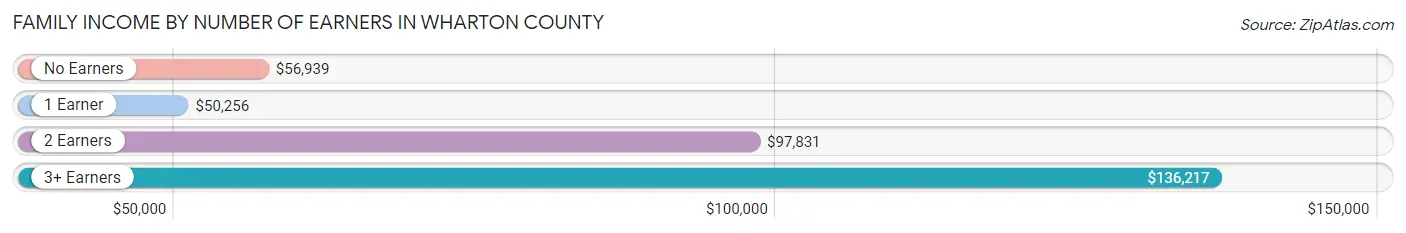
Family Income by Number of Earners in Wharton County
The median family income in Wharton County is $71,647, with families comprising 3+ earners (1,219) having the highest median family income of $136,217, while families with 1 earner (3,801) have the lowest median family income of $50,256, accounting for 11.7% and 36.3% of families, respectively.
| Number of Earners | # Families | Median Income |
| No Earners | 1,270 (12.1%) | $56,939 |
| 1 Earner | 3,801 (36.3%) | $50,256 |
| 2 Earners | 4,167 (39.9%) | $97,831 |
| 3+ Earners | 1,219 (11.7%) | $136,217 |
| Total | 10,457 (100.0%) | $71,647 |
Household Income in Wharton County
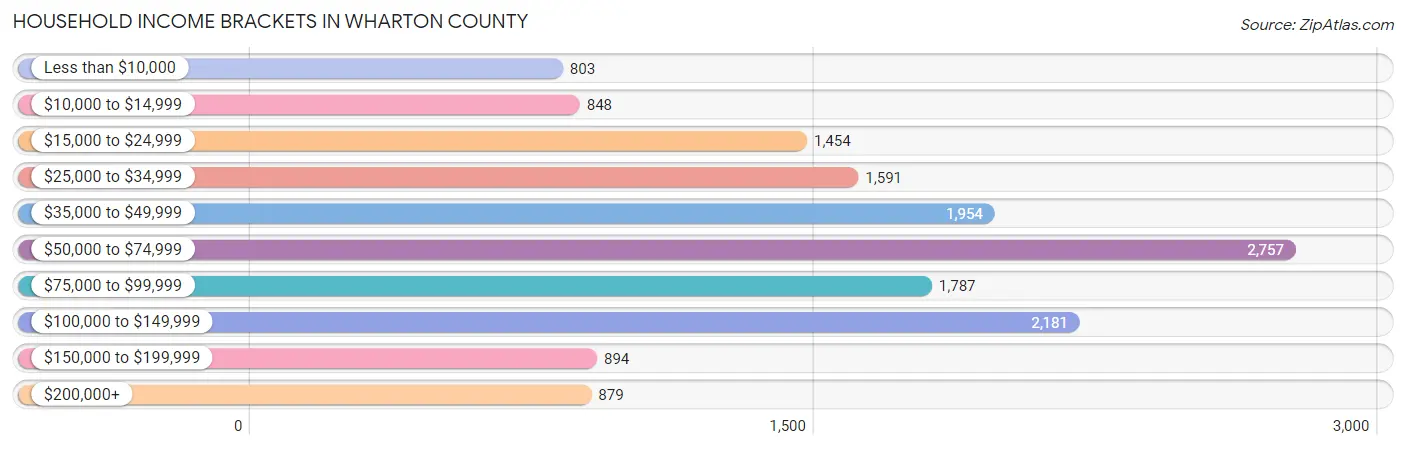
Household Income Brackets in Wharton County
With 2,757 households falling in the category, the $50,000 to $74,999 income range is the most frequent in Wharton County, accounting for 18.2% of all households. In contrast, only 803 households (5.3%) fall into the less than $10,000 income bracket, making it the least populous group.
| Income Bracket | # Households | % Households |
| Less than $10,000 | 803 | 5.3% |
| $10,000 to $14,999 | 848 | 5.6% |
| $15,000 to $24,999 | 1,454 | 9.6% |
| $25,000 to $34,999 | 1,591 | 10.5% |
| $35,000 to $49,999 | 1,954 | 12.9% |
| $50,000 to $74,999 | 2,757 | 18.2% |
| $75,000 to $99,999 | 1,787 | 11.8% |
| $100,000 to $149,999 | 2,181 | 14.4% |
| $150,000 to $199,999 | 894 | 5.9% |
| $200,000+ | 879 | 5.8% |
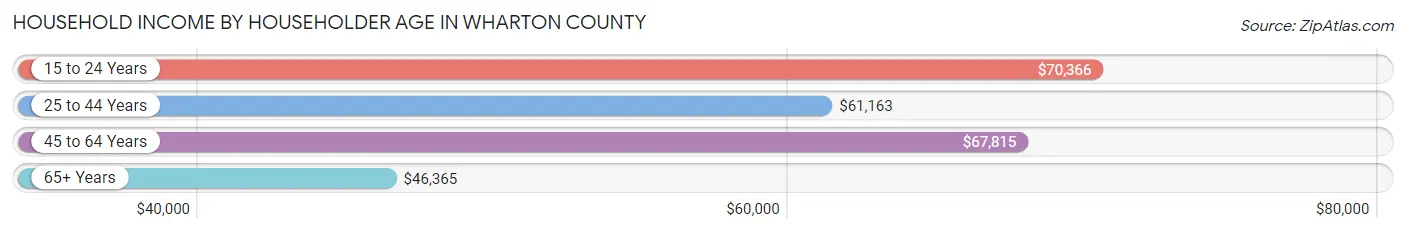
Household Income by Householder Age in Wharton County
The median household income in Wharton County is $59,712, with the highest median household income of $70,366 found in the 15 to 24 years age bracket for the primary householder. A total of 344 households (2.3%) fall into this category. Meanwhile, the 65+ years age bracket for the primary householder has the lowest median household income of $46,365, with 4,708 households (31.1%) in this group.
| Income Bracket | # Households | Median Income |
| 15 to 24 Years | 344 (2.3%) | $70,366 |
| 25 to 44 Years | 4,750 (31.4%) | $61,163 |
| 45 to 64 Years | 5,346 (35.3%) | $67,815 |
| 65+ Years | 4,708 (31.1%) | $46,365 |
| Total | 15,148 (100.0%) | $59,712 |
Poverty in Wharton County
Income Below Poverty by Sex and Age in Wharton County
With 12.5% poverty level for males and 16.7% for females among the residents of Wharton County, under 5 year old males and 6 to 11 year old females are the most vulnerable to poverty, with 386 males (26.8%) and 318 females (24.3%) in their respective age groups living below the poverty level.
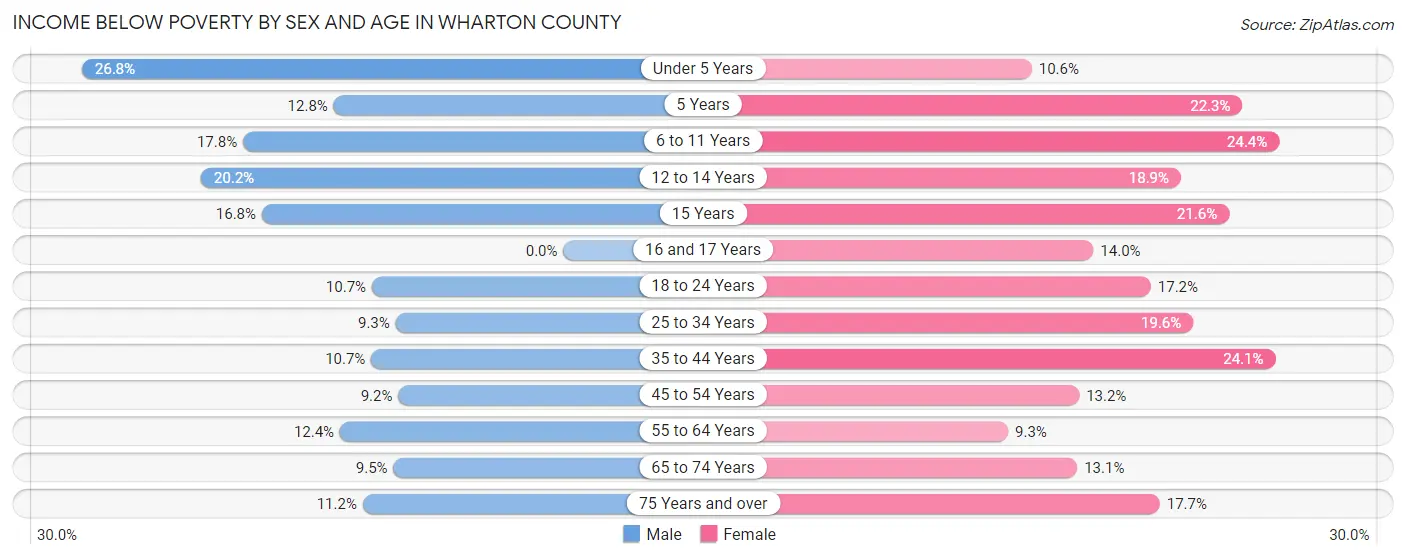
| Age Bracket | Male | Female |
| Under 5 Years | 386 (26.8%) | 143 (10.6%) |
| 5 Years | 33 (12.8%) | 62 (22.3%) |
| 6 to 11 Years | 321 (17.8%) | 318 (24.3%) |
| 12 to 14 Years | 203 (20.2%) | 229 (18.9%) |
| 15 Years | 69 (16.8%) | 36 (21.6%) |
| 16 and 17 Years | 0 (0.0%) | 101 (14.0%) |
| 18 to 24 Years | 187 (10.7%) | 302 (17.2%) |
| 25 to 34 Years | 211 (9.3%) | 498 (19.6%) |
| 35 to 44 Years | 292 (10.7%) | 651 (24.1%) |
| 45 to 54 Years | 212 (9.2%) | 279 (13.2%) |
| 55 to 64 Years | 317 (12.4%) | 245 (9.3%) |
| 65 to 74 Years | 195 (9.5%) | 270 (13.1%) |
| 75 Years and over | 126 (11.2%) | 312 (17.7%) |
| Total | 2,552 (12.5%) | 3,446 (16.7%) |
Income Above Poverty by Sex and Age in Wharton County
According to the poverty statistics in Wharton County, males aged 16 and 17 years and females aged 55 to 64 years are the age groups that are most secure financially, with 100.0% of males and 90.7% of females in these age groups living above the poverty line.
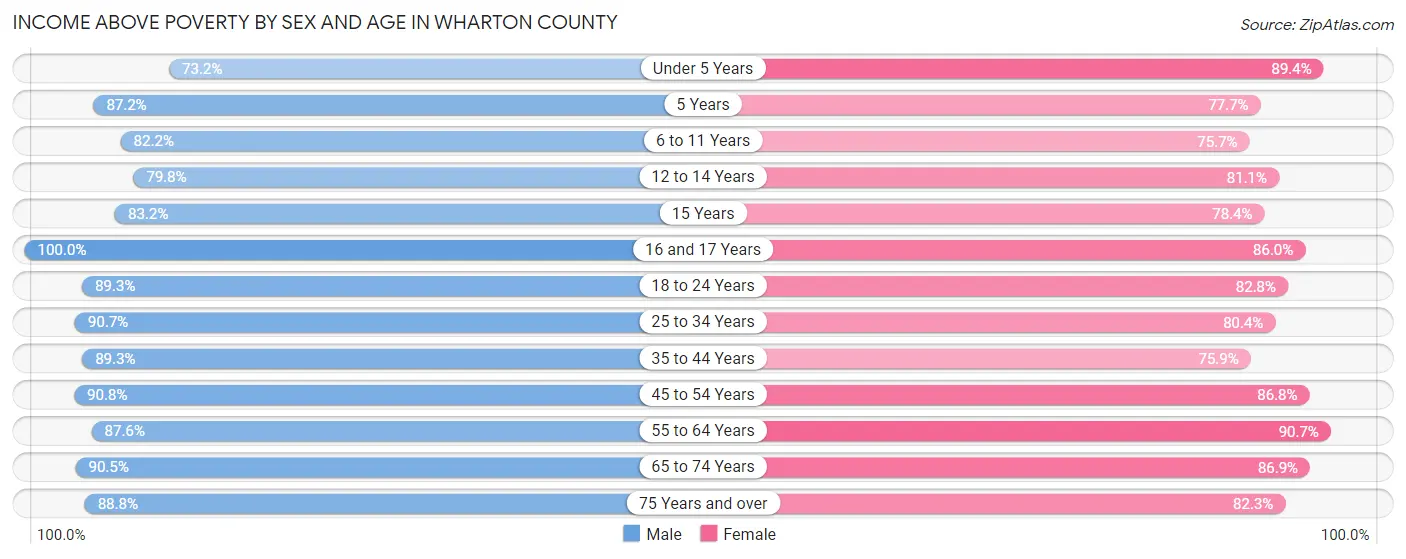
| Age Bracket | Male | Female |
| Under 5 Years | 1,054 (73.2%) | 1,208 (89.4%) |
| 5 Years | 225 (87.2%) | 216 (77.7%) |
| 6 to 11 Years | 1,478 (82.2%) | 988 (75.6%) |
| 12 to 14 Years | 803 (79.8%) | 984 (81.1%) |
| 15 Years | 342 (83.2%) | 131 (78.4%) |
| 16 and 17 Years | 640 (100.0%) | 620 (86.0%) |
| 18 to 24 Years | 1,568 (89.3%) | 1,453 (82.8%) |
| 25 to 34 Years | 2,047 (90.7%) | 2,048 (80.4%) |
| 35 to 44 Years | 2,438 (89.3%) | 2,046 (75.9%) |
| 45 to 54 Years | 2,096 (90.8%) | 1,831 (86.8%) |
| 55 to 64 Years | 2,232 (87.6%) | 2,401 (90.7%) |
| 65 to 74 Years | 1,867 (90.5%) | 1,789 (86.9%) |
| 75 Years and over | 1,002 (88.8%) | 1,450 (82.3%) |
| Total | 17,792 (87.5%) | 17,165 (83.3%) |
Income Below Poverty Among Married-Couple Families in Wharton County
The poverty statistics for married-couple families in Wharton County show that 6.6% or 499 of the total 7,593 families live below the poverty line. Families with 5 or more children have the highest poverty rate of 62.1%, comprising of 54 families. On the other hand, families with no children have the lowest poverty rate of 3.5%, which includes 147 families.
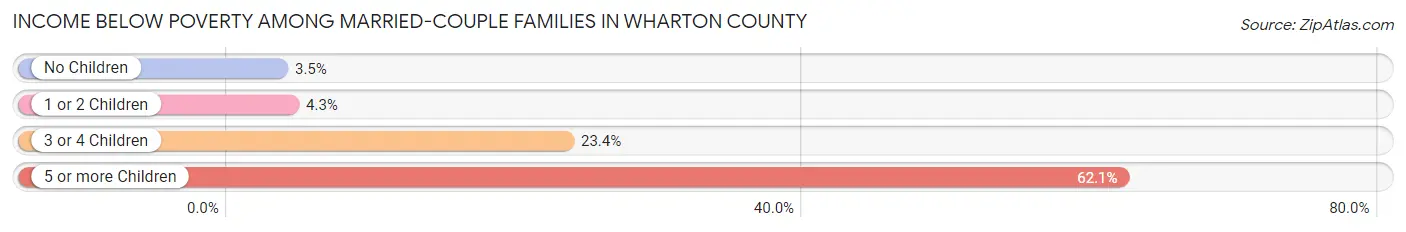
| Children | Above Poverty | Below Poverty |
| No Children | 4,081 (96.5%) | 147 (3.5%) |
| 1 or 2 Children | 2,345 (95.8%) | 104 (4.3%) |
| 3 or 4 Children | 635 (76.6%) | 194 (23.4%) |
| 5 or more Children | 33 (37.9%) | 54 (62.1%) |
| Total | 7,094 (93.4%) | 499 (6.6%) |
Income Below Poverty Among Single-Parent Households in Wharton County
According to the poverty data in Wharton County, 10.1% or 78 single-father households and 16.5% or 345 single-mother households are living below the poverty line. Among single-father households, those with 3 or 4 children have the highest poverty rate, with 49 households (36.6%) experiencing poverty. Likewise, among single-mother households, those with 5 or more children have the highest poverty rate, with 21 households (100.0%) falling below the poverty line.
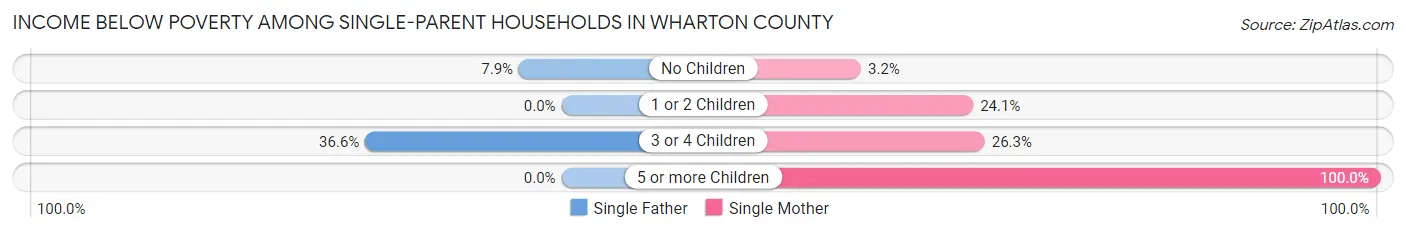
| Children | Single Father | Single Mother |
| No Children | 29 (7.9%) | 28 (3.2%) |
| 1 or 2 Children | 0 (0.0%) | 250 (24.1%) |
| 3 or 4 Children | 49 (36.6%) | 46 (26.3%) |
| 5 or more Children | 0 (0.0%) | 21 (100.0%) |
| Total | 78 (10.1%) | 345 (16.5%) |
Income Below Poverty Among Married-Couple vs Single-Parent Households in Wharton County
The poverty data for Wharton County shows that 499 of the married-couple family households (6.6%) and 423 of the single-parent households (14.8%) are living below the poverty level. Within the married-couple family households, those with 5 or more children have the highest poverty rate, with 54 households (62.1%) falling below the poverty line. Among the single-parent households, those with 5 or more children have the highest poverty rate, with 21 household (100.0%) living below poverty.
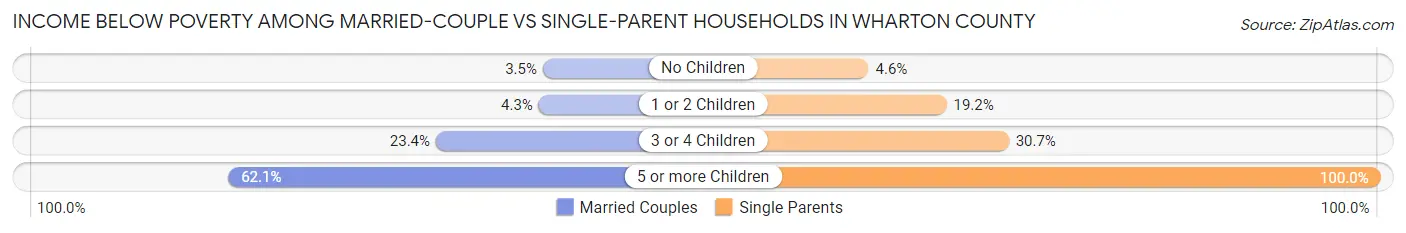
| Children | Married-Couple Families | Single-Parent Households |
| No Children | 147 (3.5%) | 57 (4.6%) |
| 1 or 2 Children | 104 (4.3%) | 250 (19.2%) |
| 3 or 4 Children | 194 (23.4%) | 95 (30.7%) |
| 5 or more Children | 54 (62.1%) | 21 (100.0%) |
| Total | 499 (6.6%) | 423 (14.8%) |
Race in Wharton County
The most populous races in Wharton County are White / Caucasian (29,464 | 70.8%), Hispanic or Latino (17,892 | 43.0%), and Black / African American (5,380 | 12.9%).
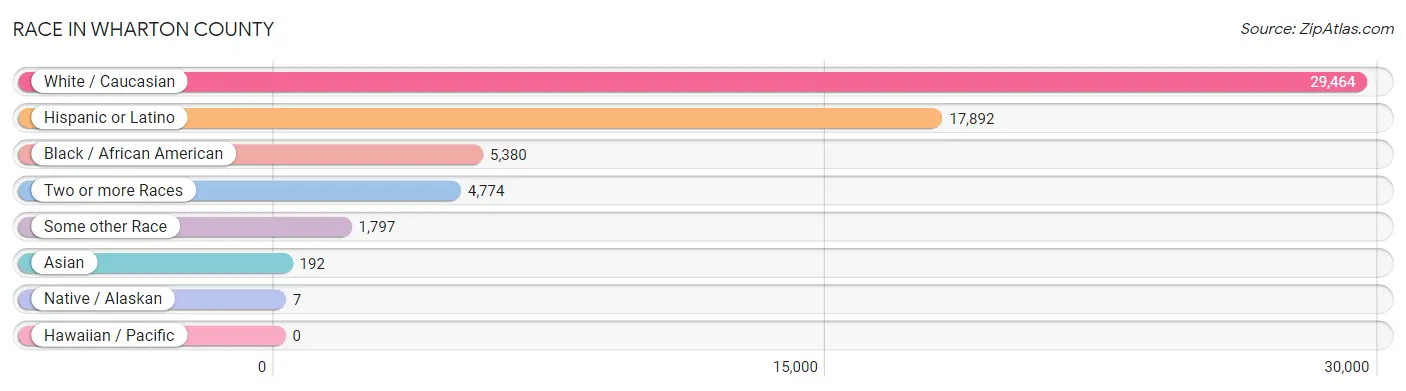
| Race | # Population | % Population |
| Asian | 192 | 0.5% |
| Black / African American | 5,380 | 12.9% |
| Hawaiian / Pacific | 0 | 0.0% |
| Hispanic or Latino | 17,892 | 43.0% |
| Native / Alaskan | 7 | 0.0% |
| White / Caucasian | 29,464 | 70.8% |
| Two or more Races | 4,774 | 11.5% |
| Some other Race | 1,797 | 4.3% |
| Total | 41,614 | 100.0% |
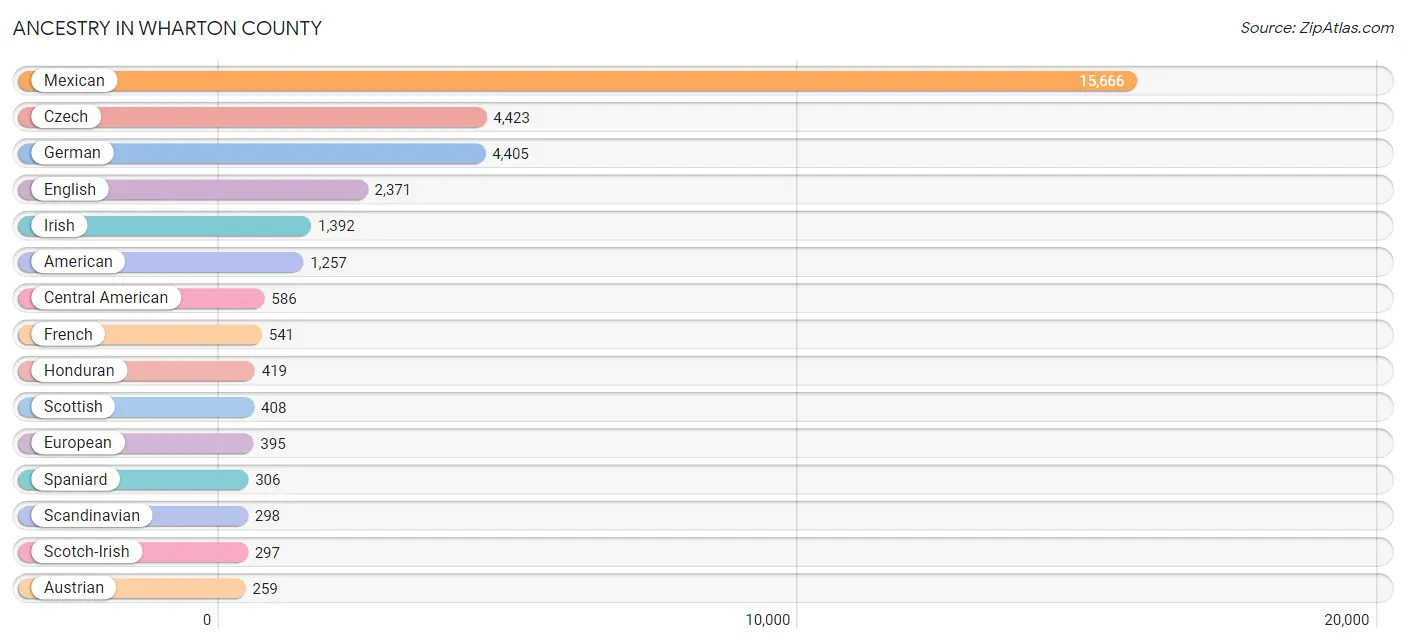
Ancestry in Wharton County
The most populous ancestries reported in Wharton County are Mexican (15,666 | 37.7%), Czech (4,423 | 10.6%), German (4,405 | 10.6%), English (2,371 | 5.7%), and Irish (1,392 | 3.4%), together accounting for 67.9% of all Wharton County residents.
| Ancestry | # Population | % Population |
| African | 15 | 0.0% |
| American | 1,257 | 3.0% |
| Apache | 39 | 0.1% |
| Arab | 58 | 0.1% |
| Arapaho | 7 | 0.0% |
| Argentinean | 10 | 0.0% |
| Austrian | 259 | 0.6% |
| Blackfeet | 9 | 0.0% |
| British | 56 | 0.1% |
| Burmese | 20 | 0.1% |
| Cajun | 54 | 0.1% |
| Canadian | 15 | 0.0% |
| Central American | 586 | 1.4% |
| Cherokee | 35 | 0.1% |
| Colombian | 8 | 0.0% |
| Cuban | 29 | 0.1% |
| Czech | 4,423 | 10.6% |
| Czechoslovakian | 67 | 0.2% |
| Danish | 127 | 0.3% |
| Dutch | 139 | 0.3% |
| Eastern European | 4 | 0.0% |
| English | 2,371 | 5.7% |
| European | 395 | 0.9% |
| Finnish | 34 | 0.1% |
| French | 541 | 1.3% |
| French Canadian | 43 | 0.1% |
| German | 4,405 | 10.6% |
| Guatemalan | 10 | 0.0% |
| Honduran | 419 | 1.0% |
| Indian (Asian) | 40 | 0.1% |
| Irish | 1,392 | 3.4% |
| Italian | 250 | 0.6% |
| Japanese | 8 | 0.0% |
| Korean | 55 | 0.1% |
| Lebanese | 30 | 0.1% |
| Lithuanian | 18 | 0.0% |
| Mexican | 15,666 | 37.7% |
| Nicaraguan | 12 | 0.0% |
| Northern European | 10 | 0.0% |
| Norwegian | 44 | 0.1% |
| Palestinian | 28 | 0.1% |
| Panamanian | 2 | 0.0% |
| Peruvian | 28 | 0.1% |
| Polish | 184 | 0.4% |
| Puerto Rican | 237 | 0.6% |
| Romanian | 50 | 0.1% |
| Russian | 56 | 0.1% |
| Salvadoran | 143 | 0.3% |
| Scandinavian | 298 | 0.7% |
| Scotch-Irish | 297 | 0.7% |
| Scottish | 408 | 1.0% |
| Sioux | 26 | 0.1% |
| Slavic | 9 | 0.0% |
| South American | 46 | 0.1% |
| Spaniard | 306 | 0.7% |
| Spanish | 96 | 0.2% |
| Sri Lankan | 19 | 0.1% |
| Subsaharan African | 72 | 0.2% |
| Swedish | 137 | 0.3% |
| Swiss | 23 | 0.1% |
| Thai | 118 | 0.3% |
| Trinidadian and Tobagonian | 5 | 0.0% |
| Welsh | 61 | 0.2% | View All 63 Rows |
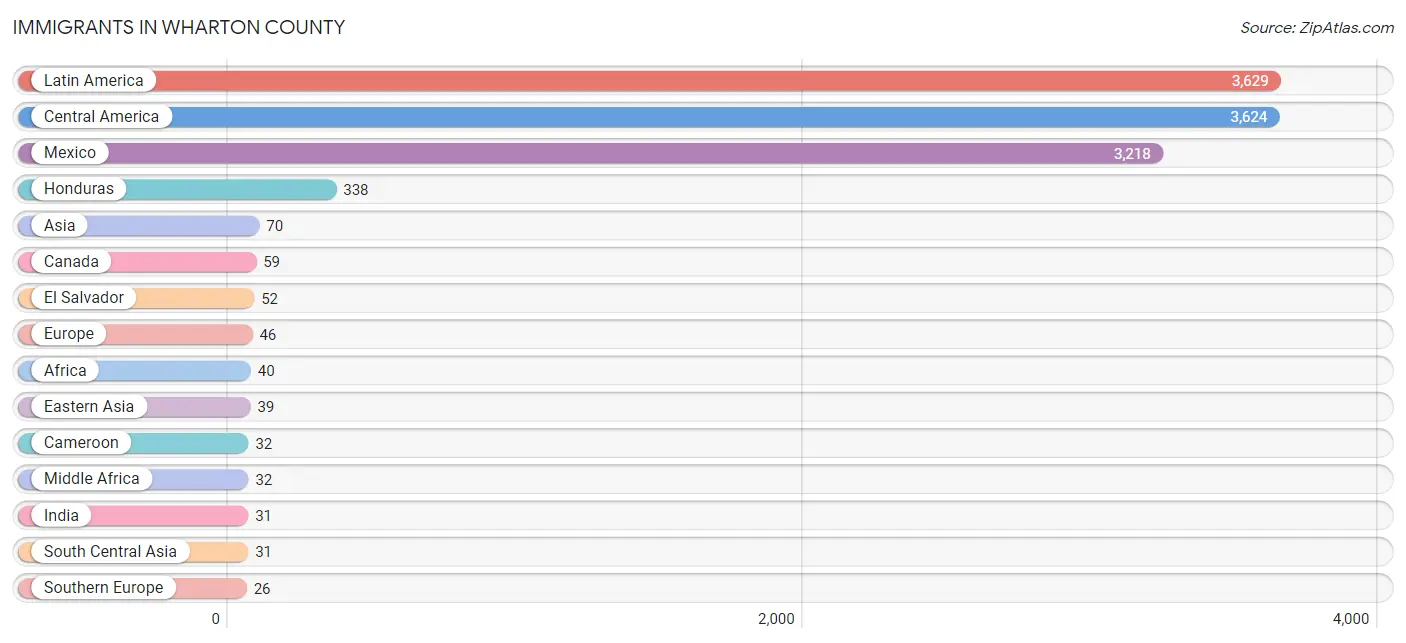
Immigrants in Wharton County
The most numerous immigrant groups reported in Wharton County came from Latin America (3,629 | 8.7%), Central America (3,624 | 8.7%), Mexico (3,218 | 7.7%), Honduras (338 | 0.8%), and Asia (70 | 0.2%), together accounting for 26.1% of all Wharton County residents.
| Immigration Origin | # Population | % Population |
| Africa | 40 | 0.1% |
| Asia | 70 | 0.2% |
| Cameroon | 32 | 0.1% |
| Canada | 59 | 0.1% |
| Caribbean | 5 | 0.0% |
| Central America | 3,624 | 8.7% |
| China | 19 | 0.1% |
| Eastern Asia | 39 | 0.1% |
| Eastern Europe | 2 | 0.0% |
| El Salvador | 52 | 0.1% |
| Europe | 46 | 0.1% |
| Germany | 13 | 0.0% |
| Guatemala | 2 | 0.0% |
| Haiti | 5 | 0.0% |
| Honduras | 338 | 0.8% |
| Hong Kong | 7 | 0.0% |
| India | 31 | 0.1% |
| Italy | 6 | 0.0% |
| Korea | 20 | 0.1% |
| Latin America | 3,629 | 8.7% |
| Mexico | 3,218 | 7.7% |
| Middle Africa | 32 | 0.1% |
| Nicaragua | 12 | 0.0% |
| Northern Europe | 5 | 0.0% |
| Panama | 2 | 0.0% |
| Serbia | 2 | 0.0% |
| South Africa | 8 | 0.0% |
| South Central Asia | 31 | 0.1% |
| Southern Europe | 26 | 0.1% |
| Spain | 20 | 0.1% |
| Western Europe | 13 | 0.0% | View All 31 Rows |
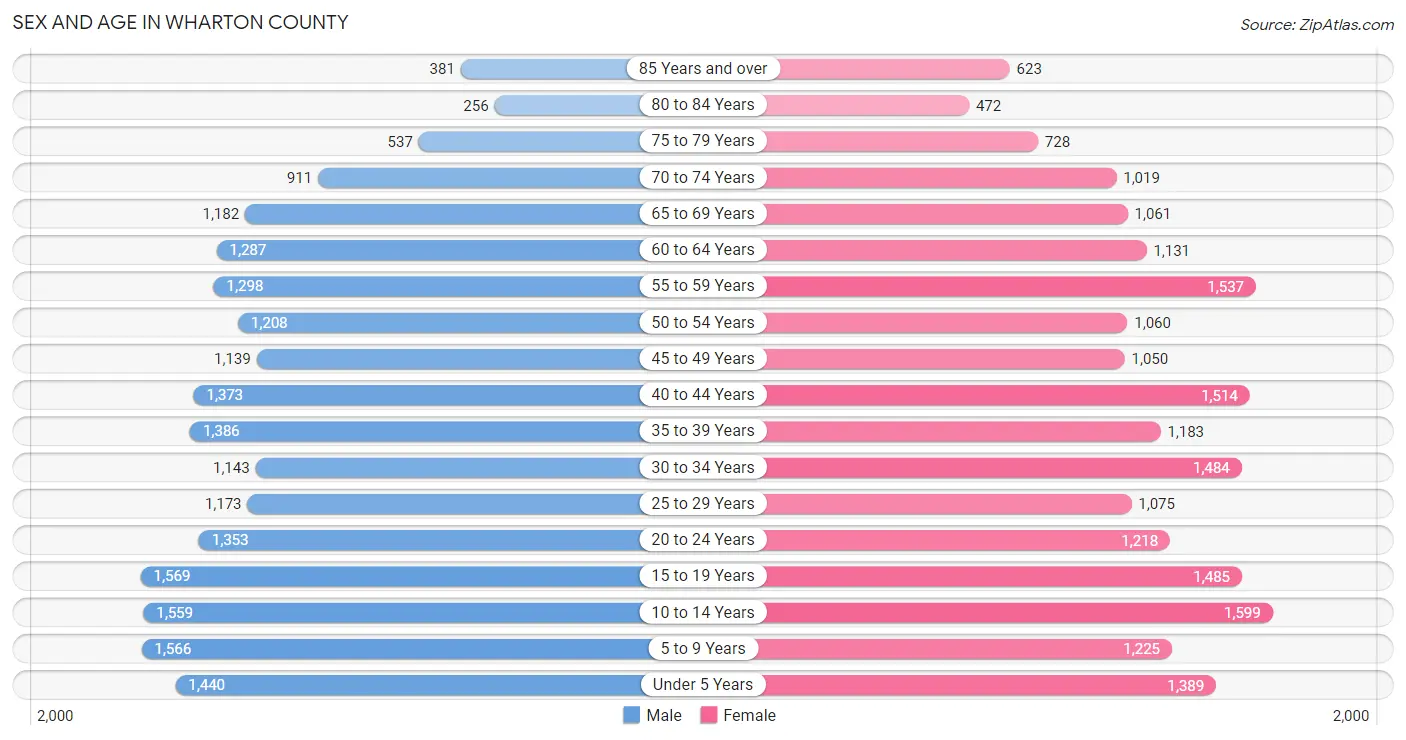
Sex and Age in Wharton County
Sex and Age in Wharton County
The most populous age groups in Wharton County are 15 to 19 Years (1,569 | 7.6%) for men and 10 to 14 Years (1,599 | 7.7%) for women.
| Age Bracket | Male | Female |
| Under 5 Years | 1,440 (6.9%) | 1,389 (6.7%) |
| 5 to 9 Years | 1,566 (7.5%) | 1,225 (5.9%) |
| 10 to 14 Years | 1,559 (7.5%) | 1,599 (7.7%) |
| 15 to 19 Years | 1,569 (7.6%) | 1,485 (7.1%) |
| 20 to 24 Years | 1,353 (6.5%) | 1,218 (5.8%) |
| 25 to 29 Years | 1,173 (5.7%) | 1,075 (5.2%) |
| 30 to 34 Years | 1,143 (5.5%) | 1,484 (7.1%) |
| 35 to 39 Years | 1,386 (6.7%) | 1,183 (5.7%) |
| 40 to 44 Years | 1,373 (6.6%) | 1,514 (7.3%) |
| 45 to 49 Years | 1,139 (5.5%) | 1,050 (5.0%) |
| 50 to 54 Years | 1,208 (5.8%) | 1,060 (5.1%) |
| 55 to 59 Years | 1,298 (6.2%) | 1,537 (7.4%) |
| 60 to 64 Years | 1,287 (6.2%) | 1,131 (5.4%) |
| 65 to 69 Years | 1,182 (5.7%) | 1,061 (5.1%) |
| 70 to 74 Years | 911 (4.4%) | 1,019 (4.9%) |
| 75 to 79 Years | 537 (2.6%) | 728 (3.5%) |
| 80 to 84 Years | 256 (1.2%) | 472 (2.3%) |
| 85 Years and over | 381 (1.8%) | 623 (3.0%) |
| Total | 20,761 (100.0%) | 20,853 (100.0%) |
Families and Households in Wharton County
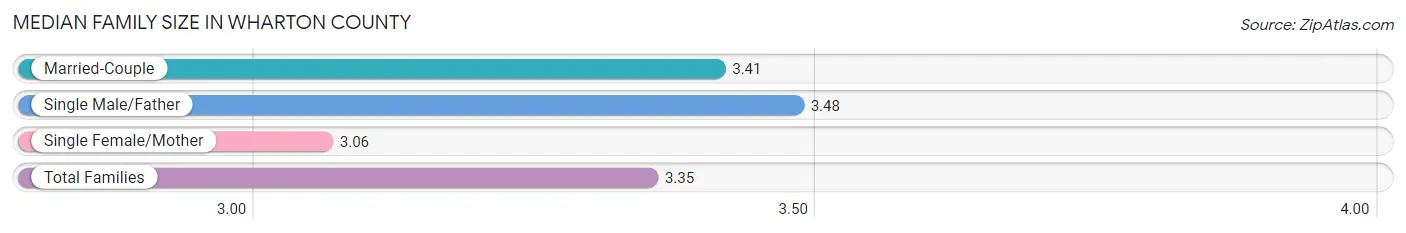
Median Family Size in Wharton County
The median family size in Wharton County is 3.35 persons per family, with single male/father families (769 | 7.3%) accounting for the largest median family size of 3.48 persons per family. On the other hand, single female/mother families (2,095 | 20.0%) represent the smallest median family size with 3.06 persons per family.
| Family Type | # Families | Family Size |
| Married-Couple | 7,593 (72.6%) | 3.41 |
| Single Male/Father | 769 (7.3%) | 3.48 |
| Single Female/Mother | 2,095 (20.0%) | 3.06 |
| Total Families | 10,457 (100.0%) | 3.35 |
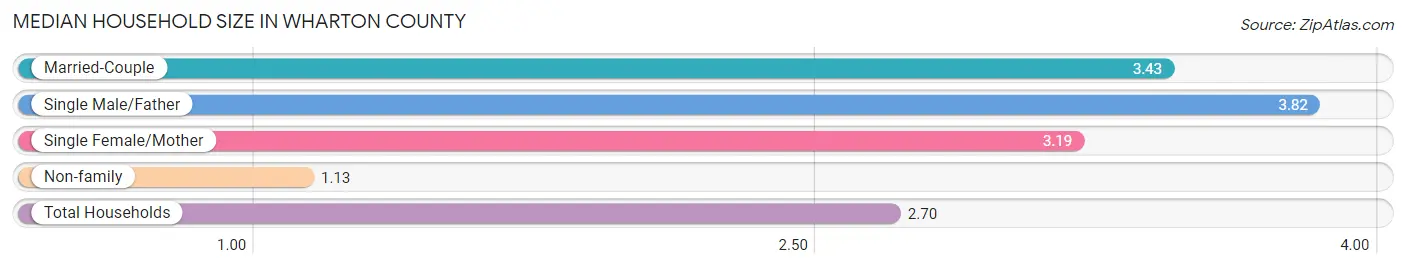
Median Household Size in Wharton County
The median household size in Wharton County is 2.70 persons per household, with single male/father households (769 | 5.1%) accounting for the largest median household size of 3.82 persons per household. non-family households (4,691 | 31.0%) represent the smallest median household size with 1.13 persons per household.
| Household Type | # Households | Household Size |
| Married-Couple | 7,593 (50.1%) | 3.43 |
| Single Male/Father | 769 (5.1%) | 3.82 |
| Single Female/Mother | 2,095 (13.8%) | 3.19 |
| Non-family | 4,691 (31.0%) | 1.13 |
| Total Households | 15,148 (100.0%) | 2.70 |
Household Size by Marriage Status in Wharton County
Out of a total of 15,148 households in Wharton County, 10,457 (69.0%) are family households, while 4,691 (31.0%) are nonfamily households. The most numerous type of family households are 2-person households, comprising 4,238, and the most common type of nonfamily households are 1-person households, comprising 4,187.
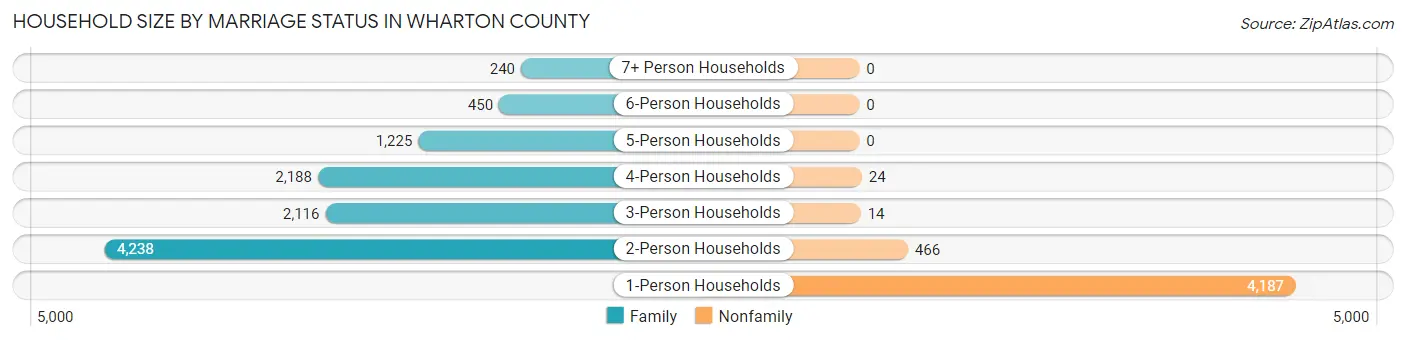
| Household Size | Family Households | Nonfamily Households |
| 1-Person Households | - | 4,187 (27.6%) |
| 2-Person Households | 4,238 (28.0%) | 466 (3.1%) |
| 3-Person Households | 2,116 (14.0%) | 14 (0.1%) |
| 4-Person Households | 2,188 (14.4%) | 24 (0.2%) |
| 5-Person Households | 1,225 (8.1%) | 0 (0.0%) |
| 6-Person Households | 450 (3.0%) | 0 (0.0%) |
| 7+ Person Households | 240 (1.6%) | 0 (0.0%) |
| Total | 10,457 (69.0%) | 4,691 (31.0%) |
Female Fertility in Wharton County
Fertility by Age in Wharton County
Average fertility rate in Wharton County is 76.0 births per 1,000 women. Women in the age bracket of 20 to 34 years have the highest fertility rate with 140.0 births per 1,000 women. Women in the age bracket of 20 to 34 years acount for 75.9% of all women with births.
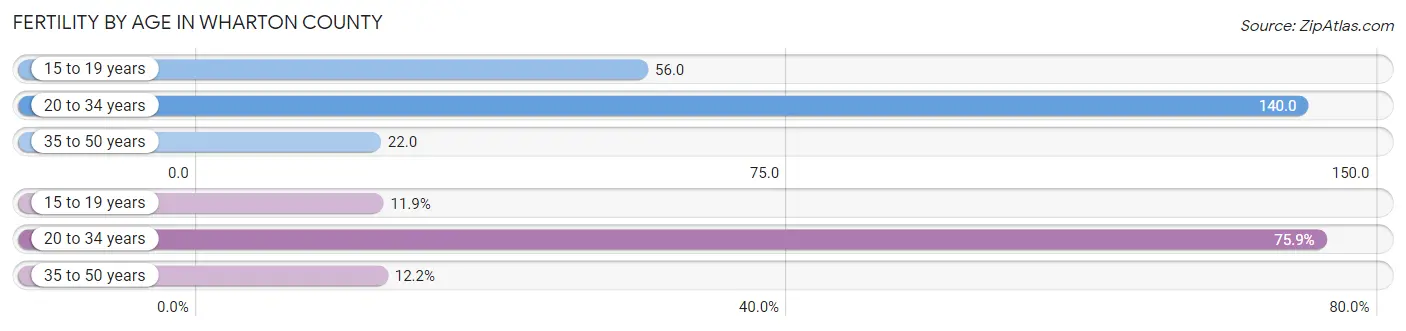
| Age Bracket | Women with Births | Births / 1,000 Women |
| 15 to 19 years | 83 (11.9%) | 56.0 |
| 20 to 34 years | 529 (75.9%) | 140.0 |
| 35 to 50 years | 85 (12.2%) | 22.0 |
| Total | 697 (100.0%) | 76.0 |
Fertility by Age by Marriage Status in Wharton County
62.0% of women with births (697) in Wharton County are married. The highest percentage of unmarried women with births falls into 15 to 19 years age bracket with 100.0% of them unmarried at the time of birth, while the lowest percentage of unmarried women with births belong to 35 to 50 years age bracket with 0.0% of them unmarried.
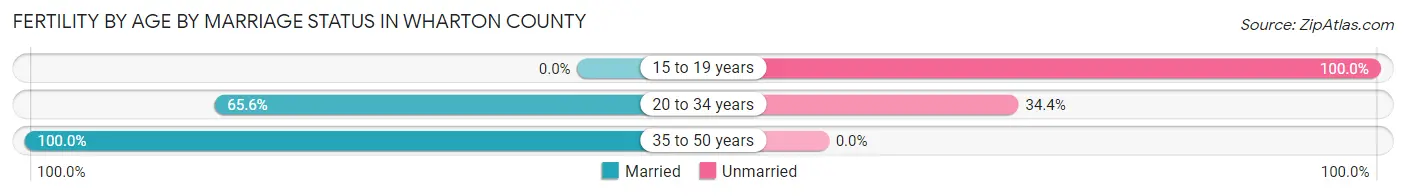
| Age Bracket | Married | Unmarried |
| 15 to 19 years | 0 (0.0%) | 83 (100.0%) |
| 20 to 34 years | 347 (65.6%) | 182 (34.4%) |
| 35 to 50 years | 85 (100.0%) | 0 (0.0%) |
| Total | 432 (62.0%) | 265 (38.0%) |
Fertility by Education in Wharton County
Average fertility rate in Wharton County is 76.0 births per 1,000 women. Women with the education attainment of high school diploma have the highest fertility rate of 124.0 births per 1,000 women, while women with the education attainment of graduate degree have the lowest fertility at 19.0 births per 1,000 women. Women with the education attainment of high school diploma represent 39.3% of all women with births.
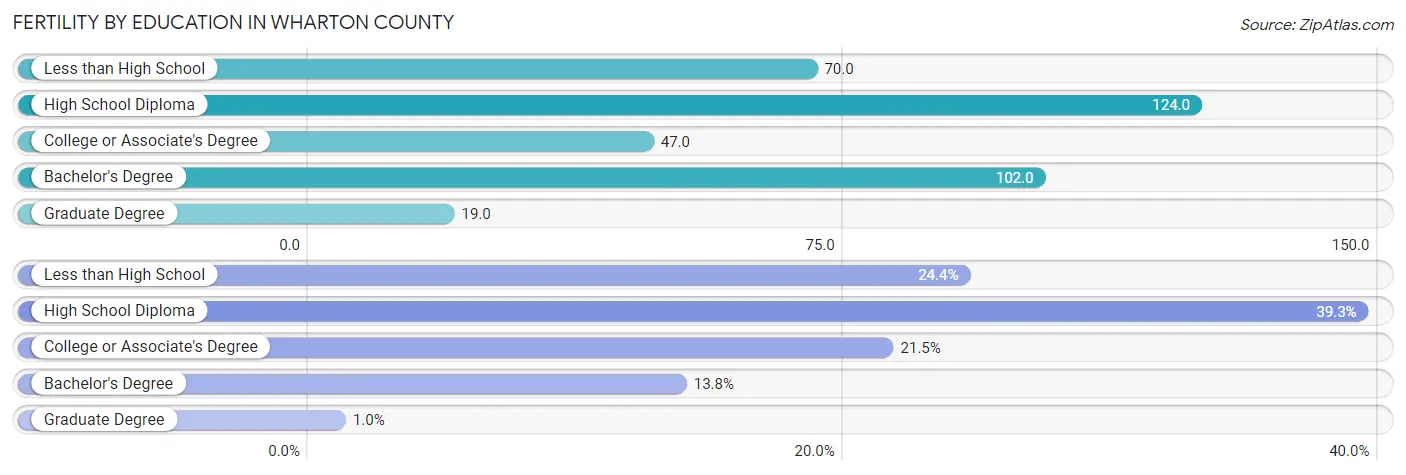
| Educational Attainment | Women with Births | Births / 1,000 Women |
| Less than High School | 170 (24.4%) | 70.0 |
| High School Diploma | 274 (39.3%) | 124.0 |
| College or Associate's Degree | 150 (21.5%) | 47.0 |
| Bachelor's Degree | 96 (13.8%) | 102.0 |
| Graduate Degree | 7 (1.0%) | 19.0 |
| Total | 697 (100.0%) | 76.0 |
Fertility by Education by Marriage Status in Wharton County
38.0% of women with births in Wharton County are unmarried. Women with the educational attainment of bachelor's degree are most likely to be married with 100.0% of them married at childbirth, while women with the educational attainment of college or associate's degree are least likely to be married with 82.0% of them unmarried at childbirth.
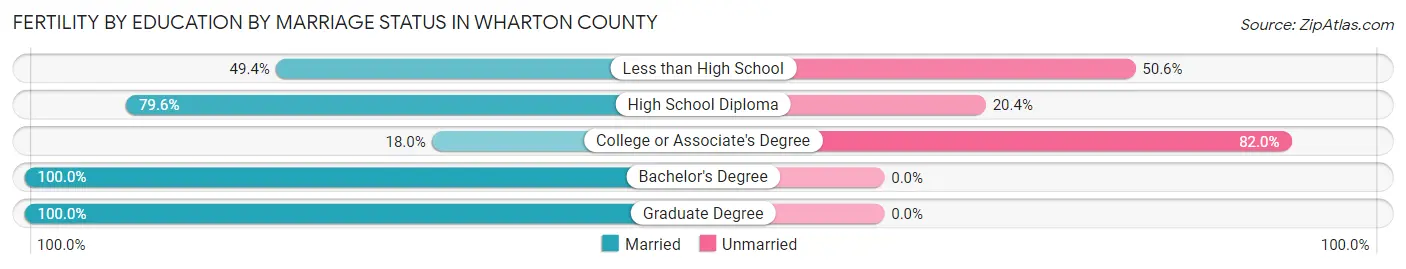
| Educational Attainment | Married | Unmarried |
| Less than High School | 84 (49.4%) | 86 (50.6%) |
| High School Diploma | 218 (79.6%) | 56 (20.4%) |
| College or Associate's Degree | 27 (18.0%) | 123 (82.0%) |
| Bachelor's Degree | 96 (100.0%) | 0 (0.0%) |
| Graduate Degree | 7 (100.0%) | 0 (0.0%) |
| Total | 432 (62.0%) | 265 (38.0%) |
Employment Characteristics in Wharton County
Employment by Class of Employer in Wharton County
Among the 17,908 employed individuals in Wharton County, private company employees (12,468 | 69.6%), local government employees (1,853 | 10.3%), and self-employed (not incorporated) (1,166 | 6.5%) make up the most common classes of employment.
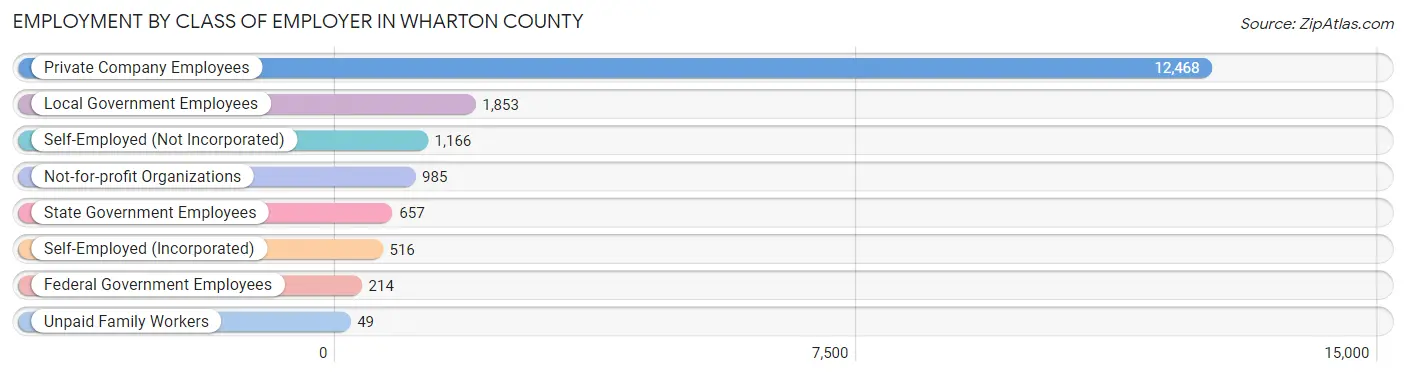
| Employer Class | # Employees | % Employees |
| Private Company Employees | 12,468 | 69.6% |
| Self-Employed (Incorporated) | 516 | 2.9% |
| Self-Employed (Not Incorporated) | 1,166 | 6.5% |
| Not-for-profit Organizations | 985 | 5.5% |
| Local Government Employees | 1,853 | 10.3% |
| State Government Employees | 657 | 3.7% |
| Federal Government Employees | 214 | 1.2% |
| Unpaid Family Workers | 49 | 0.3% |
| Total | 17,908 | 100.0% |
Employment Status by Age in Wharton County
According to the labor force statistics for Wharton County, out of the total population over 16 years of age (32,258), 59.7% or 19,258 individuals are in the labor force, with 5.7% or 1,098 of them unemployed. The age group with the highest labor force participation rate is 35 to 44 years, with 83.5% or 4,556 individuals in the labor force. Within the labor force, the 16 to 19 years age range has the highest percentage of unemployed individuals, with 12.0% or 93 of them being unemployed.
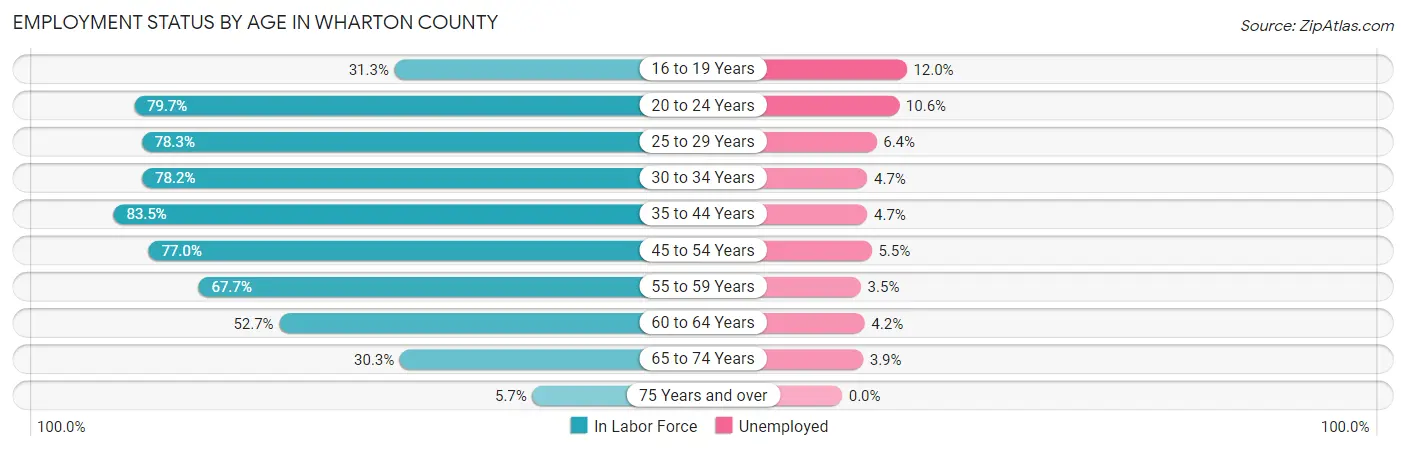
| Age Bracket | In Labor Force | Unemployed |
| 16 to 19 Years | 775 (31.3%) | 93 (12.0%) |
| 20 to 24 Years | 2,049 (79.7%) | 217 (10.6%) |
| 25 to 29 Years | 1,760 (78.3%) | 113 (6.4%) |
| 30 to 34 Years | 2,054 (78.2%) | 97 (4.7%) |
| 35 to 44 Years | 4,556 (83.5%) | 214 (4.7%) |
| 45 to 54 Years | 3,432 (77.0%) | 189 (5.5%) |
| 55 to 59 Years | 1,919 (67.7%) | 67 (3.5%) |
| 60 to 64 Years | 1,274 (52.7%) | 54 (4.2%) |
| 65 to 74 Years | 1,264 (30.3%) | 49 (3.9%) |
| 75 Years and over | 171 (5.7%) | 0 (0.0%) |
| Total | 19,258 (59.7%) | 1,098 (5.7%) |
Employment Status by Educational Attainment in Wharton County
According to labor force statistics for Wharton County, 74.8% of individuals (14,991) out of the total population between 25 and 64 years of age (20,041) are in the labor force, with 4.9% or 735 of them being unemployed. The group with the highest labor force participation rate are those with the educational attainment of bachelor's degree or higher, with 84.9% or 3,011 individuals in the labor force. Within the labor force, individuals with high school diploma education have the highest percentage of unemployment, with 9.3% or 404 of them being unemployed.
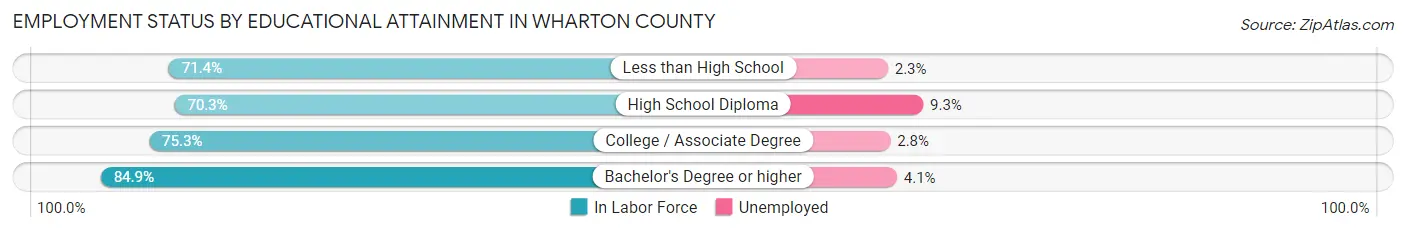
| Educational Attainment | In Labor Force | Unemployed |
| Less than High School | 2,420 (71.4%) | 78 (2.3%) |
| High School Diploma | 4,342 (70.3%) | 574 (9.3%) |
| College / Associate Degree | 5,218 (75.3%) | 194 (2.8%) |
| Bachelor's Degree or higher | 3,011 (84.9%) | 145 (4.1%) |
| Total | 14,991 (74.8%) | 982 (4.9%) |
Employment Occupations by Sex in Wharton County
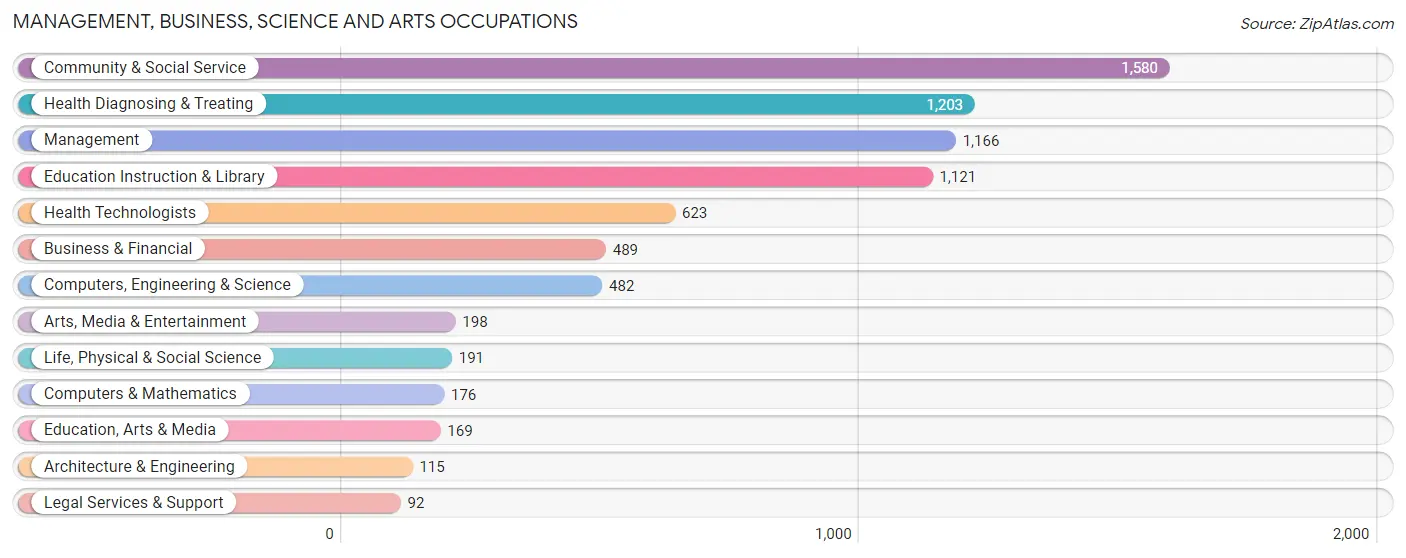
Management, Business, Science and Arts Occupations
The most common Management, Business, Science and Arts occupations in Wharton County are Community & Social Service (1,580 | 8.7%), Health Diagnosing & Treating (1,203 | 6.6%), Management (1,166 | 6.4%), Education Instruction & Library (1,121 | 6.2%), and Health Technologists (623 | 3.4%).
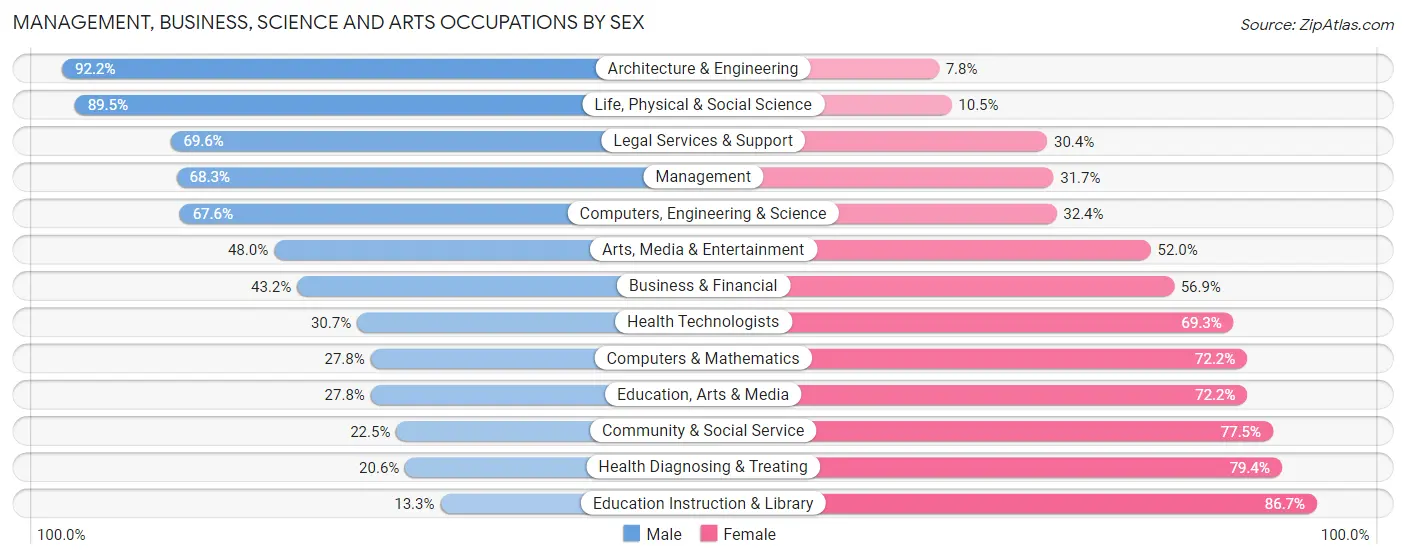
Management, Business, Science and Arts Occupations by Sex
Within the Management, Business, Science and Arts occupations in Wharton County, the most male-oriented occupations are Architecture & Engineering (92.2%), Life, Physical & Social Science (89.5%), and Legal Services & Support (69.6%), while the most female-oriented occupations are Education Instruction & Library (86.7%), Health Diagnosing & Treating (79.4%), and Community & Social Service (77.5%).
| Occupation | Male | Female |
| Management | 796 (68.3%) | 370 (31.7%) |
| Business & Financial | 211 (43.1%) | 278 (56.9%) |
| Computers, Engineering & Science | 326 (67.6%) | 156 (32.4%) |
| Computers & Mathematics | 49 (27.8%) | 127 (72.2%) |
| Architecture & Engineering | 106 (92.2%) | 9 (7.8%) |
| Life, Physical & Social Science | 171 (89.5%) | 20 (10.5%) |
| Community & Social Service | 355 (22.5%) | 1,225 (77.5%) |
| Education, Arts & Media | 47 (27.8%) | 122 (72.2%) |
| Legal Services & Support | 64 (69.6%) | 28 (30.4%) |
| Education Instruction & Library | 149 (13.3%) | 972 (86.7%) |
| Arts, Media & Entertainment | 95 (48.0%) | 103 (52.0%) |
| Health Diagnosing & Treating | 248 (20.6%) | 955 (79.4%) |
| Health Technologists | 191 (30.7%) | 432 (69.3%) |
| Total (Category) | 1,936 (39.4%) | 2,984 (60.7%) |
| Total (Overall) | 10,045 (55.3%) | 8,117 (44.7%) |
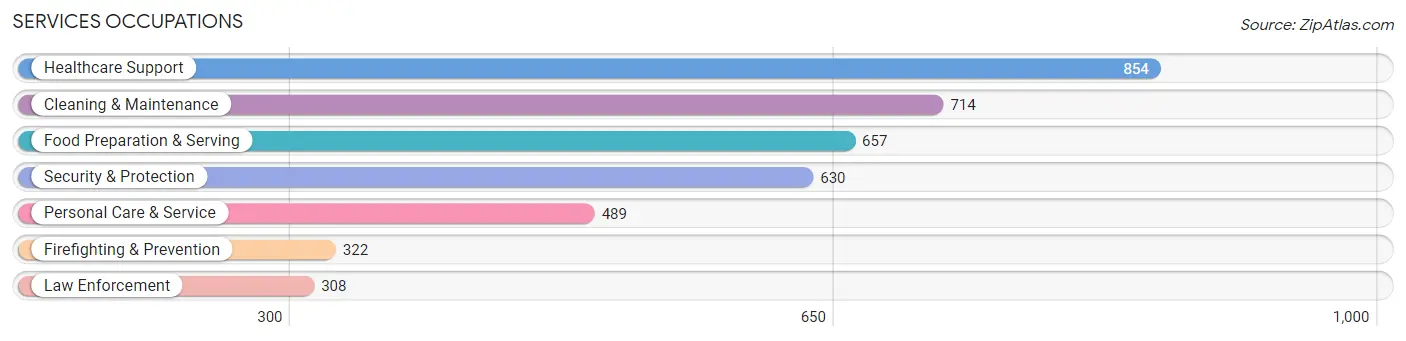
Services Occupations
The most common Services occupations in Wharton County are Healthcare Support (854 | 4.7%), Cleaning & Maintenance (714 | 3.9%), Food Preparation & Serving (657 | 3.6%), Security & Protection (630 | 3.5%), and Personal Care & Service (489 | 2.7%).
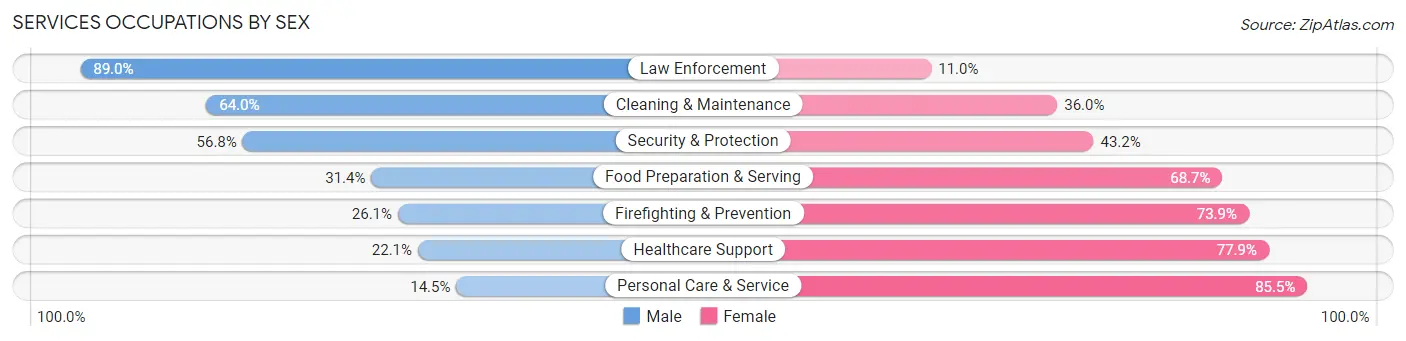
Services Occupations by Sex
Within the Services occupations in Wharton County, the most male-oriented occupations are Law Enforcement (89.0%), Cleaning & Maintenance (64.0%), and Security & Protection (56.8%), while the most female-oriented occupations are Personal Care & Service (85.5%), Healthcare Support (77.9%), and Firefighting & Prevention (73.9%).
| Occupation | Male | Female |
| Healthcare Support | 189 (22.1%) | 665 (77.9%) |
| Security & Protection | 358 (56.8%) | 272 (43.2%) |
| Firefighting & Prevention | 84 (26.1%) | 238 (73.9%) |
| Law Enforcement | 274 (89.0%) | 34 (11.0%) |
| Food Preparation & Serving | 206 (31.4%) | 451 (68.6%) |
| Cleaning & Maintenance | 457 (64.0%) | 257 (36.0%) |
| Personal Care & Service | 71 (14.5%) | 418 (85.5%) |
| Total (Category) | 1,281 (38.3%) | 2,063 (61.7%) |
| Total (Overall) | 10,045 (55.3%) | 8,117 (44.7%) |
Sales and Office Occupations
The most common Sales and Office occupations in Wharton County are Office & Administration (1,887 | 10.4%), and Sales & Related (1,861 | 10.2%).

Sales and Office Occupations by Sex

| Occupation | Male | Female |
| Sales & Related | 1,000 (53.7%) | 861 (46.3%) |
| Office & Administration | 298 (15.8%) | 1,589 (84.2%) |
| Total (Category) | 1,298 (34.6%) | 2,450 (65.4%) |
| Total (Overall) | 10,045 (55.3%) | 8,117 (44.7%) |
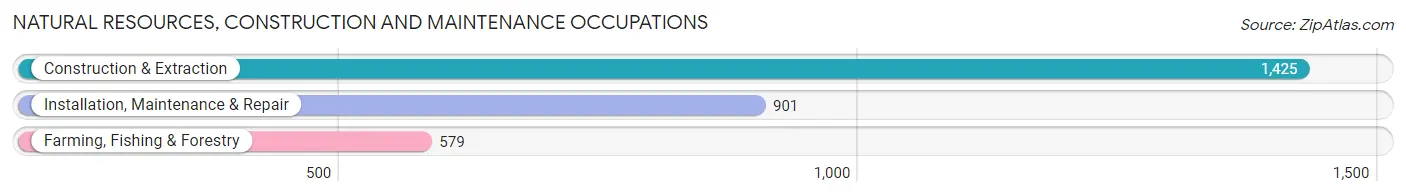
Natural Resources, Construction and Maintenance Occupations
The most common Natural Resources, Construction and Maintenance occupations in Wharton County are Construction & Extraction (1,425 | 7.9%), Installation, Maintenance & Repair (901 | 5.0%), and Farming, Fishing & Forestry (579 | 3.2%).
Natural Resources, Construction and Maintenance Occupations by Sex
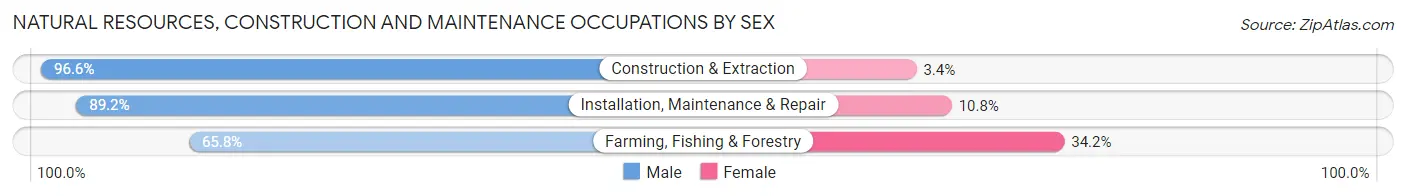
| Occupation | Male | Female |
| Farming, Fishing & Forestry | 381 (65.8%) | 198 (34.2%) |
| Construction & Extraction | 1,376 (96.6%) | 49 (3.4%) |
| Installation, Maintenance & Repair | 804 (89.2%) | 97 (10.8%) |
| Total (Category) | 2,561 (88.2%) | 344 (11.8%) |
| Total (Overall) | 10,045 (55.3%) | 8,117 (44.7%) |
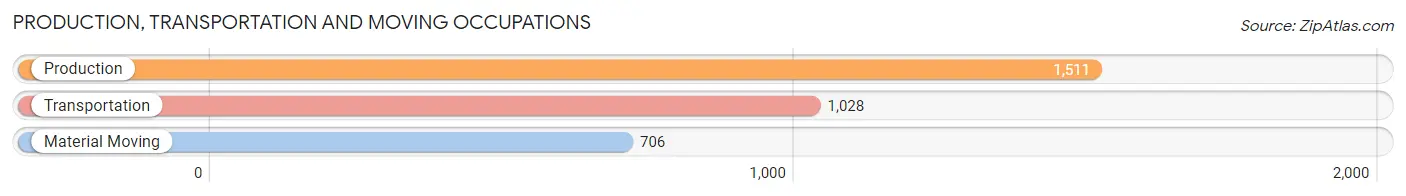
Production, Transportation and Moving Occupations
The most common Production, Transportation and Moving occupations in Wharton County are Production (1,511 | 8.3%), Transportation (1,028 | 5.7%), and Material Moving (706 | 3.9%).
Production, Transportation and Moving Occupations by Sex
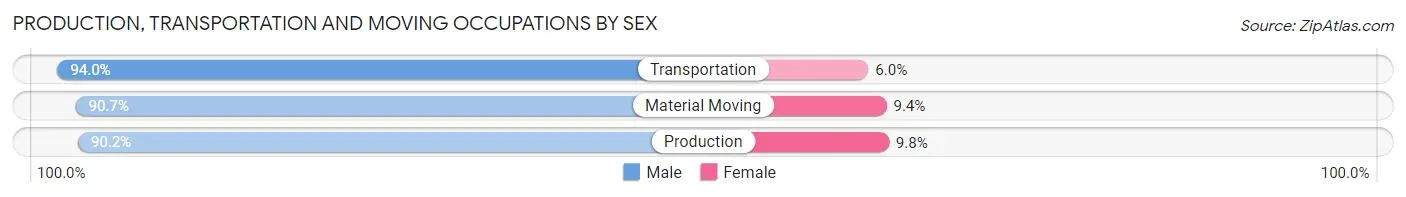
| Occupation | Male | Female |
| Production | 1,363 (90.2%) | 148 (9.8%) |
| Transportation | 966 (94.0%) | 62 (6.0%) |
| Material Moving | 640 (90.6%) | 66 (9.3%) |
| Total (Category) | 2,969 (91.5%) | 276 (8.5%) |
| Total (Overall) | 10,045 (55.3%) | 8,117 (44.7%) |
Employment Industries by Sex in Wharton County
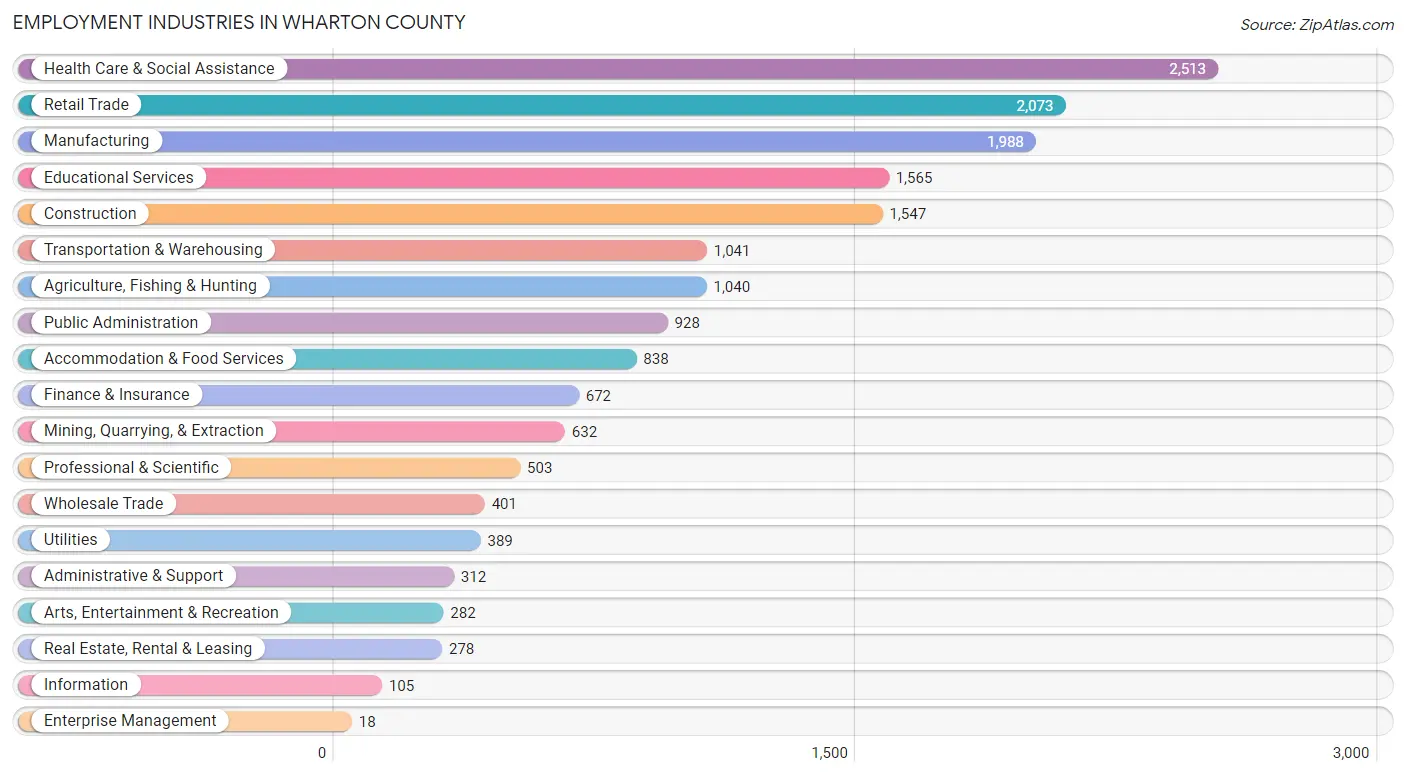
Employment Industries in Wharton County
The major employment industries in Wharton County include Health Care & Social Assistance (2,513 | 13.8%), Retail Trade (2,073 | 11.4%), Manufacturing (1,988 | 11.0%), Educational Services (1,565 | 8.6%), and Construction (1,547 | 8.5%).
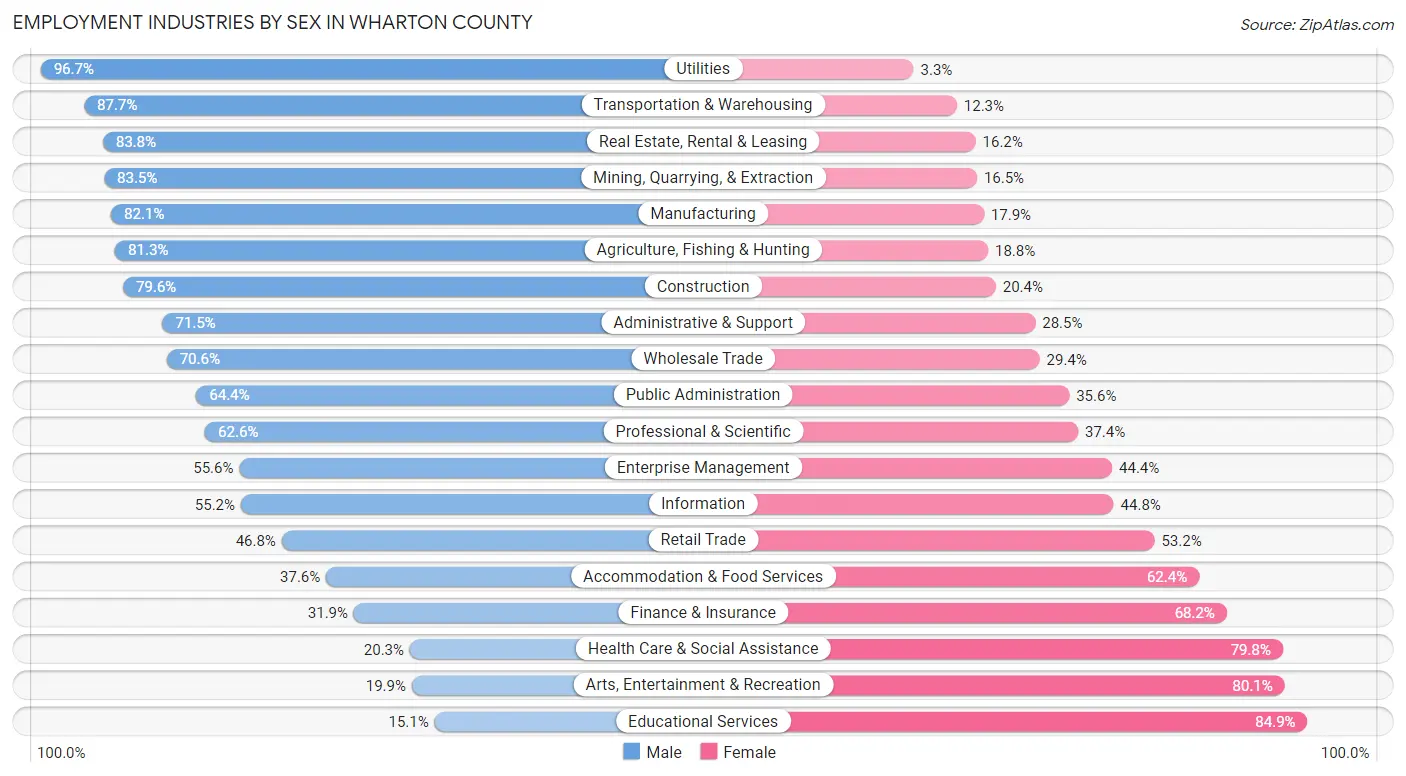
Employment Industries by Sex in Wharton County
The Wharton County industries that see more men than women are Utilities (96.7%), Transportation & Warehousing (87.7%), and Real Estate, Rental & Leasing (83.8%), whereas the industries that tend to have a higher number of women are Educational Services (84.9%), Arts, Entertainment & Recreation (80.1%), and Health Care & Social Assistance (79.7%).
| Industry | Male | Female |
| Agriculture, Fishing & Hunting | 845 (81.2%) | 195 (18.8%) |
| Mining, Quarrying, & Extraction | 528 (83.5%) | 104 (16.5%) |
| Construction | 1,232 (79.6%) | 315 (20.4%) |
| Manufacturing | 1,632 (82.1%) | 356 (17.9%) |
| Wholesale Trade | 283 (70.6%) | 118 (29.4%) |
| Retail Trade | 970 (46.8%) | 1,103 (53.2%) |
| Transportation & Warehousing | 913 (87.7%) | 128 (12.3%) |
| Utilities | 376 (96.7%) | 13 (3.3%) |
| Information | 58 (55.2%) | 47 (44.8%) |
| Finance & Insurance | 214 (31.9%) | 458 (68.1%) |
| Real Estate, Rental & Leasing | 233 (83.8%) | 45 (16.2%) |
| Professional & Scientific | 315 (62.6%) | 188 (37.4%) |
| Enterprise Management | 10 (55.6%) | 8 (44.4%) |
| Administrative & Support | 223 (71.5%) | 89 (28.5%) |
| Educational Services | 237 (15.1%) | 1,328 (84.9%) |
| Health Care & Social Assistance | 509 (20.3%) | 2,004 (79.7%) |
| Arts, Entertainment & Recreation | 56 (19.9%) | 226 (80.1%) |
| Accommodation & Food Services | 315 (37.6%) | 523 (62.4%) |
| Public Administration | 598 (64.4%) | 330 (35.6%) |
| Total | 10,045 (55.3%) | 8,117 (44.7%) |
Education in Wharton County
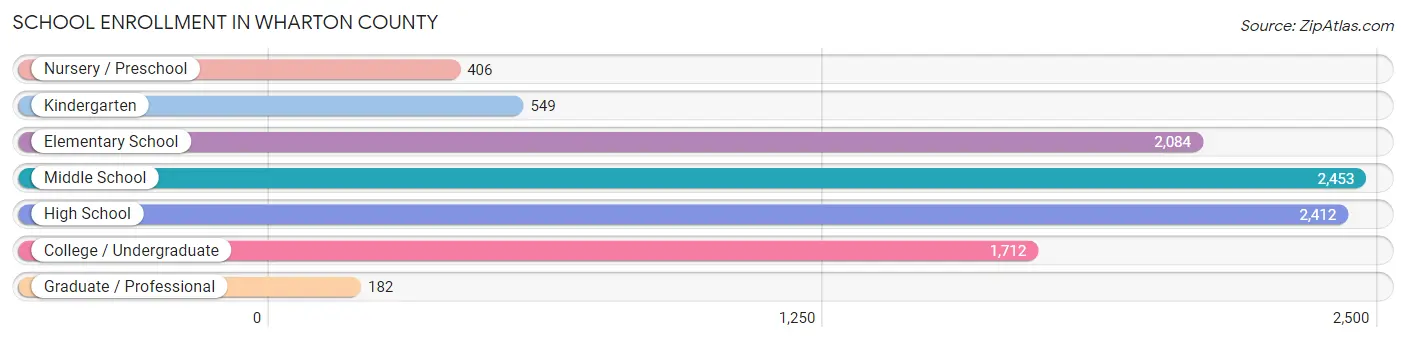
School Enrollment in Wharton County
The most common levels of schooling among the 9,798 students in Wharton County are middle school (2,453 | 25.0%), high school (2,412 | 24.6%), and elementary school (2,084 | 21.3%).
| School Level | # Students | % Students |
| Nursery / Preschool | 406 | 4.1% |
| Kindergarten | 549 | 5.6% |
| Elementary School | 2,084 | 21.3% |
| Middle School | 2,453 | 25.0% |
| High School | 2,412 | 24.6% |
| College / Undergraduate | 1,712 | 17.5% |
| Graduate / Professional | 182 | 1.9% |
| Total | 9,798 | 100.0% |
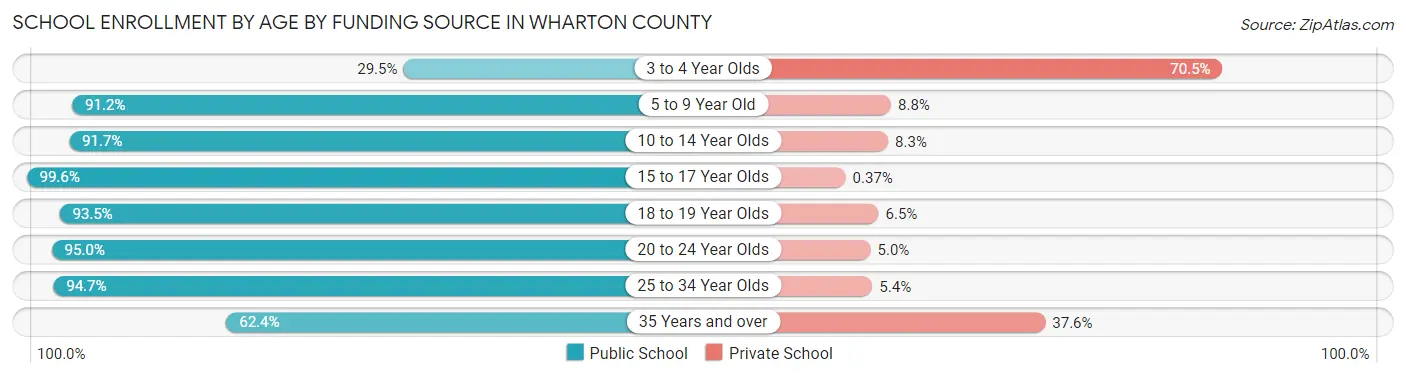
School Enrollment by Age by Funding Source in Wharton County
Out of a total of 9,798 students who are enrolled in schools in Wharton County, 941 (9.6%) attend a private institution, while the remaining 8,857 (90.4%) are enrolled in public schools. The age group of 3 to 4 year olds has the highest likelihood of being enrolled in private schools, with 237 (70.5% in the age bracket) enrolled. Conversely, the age group of 15 to 17 year olds has the lowest likelihood of being enrolled in a private school, with 1,867 (99.6% in the age bracket) attending a public institution.
| Age Bracket | Public School | Private School |
| 3 to 4 Year Olds | 99 (29.5%) | 237 (70.5%) |
| 5 to 9 Year Old | 2,280 (91.2%) | 221 (8.8%) |
| 10 to 14 Year Olds | 2,435 (91.7%) | 220 (8.3%) |
| 15 to 17 Year Olds | 1,867 (99.6%) | 7 (0.4%) |
| 18 to 19 Year Olds | 763 (93.5%) | 53 (6.5%) |
| 20 to 24 Year Olds | 757 (95.0%) | 40 (5.0%) |
| 25 to 34 Year Olds | 425 (94.7%) | 24 (5.3%) |
| 35 Years and over | 231 (62.4%) | 139 (37.6%) |
| Total | 8,857 (90.4%) | 941 (9.6%) |
Educational Attainment by Field of Study in Wharton County
Education (1,213 | 23.1%), business (1,142 | 21.7%), bio, nature & agricultural (639 | 12.2%), science & technology (612 | 11.7%), and arts & humanities (463 | 8.8%) are the most common fields of study among 5,254 individuals in Wharton County who have obtained a bachelor's degree or higher.
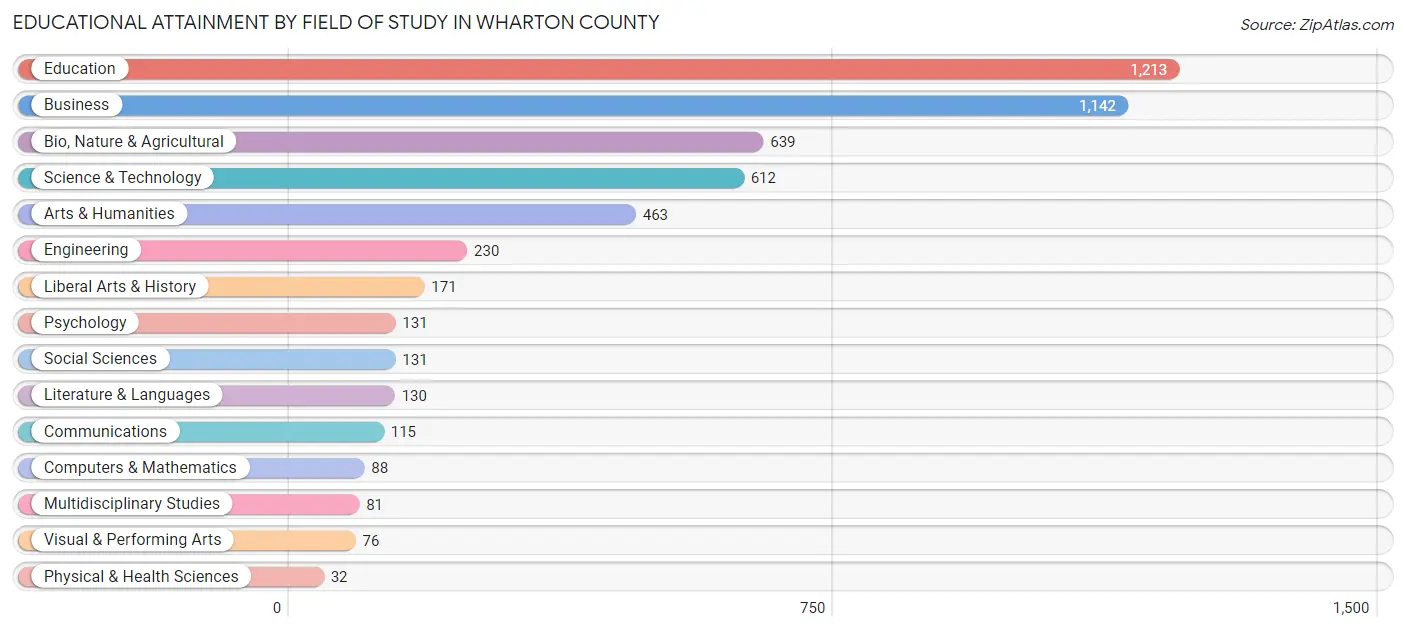
| Field of Study | # Graduates | % Graduates |
| Computers & Mathematics | 88 | 1.7% |
| Bio, Nature & Agricultural | 639 | 12.2% |
| Physical & Health Sciences | 32 | 0.6% |
| Psychology | 131 | 2.5% |
| Social Sciences | 131 | 2.5% |
| Engineering | 230 | 4.4% |
| Multidisciplinary Studies | 81 | 1.5% |
| Science & Technology | 612 | 11.7% |
| Business | 1,142 | 21.7% |
| Education | 1,213 | 23.1% |
| Literature & Languages | 130 | 2.5% |
| Liberal Arts & History | 171 | 3.3% |
| Visual & Performing Arts | 76 | 1.5% |
| Communications | 115 | 2.2% |
| Arts & Humanities | 463 | 8.8% |
| Total | 5,254 | 100.0% |
Transportation & Commute in Wharton County
Vehicle Availability by Sex in Wharton County
The most prevalent vehicle ownership categories in Wharton County are males with 2 vehicles (4,425, accounting for 44.7%) and females with 2 vehicles (3,048, making up 55.7%).
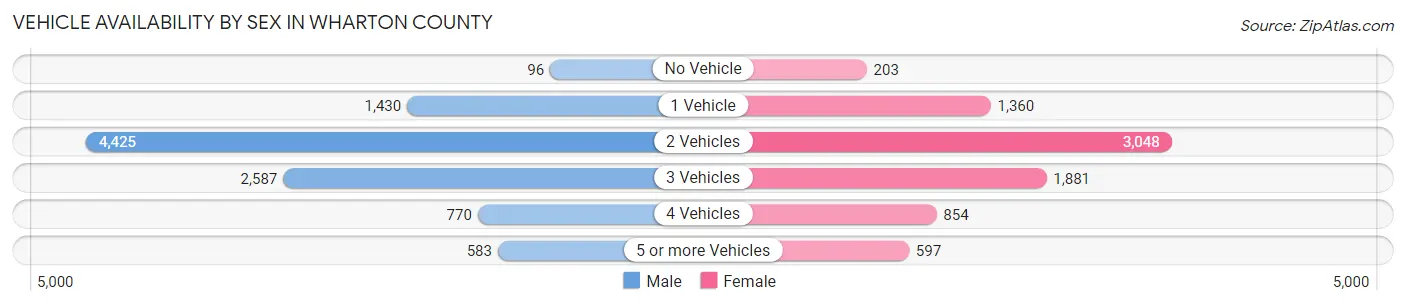
| Vehicles Available | Male | Female |
| No Vehicle | 96 (1.0%) | 203 (2.6%) |
| 1 Vehicle | 1,430 (14.5%) | 1,360 (17.1%) |
| 2 Vehicles | 4,425 (44.7%) | 3,048 (38.4%) |
| 3 Vehicles | 2,587 (26.2%) | 1,881 (23.7%) |
| 4 Vehicles | 770 (7.8%) | 854 (10.7%) |
| 5 or more Vehicles | 583 (5.9%) | 597 (7.5%) |
| Total | 9,891 (100.0%) | 7,943 (100.0%) |
Commute Time in Wharton County
The most frequently occuring commute durations in Wharton County are 5 to 9 minutes (2,978 commuters, 17.2%), 15 to 19 minutes (2,595 commuters, 15.0%), and 10 to 14 minutes (2,554 commuters, 14.8%).
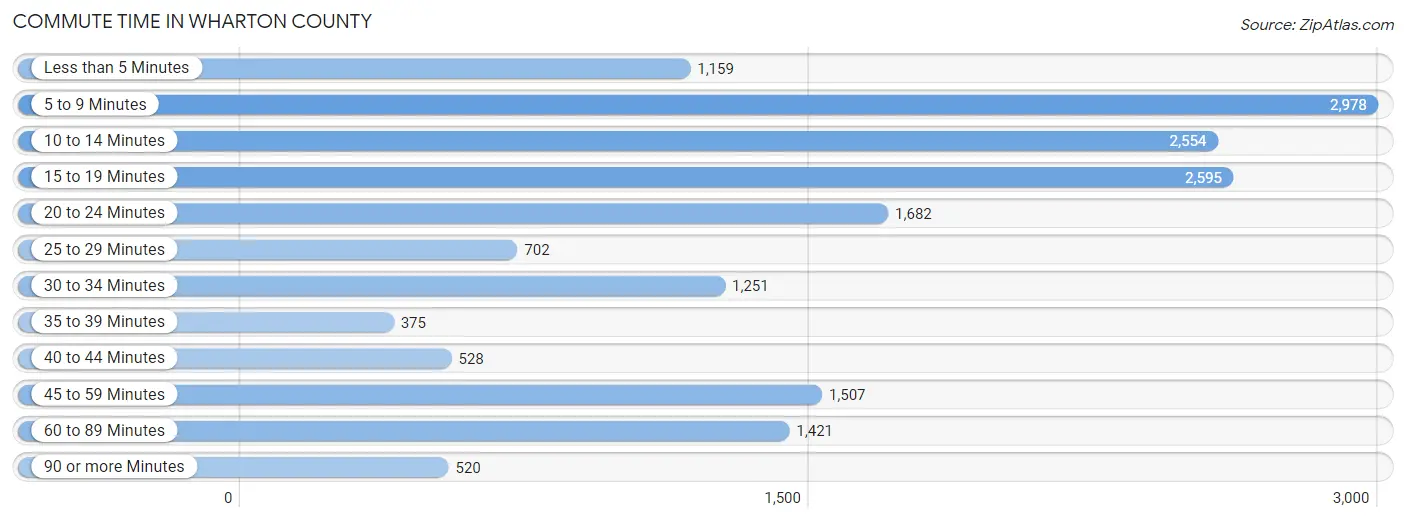
| Commute Time | # Commuters | % Commuters |
| Less than 5 Minutes | 1,159 | 6.7% |
| 5 to 9 Minutes | 2,978 | 17.2% |
| 10 to 14 Minutes | 2,554 | 14.8% |
| 15 to 19 Minutes | 2,595 | 15.0% |
| 20 to 24 Minutes | 1,682 | 9.7% |
| 25 to 29 Minutes | 702 | 4.1% |
| 30 to 34 Minutes | 1,251 | 7.2% |
| 35 to 39 Minutes | 375 | 2.2% |
| 40 to 44 Minutes | 528 | 3.1% |
| 45 to 59 Minutes | 1,507 | 8.7% |
| 60 to 89 Minutes | 1,421 | 8.2% |
| 90 or more Minutes | 520 | 3.0% |
Commute Time by Sex in Wharton County
The most common commute times in Wharton County are 5 to 9 minutes (1,592 commuters, 16.4%) for males and 5 to 9 minutes (1,386 commuters, 18.3%) for females.
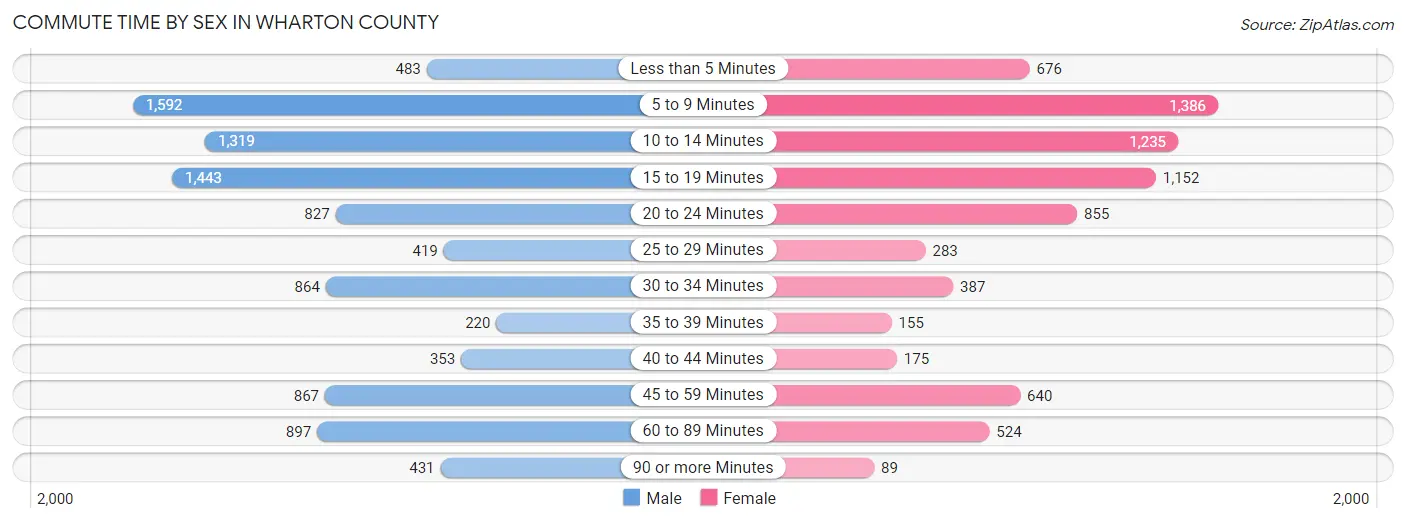
| Commute Time | Male | Female |
| Less than 5 Minutes | 483 (5.0%) | 676 (8.9%) |
| 5 to 9 Minutes | 1,592 (16.4%) | 1,386 (18.3%) |
| 10 to 14 Minutes | 1,319 (13.6%) | 1,235 (16.3%) |
| 15 to 19 Minutes | 1,443 (14.8%) | 1,152 (15.2%) |
| 20 to 24 Minutes | 827 (8.5%) | 855 (11.3%) |
| 25 to 29 Minutes | 419 (4.3%) | 283 (3.7%) |
| 30 to 34 Minutes | 864 (8.9%) | 387 (5.1%) |
| 35 to 39 Minutes | 220 (2.3%) | 155 (2.1%) |
| 40 to 44 Minutes | 353 (3.6%) | 175 (2.3%) |
| 45 to 59 Minutes | 867 (8.9%) | 640 (8.5%) |
| 60 to 89 Minutes | 897 (9.2%) | 524 (6.9%) |
| 90 or more Minutes | 431 (4.4%) | 89 (1.2%) |
Time of Departure to Work by Sex in Wharton County
The most frequent times of departure to work in Wharton County are 7:00 AM to 7:29 AM (1,913, 19.7%) for males and 7:00 AM to 7:29 AM (1,680, 22.2%) for females.
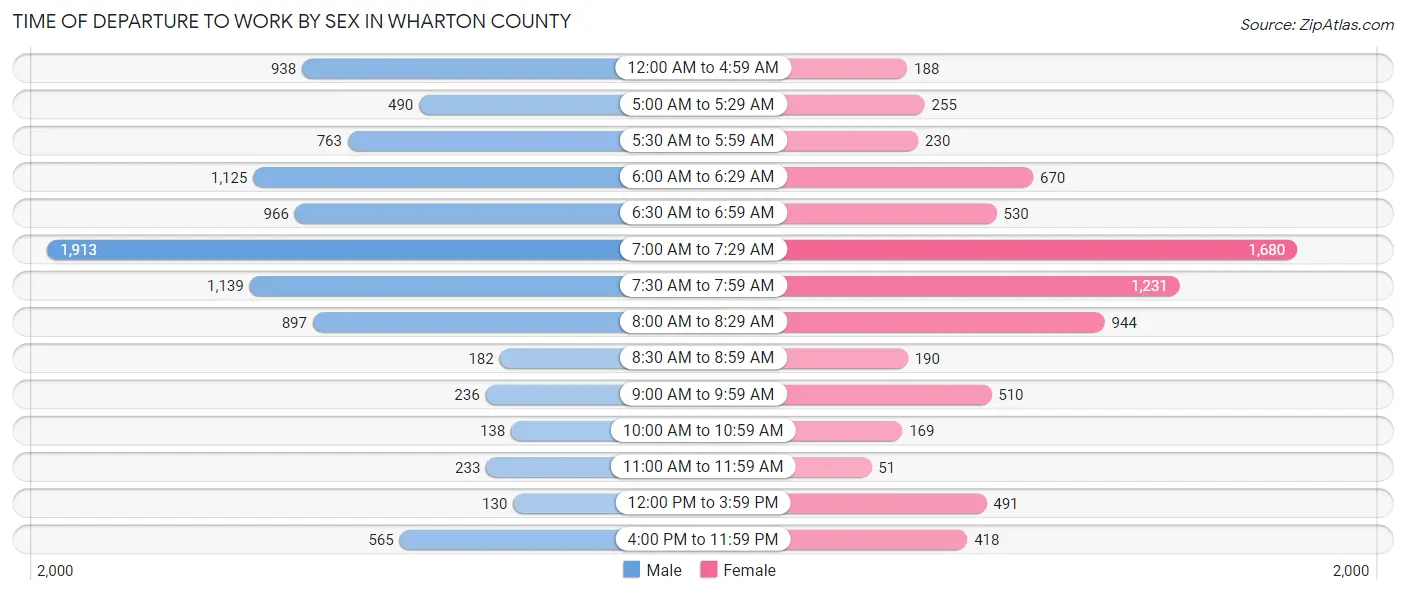
| Time of Departure | Male | Female |
| 12:00 AM to 4:59 AM | 938 (9.7%) | 188 (2.5%) |
| 5:00 AM to 5:29 AM | 490 (5.0%) | 255 (3.4%) |
| 5:30 AM to 5:59 AM | 763 (7.9%) | 230 (3.0%) |
| 6:00 AM to 6:29 AM | 1,125 (11.6%) | 670 (8.9%) |
| 6:30 AM to 6:59 AM | 966 (9.9%) | 530 (7.0%) |
| 7:00 AM to 7:29 AM | 1,913 (19.7%) | 1,680 (22.2%) |
| 7:30 AM to 7:59 AM | 1,139 (11.7%) | 1,231 (16.3%) |
| 8:00 AM to 8:29 AM | 897 (9.2%) | 944 (12.5%) |
| 8:30 AM to 8:59 AM | 182 (1.9%) | 190 (2.5%) |
| 9:00 AM to 9:59 AM | 236 (2.4%) | 510 (6.8%) |
| 10:00 AM to 10:59 AM | 138 (1.4%) | 169 (2.2%) |
| 11:00 AM to 11:59 AM | 233 (2.4%) | 51 (0.7%) |
| 12:00 PM to 3:59 PM | 130 (1.3%) | 491 (6.5%) |
| 4:00 PM to 11:59 PM | 565 (5.8%) | 418 (5.5%) |
| Total | 9,715 (100.0%) | 7,557 (100.0%) |
Housing Occupancy in Wharton County
Occupancy by Ownership in Wharton County
Of the total 15,148 dwellings in Wharton County, owner-occupied units account for 10,112 (66.7%), while renter-occupied units make up 5,036 (33.3%).
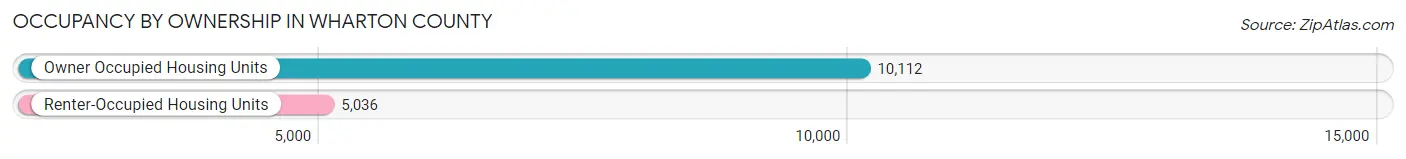
| Occupancy | # Housing Units | % Housing Units |
| Owner Occupied Housing Units | 10,112 | 66.7% |
| Renter-Occupied Housing Units | 5,036 | 33.3% |
| Total Occupied Housing Units | 15,148 | 100.0% |
Occupancy by Household Size in Wharton County
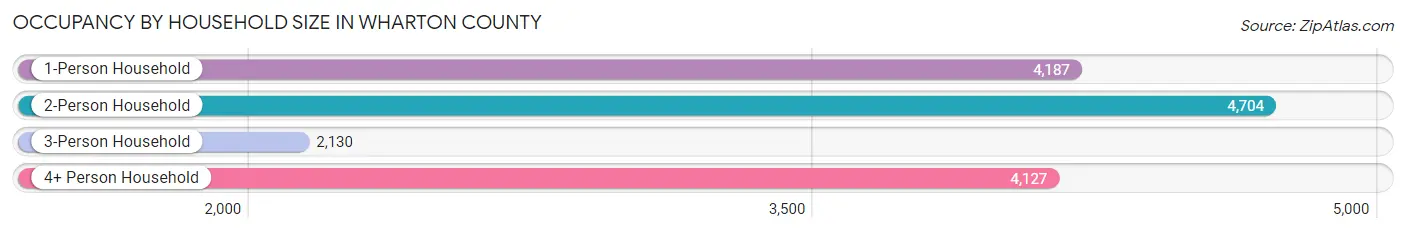
| Household Size | # Housing Units | % Housing Units |
| 1-Person Household | 4,187 | 27.6% |
| 2-Person Household | 4,704 | 31.0% |
| 3-Person Household | 2,130 | 14.1% |
| 4+ Person Household | 4,127 | 27.2% |
| Total Housing Units | 15,148 | 100.0% |
Occupancy by Ownership by Household Size in Wharton County
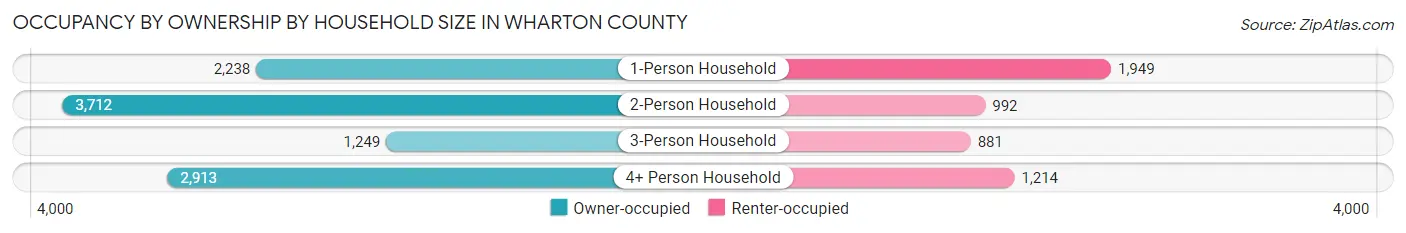
| Household Size | Owner-occupied | Renter-occupied |
| 1-Person Household | 2,238 (53.4%) | 1,949 (46.6%) |
| 2-Person Household | 3,712 (78.9%) | 992 (21.1%) |
| 3-Person Household | 1,249 (58.6%) | 881 (41.4%) |
| 4+ Person Household | 2,913 (70.6%) | 1,214 (29.4%) |
| Total Housing Units | 10,112 (66.7%) | 5,036 (33.3%) |
Occupancy by Educational Attainment in Wharton County
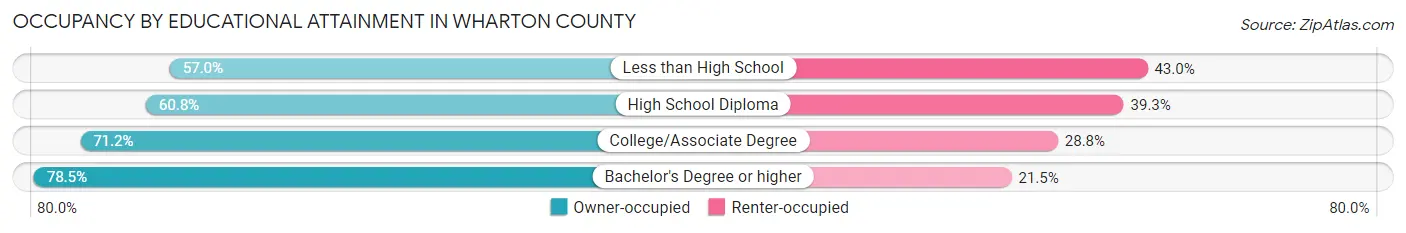
| Household Size | Owner-occupied | Renter-occupied |
| Less than High School | 1,834 (57.0%) | 1,385 (43.0%) |
| High School Diploma | 2,463 (60.8%) | 1,591 (39.3%) |
| College/Associate Degree | 3,577 (71.2%) | 1,448 (28.8%) |
| Bachelor's Degree or higher | 2,238 (78.5%) | 612 (21.5%) |
Occupancy by Age of Householder in Wharton County
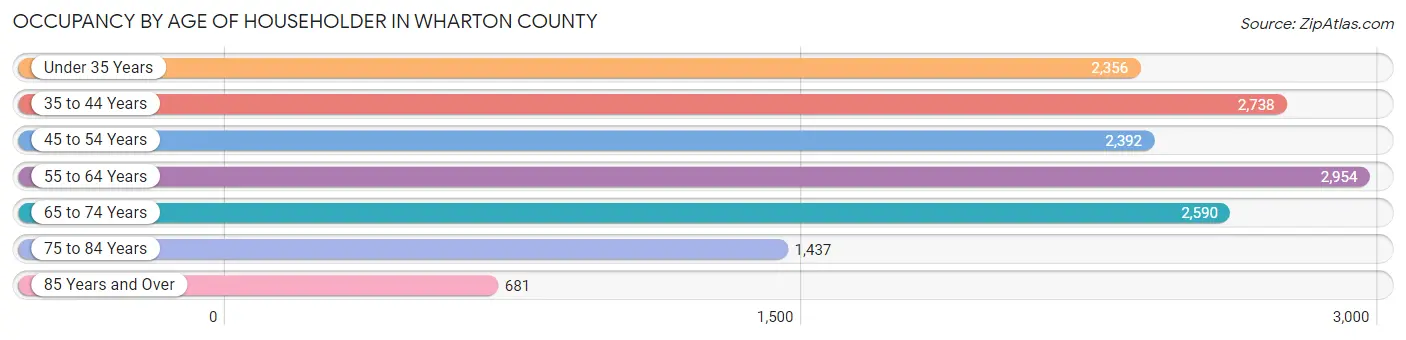
| Age Bracket | # Households | % Households |
| Under 35 Years | 2,356 | 15.5% |
| 35 to 44 Years | 2,738 | 18.1% |
| 45 to 54 Years | 2,392 | 15.8% |
| 55 to 64 Years | 2,954 | 19.5% |
| 65 to 74 Years | 2,590 | 17.1% |
| 75 to 84 Years | 1,437 | 9.5% |
| 85 Years and Over | 681 | 4.5% |
| Total | 15,148 | 100.0% |
Housing Finances in Wharton County
Median Income by Occupancy in Wharton County
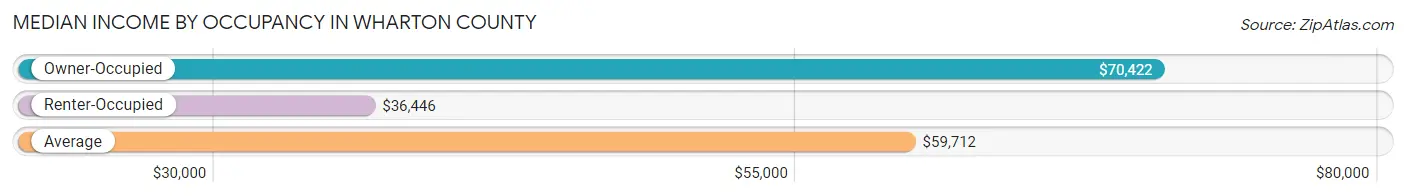
| Occupancy Type | # Households | Median Income |
| Owner-Occupied | 10,112 (66.7%) | $70,422 |
| Renter-Occupied | 5,036 (33.3%) | $36,446 |
| Average | 15,148 (100.0%) | $59,712 |
Occupancy by Householder Income Bracket in Wharton County
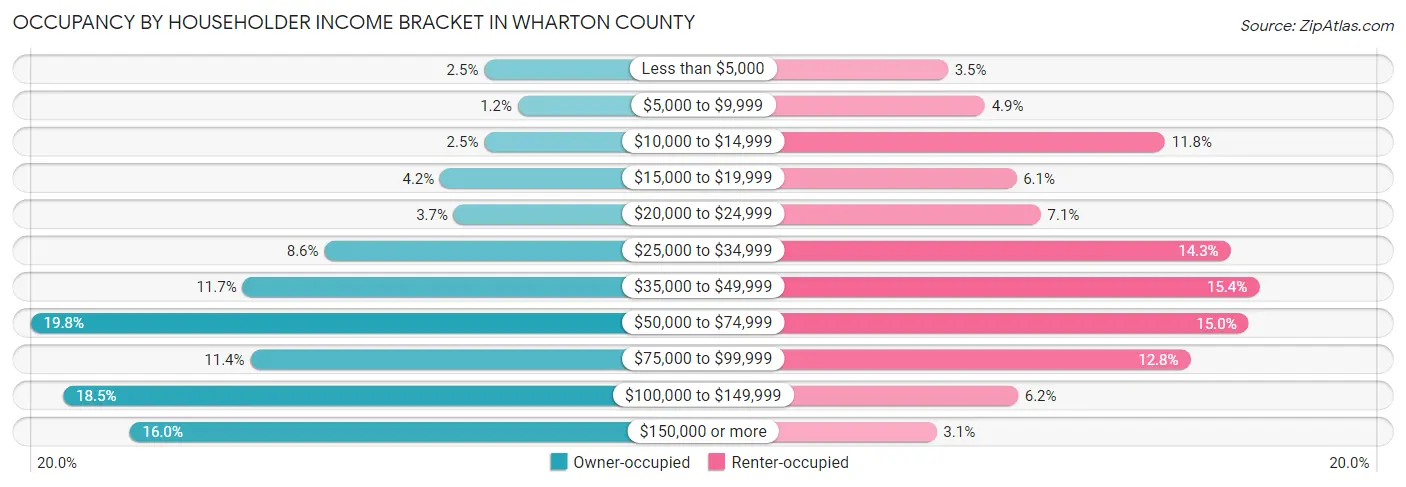
| Income Bracket | Owner-occupied | Renter-occupied |
| Less than $5,000 | 252 (2.5%) | 177 (3.5%) |
| $5,000 to $9,999 | 122 (1.2%) | 248 (4.9%) |
| $10,000 to $14,999 | 252 (2.5%) | 593 (11.8%) |
| $15,000 to $19,999 | 422 (4.2%) | 308 (6.1%) |
| $20,000 to $24,999 | 369 (3.6%) | 355 (7.0%) |
| $25,000 to $34,999 | 868 (8.6%) | 719 (14.3%) |
| $35,000 to $49,999 | 1,183 (11.7%) | 774 (15.4%) |
| $50,000 to $74,999 | 1,999 (19.8%) | 754 (15.0%) |
| $75,000 to $99,999 | 1,153 (11.4%) | 642 (12.8%) |
| $100,000 to $149,999 | 1,874 (18.5%) | 311 (6.2%) |
| $150,000 or more | 1,618 (16.0%) | 155 (3.1%) |
| Total | 10,112 (100.0%) | 5,036 (100.0%) |
Monthly Housing Cost Tiers in Wharton County
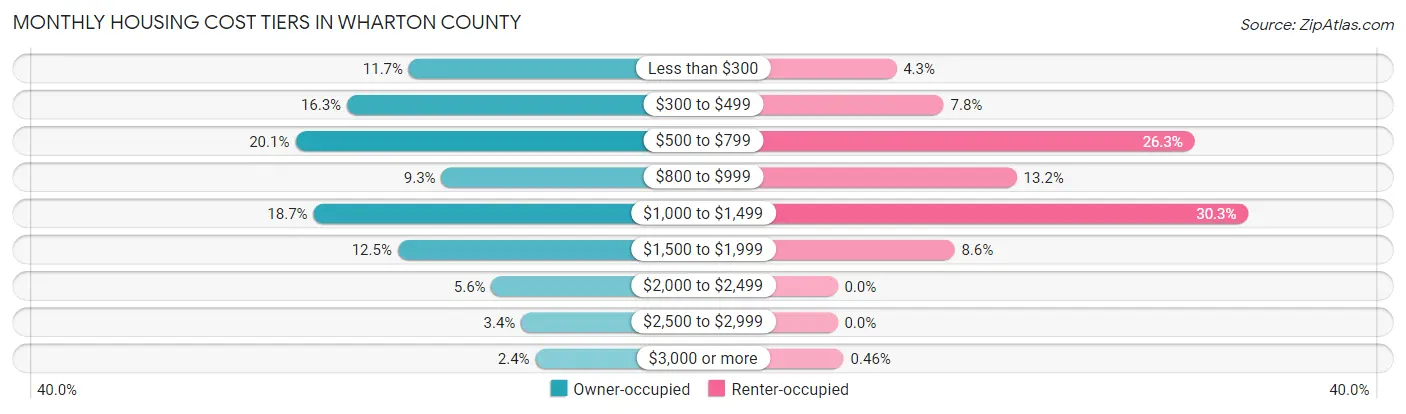
| Monthly Cost | Owner-occupied | Renter-occupied |
| Less than $300 | 1,183 (11.7%) | 218 (4.3%) |
| $300 to $499 | 1,644 (16.3%) | 394 (7.8%) |
| $500 to $799 | 2,029 (20.1%) | 1,325 (26.3%) |
| $800 to $999 | 940 (9.3%) | 665 (13.2%) |
| $1,000 to $1,499 | 1,894 (18.7%) | 1,524 (30.3%) |
| $1,500 to $1,999 | 1,266 (12.5%) | 434 (8.6%) |
| $2,000 to $2,499 | 568 (5.6%) | 0 (0.0%) |
| $2,500 to $2,999 | 347 (3.4%) | 0 (0.0%) |
| $3,000 or more | 241 (2.4%) | 23 (0.5%) |
| Total | 10,112 (100.0%) | 5,036 (100.0%) |
Physical Housing Characteristics in Wharton County
Housing Structures in Wharton County
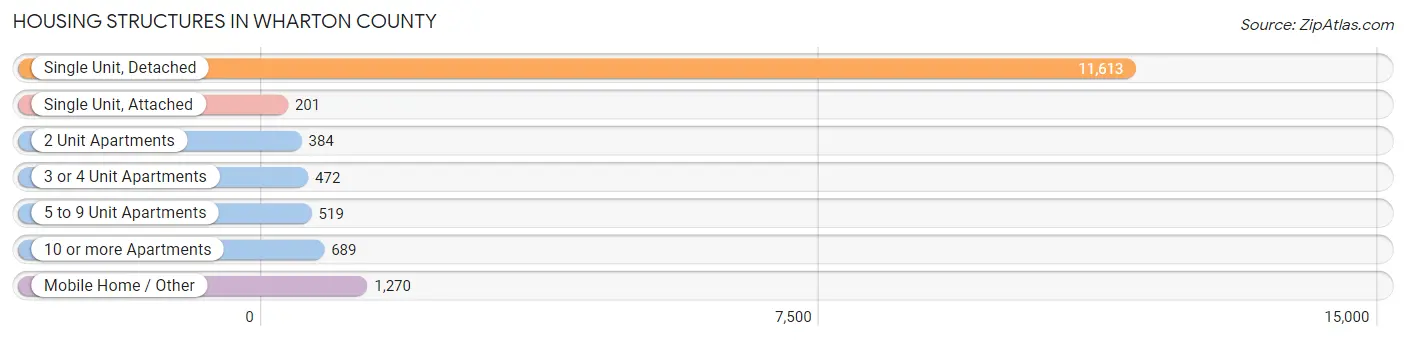
| Structure Type | # Housing Units | % Housing Units |
| Single Unit, Detached | 11,613 | 76.7% |
| Single Unit, Attached | 201 | 1.3% |
| 2 Unit Apartments | 384 | 2.5% |
| 3 or 4 Unit Apartments | 472 | 3.1% |
| 5 to 9 Unit Apartments | 519 | 3.4% |
| 10 or more Apartments | 689 | 4.5% |
| Mobile Home / Other | 1,270 | 8.4% |
| Total | 15,148 | 100.0% |
Housing Structures by Occupancy in Wharton County
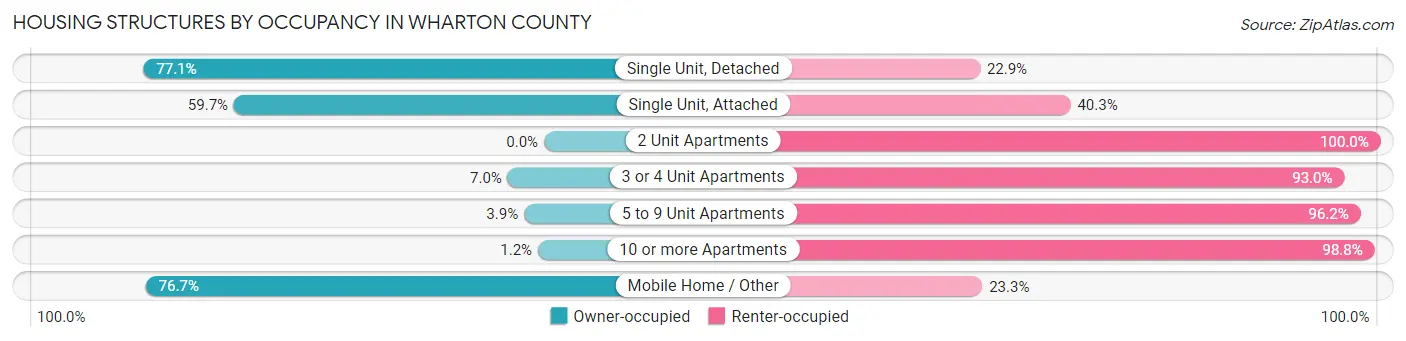
| Structure Type | Owner-occupied | Renter-occupied |
| Single Unit, Detached | 8,957 (77.1%) | 2,656 (22.9%) |
| Single Unit, Attached | 120 (59.7%) | 81 (40.3%) |
| 2 Unit Apartments | 0 (0.0%) | 384 (100.0%) |
| 3 or 4 Unit Apartments | 33 (7.0%) | 439 (93.0%) |
| 5 to 9 Unit Apartments | 20 (3.8%) | 499 (96.2%) |
| 10 or more Apartments | 8 (1.2%) | 681 (98.8%) |
| Mobile Home / Other | 974 (76.7%) | 296 (23.3%) |
| Total | 10,112 (66.7%) | 5,036 (33.3%) |
Housing Structures by Number of Rooms in Wharton County
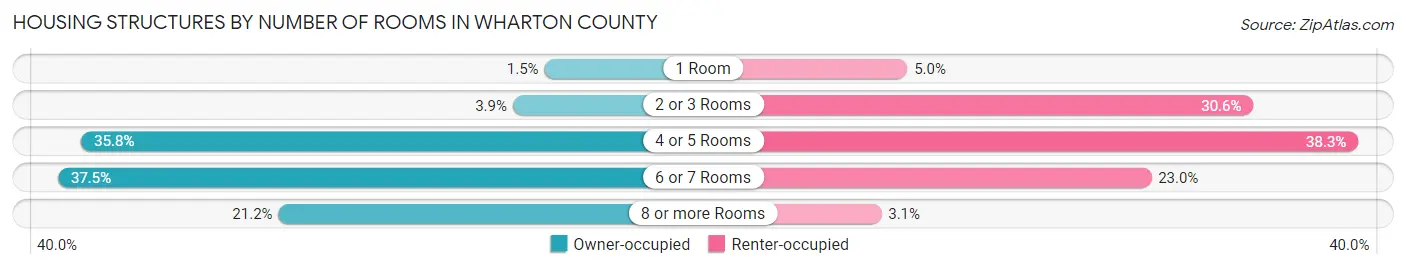
| Number of Rooms | Owner-occupied | Renter-occupied |
| 1 Room | 156 (1.5%) | 251 (5.0%) |
| 2 or 3 Rooms | 392 (3.9%) | 1,540 (30.6%) |
| 4 or 5 Rooms | 3,622 (35.8%) | 1,931 (38.3%) |
| 6 or 7 Rooms | 3,796 (37.5%) | 1,160 (23.0%) |
| 8 or more Rooms | 2,146 (21.2%) | 154 (3.1%) |
| Total | 10,112 (100.0%) | 5,036 (100.0%) |
Housing Structure by Heating Type in Wharton County
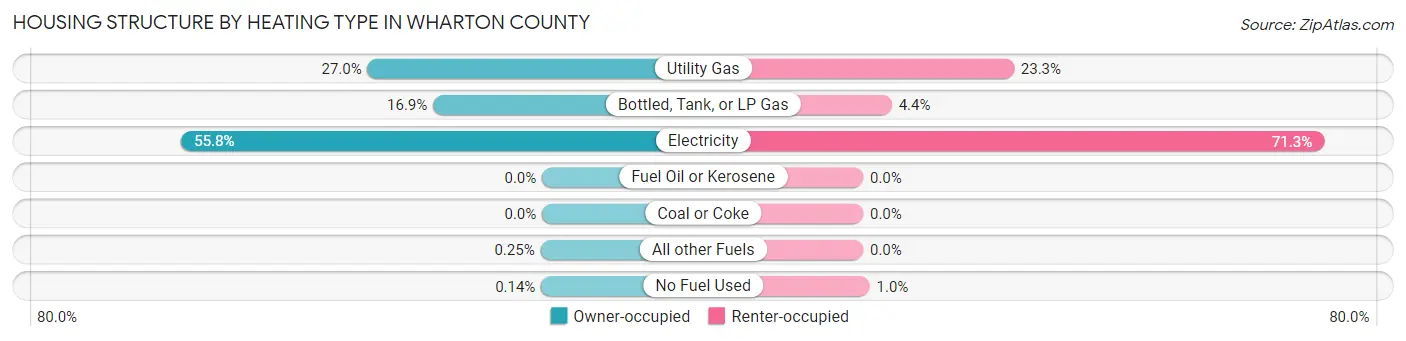
| Heating Type | Owner-occupied | Renter-occupied |
| Utility Gas | 2,728 (27.0%) | 1,174 (23.3%) |
| Bottled, Tank, or LP Gas | 1,704 (16.9%) | 223 (4.4%) |
| Electricity | 5,641 (55.8%) | 3,588 (71.3%) |
| Fuel Oil or Kerosene | 0 (0.0%) | 0 (0.0%) |
| Coal or Coke | 0 (0.0%) | 0 (0.0%) |
| All other Fuels | 25 (0.3%) | 0 (0.0%) |
| No Fuel Used | 14 (0.1%) | 51 (1.0%) |
| Total | 10,112 (100.0%) | 5,036 (100.0%) |
Household Vehicle Usage in Wharton County
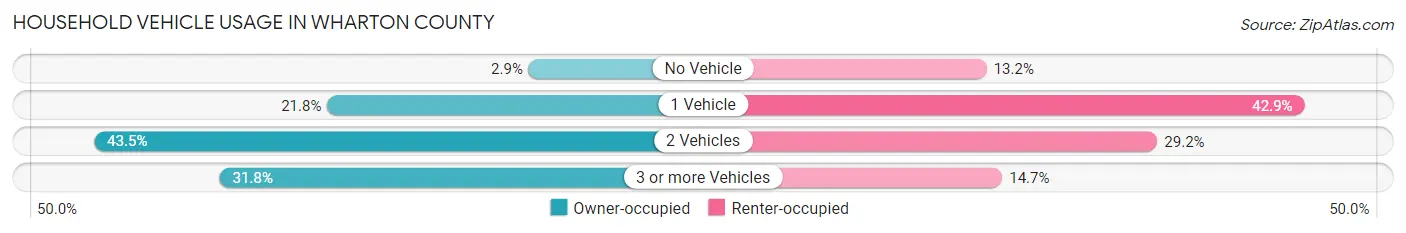
| Vehicles per Household | Owner-occupied | Renter-occupied |
| No Vehicle | 297 (2.9%) | 667 (13.2%) |
| 1 Vehicle | 2,199 (21.7%) | 2,160 (42.9%) |
| 2 Vehicles | 4,400 (43.5%) | 1,469 (29.2%) |
| 3 or more Vehicles | 3,216 (31.8%) | 740 (14.7%) |
| Total | 10,112 (100.0%) | 5,036 (100.0%) |
Real Estate & Mortgages in Wharton County
Real Estate and Mortgage Overview in Wharton County
| Characteristic | Without Mortgage | With Mortgage |
| Housing Units | 5,885 | 4,227 |
| Median Property Value | $154,400 | $190,200 |
| Median Household Income | $57,508 | $865 |
| Monthly Housing Costs | $525 | $236 |
| Real Estate Taxes | $2,222 | $46 |
Property Value by Mortgage Status in Wharton County
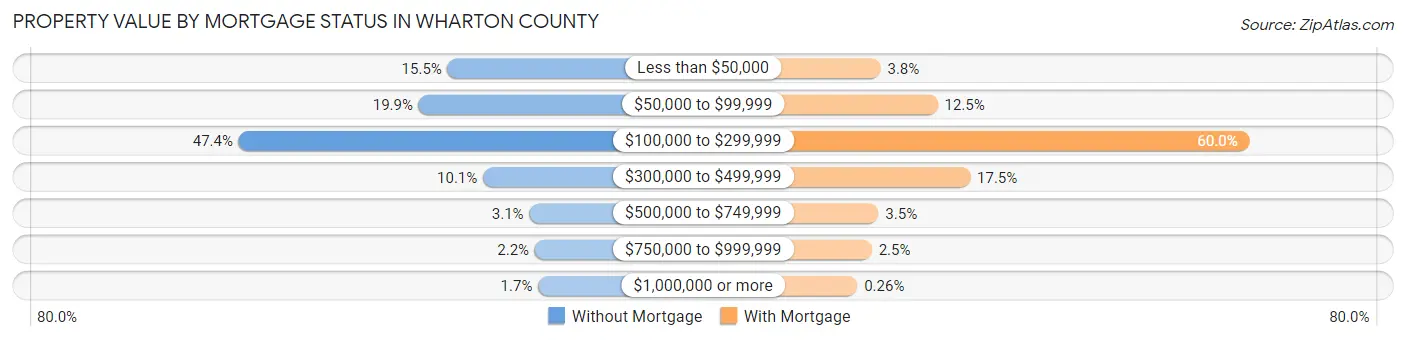
| Property Value | Without Mortgage | With Mortgage |
| Less than $50,000 | 914 (15.5%) | 161 (3.8%) |
| $50,000 to $99,999 | 1,173 (19.9%) | 528 (12.5%) |
| $100,000 to $299,999 | 2,787 (47.4%) | 2,538 (60.0%) |
| $300,000 to $499,999 | 596 (10.1%) | 738 (17.5%) |
| $500,000 to $749,999 | 181 (3.1%) | 147 (3.5%) |
| $750,000 to $999,999 | 132 (2.2%) | 104 (2.5%) |
| $1,000,000 or more | 102 (1.7%) | 11 (0.3%) |
| Total | 5,885 (100.0%) | 4,227 (100.0%) |
Household Income by Mortgage Status in Wharton County
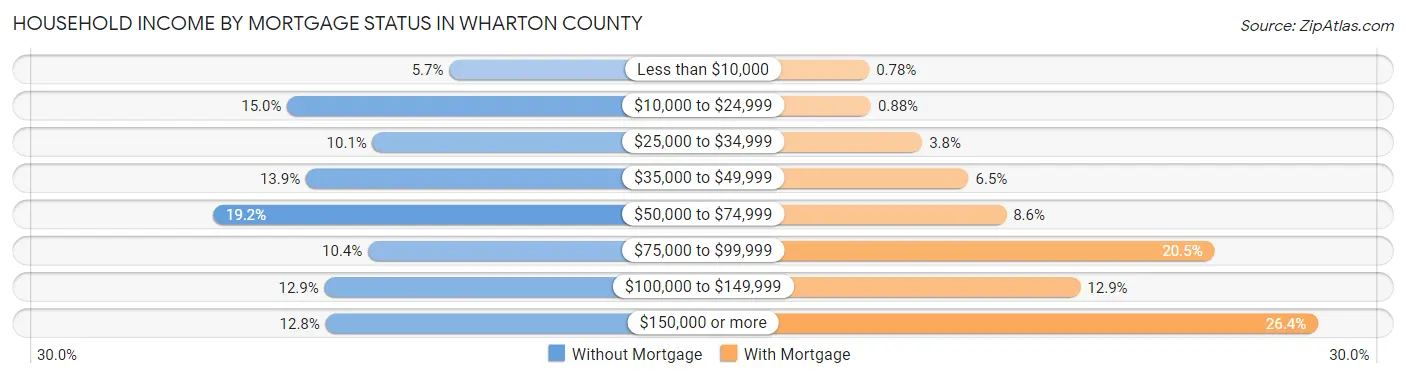
| Household Income | Without Mortgage | With Mortgage |
| Less than $10,000 | 337 (5.7%) | 33 (0.8%) |
| $10,000 to $24,999 | 882 (15.0%) | 37 (0.9%) |
| $25,000 to $34,999 | 595 (10.1%) | 161 (3.8%) |
| $35,000 to $49,999 | 819 (13.9%) | 273 (6.5%) |
| $50,000 to $74,999 | 1,132 (19.2%) | 364 (8.6%) |
| $75,000 to $99,999 | 610 (10.4%) | 867 (20.5%) |
| $100,000 to $149,999 | 757 (12.9%) | 543 (12.9%) |
| $150,000 or more | 753 (12.8%) | 1,117 (26.4%) |
| Total | 5,885 (100.0%) | 4,227 (100.0%) |
Property Value to Household Income Ratio in Wharton County
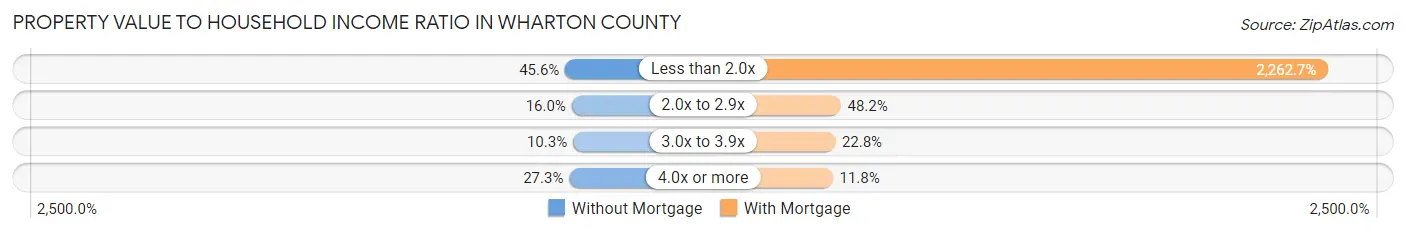
| Value-to-Income Ratio | Without Mortgage | With Mortgage |
| Less than 2.0x | 2,682 (45.6%) | 95,644 (2,262.7%) |
| 2.0x to 2.9x | 943 (16.0%) | 2,036 (48.2%) |
| 3.0x to 3.9x | 604 (10.3%) | 964 (22.8%) |
| 4.0x or more | 1,604 (27.3%) | 499 (11.8%) |
| Total | 5,885 (100.0%) | 4,227 (100.0%) |
Real Estate Taxes by Mortgage Status in Wharton County
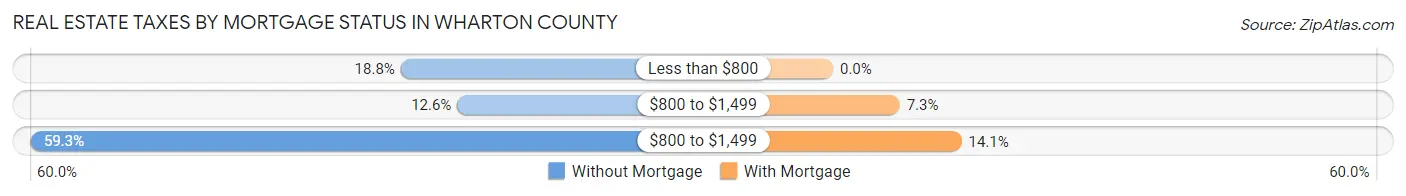
| Property Taxes | Without Mortgage | With Mortgage |
| Less than $800 | 1,106 (18.8%) | 0 (0.0%) |
| $800 to $1,499 | 741 (12.6%) | 309 (7.3%) |
| $800 to $1,499 | 3,491 (59.3%) | 595 (14.1%) |
| Total | 5,885 (100.0%) | 4,227 (100.0%) |
Health & Disability in Wharton County
Health Insurance Coverage by Age in Wharton County
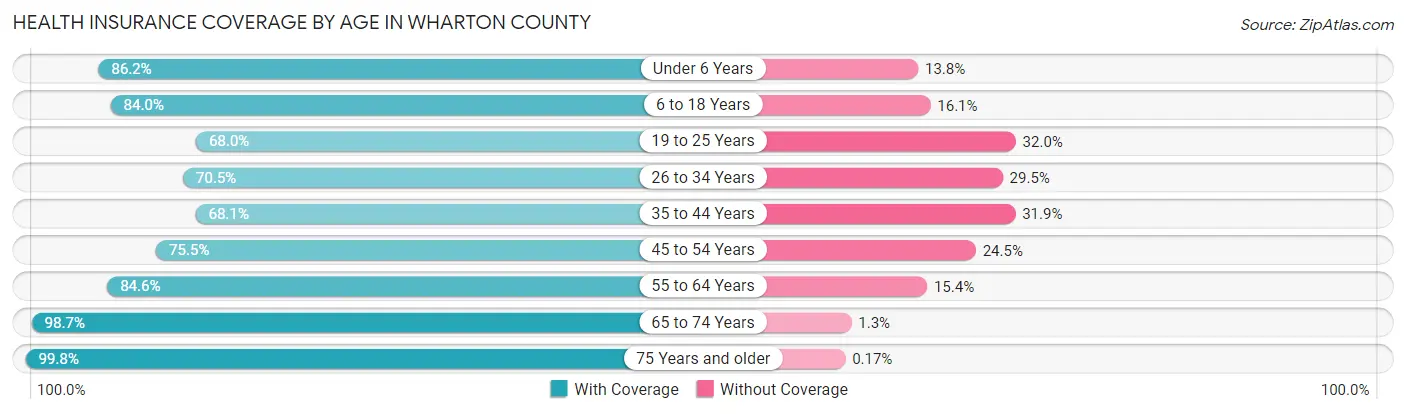
| Age Bracket | With Coverage | Without Coverage |
| Under 6 Years | 2,902 (86.2%) | 463 (13.8%) |
| 6 to 18 Years | 6,696 (84.0%) | 1,280 (16.1%) |
| 19 to 25 Years | 2,327 (68.0%) | 1,093 (32.0%) |
| 26 to 34 Years | 3,116 (70.5%) | 1,306 (29.5%) |
| 35 to 44 Years | 3,697 (68.1%) | 1,730 (31.9%) |
| 45 to 54 Years | 3,335 (75.5%) | 1,083 (24.5%) |
| 55 to 64 Years | 4,394 (84.6%) | 801 (15.4%) |
| 65 to 74 Years | 4,067 (98.7%) | 54 (1.3%) |
| 75 Years and older | 2,885 (99.8%) | 5 (0.2%) |
| Total | 33,419 (81.0%) | 7,815 (19.0%) |
Health Insurance Coverage by Citizenship Status in Wharton County
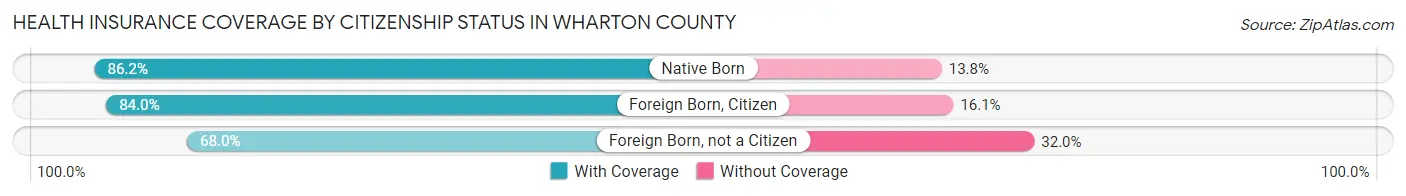
| Citizenship Status | With Coverage | Without Coverage |
| Native Born | 2,902 (86.2%) | 463 (13.8%) |
| Foreign Born, Citizen | 6,696 (84.0%) | 1,280 (16.1%) |
| Foreign Born, not a Citizen | 2,327 (68.0%) | 1,093 (32.0%) |
Health Insurance Coverage by Household Income in Wharton County
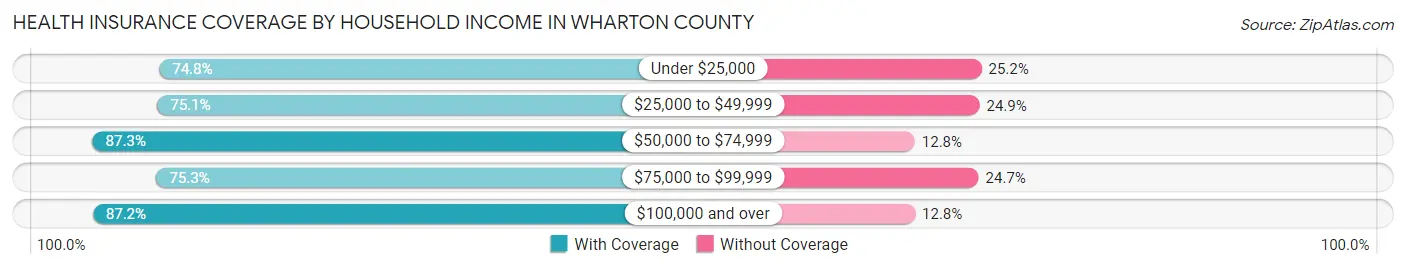
| Household Income | With Coverage | Without Coverage |
| Under $25,000 | 3,986 (74.8%) | 1,346 (25.2%) |
| $25,000 to $49,999 | 6,767 (75.1%) | 2,240 (24.9%) |
| $50,000 to $74,999 | 6,282 (87.3%) | 918 (12.8%) |
| $75,000 to $99,999 | 4,807 (75.3%) | 1,577 (24.7%) |
| $100,000 and over | 11,364 (87.2%) | 1,668 (12.8%) |
Public vs Private Health Insurance Coverage by Age in Wharton County
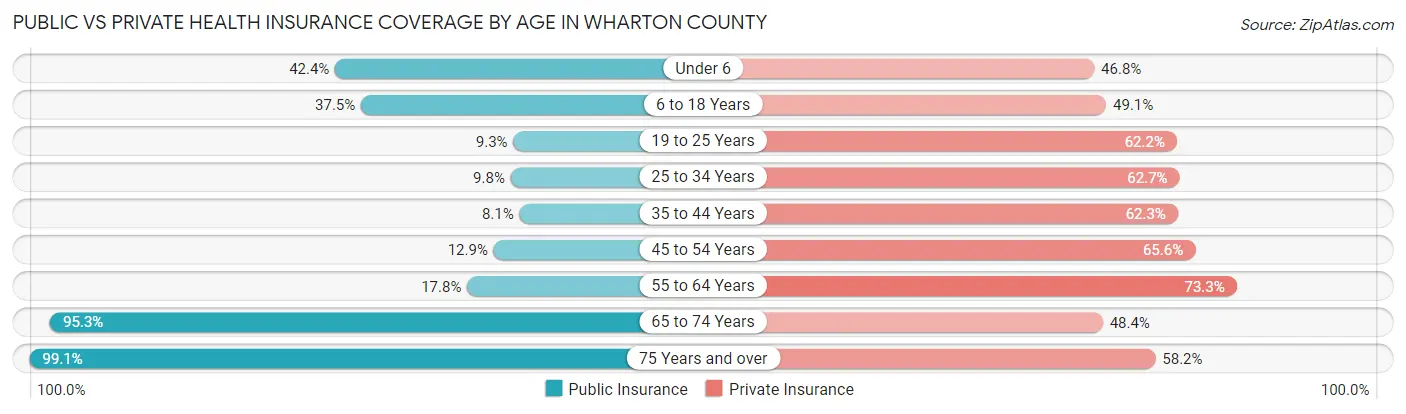
| Age Bracket | Public Insurance | Private Insurance |
| Under 6 | 1,425 (42.3%) | 1,576 (46.8%) |
| 6 to 18 Years | 2,994 (37.5%) | 3,913 (49.1%) |
| 19 to 25 Years | 317 (9.3%) | 2,126 (62.2%) |
| 25 to 34 Years | 432 (9.8%) | 2,771 (62.7%) |
| 35 to 44 Years | 441 (8.1%) | 3,383 (62.3%) |
| 45 to 54 Years | 571 (12.9%) | 2,896 (65.5%) |
| 55 to 64 Years | 927 (17.8%) | 3,806 (73.3%) |
| 65 to 74 Years | 3,927 (95.3%) | 1,996 (48.4%) |
| 75 Years and over | 2,864 (99.1%) | 1,682 (58.2%) |
| Total | 13,898 (33.7%) | 24,149 (58.6%) |
Disability Status by Sex by Age in Wharton County
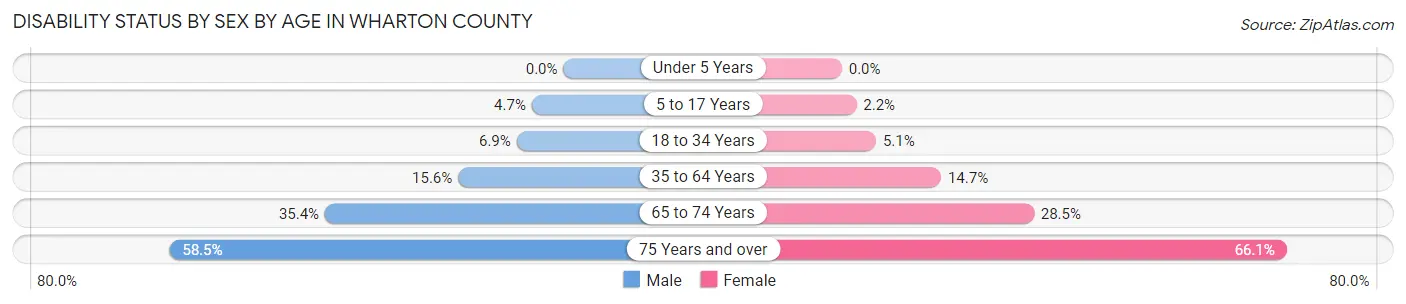
| Age Bracket | Male | Female |
| Under 5 Years | 0 (0.0%) | 0 (0.0%) |
| 5 to 17 Years | 196 (4.7%) | 80 (2.2%) |
| 18 to 34 Years | 285 (6.9%) | 221 (5.1%) |
| 35 to 64 Years | 1,186 (15.6%) | 1,098 (14.7%) |
| 65 to 74 Years | 730 (35.4%) | 587 (28.5%) |
| 75 Years and over | 660 (58.5%) | 1,164 (66.1%) |
Disability Class by Sex by Age in Wharton County
Disability Class: Hearing Difficulty
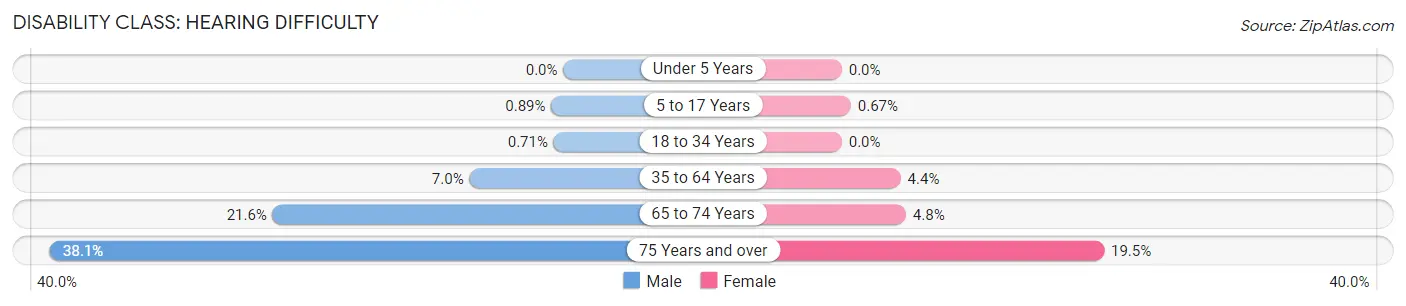
| Age Bracket | Male | Female |
| Under 5 Years | 0 (0.0%) | 0 (0.0%) |
| 5 to 17 Years | 37 (0.9%) | 25 (0.7%) |
| 18 to 34 Years | 29 (0.7%) | 0 (0.0%) |
| 35 to 64 Years | 529 (7.0%) | 326 (4.4%) |
| 65 to 74 Years | 445 (21.6%) | 98 (4.8%) |
| 75 Years and over | 430 (38.1%) | 343 (19.5%) |
Disability Class: Vision Difficulty
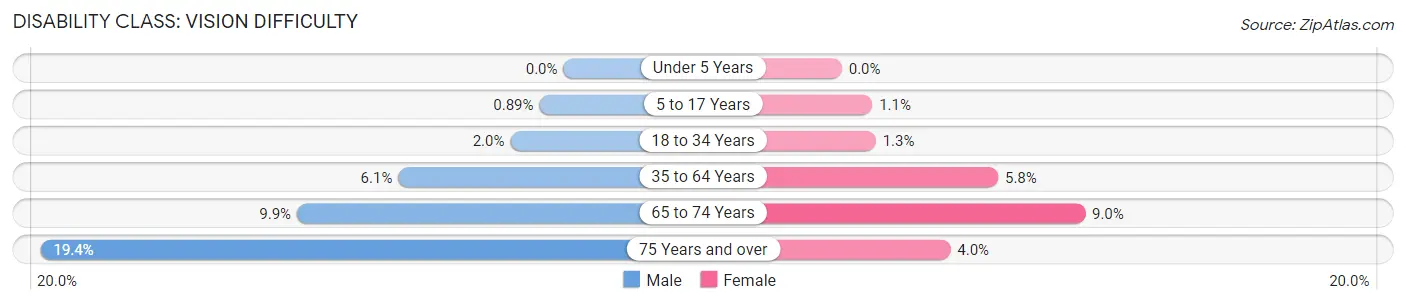
| Age Bracket | Male | Female |
| Under 5 Years | 0 (0.0%) | 0 (0.0%) |
| 5 to 17 Years | 37 (0.9%) | 42 (1.1%) |
| 18 to 34 Years | 81 (2.0%) | 55 (1.3%) |
| 35 to 64 Years | 465 (6.1%) | 432 (5.8%) |
| 65 to 74 Years | 204 (9.9%) | 186 (9.0%) |
| 75 Years and over | 219 (19.4%) | 71 (4.0%) |
Disability Class: Cognitive Difficulty
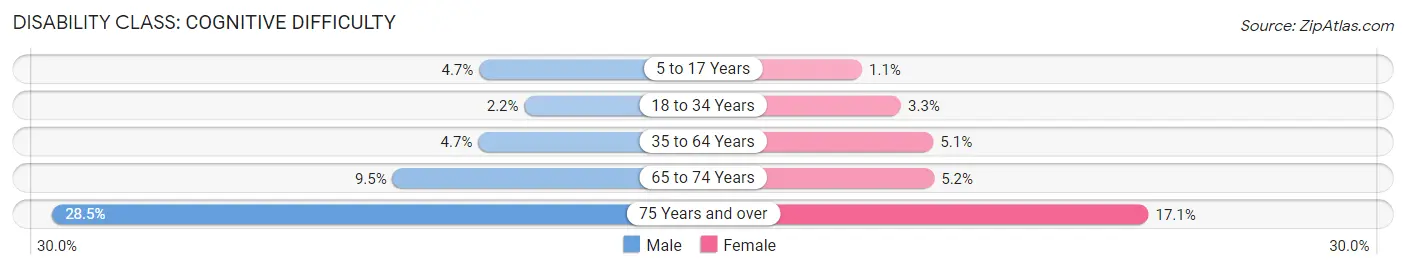
| Age Bracket | Male | Female |
| 5 to 17 Years | 196 (4.7%) | 42 (1.1%) |
| 18 to 34 Years | 89 (2.2%) | 144 (3.3%) |
| 35 to 64 Years | 360 (4.7%) | 380 (5.1%) |
| 65 to 74 Years | 196 (9.5%) | 106 (5.1%) |
| 75 Years and over | 321 (28.5%) | 301 (17.1%) |
Disability Class: Ambulatory Difficulty
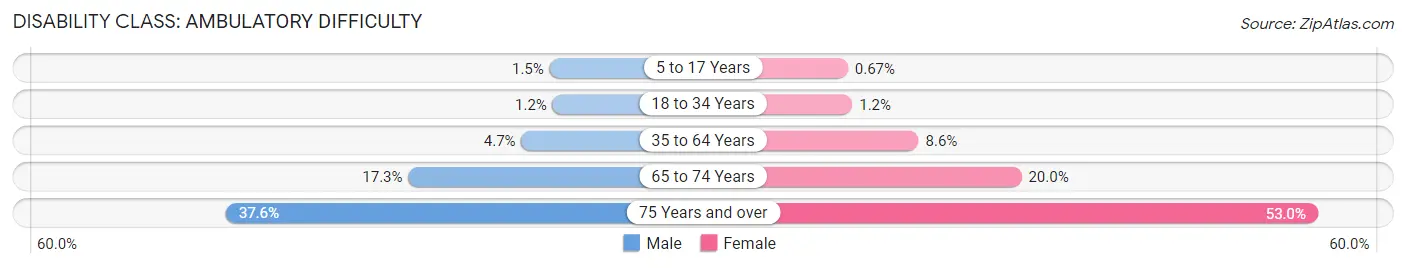
| Age Bracket | Male | Female |
| 5 to 17 Years | 64 (1.5%) | 25 (0.7%) |
| 18 to 34 Years | 49 (1.2%) | 51 (1.2%) |
| 35 to 64 Years | 354 (4.7%) | 637 (8.6%) |
| 65 to 74 Years | 356 (17.3%) | 412 (20.0%) |
| 75 Years and over | 424 (37.6%) | 934 (53.0%) |
Disability Class: Self-Care Difficulty
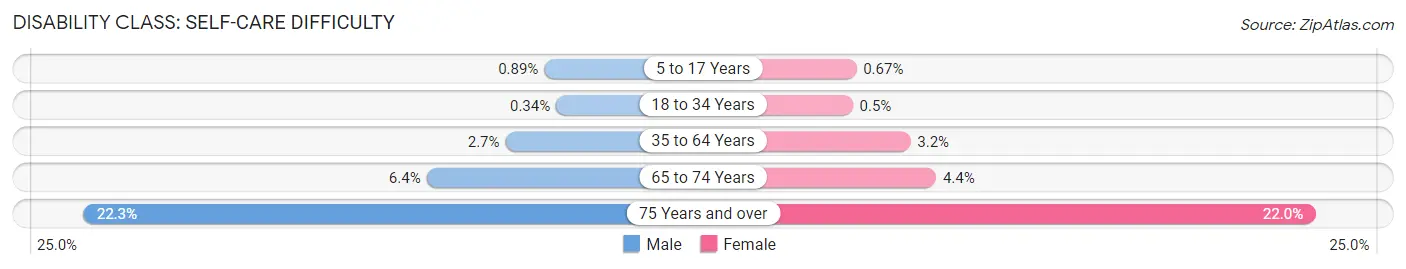
| Age Bracket | Male | Female |
| 5 to 17 Years | 37 (0.9%) | 25 (0.7%) |
| 18 to 34 Years | 14 (0.3%) | 22 (0.5%) |
| 35 to 64 Years | 204 (2.7%) | 237 (3.2%) |
| 65 to 74 Years | 131 (6.4%) | 90 (4.4%) |
| 75 Years and over | 251 (22.3%) | 387 (22.0%) |
Technology Access in Wharton County
Computing Device Access in Wharton County
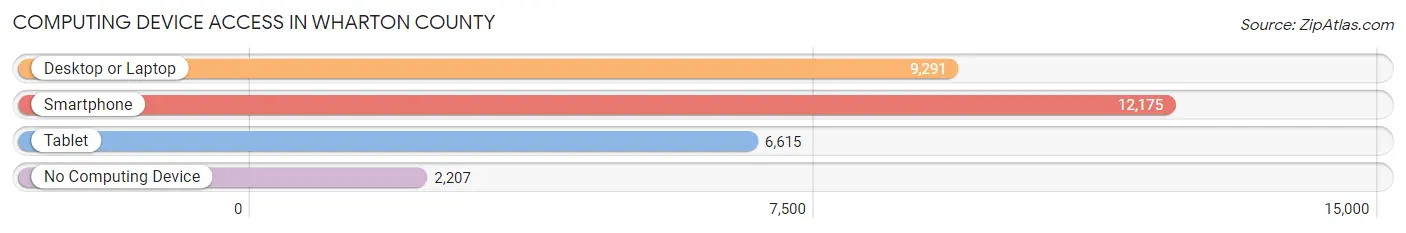
| Device Type | # Households | % Households |
| Desktop or Laptop | 9,291 | 61.3% |
| Smartphone | 12,175 | 80.4% |
| Tablet | 6,615 | 43.7% |
| No Computing Device | 2,207 | 14.6% |
| Total | 15,148 | 100.0% |
Internet Access in Wharton County
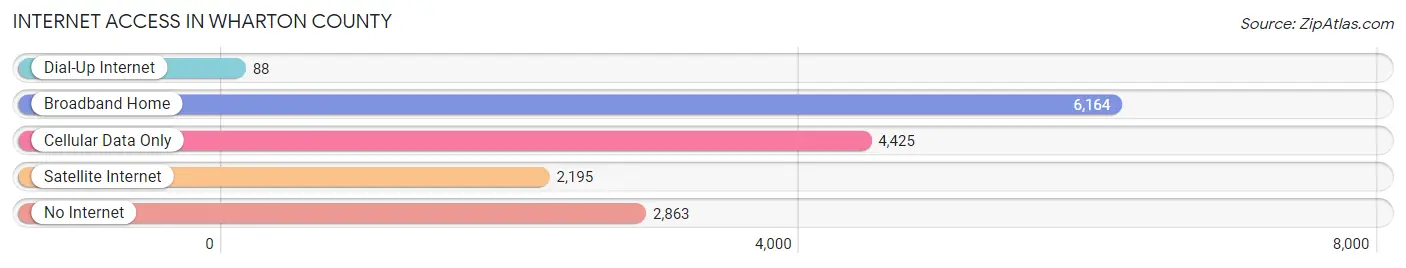
| Internet Type | # Households | % Households |
| Dial-Up Internet | 88 | 0.6% |
| Broadband Home | 6,164 | 40.7% |
| Cellular Data Only | 4,425 | 29.2% |
| Satellite Internet | 2,195 | 14.5% |
| No Internet | 2,863 | 18.9% |
| Total | 15,148 | 100.0% |
Wharton County Summary
Wharton County is located in the southeastern part of Texas, and is part of the Houston–The Woodlands–Sugar Land metropolitan area. The county is bordered by Colorado, Matagorda, Jackson, and Fort Bend counties. The county seat is Wharton, and the largest city is El Campo. As of the 2010 census, the population was 41,280.
History
Wharton County was established in 1846 and named for brothers William Harris Wharton and John Austin Wharton, who were both signers of the Texas Declaration of Independence. The county was originally part of Matagorda County, but was later divided into its own county.
The first settlers in the area were primarily of German and Czech descent. The county was home to several plantations, and the economy was largely based on cotton and sugar production.
During the Civil War, Wharton County was a major supplier of cotton to the Confederate Army. After the war, the county’s economy shifted to ranching and farming.
Geography
Wharton County covers an area of 1,093 square miles. The terrain is mostly flat, with some rolling hills in the western part of the county. The Colorado River forms the eastern border of the county.
The climate is humid subtropical, with hot summers and mild winters. The average annual precipitation is about 40 inches.
Economy
The economy of Wharton County is largely based on agriculture. The county is a major producer of cotton, corn, sorghum, and hay. Other crops grown in the county include soybeans, wheat, and rice.
The county is also home to several oil and gas fields and there are several refineries in the area
Demographics
As of the 2010 census, the population of Wharton County was 41,280. The racial makeup of the county was 68.3% White, 17.2% Hispanic or Latino, 11.3% African American, 0.7% Native American, 0.4% Asian, and 2.1% from other races.
The median household income was $41,945, and the median family income was $50,945. The per capita income was $20,845. About 17.2% of the population was below the poverty line.
Wharton County is served by the Wharton Independent School District. The county is also home to several higher education institutions, including Wharton County Junior College and the University of Houston-Victoria.
Common Questions
What is Per Capita Income in Wharton County?
Per Capita income in Wharton County is $29,061.
What is the Median Family Income in Wharton County?
Median Family Income in Wharton County is $71,647.
What is the Median Household income in Wharton County?
Median Household Income in Wharton County is $59,712.
What is Income or Wage Gap in Wharton County?
Income or Wage Gap in Wharton County is 35.3%.
Women in Wharton County earn 64.7 cents for every dollar earned by a man.
What is Family Income Deficit in Wharton County?
Family Income Deficit in Wharton County is $10,796.
Families that are below poverty line in Wharton County earn $10,796 less on average than the poverty threshold level.
What is Inequality or Gini Index in Wharton County?
Inequality or Gini Index in Wharton County is 0.45.
What is the Total Population of Wharton County?
Total Population of Wharton County is 41,614.
What is the Total Male Population of Wharton County?
Total Male Population of Wharton County is 20,761.
What is the Total Female Population of Wharton County?
Total Female Population of Wharton County is 20,853.
What is the Ratio of Males per 100 Females in Wharton County?
There are 99.56 Males per 100 Females in Wharton County.
What is the Ratio of Females per 100 Males in Wharton County?
There are 100.44 Females per 100 Males in Wharton County.
What is the Median Population Age in Wharton County?
Median Population Age in Wharton County is 37.7 Years.
What is the Average Family Size in Wharton County
Average Family Size in Wharton County is 3.4 People.
What is the Average Household Size in Wharton County
Average Household Size in Wharton County is 2.7 People.
How Large is the Labor Force in Wharton County?
There are 19,258 People in the Labor Forcein in Wharton County.
What is the Percentage of People in the Labor Force in Wharton County?
59.7% of People are in the Labor Force in Wharton County.
What is the Unemployment Rate in Wharton County?
Unemployment Rate in Wharton County is 5.7%.