Washington County, TX Map & Demographics
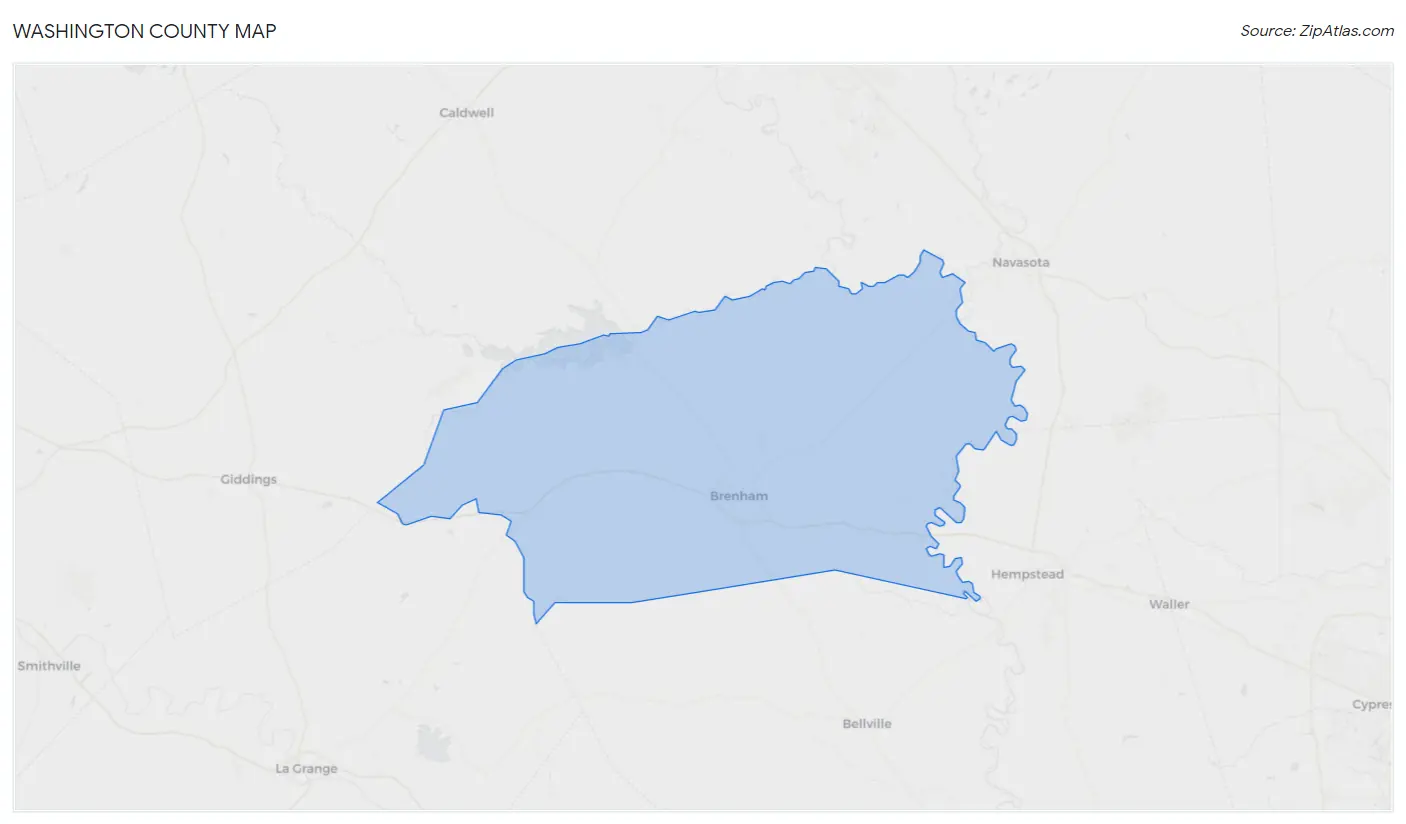
Washington County Map
Washington County Overview
$39,147
PER CAPITA INCOME
$86,183
AVG FAMILY INCOME
$70,043
AVG HOUSEHOLD INCOME
29.6%
WAGE / INCOME GAP [ % ]
70.4¢/ $1
WAGE / INCOME GAP [ $ ]
$9,380
FAMILY INCOME DEFICIT
0.49
INEQUALITY / GINI INDEX
35,807
TOTAL POPULATION
17,609
MALE POPULATION
18,198
FEMALE POPULATION
96.76
MALES / 100 FEMALES
103.34
FEMALES / 100 MALES
41.9
MEDIAN AGE
3.0
AVG FAMILY SIZE
2.3
AVG HOUSEHOLD SIZE
17,109
LABOR FORCE [ PEOPLE ]
58.5%
PERCENT IN LABOR FORCE
2.7%
UNEMPLOYMENT RATE
Income in Washington County
Income Overview in Washington County
Per Capita Income in Washington County is $39,147, while median incomes of families and households are $86,183 and $70,043 respectively.
| Characteristic | Number | Measure |
| Per Capita Income | 35,807 | $39,147 |
| Median Family Income | 9,131 | $86,183 |
| Mean Family Income | 9,131 | $120,327 |
| Median Household Income | 14,482 | $70,043 |
| Mean Household Income | 14,482 | $96,797 |
| Income Deficit | 9,131 | $9,380 |
| Wage / Income Gap (%) | 35,807 | 29.59% |
| Wage / Income Gap ($) | 35,807 | 70.41¢ per $1 |
| Gini / Inequality Index | 35,807 | 0.49 |
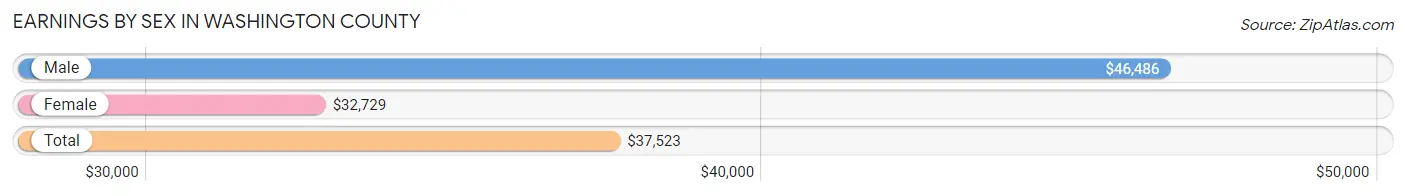
Earnings by Sex in Washington County
Average Earnings in Washington County are $37,523, $46,486 for men and $32,729 for women, a difference of 29.6%.
| Sex | Number | Average Earnings |
| Male | 9,452 (52.2%) | $46,486 |
| Female | 8,663 (47.8%) | $32,729 |
| Total | 18,115 (100.0%) | $37,523 |
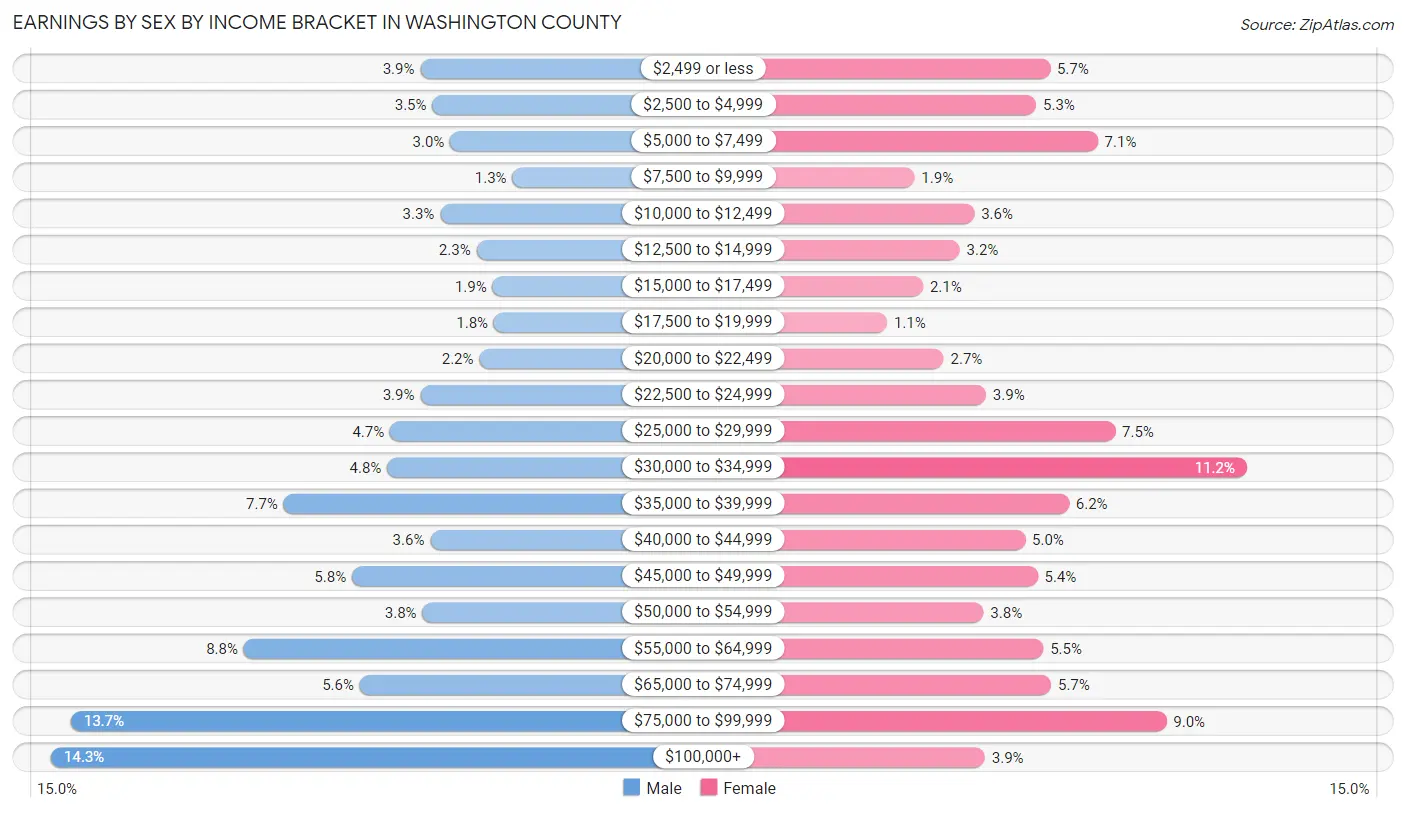
Earnings by Sex by Income Bracket in Washington County
The most common earnings brackets in Washington County are $100,000+ for men (1,348 | 14.3%) and $30,000 to $34,999 for women (974 | 11.2%).
| Income | Male | Female |
| $2,499 or less | 367 (3.9%) | 495 (5.7%) |
| $2,500 to $4,999 | 335 (3.5%) | 461 (5.3%) |
| $5,000 to $7,499 | 287 (3.0%) | 611 (7.0%) |
| $7,500 to $9,999 | 122 (1.3%) | 165 (1.9%) |
| $10,000 to $12,499 | 314 (3.3%) | 310 (3.6%) |
| $12,500 to $14,999 | 217 (2.3%) | 275 (3.2%) |
| $15,000 to $17,499 | 175 (1.8%) | 185 (2.1%) |
| $17,500 to $19,999 | 171 (1.8%) | 98 (1.1%) |
| $20,000 to $22,499 | 210 (2.2%) | 236 (2.7%) |
| $22,500 to $24,999 | 367 (3.9%) | 339 (3.9%) |
| $25,000 to $29,999 | 447 (4.7%) | 653 (7.5%) |
| $30,000 to $34,999 | 455 (4.8%) | 974 (11.2%) |
| $35,000 to $39,999 | 730 (7.7%) | 541 (6.2%) |
| $40,000 to $44,999 | 340 (3.6%) | 434 (5.0%) |
| $45,000 to $49,999 | 548 (5.8%) | 464 (5.4%) |
| $50,000 to $54,999 | 361 (3.8%) | 333 (3.8%) |
| $55,000 to $64,999 | 836 (8.8%) | 478 (5.5%) |
| $65,000 to $74,999 | 527 (5.6%) | 497 (5.7%) |
| $75,000 to $99,999 | 1,295 (13.7%) | 778 (9.0%) |
| $100,000+ | 1,348 (14.3%) | 336 (3.9%) |
| Total | 9,452 (100.0%) | 8,663 (100.0%) |
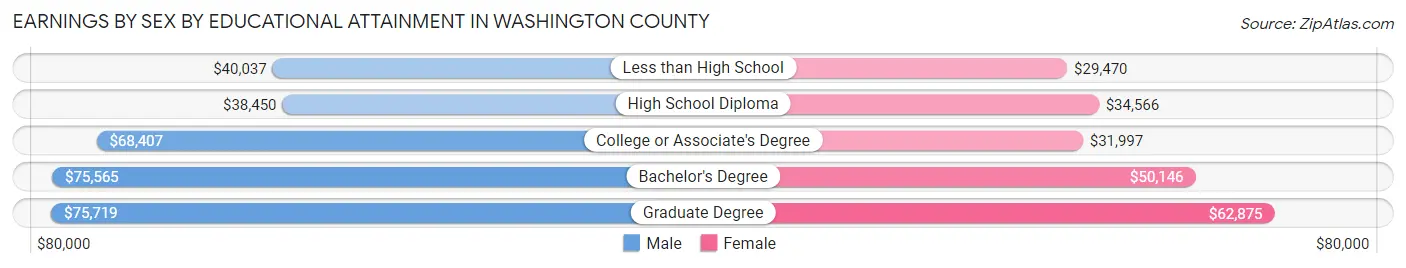
Earnings by Sex by Educational Attainment in Washington County
Average earnings in Washington County are $54,328 for men and $38,388 for women, a difference of 29.3%. Men with an educational attainment of graduate degree enjoy the highest average annual earnings of $75,719, while those with high school diploma education earn the least with $38,450. Women with an educational attainment of graduate degree earn the most with the average annual earnings of $62,875, while those with less than high school education have the smallest earnings of $29,470.
| Educational Attainment | Male Income | Female Income |
| Less than High School | $40,037 | $29,470 |
| High School Diploma | $38,450 | $34,566 |
| College or Associate's Degree | $68,407 | $31,997 |
| Bachelor's Degree | $75,565 | $50,146 |
| Graduate Degree | $75,719 | $62,875 |
| Total | $54,328 | $38,388 |
Family Income in Washington County
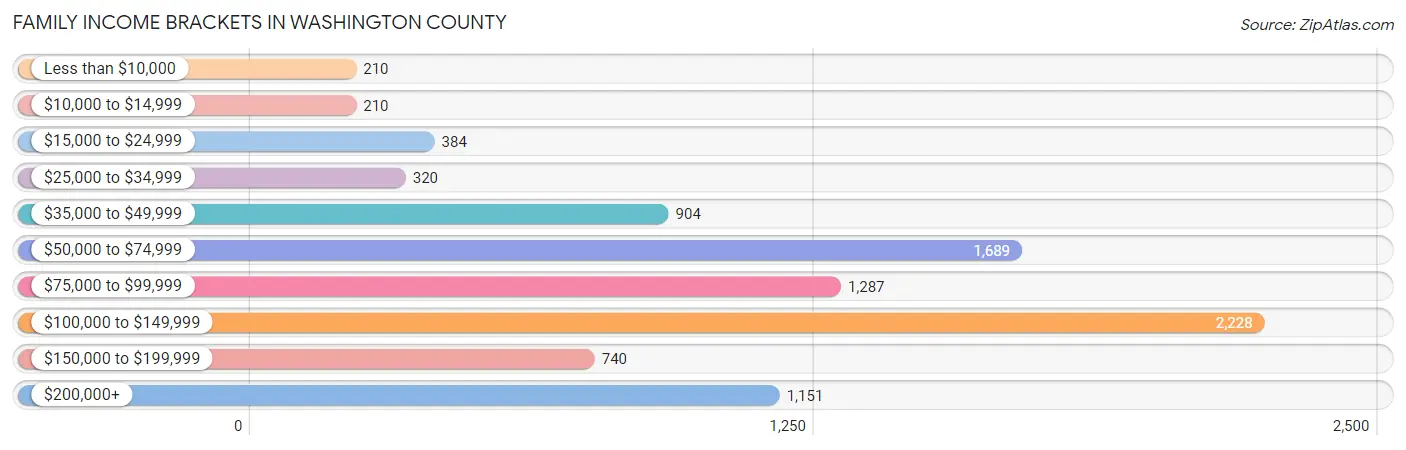
Family Income Brackets in Washington County
According to the Washington County family income data, there are 2,228 families falling into the $100,000 to $149,999 income range, which is the most common income bracket and makes up 24.4% of all families. Conversely, the less than $10,000 income bracket is the least frequent group with only 210 families (2.3%) belonging to this category.
| Income Bracket | # Families | % Families |
| Less than $10,000 | 210 | 2.3% |
| $10,000 to $14,999 | 210 | 2.3% |
| $15,000 to $24,999 | 384 | 4.2% |
| $25,000 to $34,999 | 320 | 3.5% |
| $35,000 to $49,999 | 904 | 9.9% |
| $50,000 to $74,999 | 1,689 | 18.5% |
| $75,000 to $99,999 | 1,287 | 14.1% |
| $100,000 to $149,999 | 2,228 | 24.4% |
| $150,000 to $199,999 | 740 | 8.1% |
| $200,000+ | 1,151 | 12.6% |
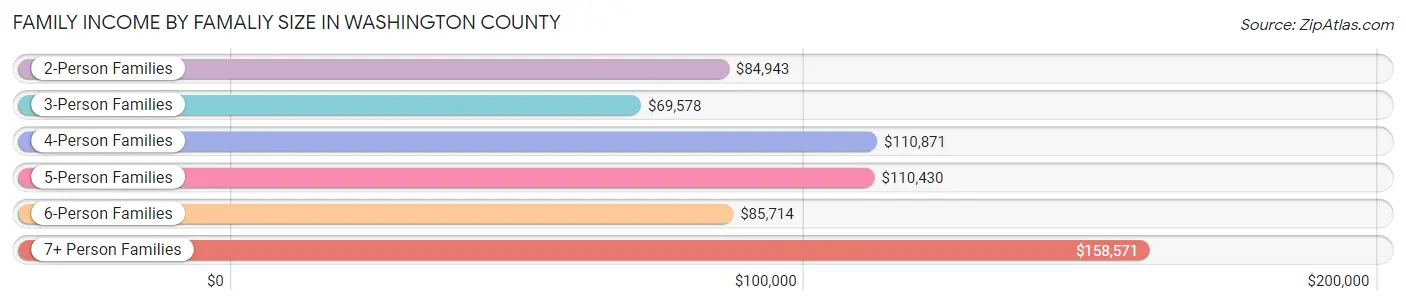
Family Income by Famaliy Size in Washington County
7+ person families (32 | 0.4%) account for the highest median family income in Washington County with $158,571 per family, while 2-person families (5,091 | 55.8%) have the highest median income of $42,472 per family member.
| Income Bracket | # Families | Median Income |
| 2-Person Families | 5,091 (55.8%) | $84,943 |
| 3-Person Families | 1,563 (17.1%) | $69,578 |
| 4-Person Families | 1,423 (15.6%) | $110,871 |
| 5-Person Families | 616 (6.8%) | $110,430 |
| 6-Person Families | 406 (4.4%) | $85,714 |
| 7+ Person Families | 32 (0.4%) | $158,571 |
| Total | 9,131 (100.0%) | $86,183 |
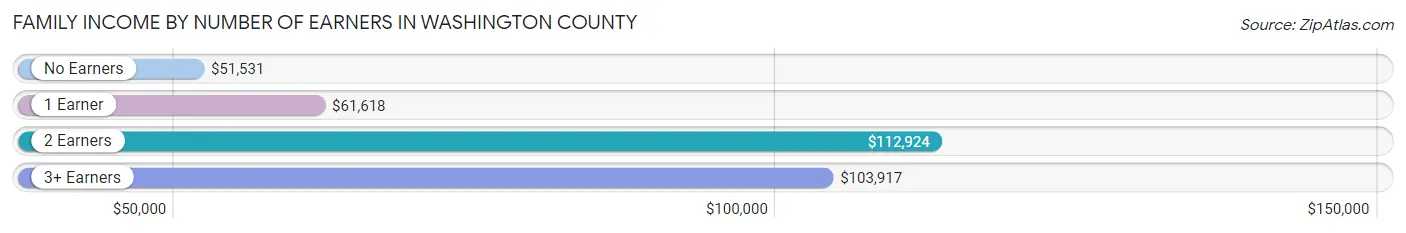
Family Income by Number of Earners in Washington County
The median family income in Washington County is $86,183, with families comprising 2 earners (3,874) having the highest median family income of $112,924, while families with no earners (1,750) have the lowest median family income of $51,531, accounting for 42.4% and 19.2% of families, respectively.
| Number of Earners | # Families | Median Income |
| No Earners | 1,750 (19.2%) | $51,531 |
| 1 Earner | 2,542 (27.8%) | $61,618 |
| 2 Earners | 3,874 (42.4%) | $112,924 |
| 3+ Earners | 965 (10.6%) | $103,917 |
| Total | 9,131 (100.0%) | $86,183 |
Household Income in Washington County
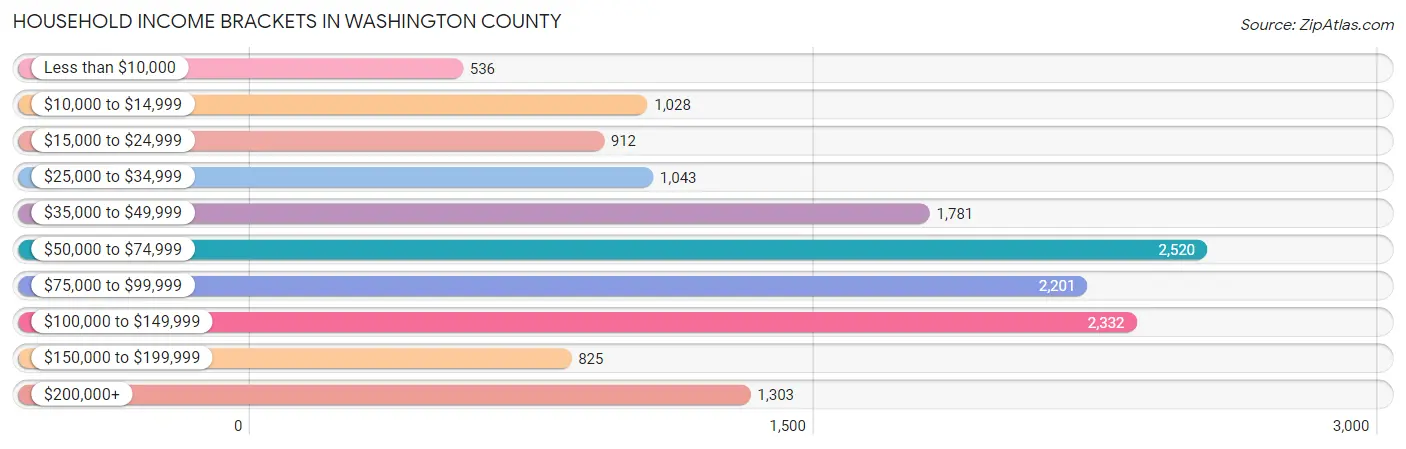
Household Income Brackets in Washington County
With 2,520 households falling in the category, the $50,000 to $74,999 income range is the most frequent in Washington County, accounting for 17.4% of all households. In contrast, only 536 households (3.7%) fall into the less than $10,000 income bracket, making it the least populous group.
| Income Bracket | # Households | % Households |
| Less than $10,000 | 536 | 3.7% |
| $10,000 to $14,999 | 1,028 | 7.1% |
| $15,000 to $24,999 | 912 | 6.3% |
| $25,000 to $34,999 | 1,043 | 7.2% |
| $35,000 to $49,999 | 1,781 | 12.3% |
| $50,000 to $74,999 | 2,520 | 17.4% |
| $75,000 to $99,999 | 2,201 | 15.2% |
| $100,000 to $149,999 | 2,332 | 16.1% |
| $150,000 to $199,999 | 825 | 5.7% |
| $200,000+ | 1,303 | 9.0% |
Household Income by Householder Age in Washington County
The median household income in Washington County is $70,043, with the highest median household income of $80,600 found in the 25 to 44 years age bracket for the primary householder. A total of 3,589 households (24.8%) fall into this category. Meanwhile, the 15 to 24 years age bracket for the primary householder has the lowest median household income of $0, with 751 households (5.2%) in this group.
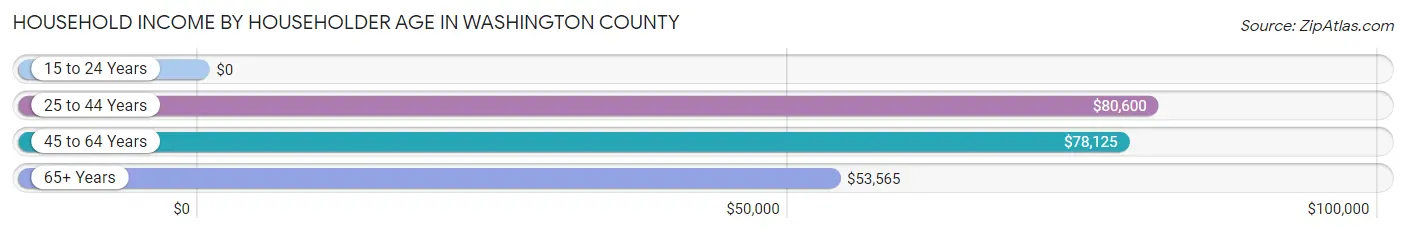
| Income Bracket | # Households | Median Income |
| 15 to 24 Years | 751 (5.2%) | $0 |
| 25 to 44 Years | 3,589 (24.8%) | $80,600 |
| 45 to 64 Years | 5,053 (34.9%) | $78,125 |
| 65+ Years | 5,089 (35.1%) | $53,565 |
| Total | 14,482 (100.0%) | $70,043 |
Poverty in Washington County
Income Below Poverty by Sex and Age in Washington County
With 12.0% poverty level for males and 11.8% for females among the residents of Washington County, under 5 year old males and 18 to 24 year old females are the most vulnerable to poverty, with 252 males (25.4%) and 487 females (41.7%) in their respective age groups living below the poverty level.
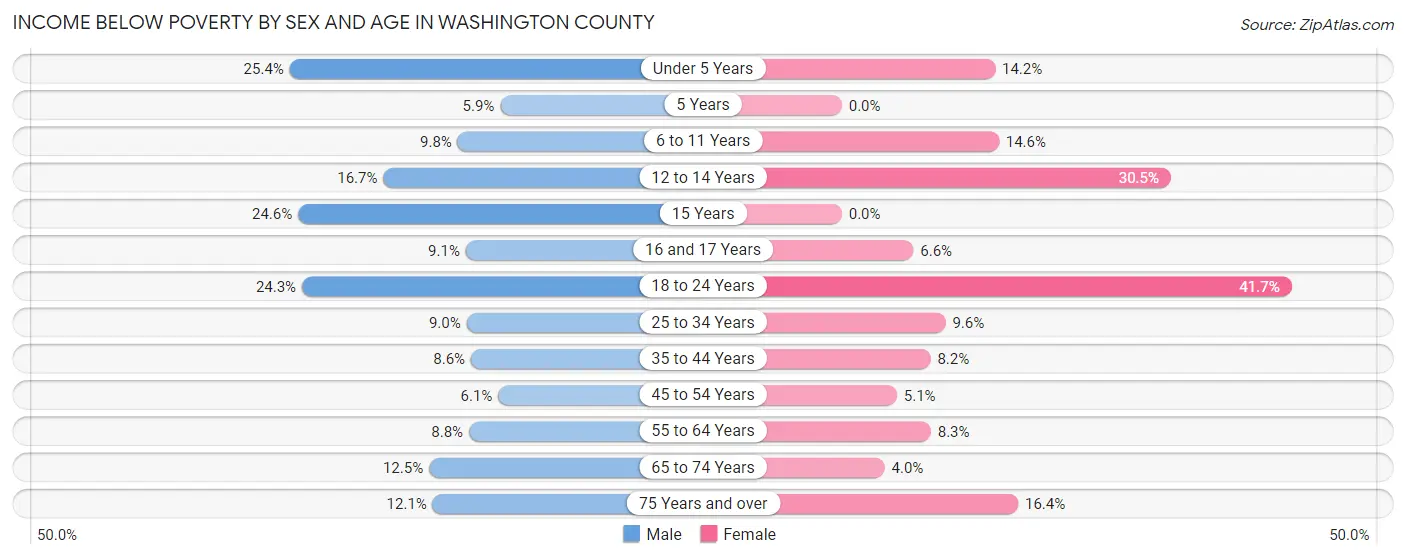
| Age Bracket | Male | Female |
| Under 5 Years | 252 (25.4%) | 127 (14.2%) |
| 5 Years | 14 (5.9%) | 0 (0.0%) |
| 6 to 11 Years | 117 (9.8%) | 212 (14.6%) |
| 12 to 14 Years | 140 (16.7%) | 116 (30.5%) |
| 15 Years | 32 (24.6%) | 0 (0.0%) |
| 16 and 17 Years | 50 (9.1%) | 32 (6.6%) |
| 18 to 24 Years | 320 (24.3%) | 487 (41.7%) |
| 25 to 34 Years | 148 (9.0%) | 186 (9.6%) |
| 35 to 44 Years | 150 (8.6%) | 138 (8.2%) |
| 45 to 54 Years | 122 (6.0%) | 102 (5.1%) |
| 55 to 64 Years | 210 (8.8%) | 213 (8.3%) |
| 65 to 74 Years | 249 (12.5%) | 87 (4.0%) |
| 75 Years and over | 169 (12.1%) | 315 (16.4%) |
| Total | 1,973 (12.0%) | 2,015 (11.8%) |
Income Above Poverty by Sex and Age in Washington County
According to the poverty statistics in Washington County, males aged 5 years and females aged 5 years are the age groups that are most secure financially, with 94.1% of males and 100.0% of females in these age groups living above the poverty line.
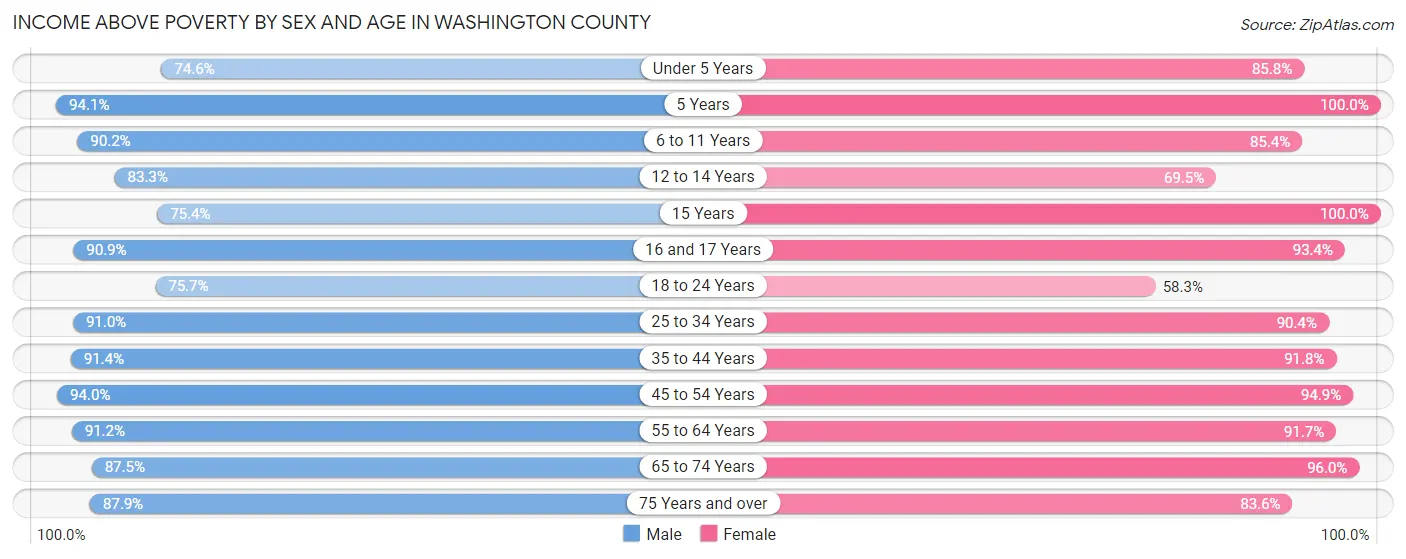
| Age Bracket | Male | Female |
| Under 5 Years | 740 (74.6%) | 766 (85.8%) |
| 5 Years | 225 (94.1%) | 263 (100.0%) |
| 6 to 11 Years | 1,076 (90.2%) | 1,243 (85.4%) |
| 12 to 14 Years | 698 (83.3%) | 264 (69.5%) |
| 15 Years | 98 (75.4%) | 134 (100.0%) |
| 16 and 17 Years | 502 (90.9%) | 450 (93.4%) |
| 18 to 24 Years | 999 (75.7%) | 680 (58.3%) |
| 25 to 34 Years | 1,501 (91.0%) | 1,748 (90.4%) |
| 35 to 44 Years | 1,599 (91.4%) | 1,539 (91.8%) |
| 45 to 54 Years | 1,896 (94.0%) | 1,895 (94.9%) |
| 55 to 64 Years | 2,188 (91.2%) | 2,366 (91.7%) |
| 65 to 74 Years | 1,747 (87.5%) | 2,102 (96.0%) |
| 75 Years and over | 1,224 (87.9%) | 1,610 (83.6%) |
| Total | 14,493 (88.0%) | 15,060 (88.2%) |
Income Below Poverty Among Married-Couple Families in Washington County
The poverty statistics for married-couple families in Washington County show that 4.4% or 316 of the total 7,142 families live below the poverty line. Families with 1 or 2 children have the highest poverty rate of 4.8%, comprising of 102 families. On the other hand, families with 3 or 4 children have the lowest poverty rate of 0.0%, which includes 0 families.
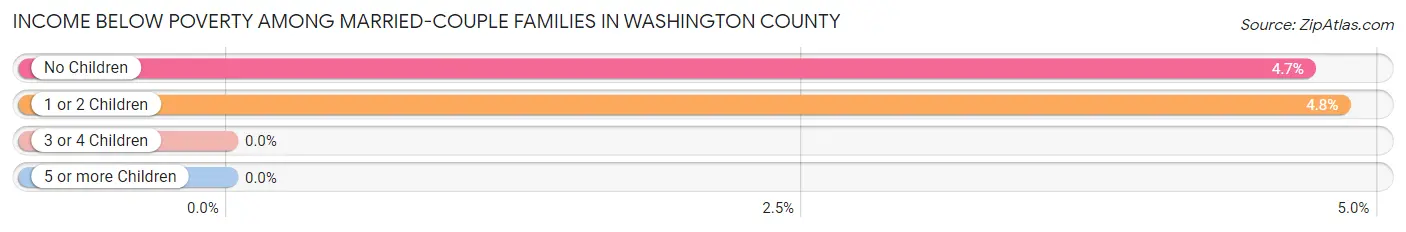
| Children | Above Poverty | Below Poverty |
| No Children | 4,348 (95.3%) | 214 (4.7%) |
| 1 or 2 Children | 2,004 (95.2%) | 102 (4.8%) |
| 3 or 4 Children | 452 (100.0%) | 0 (0.0%) |
| 5 or more Children | 22 (100.0%) | 0 (0.0%) |
| Total | 6,826 (95.6%) | 316 (4.4%) |
Income Below Poverty Among Single-Parent Households in Washington County
According to the poverty data in Washington County, 10.4% or 77 single-father households and 25.8% or 321 single-mother households are living below the poverty line. Among single-father households, those with 1 or 2 children have the highest poverty rate, with 46 households (27.7%) experiencing poverty. Likewise, among single-mother households, those with 3 or 4 children have the highest poverty rate, with 96 households (100.0%) falling below the poverty line.
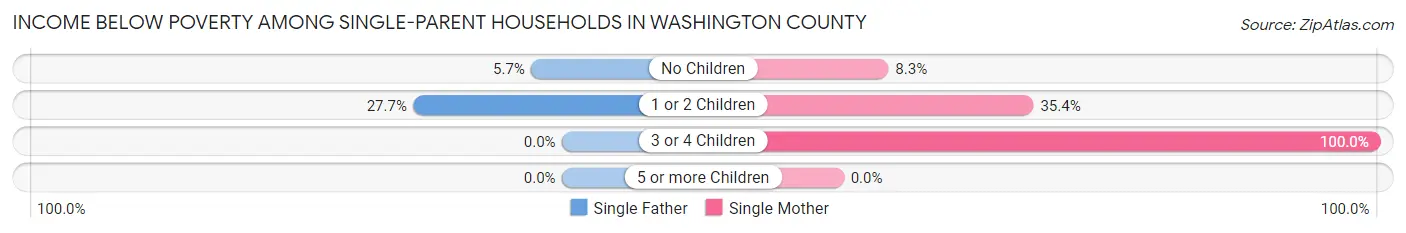
| Children | Single Father | Single Mother |
| No Children | 31 (5.7%) | 56 (8.3%) |
| 1 or 2 Children | 46 (27.7%) | 169 (35.4%) |
| 3 or 4 Children | 0 (0.0%) | 96 (100.0%) |
| 5 or more Children | 0 (0.0%) | 0 (0.0%) |
| Total | 77 (10.4%) | 321 (25.8%) |
Income Below Poverty Among Married-Couple vs Single-Parent Households in Washington County
The poverty data for Washington County shows that 316 of the married-couple family households (4.4%) and 398 of the single-parent households (20.0%) are living below the poverty level. Within the married-couple family households, those with 1 or 2 children have the highest poverty rate, with 102 households (4.8%) falling below the poverty line. Among the single-parent households, those with 3 or 4 children have the highest poverty rate, with 96 household (86.5%) living below poverty.
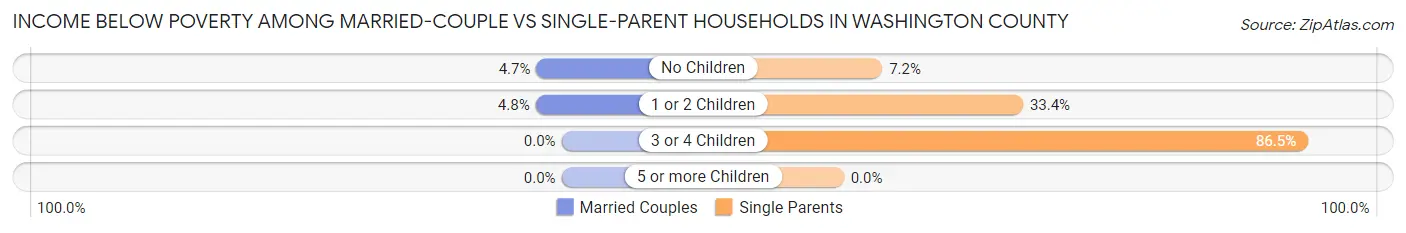
| Children | Married-Couple Families | Single-Parent Households |
| No Children | 214 (4.7%) | 87 (7.2%) |
| 1 or 2 Children | 102 (4.8%) | 215 (33.4%) |
| 3 or 4 Children | 0 (0.0%) | 96 (86.5%) |
| 5 or more Children | 0 (0.0%) | 0 (0.0%) |
| Total | 316 (4.4%) | 398 (20.0%) |
Race in Washington County
The most populous races in Washington County are White / Caucasian (25,706 | 71.8%), Black / African American (6,458 | 18.0%), and Hispanic or Latino (6,211 | 17.3%).
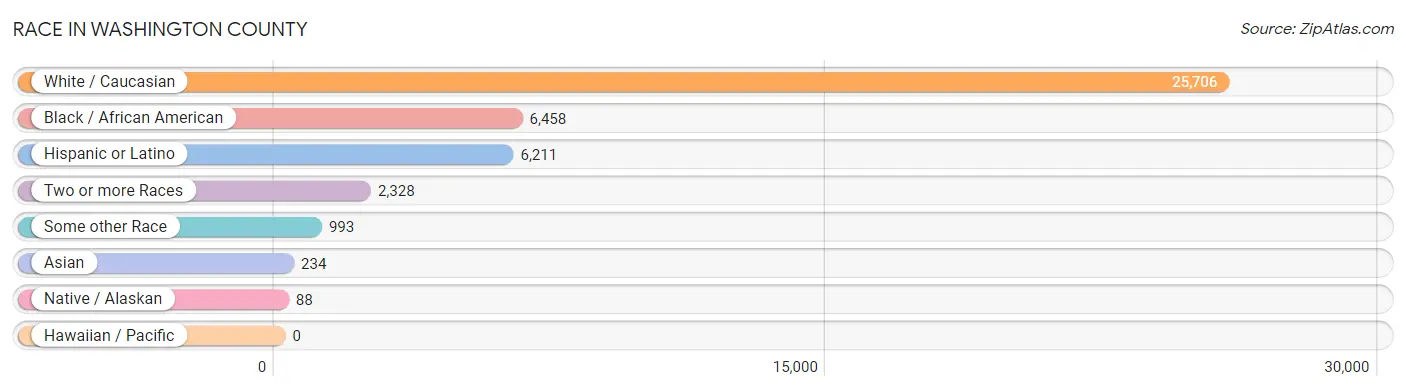
| Race | # Population | % Population |
| Asian | 234 | 0.6% |
| Black / African American | 6,458 | 18.0% |
| Hawaiian / Pacific | 0 | 0.0% |
| Hispanic or Latino | 6,211 | 17.3% |
| Native / Alaskan | 88 | 0.3% |
| White / Caucasian | 25,706 | 71.8% |
| Two or more Races | 2,328 | 6.5% |
| Some other Race | 993 | 2.8% |
| Total | 35,807 | 100.0% |
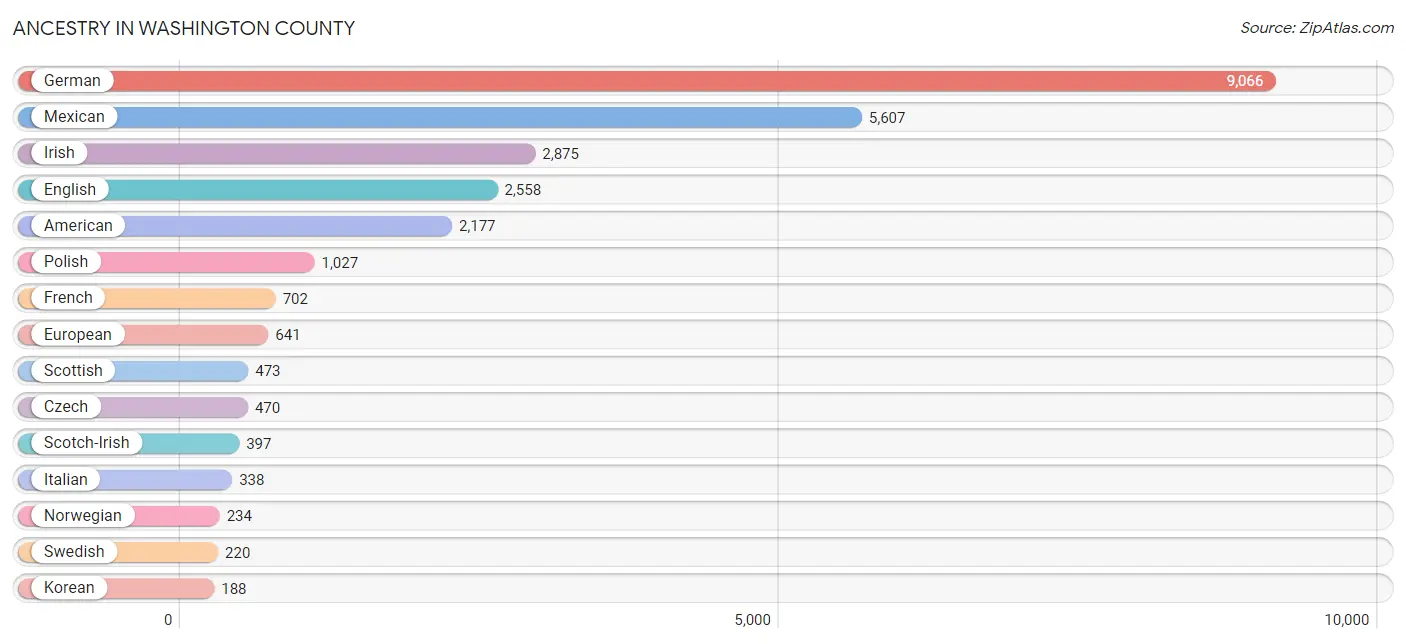
Ancestry in Washington County
The most populous ancestries reported in Washington County are German (9,066 | 25.3%), Mexican (5,607 | 15.7%), Irish (2,875 | 8.0%), English (2,558 | 7.1%), and American (2,177 | 6.1%), together accounting for 62.2% of all Washington County residents.
| Ancestry | # Population | % Population |
| African | 16 | 0.0% |
| American | 2,177 | 6.1% |
| Arab | 47 | 0.1% |
| Argentinean | 58 | 0.2% |
| Armenian | 22 | 0.1% |
| Austrian | 116 | 0.3% |
| Belgian | 14 | 0.0% |
| Belizean | 51 | 0.1% |
| Blackfeet | 23 | 0.1% |
| British | 160 | 0.4% |
| Bulgarian | 30 | 0.1% |
| Burmese | 60 | 0.2% |
| Cajun | 20 | 0.1% |
| Canadian | 29 | 0.1% |
| Central American | 73 | 0.2% |
| Cherokee | 31 | 0.1% |
| Chippewa | 3 | 0.0% |
| Choctaw | 5 | 0.0% |
| Colombian | 33 | 0.1% |
| Cuban | 103 | 0.3% |
| Czech | 470 | 1.3% |
| Czechoslovakian | 27 | 0.1% |
| Danish | 34 | 0.1% |
| Dutch | 158 | 0.4% |
| Egyptian | 16 | 0.0% |
| English | 2,558 | 7.1% |
| European | 641 | 1.8% |
| Filipino | 6 | 0.0% |
| Finnish | 9 | 0.0% |
| French | 702 | 2.0% |
| French Canadian | 95 | 0.3% |
| German | 9,066 | 25.3% |
| Greek | 24 | 0.1% |
| Guatemalan | 25 | 0.1% |
| Hungarian | 122 | 0.3% |
| Indian (Asian) | 29 | 0.1% |
| Irish | 2,875 | 8.0% |
| Italian | 338 | 0.9% |
| Korean | 188 | 0.5% |
| Lebanese | 31 | 0.1% |
| Lithuanian | 4 | 0.0% |
| Mexican | 5,607 | 15.7% |
| Mexican American Indian | 138 | 0.4% |
| Nigerian | 2 | 0.0% |
| Northern European | 18 | 0.1% |
| Norwegian | 234 | 0.6% |
| Polish | 1,027 | 2.9% |
| Portuguese | 27 | 0.1% |
| Potawatomi | 15 | 0.0% |
| Puerto Rican | 89 | 0.3% |
| Russian | 31 | 0.1% |
| Salvadoran | 48 | 0.1% |
| Scandinavian | 7 | 0.0% |
| Scotch-Irish | 397 | 1.1% |
| Scottish | 473 | 1.3% |
| Slovene | 7 | 0.0% |
| South American | 91 | 0.3% |
| Spaniard | 37 | 0.1% |
| Spanish | 81 | 0.2% |
| Subsaharan African | 18 | 0.1% |
| Swedish | 220 | 0.6% |
| Swiss | 113 | 0.3% |
| Thai | 76 | 0.2% |
| Turkish | 28 | 0.1% |
| Ukrainian | 27 | 0.1% |
| Welsh | 31 | 0.1% | View All 66 Rows |
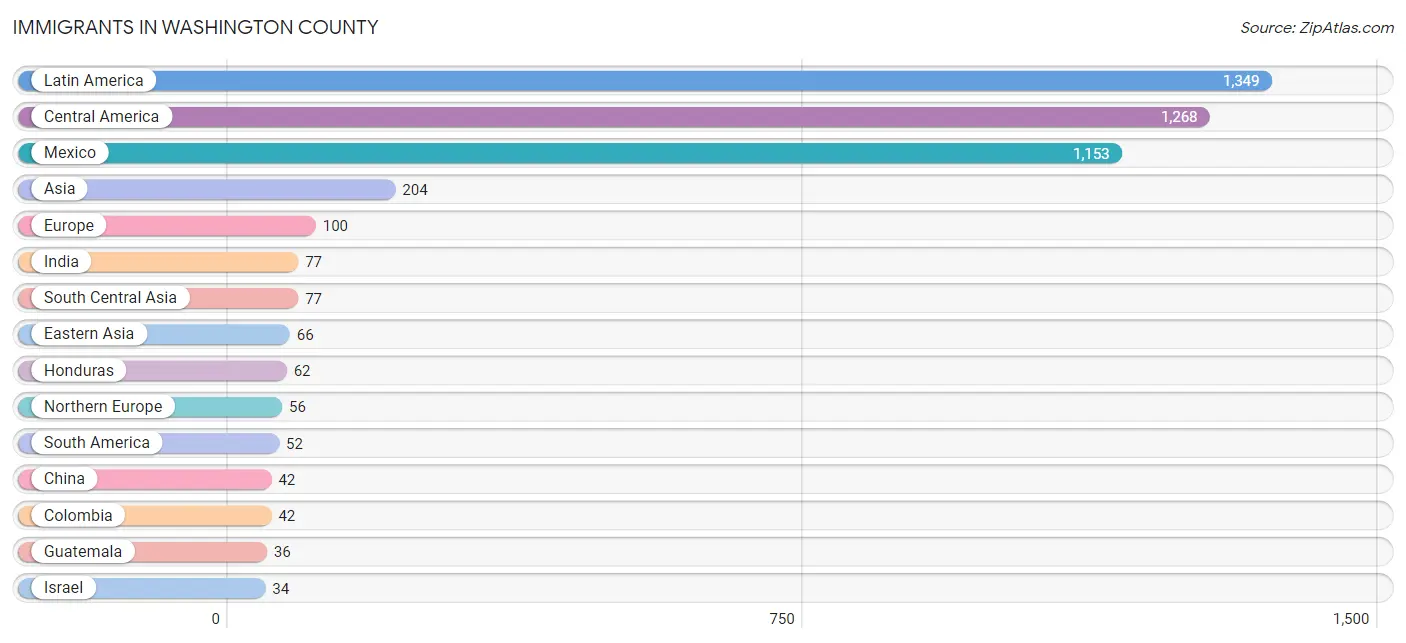
Immigrants in Washington County
The most numerous immigrant groups reported in Washington County came from Latin America (1,349 | 3.8%), Central America (1,268 | 3.5%), Mexico (1,153 | 3.2%), Asia (204 | 0.6%), and Europe (100 | 0.3%), together accounting for 11.4% of all Washington County residents.
| Immigration Origin | # Population | % Population |
| Africa | 1 | 0.0% |
| Asia | 204 | 0.6% |
| Belgium | 14 | 0.0% |
| Brazil | 10 | 0.0% |
| Bulgaria | 30 | 0.1% |
| Canada | 30 | 0.1% |
| Caribbean | 29 | 0.1% |
| Central America | 1,268 | 3.5% |
| China | 42 | 0.1% |
| Colombia | 42 | 0.1% |
| Cuba | 29 | 0.1% |
| Eastern Asia | 66 | 0.2% |
| Eastern Europe | 30 | 0.1% |
| Egypt | 1 | 0.0% |
| El Salvador | 17 | 0.1% |
| England | 18 | 0.1% |
| Europe | 100 | 0.3% |
| Guatemala | 36 | 0.1% |
| Honduras | 62 | 0.2% |
| India | 77 | 0.2% |
| Israel | 34 | 0.1% |
| Korea | 24 | 0.1% |
| Latin America | 1,349 | 3.8% |
| Mexico | 1,153 | 3.2% |
| Northern Africa | 1 | 0.0% |
| Northern Europe | 56 | 0.2% |
| Norway | 22 | 0.1% |
| Philippines | 27 | 0.1% |
| South America | 52 | 0.2% |
| South Central Asia | 77 | 0.2% |
| South Eastern Asia | 27 | 0.1% |
| Taiwan | 18 | 0.1% |
| Western Asia | 34 | 0.1% |
| Western Europe | 14 | 0.0% | View All 34 Rows |
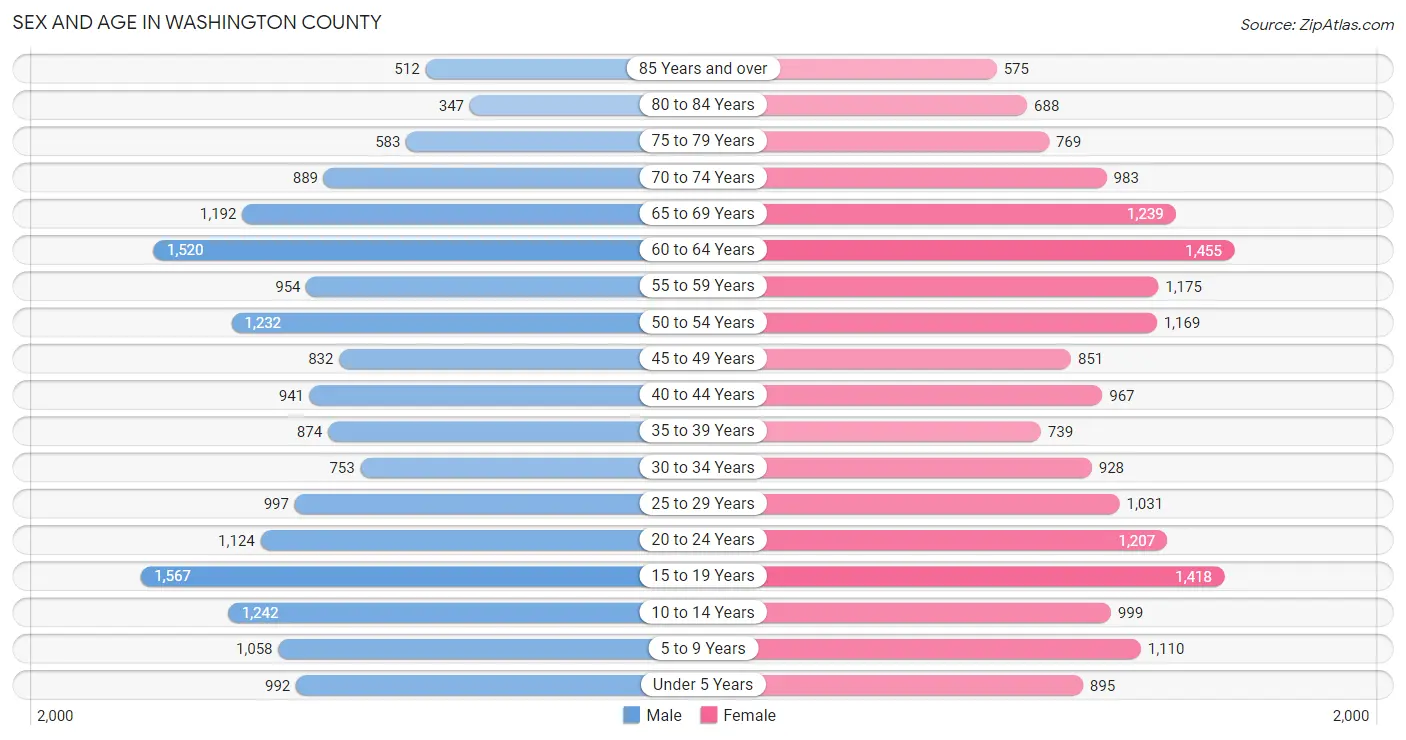
Sex and Age in Washington County
Sex and Age in Washington County
The most populous age groups in Washington County are 15 to 19 Years (1,567 | 8.9%) for men and 60 to 64 Years (1,455 | 8.0%) for women.
| Age Bracket | Male | Female |
| Under 5 Years | 992 (5.6%) | 895 (4.9%) |
| 5 to 9 Years | 1,058 (6.0%) | 1,110 (6.1%) |
| 10 to 14 Years | 1,242 (7.0%) | 999 (5.5%) |
| 15 to 19 Years | 1,567 (8.9%) | 1,418 (7.8%) |
| 20 to 24 Years | 1,124 (6.4%) | 1,207 (6.6%) |
| 25 to 29 Years | 997 (5.7%) | 1,031 (5.7%) |
| 30 to 34 Years | 753 (4.3%) | 928 (5.1%) |
| 35 to 39 Years | 874 (5.0%) | 739 (4.1%) |
| 40 to 44 Years | 941 (5.3%) | 967 (5.3%) |
| 45 to 49 Years | 832 (4.7%) | 851 (4.7%) |
| 50 to 54 Years | 1,232 (7.0%) | 1,169 (6.4%) |
| 55 to 59 Years | 954 (5.4%) | 1,175 (6.5%) |
| 60 to 64 Years | 1,520 (8.6%) | 1,455 (8.0%) |
| 65 to 69 Years | 1,192 (6.8%) | 1,239 (6.8%) |
| 70 to 74 Years | 889 (5.1%) | 983 (5.4%) |
| 75 to 79 Years | 583 (3.3%) | 769 (4.2%) |
| 80 to 84 Years | 347 (2.0%) | 688 (3.8%) |
| 85 Years and over | 512 (2.9%) | 575 (3.2%) |
| Total | 17,609 (100.0%) | 18,198 (100.0%) |
Families and Households in Washington County
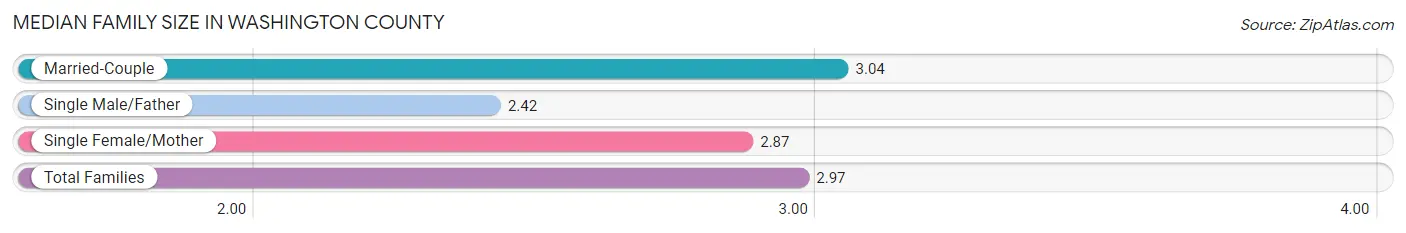
Median Family Size in Washington County
The median family size in Washington County is 2.97 persons per family, with married-couple families (7,142 | 78.2%) accounting for the largest median family size of 3.04 persons per family. On the other hand, single male/father families (743 | 8.1%) represent the smallest median family size with 2.42 persons per family.
| Family Type | # Families | Family Size |
| Married-Couple | 7,142 (78.2%) | 3.04 |
| Single Male/Father | 743 (8.1%) | 2.42 |
| Single Female/Mother | 1,246 (13.7%) | 2.87 |
| Total Families | 9,131 (100.0%) | 2.97 |
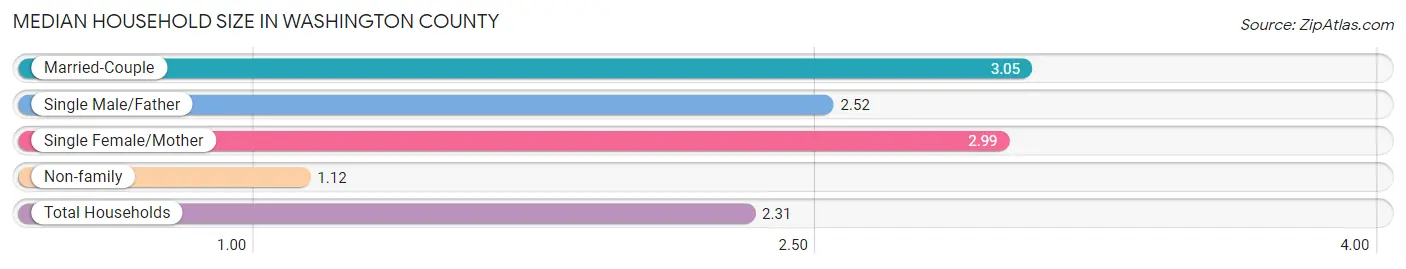
Median Household Size in Washington County
The median household size in Washington County is 2.31 persons per household, with married-couple households (7,142 | 49.3%) accounting for the largest median household size of 3.05 persons per household. non-family households (5,351 | 36.9%) represent the smallest median household size with 1.12 persons per household.
| Household Type | # Households | Household Size |
| Married-Couple | 7,142 (49.3%) | 3.05 |
| Single Male/Father | 743 (5.1%) | 2.52 |
| Single Female/Mother | 1,246 (8.6%) | 2.99 |
| Non-family | 5,351 (36.9%) | 1.12 |
| Total Households | 14,482 (100.0%) | 2.31 |
Household Size by Marriage Status in Washington County
Out of a total of 14,482 households in Washington County, 9,131 (63.0%) are family households, while 5,351 (36.9%) are nonfamily households. The most numerous type of family households are 2-person households, comprising 5,056, and the most common type of nonfamily households are 1-person households, comprising 4,495.
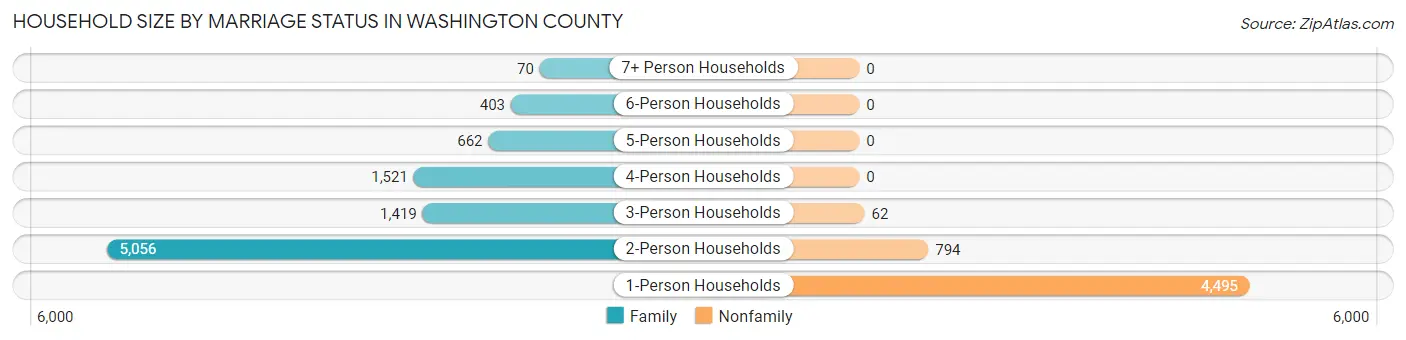
| Household Size | Family Households | Nonfamily Households |
| 1-Person Households | - | 4,495 (31.0%) |
| 2-Person Households | 5,056 (34.9%) | 794 (5.5%) |
| 3-Person Households | 1,419 (9.8%) | 62 (0.4%) |
| 4-Person Households | 1,521 (10.5%) | 0 (0.0%) |
| 5-Person Households | 662 (4.6%) | 0 (0.0%) |
| 6-Person Households | 403 (2.8%) | 0 (0.0%) |
| 7+ Person Households | 70 (0.5%) | 0 (0.0%) |
| Total | 9,131 (63.0%) | 5,351 (36.9%) |
Female Fertility in Washington County
Fertility by Age in Washington County
Average fertility rate in Washington County is 53.0 births per 1,000 women. Women in the age bracket of 20 to 34 years have the highest fertility rate with 98.0 births per 1,000 women. Women in the age bracket of 20 to 34 years acount for 79.7% of all women with births.
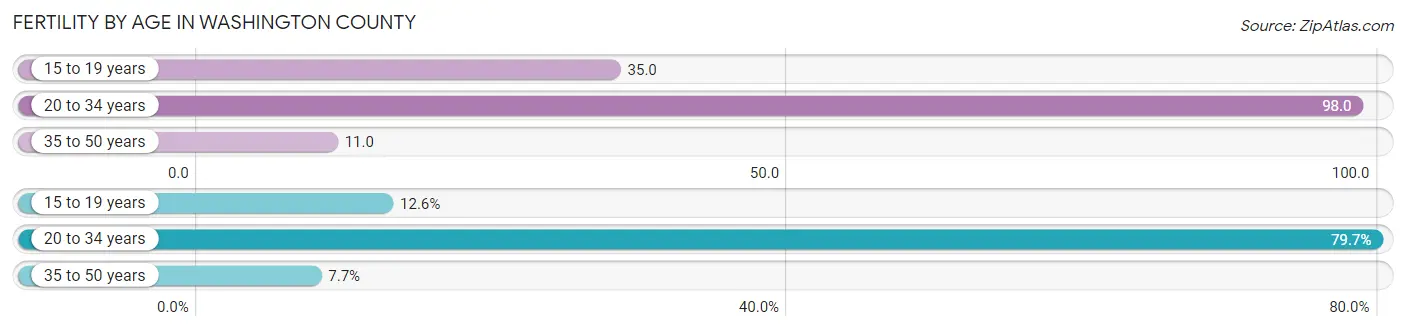
| Age Bracket | Women with Births | Births / 1,000 Women |
| 15 to 19 years | 49 (12.6%) | 35.0 |
| 20 to 34 years | 311 (79.7%) | 98.0 |
| 35 to 50 years | 30 (7.7%) | 11.0 |
| Total | 390 (100.0%) | 53.0 |
Fertility by Age by Marriage Status in Washington County
60.8% of women with births (390) in Washington County are married. The highest percentage of unmarried women with births falls into 15 to 19 years age bracket with 100.0% of them unmarried at the time of birth, while the lowest percentage of unmarried women with births belong to 35 to 50 years age bracket with 0.0% of them unmarried.
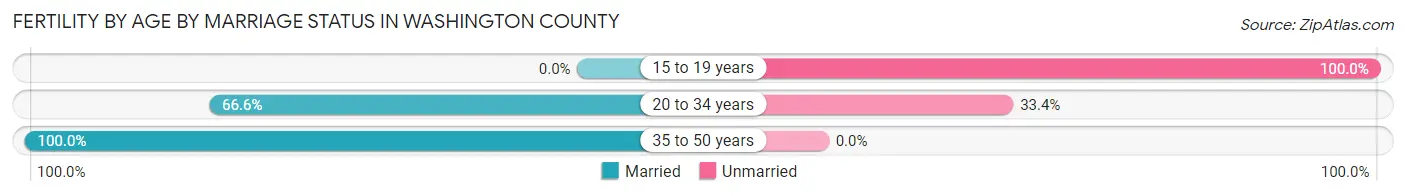
| Age Bracket | Married | Unmarried |
| 15 to 19 years | 0 (0.0%) | 49 (100.0%) |
| 20 to 34 years | 207 (66.6%) | 104 (33.4%) |
| 35 to 50 years | 30 (100.0%) | 0 (0.0%) |
| Total | 237 (60.8%) | 153 (39.2%) |
Fertility by Education in Washington County
Average fertility rate in Washington County is 53.0 births per 1,000 women. Women with the education attainment of bachelor's degree have the highest fertility rate of 100.0 births per 1,000 women, while women with the education attainment of less than high school have the lowest fertility at 41.0 births per 1,000 women. Women with the education attainment of bachelor's degree represent 31.0% of all women with births.
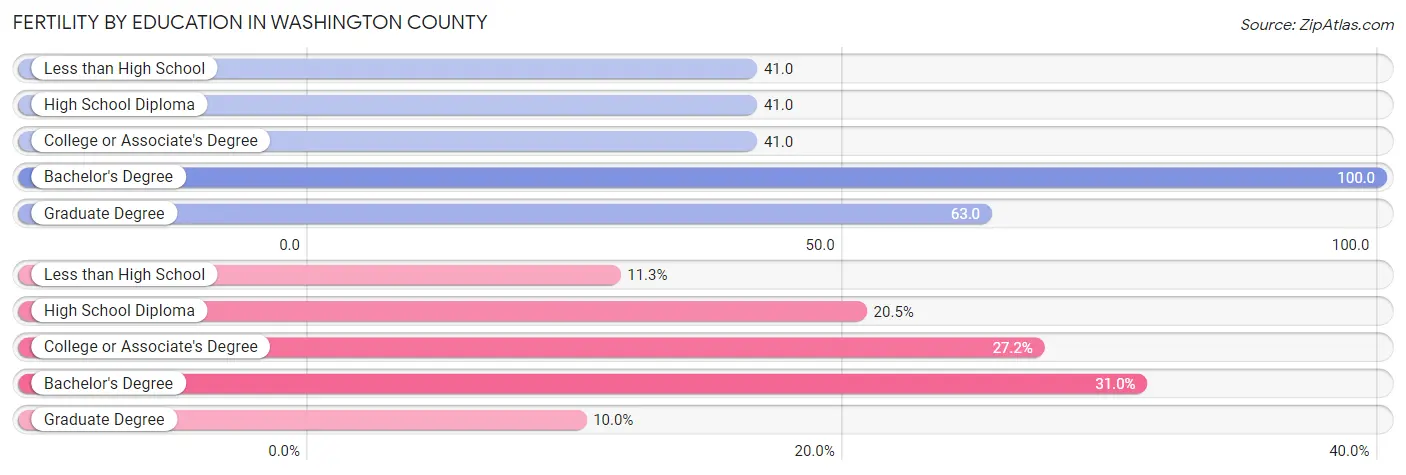
| Educational Attainment | Women with Births | Births / 1,000 Women |
| Less than High School | 44 (11.3%) | 41.0 |
| High School Diploma | 80 (20.5%) | 41.0 |
| College or Associate's Degree | 106 (27.2%) | 41.0 |
| Bachelor's Degree | 121 (31.0%) | 100.0 |
| Graduate Degree | 39 (10.0%) | 63.0 |
| Total | 390 (100.0%) | 53.0 |
Fertility by Education by Marriage Status in Washington County
39.2% of women with births in Washington County are unmarried. Women with the educational attainment of less than high school are most likely to be married with 100.0% of them married at childbirth, while women with the educational attainment of college or associate's degree are least likely to be married with 79.2% of them unmarried at childbirth.
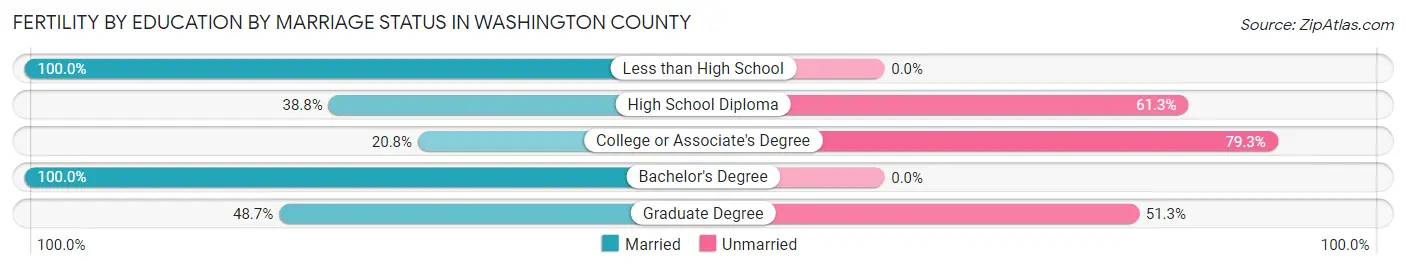
| Educational Attainment | Married | Unmarried |
| Less than High School | 44 (100.0%) | 0 (0.0%) |
| High School Diploma | 31 (38.8%) | 49 (61.3%) |
| College or Associate's Degree | 22 (20.7%) | 84 (79.2%) |
| Bachelor's Degree | 121 (100.0%) | 0 (0.0%) |
| Graduate Degree | 19 (48.7%) | 20 (51.3%) |
| Total | 237 (60.8%) | 153 (39.2%) |
Employment Characteristics in Washington County
Employment by Class of Employer in Washington County
Among the 16,369 employed individuals in Washington County, private company employees (10,158 | 62.1%), local government employees (1,403 | 8.6%), and state government employees (1,353 | 8.3%) make up the most common classes of employment.
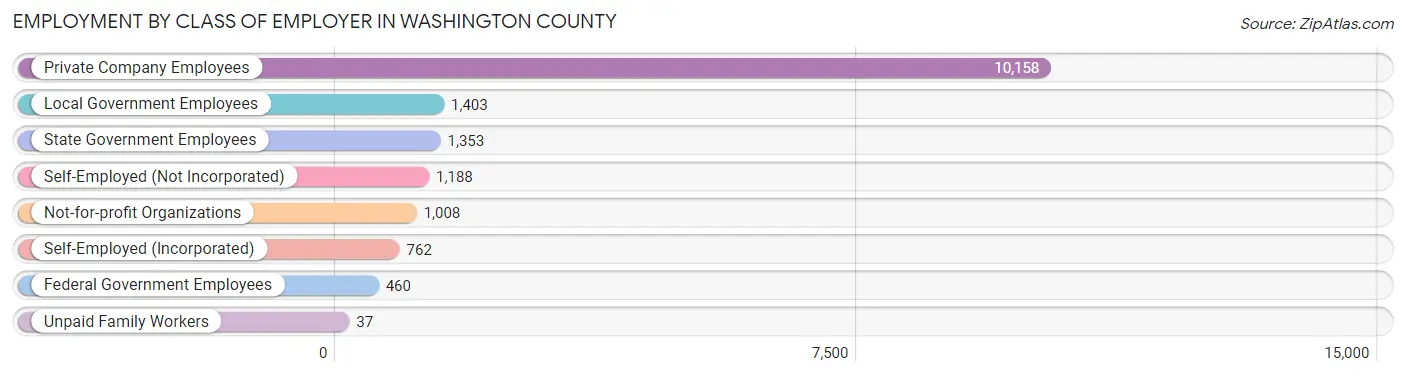
| Employer Class | # Employees | % Employees |
| Private Company Employees | 10,158 | 62.1% |
| Self-Employed (Incorporated) | 762 | 4.7% |
| Self-Employed (Not Incorporated) | 1,188 | 7.3% |
| Not-for-profit Organizations | 1,008 | 6.2% |
| Local Government Employees | 1,403 | 8.6% |
| State Government Employees | 1,353 | 8.3% |
| Federal Government Employees | 460 | 2.8% |
| Unpaid Family Workers | 37 | 0.2% |
| Total | 16,369 | 100.0% |
Employment Status by Age in Washington County
According to the labor force statistics for Washington County, out of the total population over 16 years of age (29,247), 58.5% or 17,109 individuals are in the labor force, with 2.7% or 462 of them unemployed. The age group with the highest labor force participation rate is 25 to 29 years, with 88.4% or 1,793 individuals in the labor force. Within the labor force, the 16 to 19 years age range has the highest percentage of unemployed individuals, with 9.4% or 97 of them being unemployed.
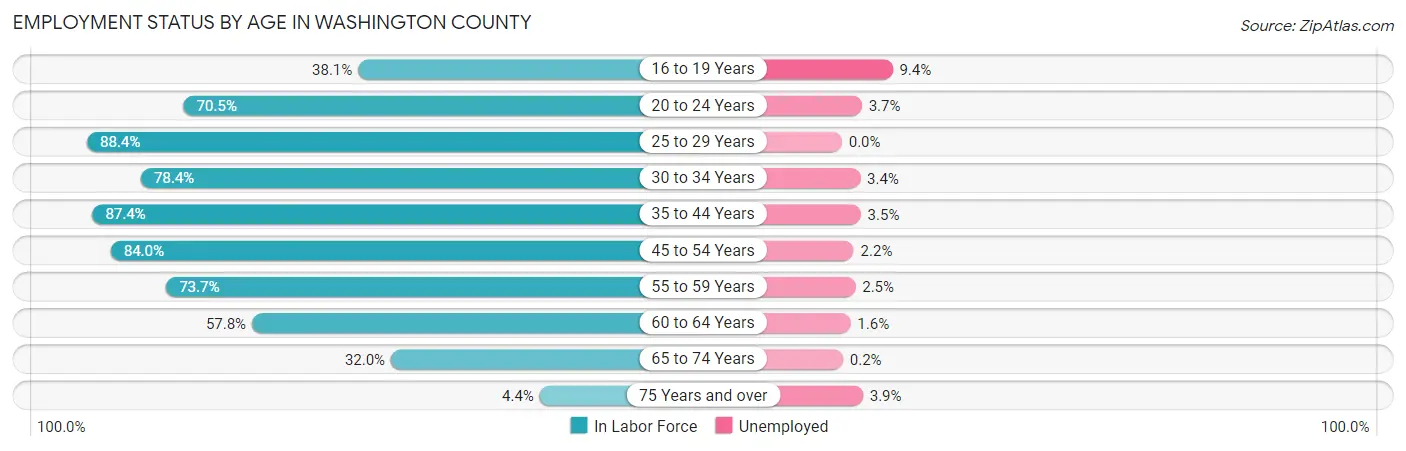
| Age Bracket | In Labor Force | Unemployed |
| 16 to 19 Years | 1,037 (38.1%) | 97 (9.4%) |
| 20 to 24 Years | 1,643 (70.5%) | 61 (3.7%) |
| 25 to 29 Years | 1,793 (88.4%) | 0 (0.0%) |
| 30 to 34 Years | 1,318 (78.4%) | 45 (3.4%) |
| 35 to 44 Years | 3,077 (87.4%) | 108 (3.5%) |
| 45 to 54 Years | 3,431 (84.0%) | 75 (2.2%) |
| 55 to 59 Years | 1,569 (73.7%) | 39 (2.5%) |
| 60 to 64 Years | 1,720 (57.8%) | 28 (1.6%) |
| 65 to 74 Years | 1,377 (32.0%) | 3 (0.2%) |
| 75 Years and over | 153 (4.4%) | 6 (3.9%) |
| Total | 17,109 (58.5%) | 462 (2.7%) |
Employment Status by Educational Attainment in Washington County
According to labor force statistics for Washington County, 78.6% of individuals (12,905) out of the total population between 25 and 64 years of age (16,418) are in the labor force, with 2.3% or 297 of them being unemployed. The group with the highest labor force participation rate are those with the educational attainment of bachelor's degree or higher, with 86.7% or 4,015 individuals in the labor force. Within the labor force, individuals with less than high school education have the highest percentage of unemployment, with 2.7% or 24 of them being unemployed.
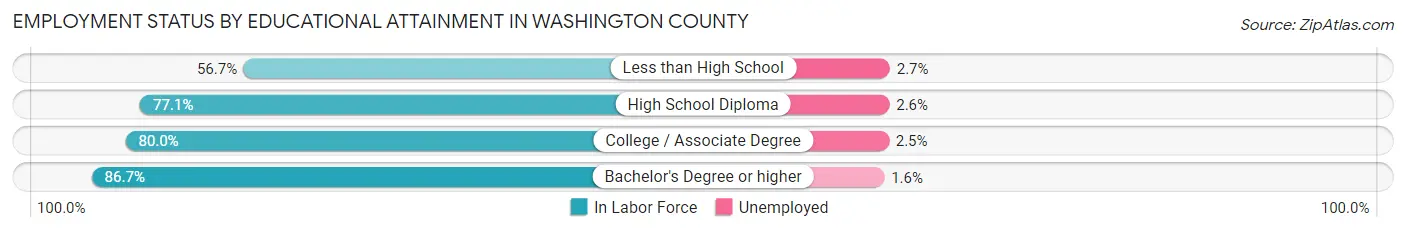
| Educational Attainment | In Labor Force | Unemployed |
| Less than High School | 895 (56.7%) | 43 (2.7%) |
| High School Diploma | 4,407 (77.1%) | 149 (2.6%) |
| College / Associate Degree | 3,594 (80.0%) | 112 (2.5%) |
| Bachelor's Degree or higher | 4,015 (86.7%) | 74 (1.6%) |
| Total | 12,905 (78.6%) | 378 (2.3%) |
Employment Occupations by Sex in Washington County
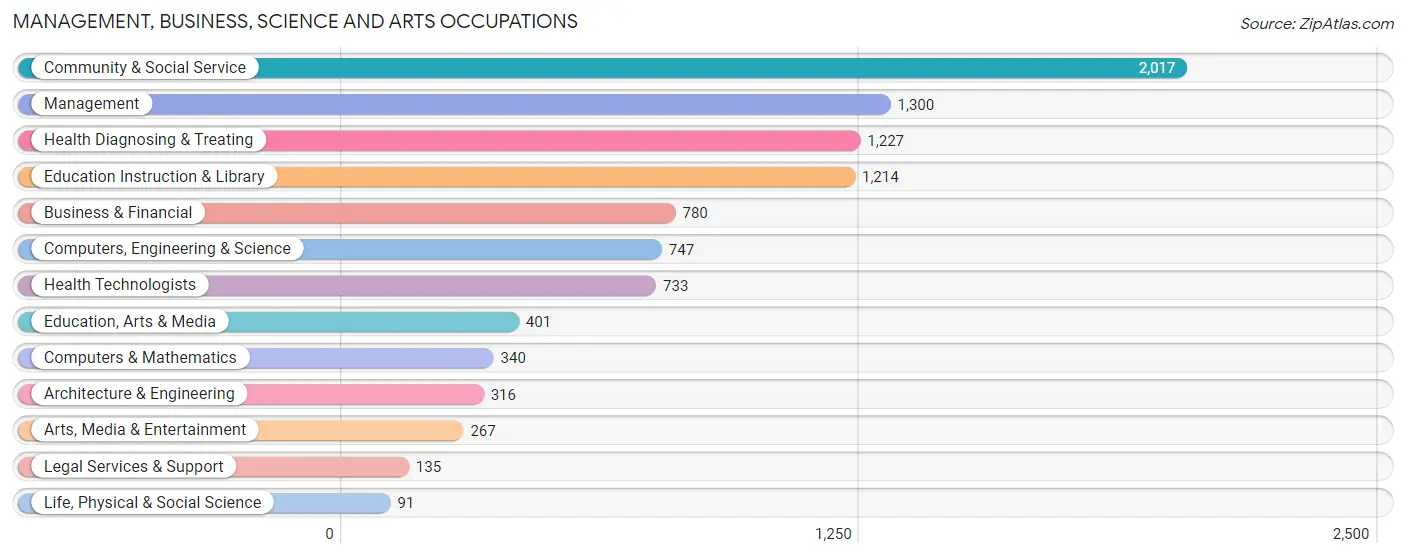
Management, Business, Science and Arts Occupations
The most common Management, Business, Science and Arts occupations in Washington County are Community & Social Service (2,017 | 12.1%), Management (1,300 | 7.8%), Health Diagnosing & Treating (1,227 | 7.4%), Education Instruction & Library (1,214 | 7.3%), and Business & Financial (780 | 4.7%).
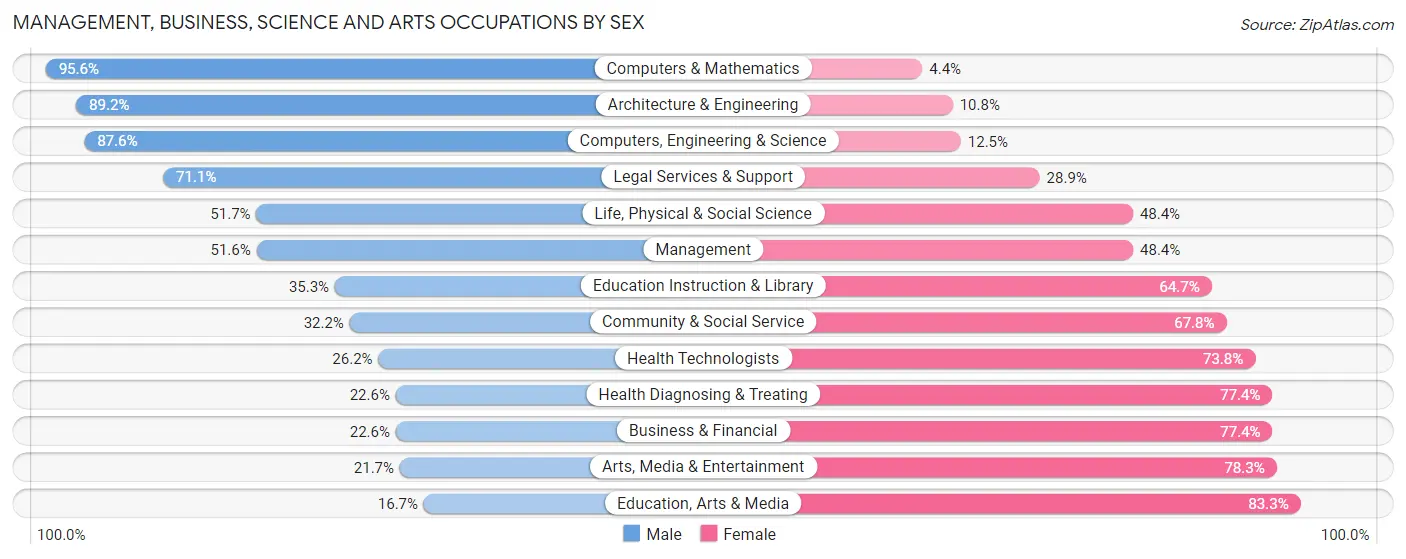
Management, Business, Science and Arts Occupations by Sex
Within the Management, Business, Science and Arts occupations in Washington County, the most male-oriented occupations are Computers & Mathematics (95.6%), Architecture & Engineering (89.2%), and Computers, Engineering & Science (87.5%), while the most female-oriented occupations are Education, Arts & Media (83.3%), Arts, Media & Entertainment (78.3%), and Business & Financial (77.4%).
| Occupation | Male | Female |
| Management | 671 (51.6%) | 629 (48.4%) |
| Business & Financial | 176 (22.6%) | 604 (77.4%) |
| Computers, Engineering & Science | 654 (87.5%) | 93 (12.4%) |
| Computers & Mathematics | 325 (95.6%) | 15 (4.4%) |
| Architecture & Engineering | 282 (89.2%) | 34 (10.8%) |
| Life, Physical & Social Science | 47 (51.6%) | 44 (48.3%) |
| Community & Social Service | 649 (32.2%) | 1,368 (67.8%) |
| Education, Arts & Media | 67 (16.7%) | 334 (83.3%) |
| Legal Services & Support | 96 (71.1%) | 39 (28.9%) |
| Education Instruction & Library | 428 (35.3%) | 786 (64.7%) |
| Arts, Media & Entertainment | 58 (21.7%) | 209 (78.3%) |
| Health Diagnosing & Treating | 277 (22.6%) | 950 (77.4%) |
| Health Technologists | 192 (26.2%) | 541 (73.8%) |
| Total (Category) | 2,427 (40.0%) | 3,644 (60.0%) |
| Total (Overall) | 8,686 (52.2%) | 7,947 (47.8%) |
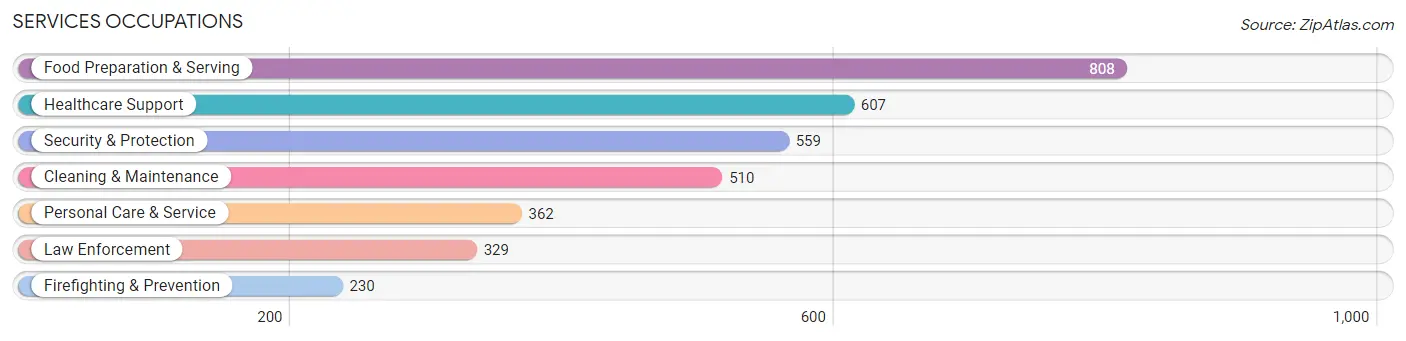
Services Occupations
The most common Services occupations in Washington County are Food Preparation & Serving (808 | 4.9%), Healthcare Support (607 | 3.6%), Security & Protection (559 | 3.4%), Cleaning & Maintenance (510 | 3.1%), and Personal Care & Service (362 | 2.2%).
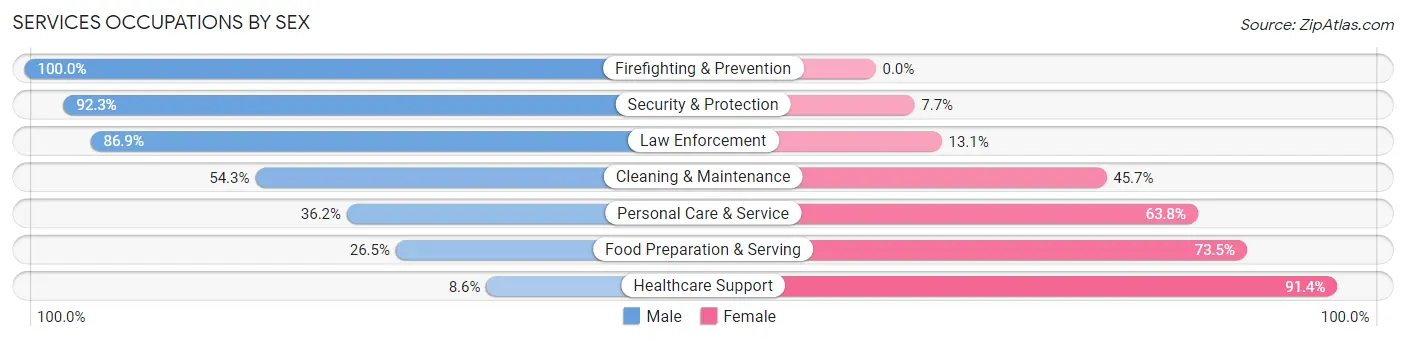
Services Occupations by Sex
Within the Services occupations in Washington County, the most male-oriented occupations are Firefighting & Prevention (100.0%), Security & Protection (92.3%), and Law Enforcement (86.9%), while the most female-oriented occupations are Healthcare Support (91.4%), Food Preparation & Serving (73.5%), and Personal Care & Service (63.8%).
| Occupation | Male | Female |
| Healthcare Support | 52 (8.6%) | 555 (91.4%) |
| Security & Protection | 516 (92.3%) | 43 (7.7%) |
| Firefighting & Prevention | 230 (100.0%) | 0 (0.0%) |
| Law Enforcement | 286 (86.9%) | 43 (13.1%) |
| Food Preparation & Serving | 214 (26.5%) | 594 (73.5%) |
| Cleaning & Maintenance | 277 (54.3%) | 233 (45.7%) |
| Personal Care & Service | 131 (36.2%) | 231 (63.8%) |
| Total (Category) | 1,190 (41.8%) | 1,656 (58.2%) |
| Total (Overall) | 8,686 (52.2%) | 7,947 (47.8%) |
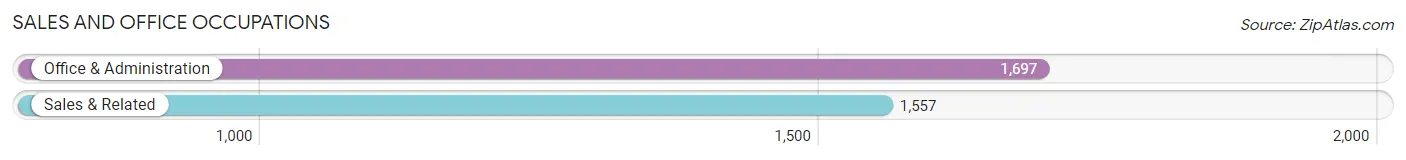
Sales and Office Occupations
The most common Sales and Office occupations in Washington County are Office & Administration (1,697 | 10.2%), and Sales & Related (1,557 | 9.4%).
Sales and Office Occupations by Sex
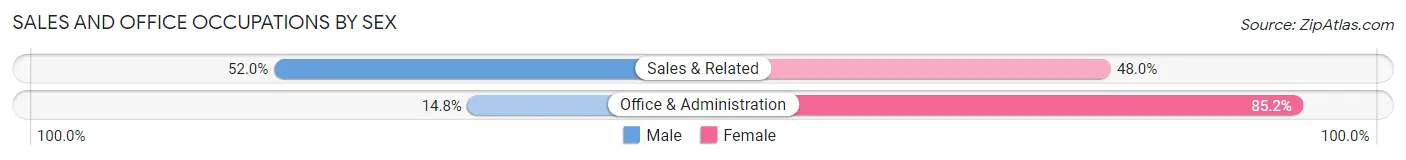
| Occupation | Male | Female |
| Sales & Related | 810 (52.0%) | 747 (48.0%) |
| Office & Administration | 251 (14.8%) | 1,446 (85.2%) |
| Total (Category) | 1,061 (32.6%) | 2,193 (67.4%) |
| Total (Overall) | 8,686 (52.2%) | 7,947 (47.8%) |
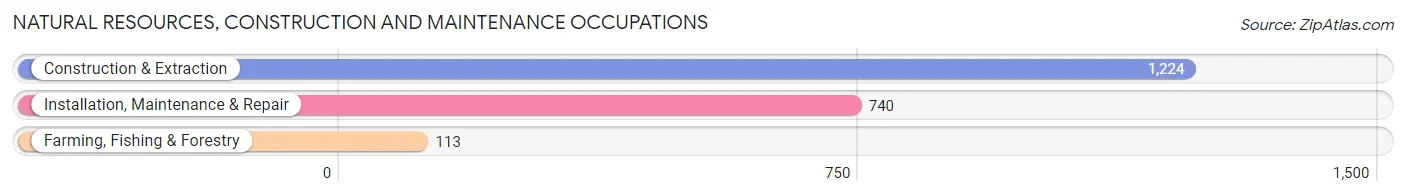
Natural Resources, Construction and Maintenance Occupations
The most common Natural Resources, Construction and Maintenance occupations in Washington County are Construction & Extraction (1,224 | 7.4%), Installation, Maintenance & Repair (740 | 4.4%), and Farming, Fishing & Forestry (113 | 0.7%).
Natural Resources, Construction and Maintenance Occupations by Sex
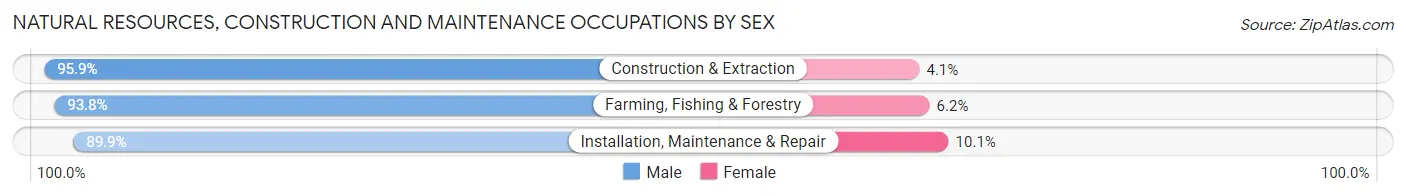
| Occupation | Male | Female |
| Farming, Fishing & Forestry | 106 (93.8%) | 7 (6.2%) |
| Construction & Extraction | 1,174 (95.9%) | 50 (4.1%) |
| Installation, Maintenance & Repair | 665 (89.9%) | 75 (10.1%) |
| Total (Category) | 1,945 (93.6%) | 132 (6.4%) |
| Total (Overall) | 8,686 (52.2%) | 7,947 (47.8%) |
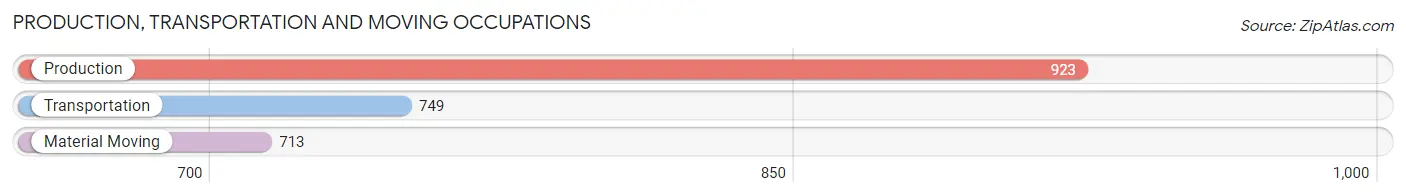
Production, Transportation and Moving Occupations
The most common Production, Transportation and Moving occupations in Washington County are Production (923 | 5.6%), Transportation (749 | 4.5%), and Material Moving (713 | 4.3%).
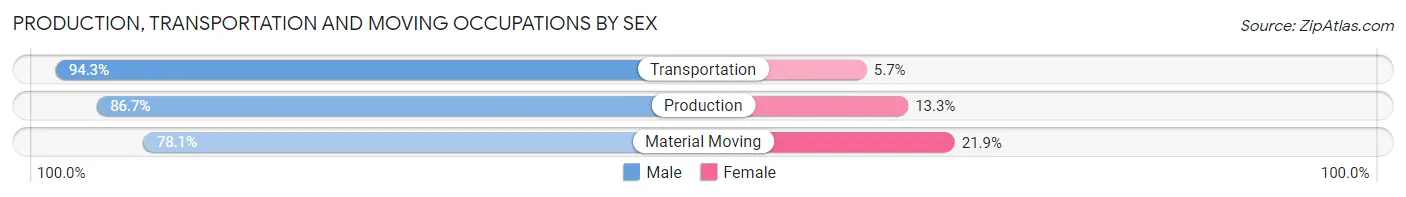
Production, Transportation and Moving Occupations by Sex
| Occupation | Male | Female |
| Production | 800 (86.7%) | 123 (13.3%) |
| Transportation | 706 (94.3%) | 43 (5.7%) |
| Material Moving | 557 (78.1%) | 156 (21.9%) |
| Total (Category) | 2,063 (86.5%) | 322 (13.5%) |
| Total (Overall) | 8,686 (52.2%) | 7,947 (47.8%) |
Employment Industries by Sex in Washington County
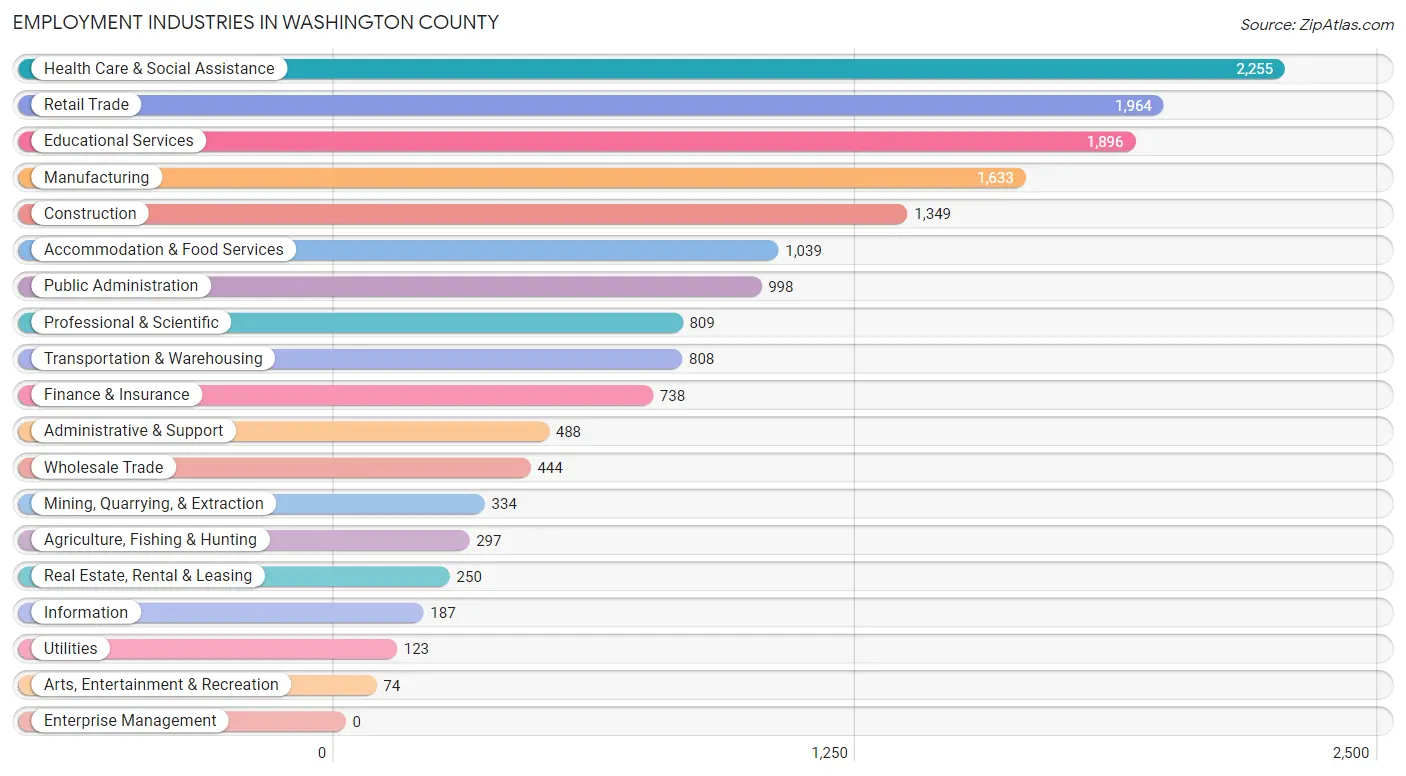
Employment Industries in Washington County
The major employment industries in Washington County include Health Care & Social Assistance (2,255 | 13.6%), Retail Trade (1,964 | 11.8%), Educational Services (1,896 | 11.4%), Manufacturing (1,633 | 9.8%), and Construction (1,349 | 8.1%).
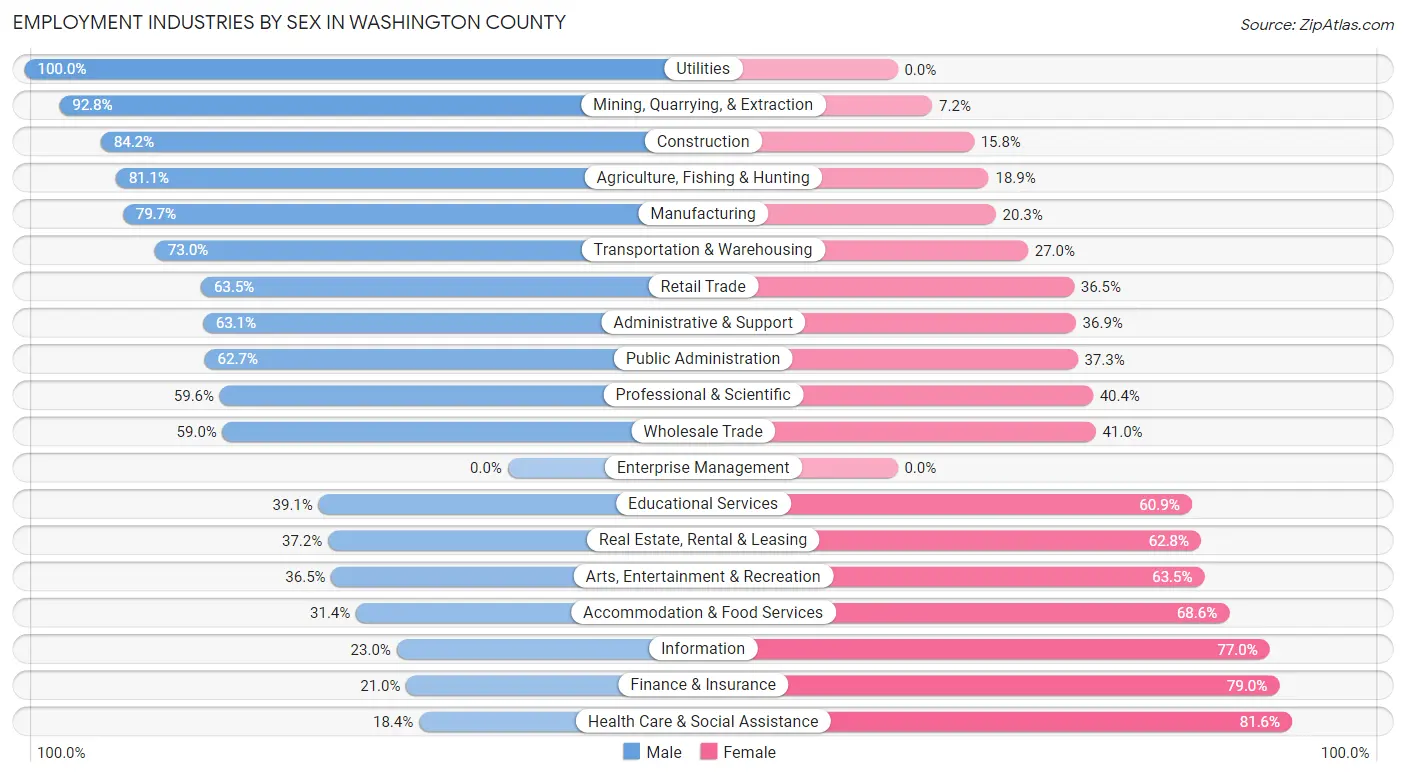
Employment Industries by Sex in Washington County
The Washington County industries that see more men than women are Utilities (100.0%), Mining, Quarrying, & Extraction (92.8%), and Construction (84.2%), whereas the industries that tend to have a higher number of women are Health Care & Social Assistance (81.6%), Finance & Insurance (79.0%), and Information (77.0%).
| Industry | Male | Female |
| Agriculture, Fishing & Hunting | 241 (81.1%) | 56 (18.9%) |
| Mining, Quarrying, & Extraction | 310 (92.8%) | 24 (7.2%) |
| Construction | 1,136 (84.2%) | 213 (15.8%) |
| Manufacturing | 1,301 (79.7%) | 332 (20.3%) |
| Wholesale Trade | 262 (59.0%) | 182 (41.0%) |
| Retail Trade | 1,247 (63.5%) | 717 (36.5%) |
| Transportation & Warehousing | 590 (73.0%) | 218 (27.0%) |
| Utilities | 123 (100.0%) | 0 (0.0%) |
| Information | 43 (23.0%) | 144 (77.0%) |
| Finance & Insurance | 155 (21.0%) | 583 (79.0%) |
| Real Estate, Rental & Leasing | 93 (37.2%) | 157 (62.8%) |
| Professional & Scientific | 482 (59.6%) | 327 (40.4%) |
| Enterprise Management | 0 (0.0%) | 0 (0.0%) |
| Administrative & Support | 308 (63.1%) | 180 (36.9%) |
| Educational Services | 742 (39.1%) | 1,154 (60.9%) |
| Health Care & Social Assistance | 414 (18.4%) | 1,841 (81.6%) |
| Arts, Entertainment & Recreation | 27 (36.5%) | 47 (63.5%) |
| Accommodation & Food Services | 326 (31.4%) | 713 (68.6%) |
| Public Administration | 626 (62.7%) | 372 (37.3%) |
| Total | 8,686 (52.2%) | 7,947 (47.8%) |
Education in Washington County
School Enrollment in Washington County
The most common levels of schooling among the 9,122 students in Washington County are college / undergraduate (2,255 | 24.7%), elementary school (1,818 | 19.9%), and middle school (1,770 | 19.4%).
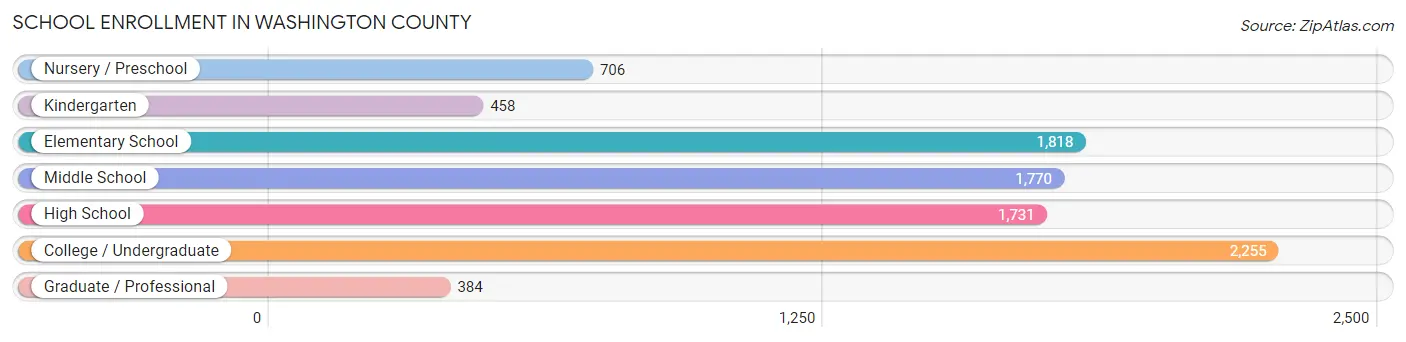
| School Level | # Students | % Students |
| Nursery / Preschool | 706 | 7.7% |
| Kindergarten | 458 | 5.0% |
| Elementary School | 1,818 | 19.9% |
| Middle School | 1,770 | 19.4% |
| High School | 1,731 | 19.0% |
| College / Undergraduate | 2,255 | 24.7% |
| Graduate / Professional | 384 | 4.2% |
| Total | 9,122 | 100.0% |
School Enrollment by Age by Funding Source in Washington County
Out of a total of 9,122 students who are enrolled in schools in Washington County, 1,469 (16.1%) attend a private institution, while the remaining 7,653 (83.9%) are enrolled in public schools. The age group of 3 to 4 year olds has the highest likelihood of being enrolled in private schools, with 271 (49.3% in the age bracket) enrolled. Conversely, the age group of 25 to 34 year olds has the lowest likelihood of being enrolled in a private school, with 478 (100.0% in the age bracket) attending a public institution.
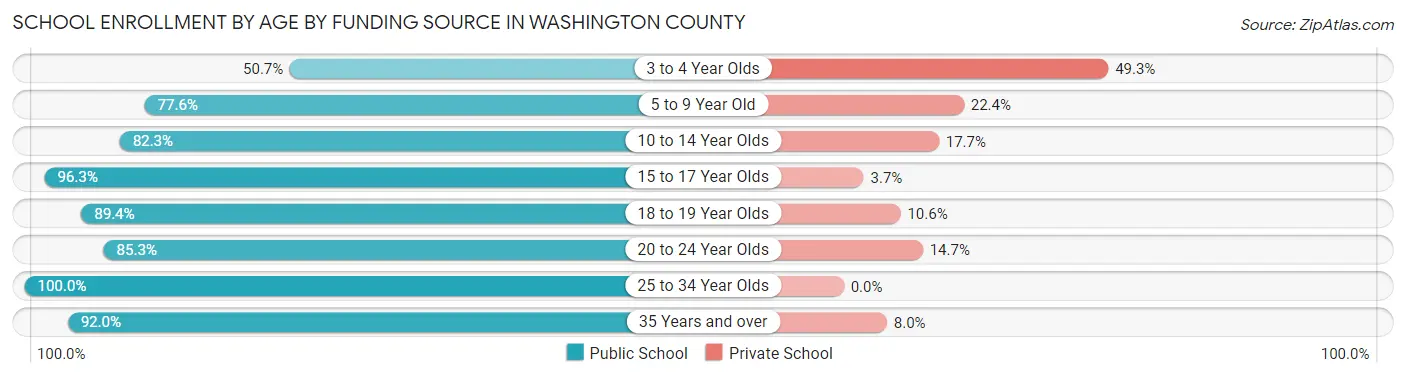
| Age Bracket | Public School | Private School |
| 3 to 4 Year Olds | 279 (50.7%) | 271 (49.3%) |
| 5 to 9 Year Old | 1,638 (77.6%) | 472 (22.4%) |
| 10 to 14 Year Olds | 1,816 (82.3%) | 391 (17.7%) |
| 15 to 17 Year Olds | 1,271 (96.3%) | 49 (3.7%) |
| 18 to 19 Year Olds | 1,150 (89.4%) | 136 (10.6%) |
| 20 to 24 Year Olds | 712 (85.3%) | 123 (14.7%) |
| 25 to 34 Year Olds | 478 (100.0%) | 0 (0.0%) |
| 35 Years and over | 309 (92.0%) | 27 (8.0%) |
| Total | 7,653 (83.9%) | 1,469 (16.1%) |
Educational Attainment by Field of Study in Washington County
Education (1,306 | 17.3%), business (1,290 | 17.1%), science & technology (793 | 10.5%), bio, nature & agricultural (739 | 9.8%), and liberal arts & history (477 | 6.3%) are the most common fields of study among 7,531 individuals in Washington County who have obtained a bachelor's degree or higher.
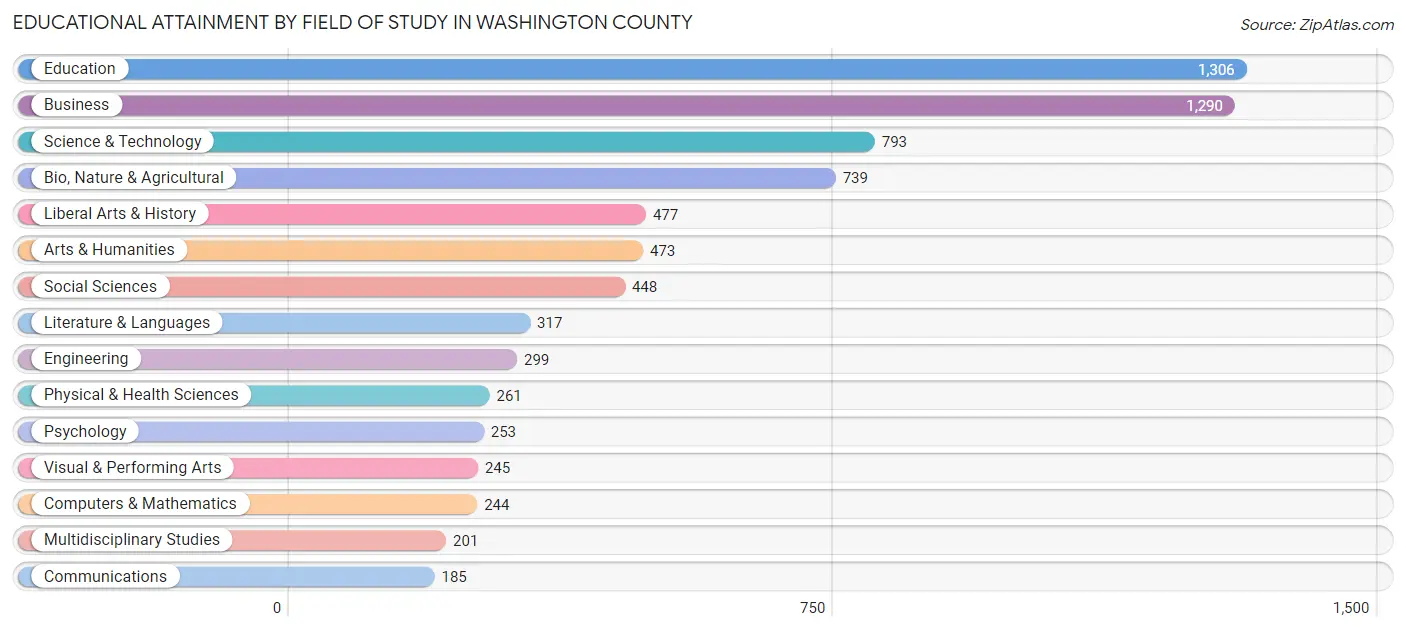
| Field of Study | # Graduates | % Graduates |
| Computers & Mathematics | 244 | 3.2% |
| Bio, Nature & Agricultural | 739 | 9.8% |
| Physical & Health Sciences | 261 | 3.5% |
| Psychology | 253 | 3.4% |
| Social Sciences | 448 | 5.9% |
| Engineering | 299 | 4.0% |
| Multidisciplinary Studies | 201 | 2.7% |
| Science & Technology | 793 | 10.5% |
| Business | 1,290 | 17.1% |
| Education | 1,306 | 17.3% |
| Literature & Languages | 317 | 4.2% |
| Liberal Arts & History | 477 | 6.3% |
| Visual & Performing Arts | 245 | 3.3% |
| Communications | 185 | 2.5% |
| Arts & Humanities | 473 | 6.3% |
| Total | 7,531 | 100.0% |
Transportation & Commute in Washington County
Vehicle Availability by Sex in Washington County
The most prevalent vehicle ownership categories in Washington County are males with 2 vehicles (3,174, accounting for 37.8%) and females with 2 vehicles (3,164, making up 41.3%).
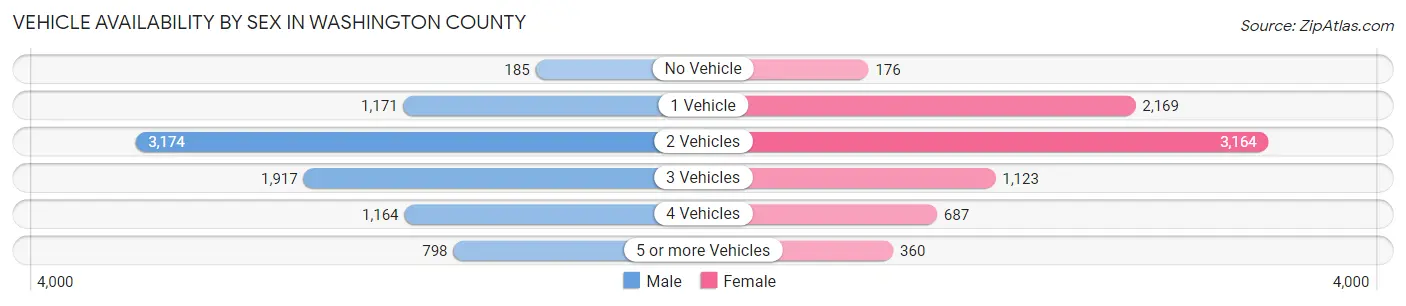
| Vehicles Available | Male | Female |
| No Vehicle | 185 (2.2%) | 176 (2.3%) |
| 1 Vehicle | 1,171 (13.9%) | 2,169 (28.2%) |
| 2 Vehicles | 3,174 (37.8%) | 3,164 (41.2%) |
| 3 Vehicles | 1,917 (22.8%) | 1,123 (14.6%) |
| 4 Vehicles | 1,164 (13.8%) | 687 (8.9%) |
| 5 or more Vehicles | 798 (9.5%) | 360 (4.7%) |
| Total | 8,409 (100.0%) | 7,679 (100.0%) |
Commute Time in Washington County
The most frequently occuring commute durations in Washington County are 5 to 9 minutes (3,186 commuters, 21.0%), 10 to 14 minutes (2,714 commuters, 17.9%), and 15 to 19 minutes (2,315 commuters, 15.2%).
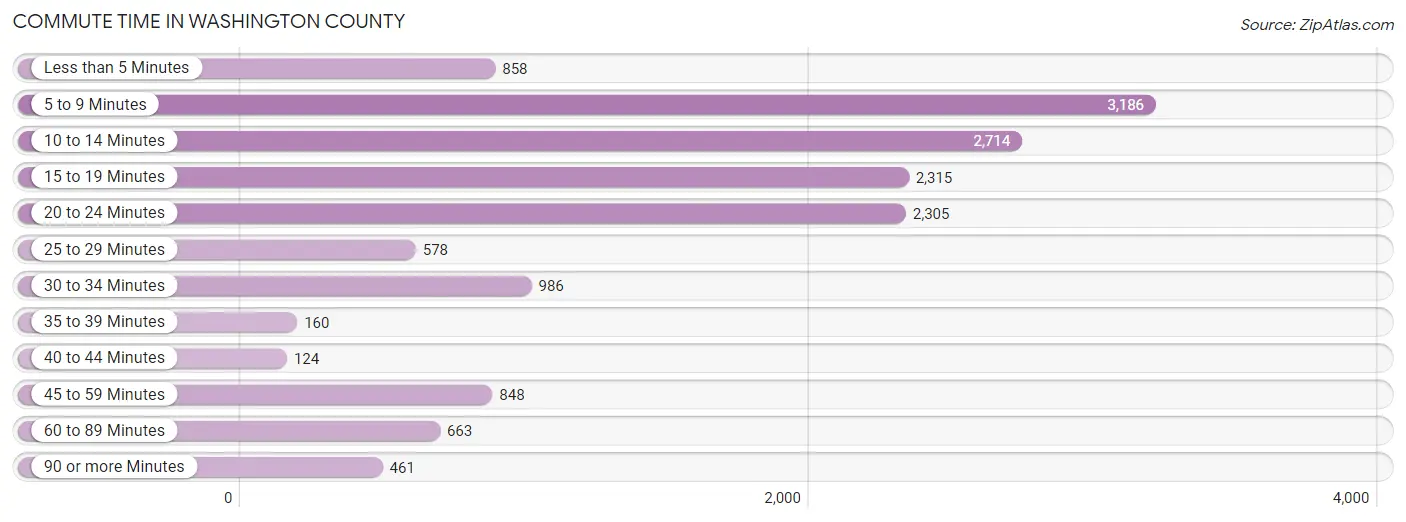
| Commute Time | # Commuters | % Commuters |
| Less than 5 Minutes | 858 | 5.7% |
| 5 to 9 Minutes | 3,186 | 21.0% |
| 10 to 14 Minutes | 2,714 | 17.9% |
| 15 to 19 Minutes | 2,315 | 15.2% |
| 20 to 24 Minutes | 2,305 | 15.2% |
| 25 to 29 Minutes | 578 | 3.8% |
| 30 to 34 Minutes | 986 | 6.5% |
| 35 to 39 Minutes | 160 | 1.1% |
| 40 to 44 Minutes | 124 | 0.8% |
| 45 to 59 Minutes | 848 | 5.6% |
| 60 to 89 Minutes | 663 | 4.4% |
| 90 or more Minutes | 461 | 3.0% |
Commute Time by Sex in Washington County
The most common commute times in Washington County are 5 to 9 minutes (1,502 commuters, 18.8%) for males and 5 to 9 minutes (1,684 commuters, 23.4%) for females.
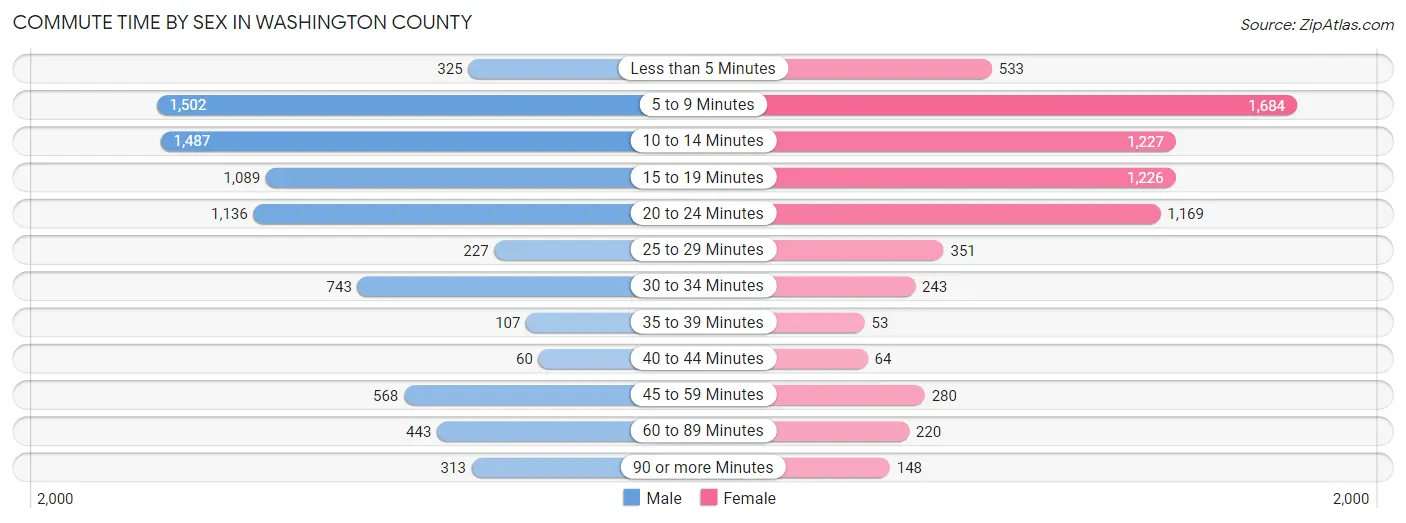
| Commute Time | Male | Female |
| Less than 5 Minutes | 325 (4.1%) | 533 (7.4%) |
| 5 to 9 Minutes | 1,502 (18.8%) | 1,684 (23.4%) |
| 10 to 14 Minutes | 1,487 (18.6%) | 1,227 (17.1%) |
| 15 to 19 Minutes | 1,089 (13.6%) | 1,226 (17.0%) |
| 20 to 24 Minutes | 1,136 (14.2%) | 1,169 (16.2%) |
| 25 to 29 Minutes | 227 (2.8%) | 351 (4.9%) |
| 30 to 34 Minutes | 743 (9.3%) | 243 (3.4%) |
| 35 to 39 Minutes | 107 (1.3%) | 53 (0.7%) |
| 40 to 44 Minutes | 60 (0.7%) | 64 (0.9%) |
| 45 to 59 Minutes | 568 (7.1%) | 280 (3.9%) |
| 60 to 89 Minutes | 443 (5.5%) | 220 (3.1%) |
| 90 or more Minutes | 313 (3.9%) | 148 (2.1%) |
Time of Departure to Work by Sex in Washington County
The most frequent times of departure to work in Washington County are 7:00 AM to 7:29 AM (1,269, 15.9%) for males and 7:30 AM to 7:59 AM (1,819, 25.3%) for females.
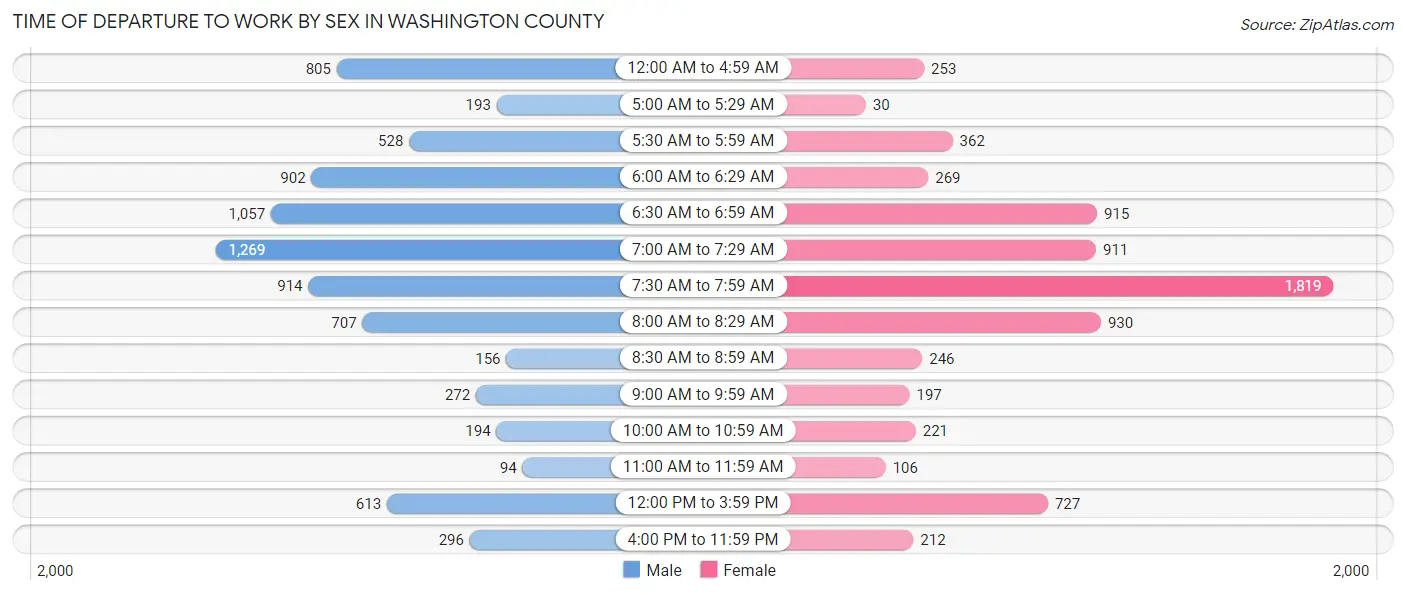
| Time of Departure | Male | Female |
| 12:00 AM to 4:59 AM | 805 (10.1%) | 253 (3.5%) |
| 5:00 AM to 5:29 AM | 193 (2.4%) | 30 (0.4%) |
| 5:30 AM to 5:59 AM | 528 (6.6%) | 362 (5.0%) |
| 6:00 AM to 6:29 AM | 902 (11.3%) | 269 (3.7%) |
| 6:30 AM to 6:59 AM | 1,057 (13.2%) | 915 (12.7%) |
| 7:00 AM to 7:29 AM | 1,269 (15.9%) | 911 (12.7%) |
| 7:30 AM to 7:59 AM | 914 (11.4%) | 1,819 (25.3%) |
| 8:00 AM to 8:29 AM | 707 (8.8%) | 930 (12.9%) |
| 8:30 AM to 8:59 AM | 156 (1.9%) | 246 (3.4%) |
| 9:00 AM to 9:59 AM | 272 (3.4%) | 197 (2.7%) |
| 10:00 AM to 10:59 AM | 194 (2.4%) | 221 (3.1%) |
| 11:00 AM to 11:59 AM | 94 (1.2%) | 106 (1.5%) |
| 12:00 PM to 3:59 PM | 613 (7.7%) | 727 (10.1%) |
| 4:00 PM to 11:59 PM | 296 (3.7%) | 212 (2.9%) |
| Total | 8,000 (100.0%) | 7,198 (100.0%) |
Housing Occupancy in Washington County
Occupancy by Ownership in Washington County
Of the total 14,482 dwellings in Washington County, owner-occupied units account for 10,643 (73.5%), while renter-occupied units make up 3,839 (26.5%).
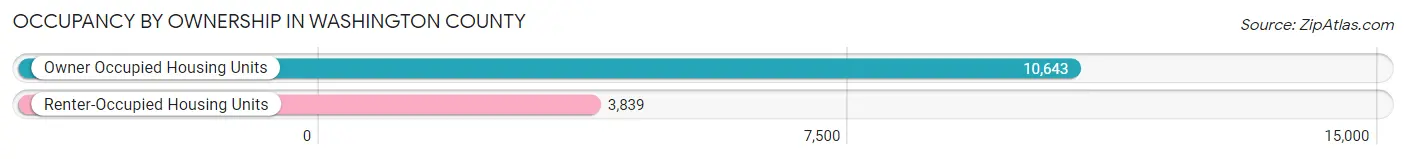
| Occupancy | # Housing Units | % Housing Units |
| Owner Occupied Housing Units | 10,643 | 73.5% |
| Renter-Occupied Housing Units | 3,839 | 26.5% |
| Total Occupied Housing Units | 14,482 | 100.0% |
Occupancy by Household Size in Washington County
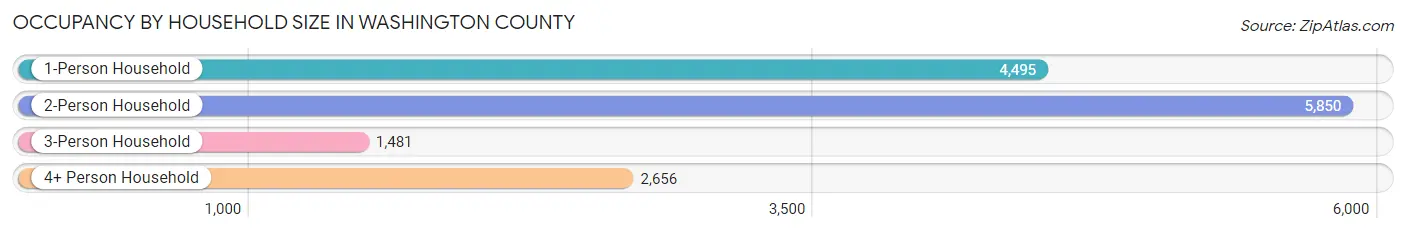
| Household Size | # Housing Units | % Housing Units |
| 1-Person Household | 4,495 | 31.0% |
| 2-Person Household | 5,850 | 40.4% |
| 3-Person Household | 1,481 | 10.2% |
| 4+ Person Household | 2,656 | 18.3% |
| Total Housing Units | 14,482 | 100.0% |
Occupancy by Ownership by Household Size in Washington County
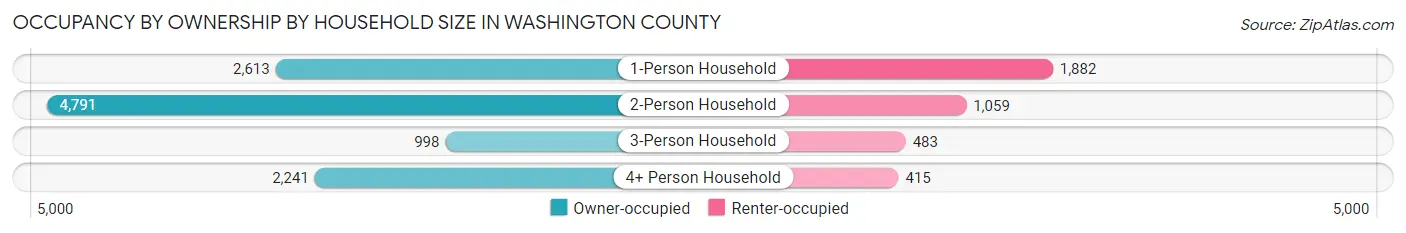
| Household Size | Owner-occupied | Renter-occupied |
| 1-Person Household | 2,613 (58.1%) | 1,882 (41.9%) |
| 2-Person Household | 4,791 (81.9%) | 1,059 (18.1%) |
| 3-Person Household | 998 (67.4%) | 483 (32.6%) |
| 4+ Person Household | 2,241 (84.4%) | 415 (15.6%) |
| Total Housing Units | 10,643 (73.5%) | 3,839 (26.5%) |
Occupancy by Educational Attainment in Washington County
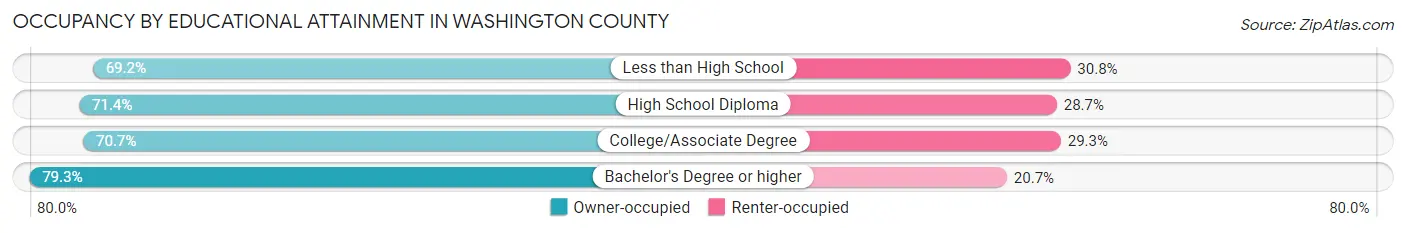
| Household Size | Owner-occupied | Renter-occupied |
| Less than High School | 804 (69.2%) | 358 (30.8%) |
| High School Diploma | 3,028 (71.4%) | 1,216 (28.6%) |
| College/Associate Degree | 3,166 (70.7%) | 1,311 (29.3%) |
| Bachelor's Degree or higher | 3,645 (79.3%) | 954 (20.7%) |
Occupancy by Age of Householder in Washington County
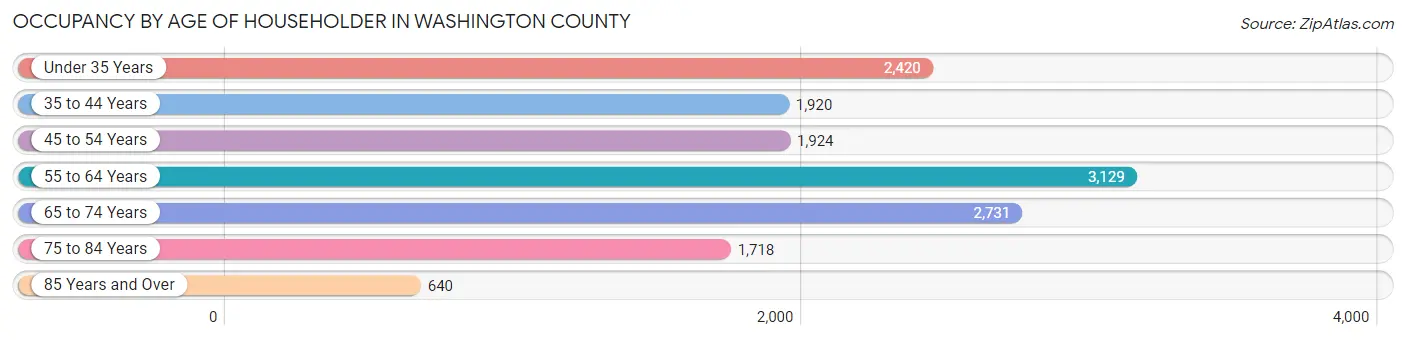
| Age Bracket | # Households | % Households |
| Under 35 Years | 2,420 | 16.7% |
| 35 to 44 Years | 1,920 | 13.3% |
| 45 to 54 Years | 1,924 | 13.3% |
| 55 to 64 Years | 3,129 | 21.6% |
| 65 to 74 Years | 2,731 | 18.9% |
| 75 to 84 Years | 1,718 | 11.9% |
| 85 Years and Over | 640 | 4.4% |
| Total | 14,482 | 100.0% |
Housing Finances in Washington County
Median Income by Occupancy in Washington County
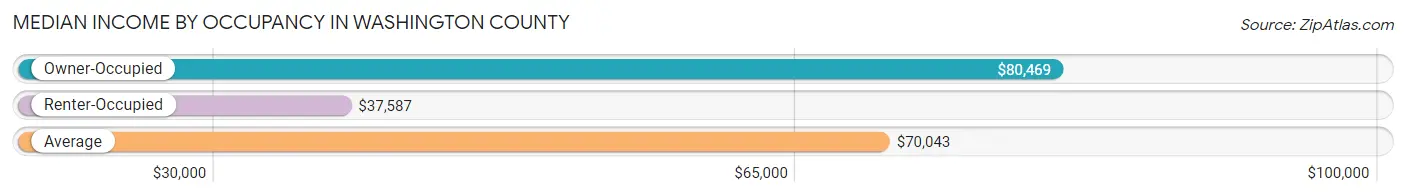
| Occupancy Type | # Households | Median Income |
| Owner-Occupied | 10,643 (73.5%) | $80,469 |
| Renter-Occupied | 3,839 (26.5%) | $37,587 |
| Average | 14,482 (100.0%) | $70,043 |
Occupancy by Householder Income Bracket in Washington County
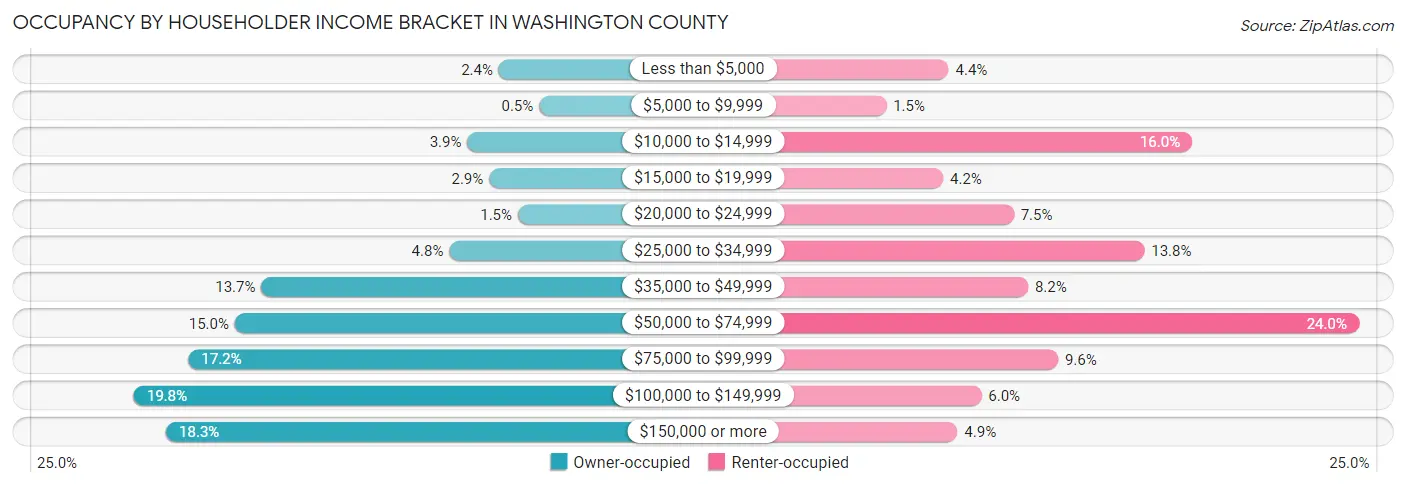
| Income Bracket | Owner-occupied | Renter-occupied |
| Less than $5,000 | 258 (2.4%) | 170 (4.4%) |
| $5,000 to $9,999 | 53 (0.5%) | 56 (1.5%) |
| $10,000 to $14,999 | 417 (3.9%) | 615 (16.0%) |
| $15,000 to $19,999 | 306 (2.9%) | 160 (4.2%) |
| $20,000 to $24,999 | 161 (1.5%) | 289 (7.5%) |
| $25,000 to $34,999 | 509 (4.8%) | 528 (13.8%) |
| $35,000 to $49,999 | 1,461 (13.7%) | 315 (8.2%) |
| $50,000 to $74,999 | 1,595 (15.0%) | 920 (24.0%) |
| $75,000 to $99,999 | 1,831 (17.2%) | 370 (9.6%) |
| $100,000 to $149,999 | 2,107 (19.8%) | 230 (6.0%) |
| $150,000 or more | 1,945 (18.3%) | 186 (4.9%) |
| Total | 10,643 (100.0%) | 3,839 (100.0%) |
Monthly Housing Cost Tiers in Washington County
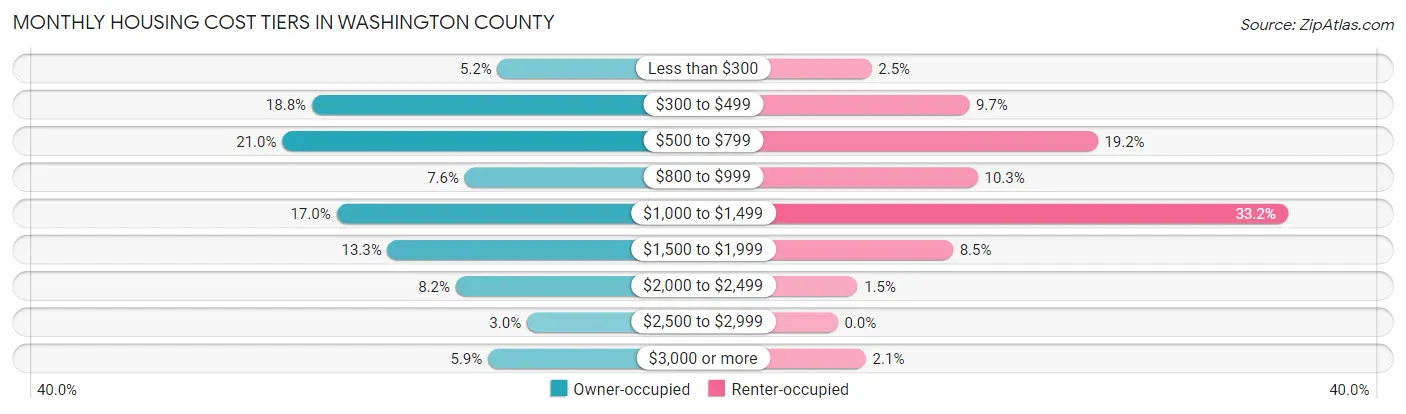
| Monthly Cost | Owner-occupied | Renter-occupied |
| Less than $300 | 549 (5.2%) | 96 (2.5%) |
| $300 to $499 | 2,005 (18.8%) | 372 (9.7%) |
| $500 to $799 | 2,237 (21.0%) | 735 (19.2%) |
| $800 to $999 | 807 (7.6%) | 396 (10.3%) |
| $1,000 to $1,499 | 1,812 (17.0%) | 1,273 (33.2%) |
| $1,500 to $1,999 | 1,412 (13.3%) | 326 (8.5%) |
| $2,000 to $2,499 | 877 (8.2%) | 56 (1.5%) |
| $2,500 to $2,999 | 319 (3.0%) | 0 (0.0%) |
| $3,000 or more | 625 (5.9%) | 80 (2.1%) |
| Total | 10,643 (100.0%) | 3,839 (100.0%) |
Physical Housing Characteristics in Washington County
Housing Structures in Washington County
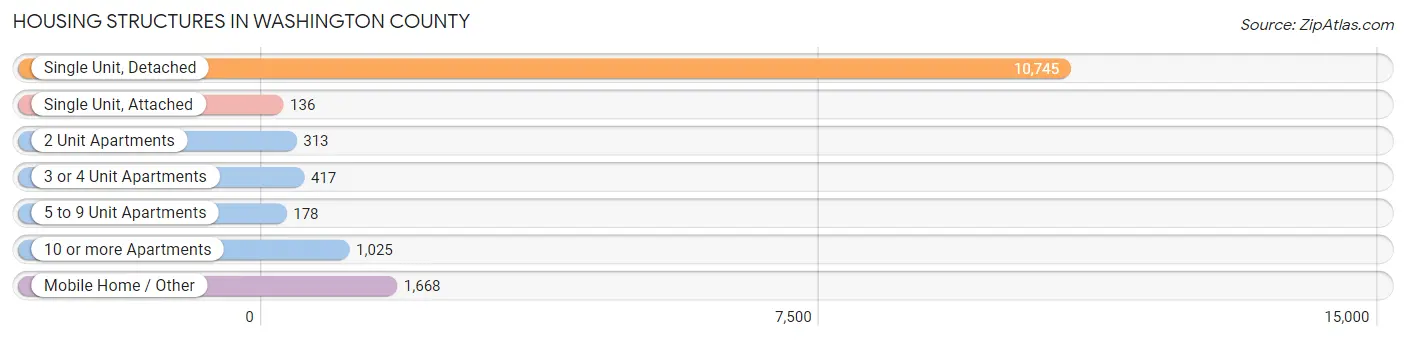
| Structure Type | # Housing Units | % Housing Units |
| Single Unit, Detached | 10,745 | 74.2% |
| Single Unit, Attached | 136 | 0.9% |
| 2 Unit Apartments | 313 | 2.2% |
| 3 or 4 Unit Apartments | 417 | 2.9% |
| 5 to 9 Unit Apartments | 178 | 1.2% |
| 10 or more Apartments | 1,025 | 7.1% |
| Mobile Home / Other | 1,668 | 11.5% |
| Total | 14,482 | 100.0% |
Housing Structures by Occupancy in Washington County
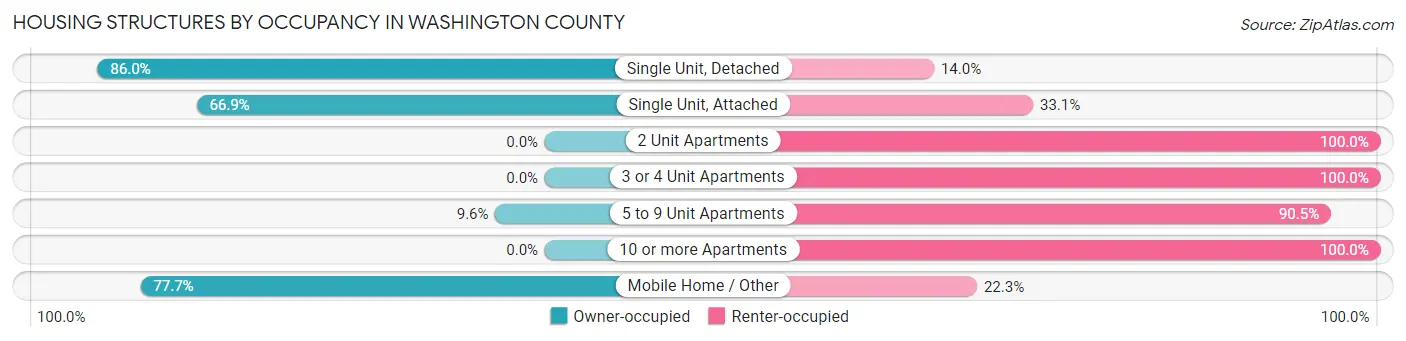
| Structure Type | Owner-occupied | Renter-occupied |
| Single Unit, Detached | 9,239 (86.0%) | 1,506 (14.0%) |
| Single Unit, Attached | 91 (66.9%) | 45 (33.1%) |
| 2 Unit Apartments | 0 (0.0%) | 313 (100.0%) |
| 3 or 4 Unit Apartments | 0 (0.0%) | 417 (100.0%) |
| 5 to 9 Unit Apartments | 17 (9.6%) | 161 (90.4%) |
| 10 or more Apartments | 0 (0.0%) | 1,025 (100.0%) |
| Mobile Home / Other | 1,296 (77.7%) | 372 (22.3%) |
| Total | 10,643 (73.5%) | 3,839 (26.5%) |
Housing Structures by Number of Rooms in Washington County
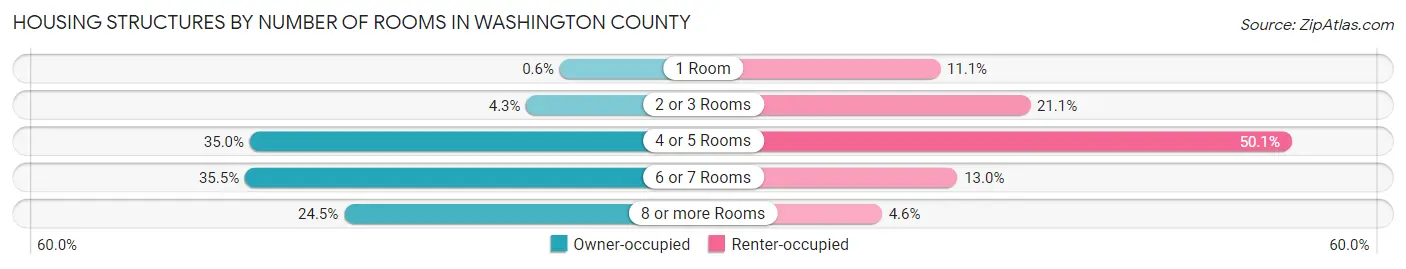
| Number of Rooms | Owner-occupied | Renter-occupied |
| 1 Room | 64 (0.6%) | 426 (11.1%) |
| 2 or 3 Rooms | 459 (4.3%) | 810 (21.1%) |
| 4 or 5 Rooms | 3,725 (35.0%) | 1,925 (50.1%) |
| 6 or 7 Rooms | 3,783 (35.5%) | 500 (13.0%) |
| 8 or more Rooms | 2,612 (24.5%) | 178 (4.6%) |
| Total | 10,643 (100.0%) | 3,839 (100.0%) |
Housing Structure by Heating Type in Washington County
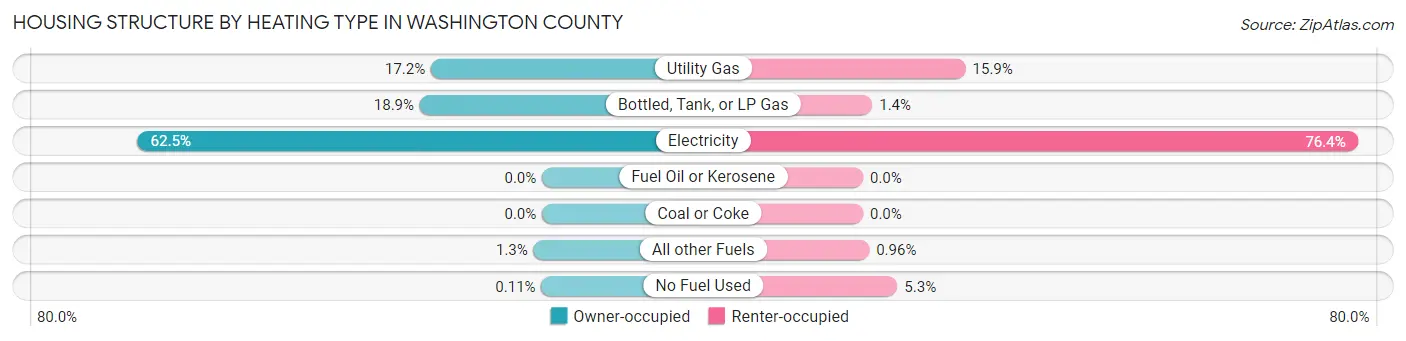
| Heating Type | Owner-occupied | Renter-occupied |
| Utility Gas | 1,827 (17.2%) | 609 (15.9%) |
| Bottled, Tank, or LP Gas | 2,011 (18.9%) | 55 (1.4%) |
| Electricity | 6,654 (62.5%) | 2,934 (76.4%) |
| Fuel Oil or Kerosene | 0 (0.0%) | 0 (0.0%) |
| Coal or Coke | 0 (0.0%) | 0 (0.0%) |
| All other Fuels | 139 (1.3%) | 37 (1.0%) |
| No Fuel Used | 12 (0.1%) | 204 (5.3%) |
| Total | 10,643 (100.0%) | 3,839 (100.0%) |
Household Vehicle Usage in Washington County
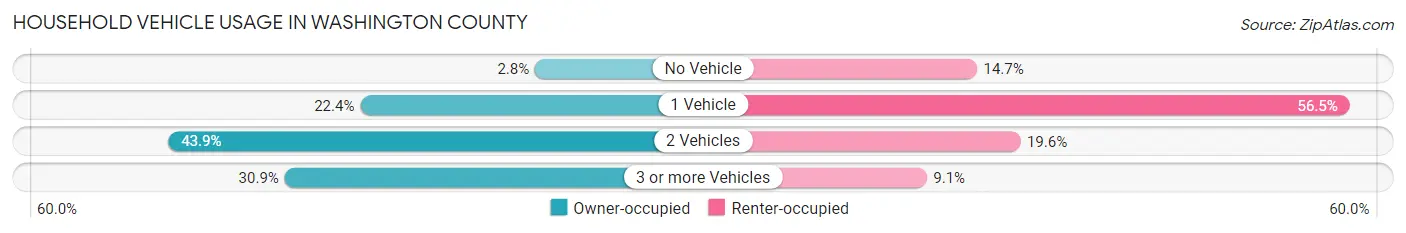
| Vehicles per Household | Owner-occupied | Renter-occupied |
| No Vehicle | 300 (2.8%) | 566 (14.7%) |
| 1 Vehicle | 2,384 (22.4%) | 2,170 (56.5%) |
| 2 Vehicles | 4,673 (43.9%) | 753 (19.6%) |
| 3 or more Vehicles | 3,286 (30.9%) | 350 (9.1%) |
| Total | 10,643 (100.0%) | 3,839 (100.0%) |
Real Estate & Mortgages in Washington County
Real Estate and Mortgage Overview in Washington County
| Characteristic | Without Mortgage | With Mortgage |
| Housing Units | 6,045 | 4,598 |
| Median Property Value | $238,100 | $267,200 |
| Median Household Income | $67,438 | $1,183 |
| Monthly Housing Costs | $552 | $580 |
| Real Estate Taxes | $2,584 | $182 |
Property Value by Mortgage Status in Washington County
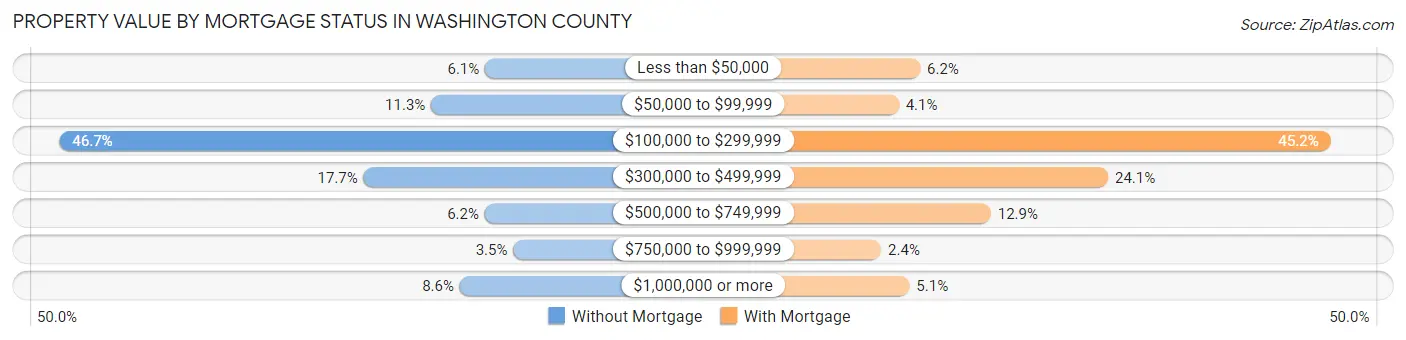
| Property Value | Without Mortgage | With Mortgage |
| Less than $50,000 | 371 (6.1%) | 283 (6.1%) |
| $50,000 to $99,999 | 682 (11.3%) | 189 (4.1%) |
| $100,000 to $299,999 | 2,822 (46.7%) | 2,080 (45.2%) |
| $300,000 to $499,999 | 1,071 (17.7%) | 1,106 (24.0%) |
| $500,000 to $749,999 | 373 (6.2%) | 592 (12.9%) |
| $750,000 to $999,999 | 209 (3.5%) | 112 (2.4%) |
| $1,000,000 or more | 517 (8.6%) | 236 (5.1%) |
| Total | 6,045 (100.0%) | 4,598 (100.0%) |
Household Income by Mortgage Status in Washington County
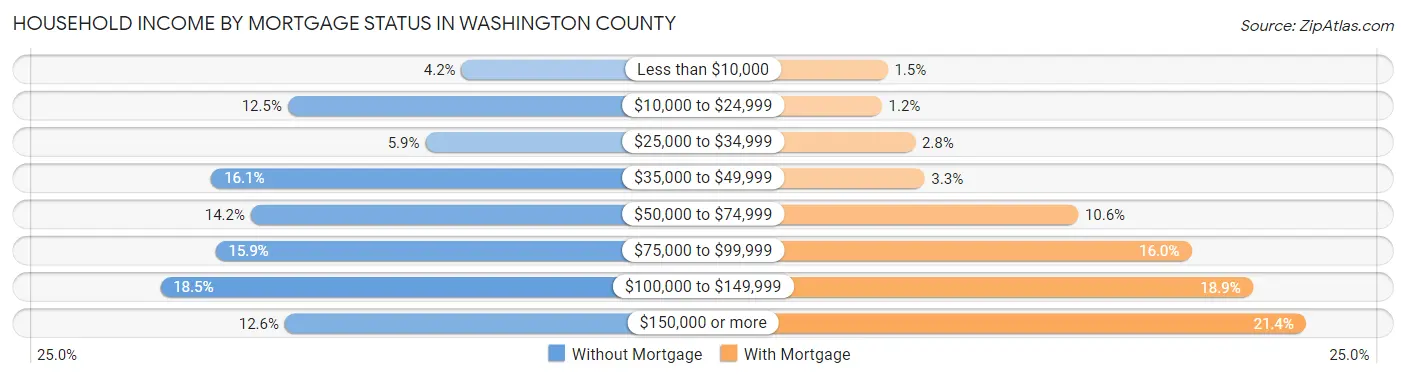
| Household Income | Without Mortgage | With Mortgage |
| Less than $10,000 | 254 (4.2%) | 70 (1.5%) |
| $10,000 to $24,999 | 754 (12.5%) | 57 (1.2%) |
| $25,000 to $34,999 | 358 (5.9%) | 130 (2.8%) |
| $35,000 to $49,999 | 974 (16.1%) | 151 (3.3%) |
| $50,000 to $74,999 | 860 (14.2%) | 487 (10.6%) |
| $75,000 to $99,999 | 962 (15.9%) | 735 (16.0%) |
| $100,000 to $149,999 | 1,121 (18.5%) | 869 (18.9%) |
| $150,000 or more | 762 (12.6%) | 986 (21.4%) |
| Total | 6,045 (100.0%) | 4,598 (100.0%) |
Property Value to Household Income Ratio in Washington County
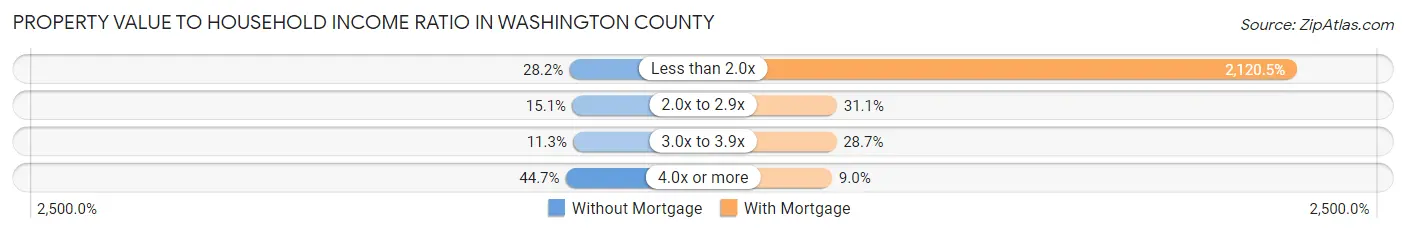
| Value-to-Income Ratio | Without Mortgage | With Mortgage |
| Less than 2.0x | 1,703 (28.2%) | 97,500 (2,120.5%) |
| 2.0x to 2.9x | 913 (15.1%) | 1,428 (31.1%) |
| 3.0x to 3.9x | 683 (11.3%) | 1,319 (28.7%) |
| 4.0x or more | 2,702 (44.7%) | 413 (9.0%) |
| Total | 6,045 (100.0%) | 4,598 (100.0%) |
Real Estate Taxes by Mortgage Status in Washington County
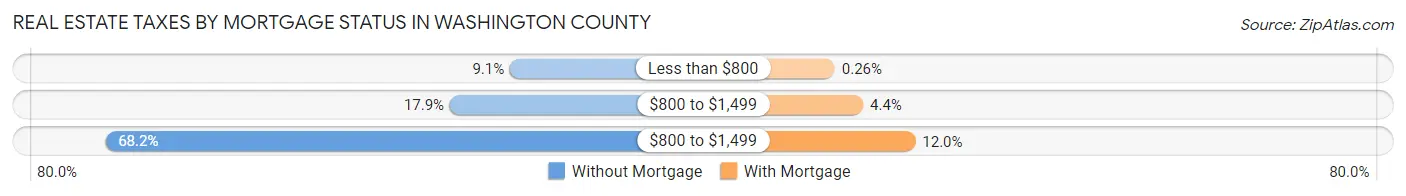
| Property Taxes | Without Mortgage | With Mortgage |
| Less than $800 | 548 (9.1%) | 12 (0.3%) |
| $800 to $1,499 | 1,079 (17.8%) | 202 (4.4%) |
| $800 to $1,499 | 4,124 (68.2%) | 553 (12.0%) |
| Total | 6,045 (100.0%) | 4,598 (100.0%) |
Health & Disability in Washington County
Health Insurance Coverage by Age in Washington County
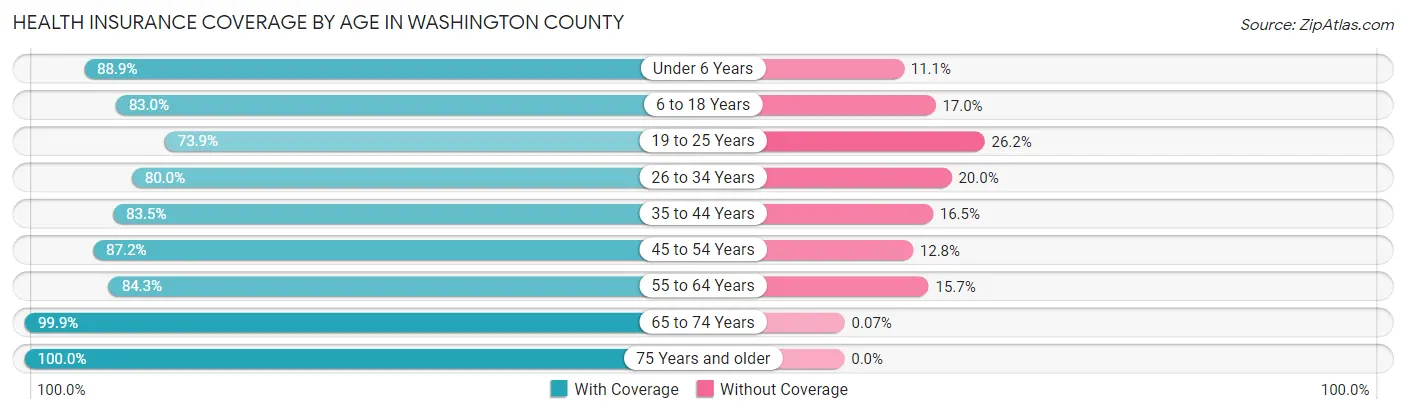
| Age Bracket | With Coverage | Without Coverage |
| Under 6 Years | 2,124 (88.9%) | 265 (11.1%) |
| 6 to 18 Years | 4,800 (83.0%) | 983 (17.0%) |
| 19 to 25 Years | 2,522 (73.9%) | 893 (26.2%) |
| 26 to 34 Years | 2,686 (80.0%) | 671 (20.0%) |
| 35 to 44 Years | 2,865 (83.5%) | 566 (16.5%) |
| 45 to 54 Years | 3,478 (87.2%) | 510 (12.8%) |
| 55 to 64 Years | 4,195 (84.3%) | 782 (15.7%) |
| 65 to 74 Years | 4,182 (99.9%) | 3 (0.1%) |
| 75 Years and older | 3,318 (100.0%) | 0 (0.0%) |
| Total | 30,170 (86.6%) | 4,673 (13.4%) |
Health Insurance Coverage by Citizenship Status in Washington County
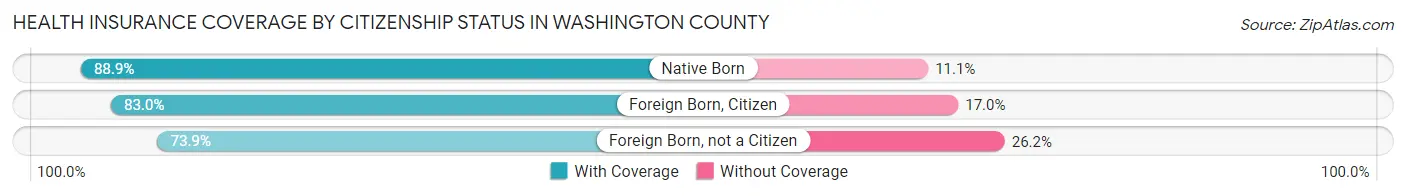
| Citizenship Status | With Coverage | Without Coverage |
| Native Born | 2,124 (88.9%) | 265 (11.1%) |
| Foreign Born, Citizen | 4,800 (83.0%) | 983 (17.0%) |
| Foreign Born, not a Citizen | 2,522 (73.9%) | 893 (26.2%) |
Health Insurance Coverage by Household Income in Washington County
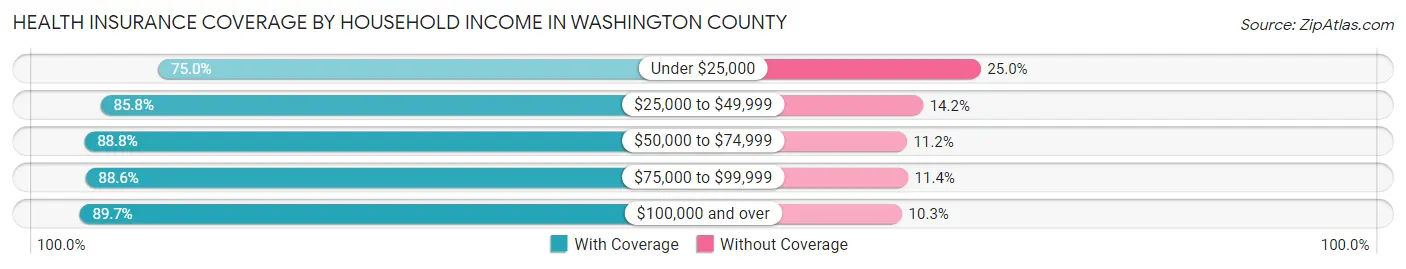
| Household Income | With Coverage | Without Coverage |
| Under $25,000 | 3,115 (75.0%) | 1,040 (25.0%) |
| $25,000 to $49,999 | 4,135 (85.8%) | 686 (14.2%) |
| $50,000 to $74,999 | 4,789 (88.8%) | 603 (11.2%) |
| $75,000 to $99,999 | 4,766 (88.6%) | 613 (11.4%) |
| $100,000 and over | 12,222 (89.7%) | 1,400 (10.3%) |
Public vs Private Health Insurance Coverage by Age in Washington County
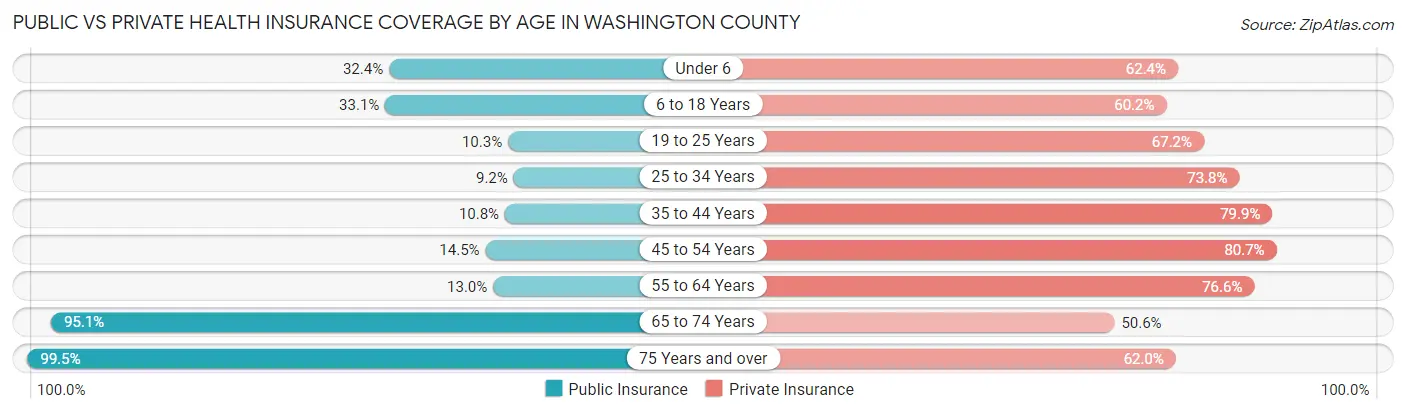
| Age Bracket | Public Insurance | Private Insurance |
| Under 6 | 773 (32.4%) | 1,490 (62.4%) |
| 6 to 18 Years | 1,913 (33.1%) | 3,483 (60.2%) |
| 19 to 25 Years | 351 (10.3%) | 2,295 (67.2%) |
| 25 to 34 Years | 310 (9.2%) | 2,477 (73.8%) |
| 35 to 44 Years | 372 (10.8%) | 2,741 (79.9%) |
| 45 to 54 Years | 577 (14.5%) | 3,217 (80.7%) |
| 55 to 64 Years | 649 (13.0%) | 3,810 (76.5%) |
| 65 to 74 Years | 3,980 (95.1%) | 2,118 (50.6%) |
| 75 Years and over | 3,301 (99.5%) | 2,056 (62.0%) |
| Total | 12,226 (35.1%) | 23,687 (68.0%) |
Disability Status by Sex by Age in Washington County
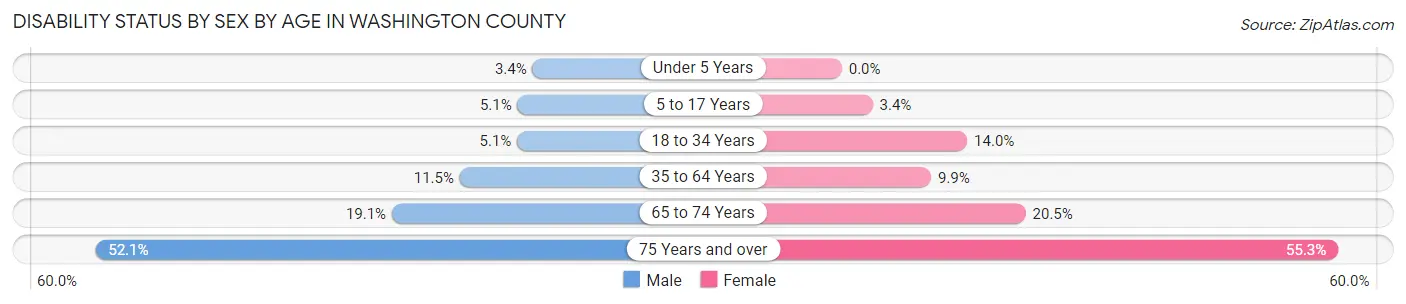
| Age Bracket | Male | Female |
| Under 5 Years | 34 (3.4%) | 0 (0.0%) |
| 5 to 17 Years | 152 (5.1%) | 93 (3.4%) |
| 18 to 34 Years | 180 (5.1%) | 538 (14.0%) |
| 35 to 64 Years | 708 (11.5%) | 621 (9.9%) |
| 65 to 74 Years | 381 (19.1%) | 448 (20.5%) |
| 75 Years and over | 726 (52.1%) | 1,064 (55.3%) |
Disability Class by Sex by Age in Washington County
Disability Class: Hearing Difficulty
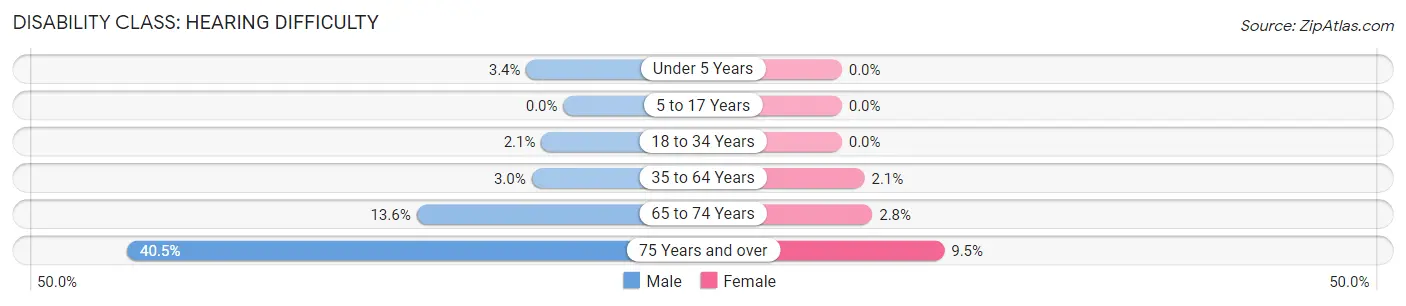
| Age Bracket | Male | Female |
| Under 5 Years | 34 (3.4%) | 0 (0.0%) |
| 5 to 17 Years | 0 (0.0%) | 0 (0.0%) |
| 18 to 34 Years | 72 (2.1%) | 0 (0.0%) |
| 35 to 64 Years | 181 (2.9%) | 132 (2.1%) |
| 65 to 74 Years | 272 (13.6%) | 62 (2.8%) |
| 75 Years and over | 564 (40.5%) | 183 (9.5%) |
Disability Class: Vision Difficulty
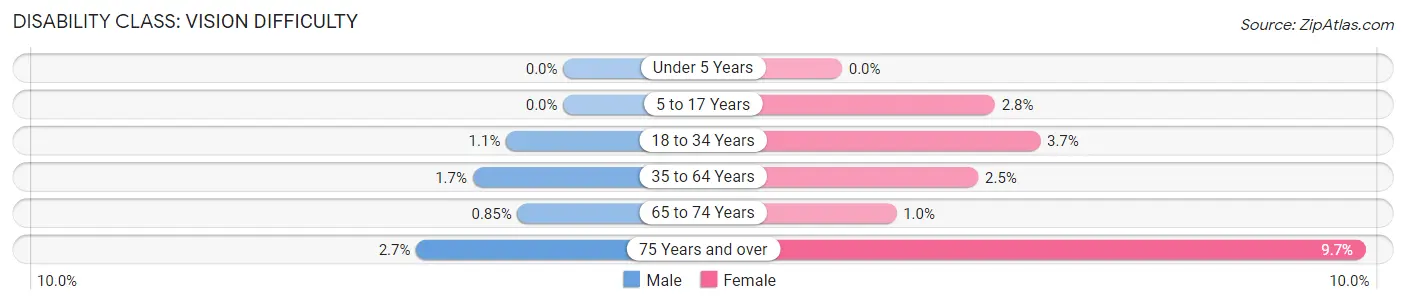
| Age Bracket | Male | Female |
| Under 5 Years | 0 (0.0%) | 0 (0.0%) |
| 5 to 17 Years | 0 (0.0%) | 77 (2.8%) |
| 18 to 34 Years | 37 (1.1%) | 142 (3.7%) |
| 35 to 64 Years | 103 (1.7%) | 158 (2.5%) |
| 65 to 74 Years | 17 (0.9%) | 22 (1.0%) |
| 75 Years and over | 38 (2.7%) | 187 (9.7%) |
Disability Class: Cognitive Difficulty
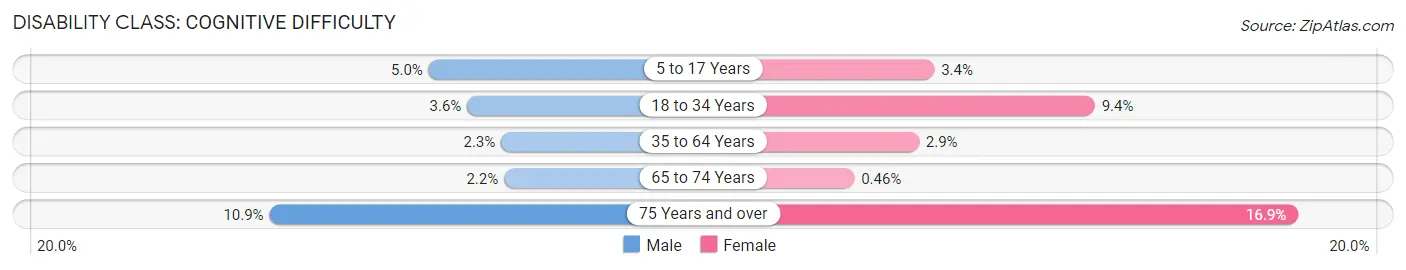
| Age Bracket | Male | Female |
| 5 to 17 Years | 149 (5.0%) | 93 (3.4%) |
| 18 to 34 Years | 125 (3.6%) | 362 (9.4%) |
| 35 to 64 Years | 142 (2.3%) | 179 (2.9%) |
| 65 to 74 Years | 44 (2.2%) | 10 (0.5%) |
| 75 Years and over | 152 (10.9%) | 326 (16.9%) |
Disability Class: Ambulatory Difficulty
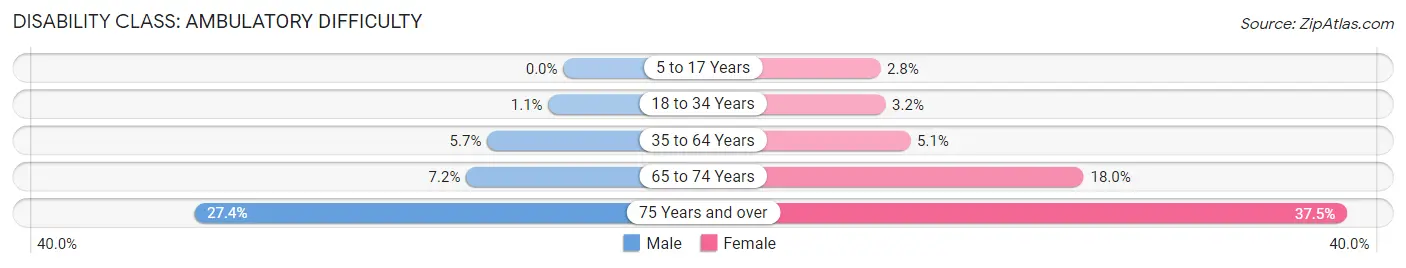
| Age Bracket | Male | Female |
| 5 to 17 Years | 0 (0.0%) | 77 (2.8%) |
| 18 to 34 Years | 39 (1.1%) | 124 (3.2%) |
| 35 to 64 Years | 347 (5.7%) | 317 (5.1%) |
| 65 to 74 Years | 144 (7.2%) | 393 (17.9%) |
| 75 Years and over | 382 (27.4%) | 722 (37.5%) |
Disability Class: Self-Care Difficulty
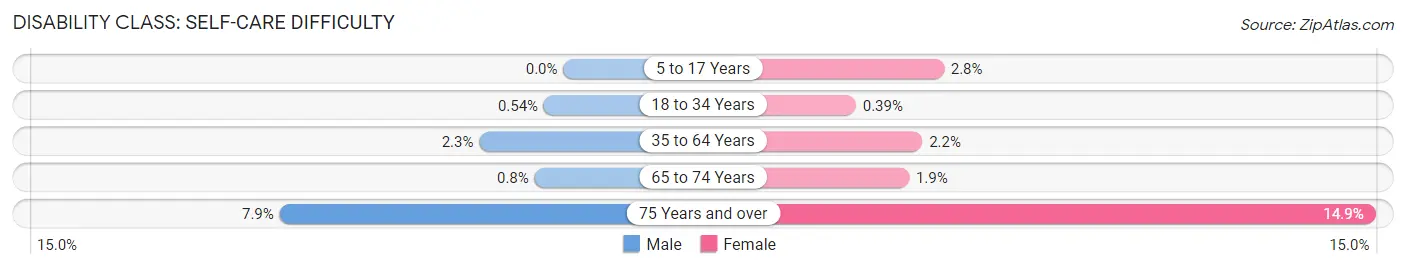
| Age Bracket | Male | Female |
| 5 to 17 Years | 0 (0.0%) | 77 (2.8%) |
| 18 to 34 Years | 19 (0.5%) | 15 (0.4%) |
| 35 to 64 Years | 144 (2.3%) | 140 (2.2%) |
| 65 to 74 Years | 16 (0.8%) | 41 (1.9%) |
| 75 Years and over | 110 (7.9%) | 286 (14.9%) |
Technology Access in Washington County
Computing Device Access in Washington County
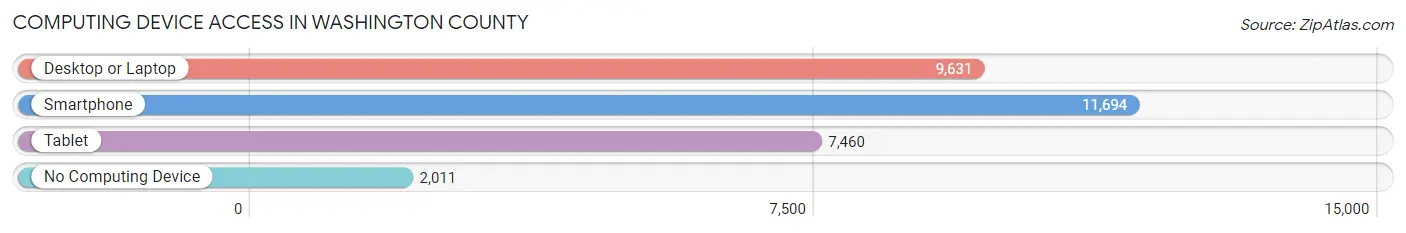
| Device Type | # Households | % Households |
| Desktop or Laptop | 9,631 | 66.5% |
| Smartphone | 11,694 | 80.7% |
| Tablet | 7,460 | 51.5% |
| No Computing Device | 2,011 | 13.9% |
| Total | 14,482 | 100.0% |
Internet Access in Washington County
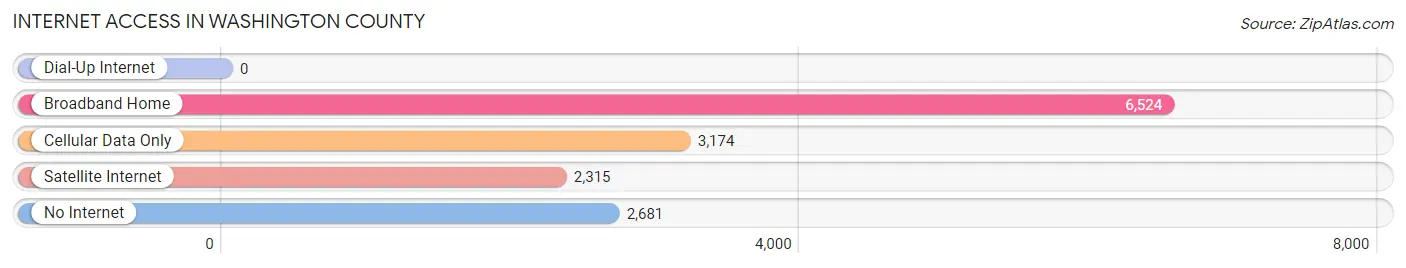
| Internet Type | # Households | % Households |
| Dial-Up Internet | 0 | 0.0% |
| Broadband Home | 6,524 | 45.1% |
| Cellular Data Only | 3,174 | 21.9% |
| Satellite Internet | 2,315 | 16.0% |
| No Internet | 2,681 | 18.5% |
| Total | 14,482 | 100.0% |
Washington County Summary
Introduction
Washington County is located in the state of Texas, in the United States of America. It is one of the 254 counties in the state and is part of the Austin-Round Rock Metropolitan Statistical Area. The county seat is Brenham, and the county has a population of approximately 33,000 people. The county is named after George Washington, the first president of the United States.
History
Washington County was established in 1835, when Texas was still part of Mexico. The county was named after George Washington, the first president of the United States. The county was originally part of the Municipality of Viesca, which was created in 1834. The county was organized in 1837, and the first county seat was located in Washington-on-the-Brazos. In 1844, the county seat was moved to Brenham, which is the current county seat.
The county was home to several Native American tribes, including the Tonkawa, Comanche, and Apache. The first European settlers arrived in the area in the early 1800s, and the county was officially organized in 1837.
Geography
Washington County is located in the southeastern part of Texas, and is bordered by Austin, Brazos, Burleson, Grimes, and Waller counties. The county covers an area of 890 square miles, and is mostly rural. The terrain is mostly flat, with some rolling hills in the northern part of the county. The county is part of the Brazos River watershed, and the main rivers in the county are the Brazos and Navasota Rivers.
The county is home to several state parks, including Washington-on-the-Brazos State Historic Site, Lake Somerville State Park, and Stephen F. Austin State Park. The county also has several lakes, including Lake Somerville, Lake Limestone, and Lake Washington.
Economy
The economy of Washington County is largely based on agriculture and manufacturing. The county is home to several large farms, and the main crops grown in the county are cotton, corn, soybeans, and wheat. The county is also home to several manufacturing companies, including a large poultry processing plant.
The county is also home to several tourist attractions, including the Washington-on-the-Brazos State Historic Site, the Brenham Heritage Museum, and the Washington County Fair.
Demographics
As of the 2010 census, the population of Washington County was 33,098. The population is mostly white (83.3%), with a small African American population (10.2%) and a small Hispanic population (4.7%). The median household income in the county is $45,845, and the median age is 40.
Conclusion
Washington County is a rural county located in the southeastern part of Texas. The county is named after George Washington, the first president of the United States, and was established in 1835. The economy of the county is largely based on agriculture and manufacturing, and the county is home to several tourist attractions. The population of the county is mostly white, with a small African American and Hispanic population.
Common Questions
What is Per Capita Income in Washington County?
Per Capita income in Washington County is $39,147.
What is the Median Family Income in Washington County?
Median Family Income in Washington County is $86,183.
What is the Median Household income in Washington County?
Median Household Income in Washington County is $70,043.
What is Income or Wage Gap in Washington County?
Income or Wage Gap in Washington County is 29.6%.
Women in Washington County earn 70.4 cents for every dollar earned by a man.
What is Family Income Deficit in Washington County?
Family Income Deficit in Washington County is $9,380.
Families that are below poverty line in Washington County earn $9,380 less on average than the poverty threshold level.
What is Inequality or Gini Index in Washington County?
Inequality or Gini Index in Washington County is 0.49.
What is the Total Population of Washington County?
Total Population of Washington County is 35,807.
What is the Total Male Population of Washington County?
Total Male Population of Washington County is 17,609.
What is the Total Female Population of Washington County?
Total Female Population of Washington County is 18,198.
What is the Ratio of Males per 100 Females in Washington County?
There are 96.76 Males per 100 Females in Washington County.
What is the Ratio of Females per 100 Males in Washington County?
There are 103.34 Females per 100 Males in Washington County.
What is the Median Population Age in Washington County?
Median Population Age in Washington County is 41.9 Years.
What is the Average Family Size in Washington County
Average Family Size in Washington County is 3.0 People.
What is the Average Household Size in Washington County
Average Household Size in Washington County is 2.3 People.
How Large is the Labor Force in Washington County?
There are 17,109 People in the Labor Forcein in Washington County.
What is the Percentage of People in the Labor Force in Washington County?
58.5% of People are in the Labor Force in Washington County.
What is the Unemployment Rate in Washington County?
Unemployment Rate in Washington County is 2.7%.