Walker County, TX Map & Demographics
Walker County Map
Walker County Overview
$23,220
PER CAPITA INCOME
$70,169
AVG FAMILY INCOME
$47,193
AVG HOUSEHOLD INCOME
27.1%
WAGE / INCOME GAP [ % ]
72.9¢/ $1
WAGE / INCOME GAP [ $ ]
$12,467
FAMILY INCOME DEFICIT
0.47
INEQUALITY / GINI INDEX
77,182
TOTAL POPULATION
45,638
MALE POPULATION
31,544
FEMALE POPULATION
144.68
MALES / 100 FEMALES
69.12
FEMALES / 100 MALES
36.5
MEDIAN AGE
3.3
AVG FAMILY SIZE
2.5
AVG HOUSEHOLD SIZE
31,375
LABOR FORCE [ PEOPLE ]
46.5%
PERCENT IN LABOR FORCE
7.0%
UNEMPLOYMENT RATE
Walker County Area Codes
Income in Walker County
Income Overview in Walker County
Per Capita Income in Walker County is $23,220, while median incomes of families and households are $70,169 and $47,193 respectively.
| Characteristic | Number | Measure |
| Per Capita Income | 77,182 | $23,220 |
| Median Family Income | 13,561 | $70,169 |
| Mean Family Income | 13,561 | $86,354 |
| Median Household Income | 24,592 | $47,193 |
| Mean Household Income | 24,592 | $65,076 |
| Income Deficit | 13,561 | $12,467 |
| Wage / Income Gap (%) | 77,182 | 27.13% |
| Wage / Income Gap ($) | 77,182 | 72.87¢ per $1 |
| Gini / Inequality Index | 77,182 | 0.47 |
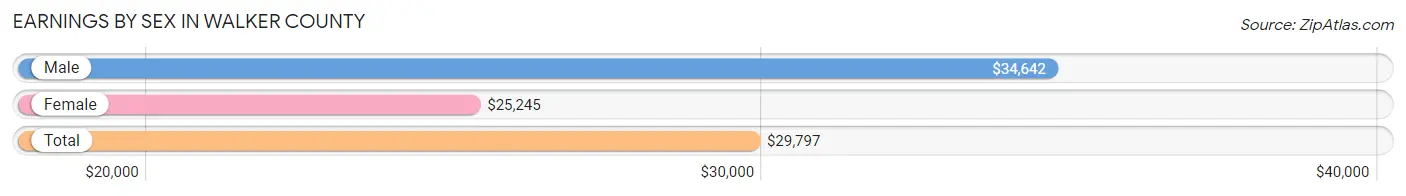
Earnings by Sex in Walker County
Average Earnings in Walker County are $29,797, $34,642 for men and $25,245 for women, a difference of 27.1%.
| Sex | Number | Average Earnings |
| Male | 19,943 (58.9%) | $34,642 |
| Female | 13,900 (41.1%) | $25,245 |
| Total | 33,843 (100.0%) | $29,797 |
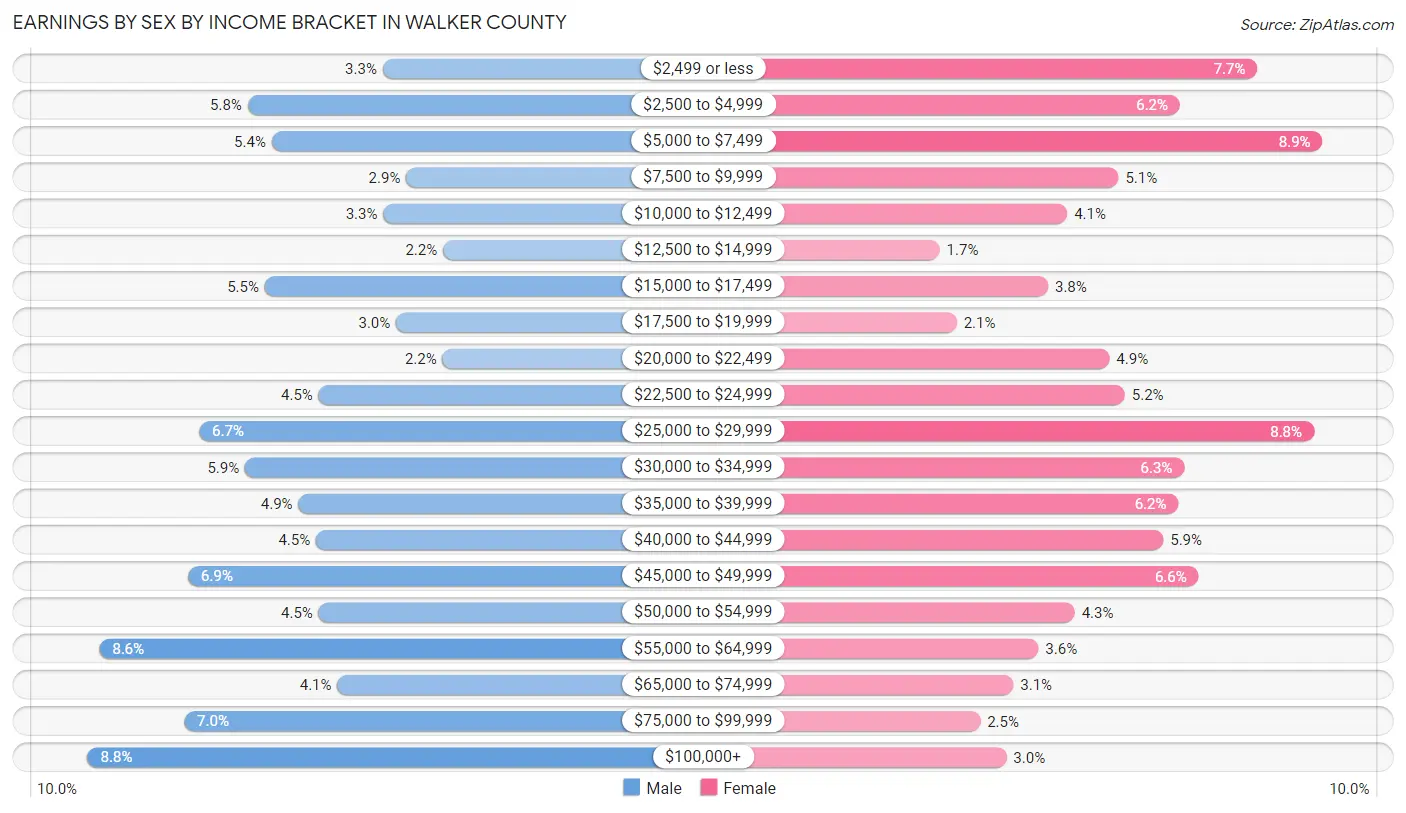
Earnings by Sex by Income Bracket in Walker County
The most common earnings brackets in Walker County are $100,000+ for men (1,759 | 8.8%) and $5,000 to $7,499 for women (1,238 | 8.9%).
| Income | Male | Female |
| $2,499 or less | 657 (3.3%) | 1,069 (7.7%) |
| $2,500 to $4,999 | 1,161 (5.8%) | 867 (6.2%) |
| $5,000 to $7,499 | 1,071 (5.4%) | 1,238 (8.9%) |
| $7,500 to $9,999 | 568 (2.9%) | 707 (5.1%) |
| $10,000 to $12,499 | 655 (3.3%) | 574 (4.1%) |
| $12,500 to $14,999 | 430 (2.2%) | 242 (1.7%) |
| $15,000 to $17,499 | 1,097 (5.5%) | 524 (3.8%) |
| $17,500 to $19,999 | 607 (3.0%) | 286 (2.1%) |
| $20,000 to $22,499 | 432 (2.2%) | 684 (4.9%) |
| $22,500 to $24,999 | 895 (4.5%) | 724 (5.2%) |
| $25,000 to $29,999 | 1,342 (6.7%) | 1,216 (8.7%) |
| $30,000 to $34,999 | 1,170 (5.9%) | 878 (6.3%) |
| $35,000 to $39,999 | 972 (4.9%) | 863 (6.2%) |
| $40,000 to $44,999 | 906 (4.5%) | 824 (5.9%) |
| $45,000 to $49,999 | 1,385 (6.9%) | 916 (6.6%) |
| $50,000 to $54,999 | 896 (4.5%) | 593 (4.3%) |
| $55,000 to $64,999 | 1,716 (8.6%) | 499 (3.6%) |
| $65,000 to $74,999 | 826 (4.1%) | 433 (3.1%) |
| $75,000 to $99,999 | 1,398 (7.0%) | 348 (2.5%) |
| $100,000+ | 1,759 (8.8%) | 415 (3.0%) |
| Total | 19,943 (100.0%) | 13,900 (100.0%) |
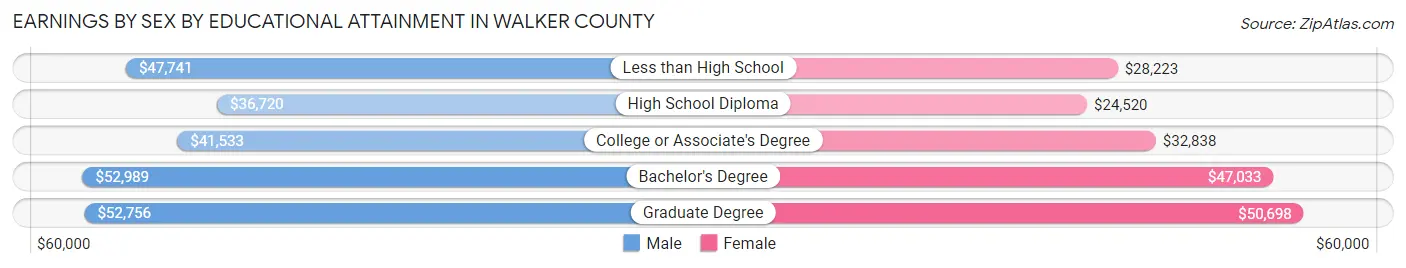
Earnings by Sex by Educational Attainment in Walker County
Average earnings in Walker County are $45,119 for men and $34,341 for women, a difference of 23.9%. Men with an educational attainment of bachelor's degree enjoy the highest average annual earnings of $52,989, while those with high school diploma education earn the least with $36,720. Women with an educational attainment of graduate degree earn the most with the average annual earnings of $50,698, while those with high school diploma education have the smallest earnings of $24,520.
| Educational Attainment | Male Income | Female Income |
| Less than High School | $47,741 | $28,223 |
| High School Diploma | $36,720 | $24,520 |
| College or Associate's Degree | $41,533 | $32,838 |
| Bachelor's Degree | $52,989 | $47,033 |
| Graduate Degree | $52,756 | $50,698 |
| Total | $45,119 | $34,341 |
Family Income in Walker County
Family Income Brackets in Walker County
According to the Walker County family income data, there are 2,861 families falling into the $50,000 to $74,999 income range, which is the most common income bracket and makes up 21.1% of all families. Conversely, the $10,000 to $14,999 income bracket is the least frequent group with only 325 families (2.4%) belonging to this category.
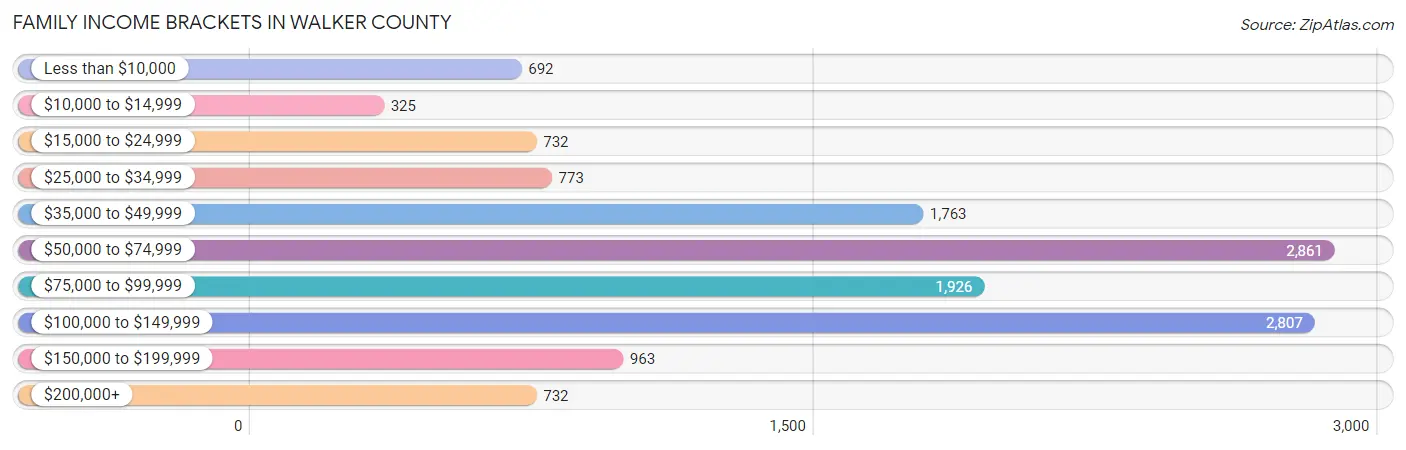
| Income Bracket | # Families | % Families |
| Less than $10,000 | 692 | 5.1% |
| $10,000 to $14,999 | 325 | 2.4% |
| $15,000 to $24,999 | 732 | 5.4% |
| $25,000 to $34,999 | 773 | 5.7% |
| $35,000 to $49,999 | 1,763 | 13.0% |
| $50,000 to $74,999 | 2,861 | 21.1% |
| $75,000 to $99,999 | 1,926 | 14.2% |
| $100,000 to $149,999 | 2,807 | 20.7% |
| $150,000 to $199,999 | 963 | 7.1% |
| $200,000+ | 732 | 5.4% |
Family Income by Famaliy Size in Walker County
6-person families (384 | 2.8%) account for the highest median family income in Walker County with $95,346 per family, while 2-person families (6,378 | 47.0%) have the highest median income of $33,145 per family member.
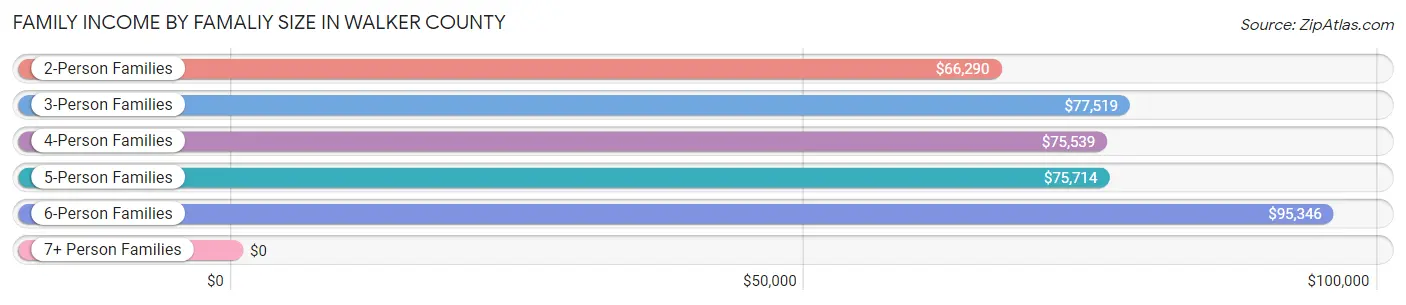
| Income Bracket | # Families | Median Income |
| 2-Person Families | 6,378 (47.0%) | $66,290 |
| 3-Person Families | 2,759 (20.3%) | $77,519 |
| 4-Person Families | 2,398 (17.7%) | $75,539 |
| 5-Person Families | 1,520 (11.2%) | $75,714 |
| 6-Person Families | 384 (2.8%) | $95,346 |
| 7+ Person Families | 122 (0.9%) | $0 |
| Total | 13,561 (100.0%) | $70,169 |
Family Income by Number of Earners in Walker County
The median family income in Walker County is $70,169, with families comprising 3+ earners (775) having the highest median family income of $123,088, while families with no earners (2,545) have the lowest median family income of $38,523, accounting for 5.7% and 18.8% of families, respectively.
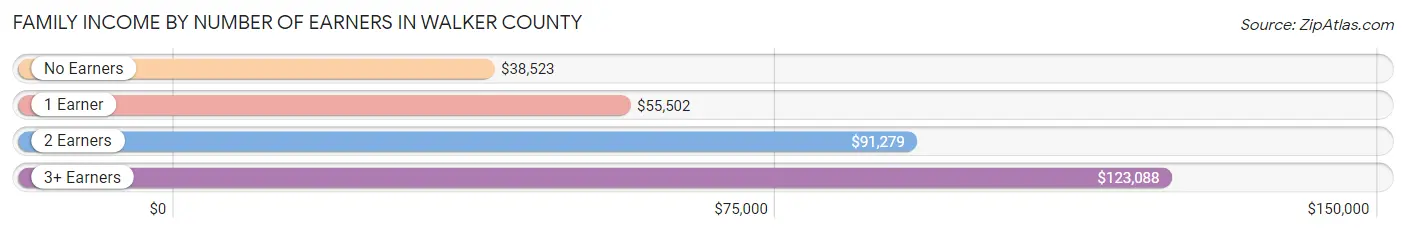
| Number of Earners | # Families | Median Income |
| No Earners | 2,545 (18.8%) | $38,523 |
| 1 Earner | 5,234 (38.6%) | $55,502 |
| 2 Earners | 5,007 (36.9%) | $91,279 |
| 3+ Earners | 775 (5.7%) | $123,088 |
| Total | 13,561 (100.0%) | $70,169 |
Household Income in Walker County
Household Income Brackets in Walker County
With 4,131 households falling in the category, the $50,000 to $74,999 income range is the most frequent in Walker County, accounting for 16.8% of all households. In contrast, only 812 households (3.3%) fall into the $200,000+ income bracket, making it the least populous group.
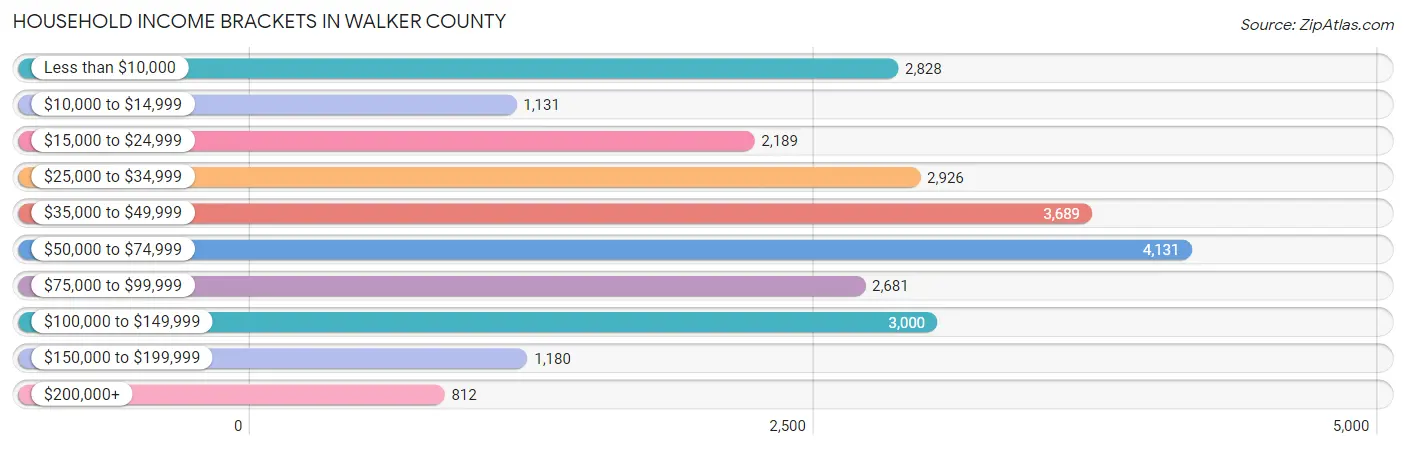
| Income Bracket | # Households | % Households |
| Less than $10,000 | 2,828 | 11.5% |
| $10,000 to $14,999 | 1,131 | 4.6% |
| $15,000 to $24,999 | 2,189 | 8.9% |
| $25,000 to $34,999 | 2,926 | 11.9% |
| $35,000 to $49,999 | 3,689 | 15.0% |
| $50,000 to $74,999 | 4,131 | 16.8% |
| $75,000 to $99,999 | 2,681 | 10.9% |
| $100,000 to $149,999 | 3,000 | 12.2% |
| $150,000 to $199,999 | 1,180 | 4.8% |
| $200,000+ | 812 | 3.3% |
Household Income by Householder Age in Walker County
The median household income in Walker County is $47,193, with the highest median household income of $65,600 found in the 45 to 64 years age bracket for the primary householder. A total of 7,650 households (31.1%) fall into this category. Meanwhile, the 15 to 24 years age bracket for the primary householder has the lowest median household income of $11,536, with 3,639 households (14.8%) in this group.
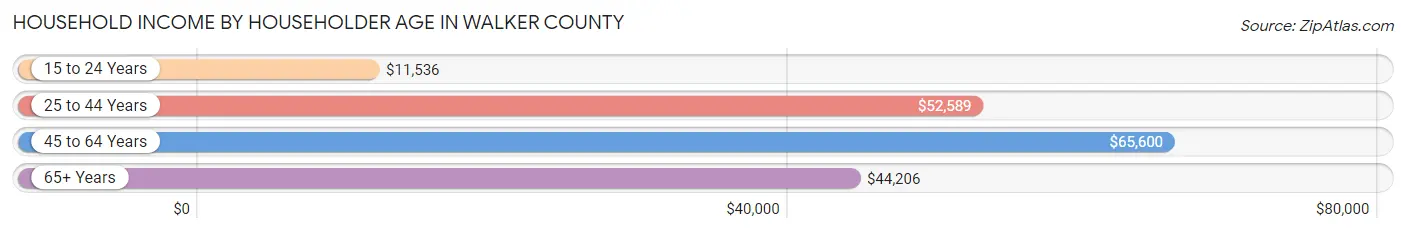
| Income Bracket | # Households | Median Income |
| 15 to 24 Years | 3,639 (14.8%) | $11,536 |
| 25 to 44 Years | 7,012 (28.5%) | $52,589 |
| 45 to 64 Years | 7,650 (31.1%) | $65,600 |
| 65+ Years | 6,291 (25.6%) | $44,206 |
| Total | 24,592 (100.0%) | $47,193 |
Poverty in Walker County
Income Below Poverty by Sex and Age in Walker County
With 15.1% poverty level for males and 24.2% for females among the residents of Walker County, 18 to 24 year old males and 18 to 24 year old females are the most vulnerable to poverty, with 1,959 males (35.7%) and 3,387 females (61.5%) in their respective age groups living below the poverty level.
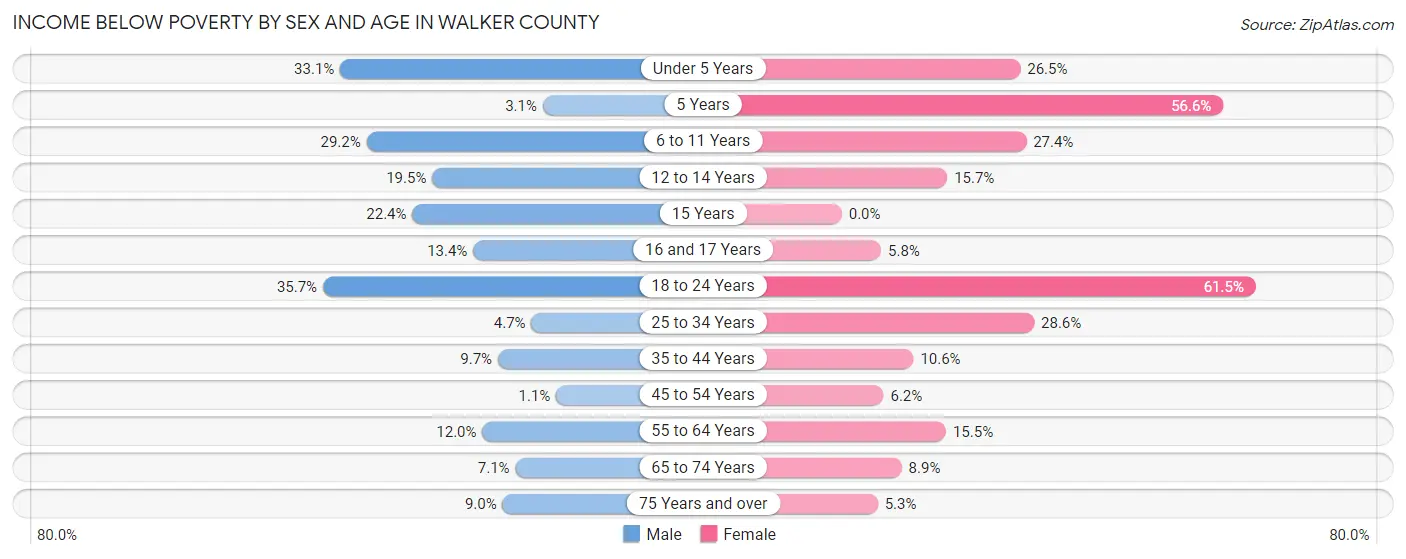
| Age Bracket | Male | Female |
| Under 5 Years | 571 (33.1%) | 339 (26.5%) |
| 5 Years | 9 (3.0%) | 111 (56.6%) |
| 6 to 11 Years | 549 (29.2%) | 520 (27.4%) |
| 12 to 14 Years | 192 (19.5%) | 128 (15.7%) |
| 15 Years | 87 (22.4%) | 0 (0.0%) |
| 16 and 17 Years | 83 (13.4%) | 28 (5.8%) |
| 18 to 24 Years | 1,959 (35.7%) | 3,387 (61.5%) |
| 25 to 34 Years | 242 (4.7%) | 1,038 (28.6%) |
| 35 to 44 Years | 376 (9.7%) | 355 (10.6%) |
| 45 to 54 Years | 44 (1.1%) | 177 (6.2%) |
| 55 to 64 Years | 348 (12.0%) | 578 (15.5%) |
| 65 to 74 Years | 190 (7.1%) | 259 (8.9%) |
| 75 Years and over | 148 (9.0%) | 123 (5.3%) |
| Total | 4,798 (15.1%) | 7,043 (24.2%) |
Income Above Poverty by Sex and Age in Walker County
According to the poverty statistics in Walker County, males aged 45 to 54 years and females aged 15 years are the age groups that are most secure financially, with 98.9% of males and 100.0% of females in these age groups living above the poverty line.
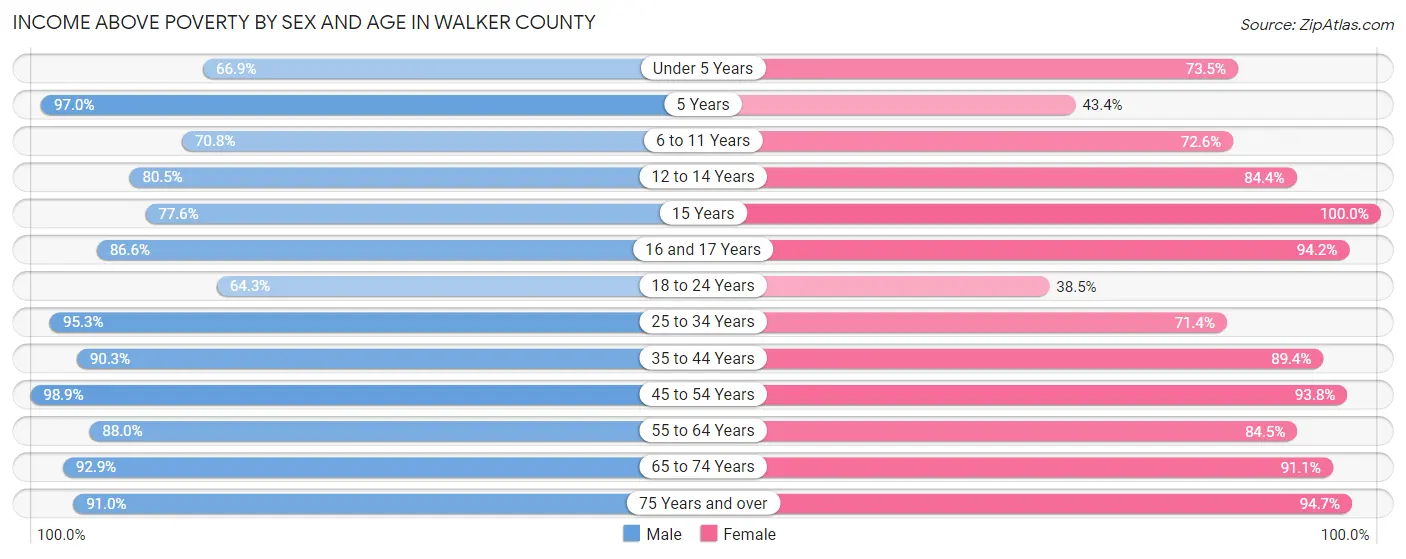
| Age Bracket | Male | Female |
| Under 5 Years | 1,152 (66.9%) | 940 (73.5%) |
| 5 Years | 286 (97.0%) | 85 (43.4%) |
| 6 to 11 Years | 1,330 (70.8%) | 1,379 (72.6%) |
| 12 to 14 Years | 794 (80.5%) | 690 (84.4%) |
| 15 Years | 301 (77.6%) | 174 (100.0%) |
| 16 and 17 Years | 537 (86.6%) | 452 (94.2%) |
| 18 to 24 Years | 3,529 (64.3%) | 2,124 (38.5%) |
| 25 to 34 Years | 4,867 (95.3%) | 2,597 (71.4%) |
| 35 to 44 Years | 3,497 (90.3%) | 2,980 (89.4%) |
| 45 to 54 Years | 4,101 (98.9%) | 2,678 (93.8%) |
| 55 to 64 Years | 2,545 (88.0%) | 3,159 (84.5%) |
| 65 to 74 Years | 2,480 (92.9%) | 2,655 (91.1%) |
| 75 Years and over | 1,491 (91.0%) | 2,186 (94.7%) |
| Total | 26,910 (84.9%) | 22,099 (75.8%) |
Income Below Poverty Among Married-Couple Families in Walker County
The poverty statistics for married-couple families in Walker County show that 3.9% or 365 of the total 9,429 families live below the poverty line. Families with 5 or more children have the highest poverty rate of 37.8%, comprising of 28 families. On the other hand, families with 1 or 2 children have the lowest poverty rate of 1.3%, which includes 41 families.
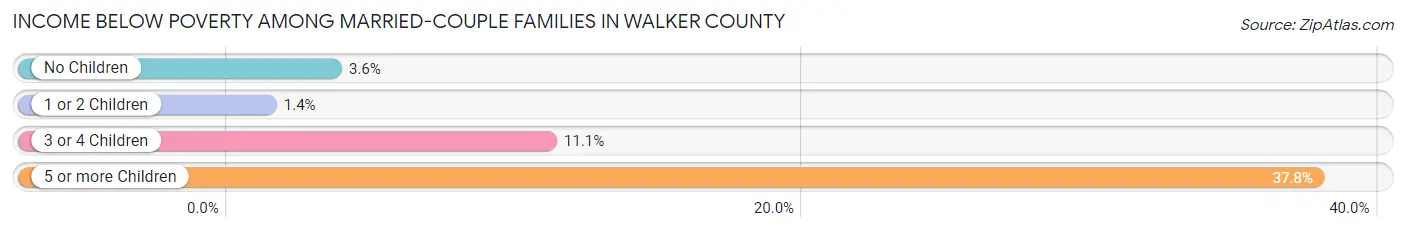
| Children | Above Poverty | Below Poverty |
| No Children | 5,216 (96.4%) | 196 (3.6%) |
| 1 or 2 Children | 3,002 (98.7%) | 41 (1.3%) |
| 3 or 4 Children | 800 (88.9%) | 100 (11.1%) |
| 5 or more Children | 46 (62.2%) | 28 (37.8%) |
| Total | 9,064 (96.1%) | 365 (3.9%) |
Income Below Poverty Among Single-Parent Households in Walker County
According to the poverty data in Walker County, 7.6% or 87 single-father households and 34.7% or 1,038 single-mother households are living below the poverty line. Among single-father households, those with 5 or more children have the highest poverty rate, with 2 households (40.0%) experiencing poverty. Likewise, among single-mother households, those with 1 or 2 children have the highest poverty rate, with 596 households (56.8%) falling below the poverty line.
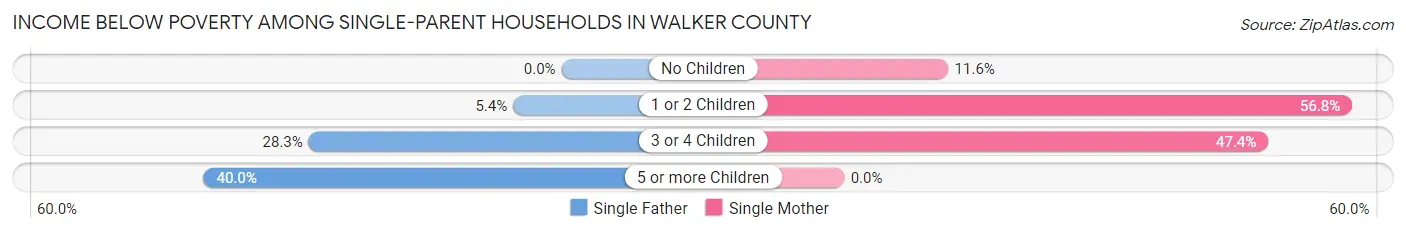
| Children | Single Father | Single Mother |
| No Children | 0 (0.0%) | 156 (11.6%) |
| 1 or 2 Children | 20 (5.4%) | 596 (56.8%) |
| 3 or 4 Children | 65 (28.3%) | 286 (47.4%) |
| 5 or more Children | 2 (40.0%) | 0 (0.0%) |
| Total | 87 (7.6%) | 1,038 (34.7%) |
Income Below Poverty Among Married-Couple vs Single-Parent Households in Walker County
The poverty data for Walker County shows that 365 of the married-couple family households (3.9%) and 1,125 of the single-parent households (27.2%) are living below the poverty level. Within the married-couple family households, those with 5 or more children have the highest poverty rate, with 28 households (37.8%) falling below the poverty line. Among the single-parent households, those with 1 or 2 children have the highest poverty rate, with 616 household (43.4%) living below poverty.
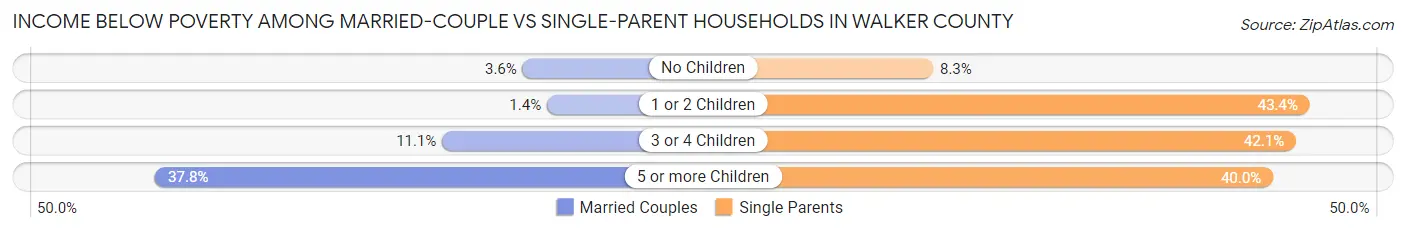
| Children | Married-Couple Families | Single-Parent Households |
| No Children | 196 (3.6%) | 156 (8.3%) |
| 1 or 2 Children | 41 (1.3%) | 616 (43.4%) |
| 3 or 4 Children | 100 (11.1%) | 351 (42.1%) |
| 5 or more Children | 28 (37.8%) | 2 (40.0%) |
| Total | 365 (3.9%) | 1,125 (27.2%) |
Race in Walker County
The most populous races in Walker County are White / Caucasian (50,079 | 64.9%), Black / African American (16,916 | 21.9%), and Hispanic or Latino (14,226 | 18.4%).
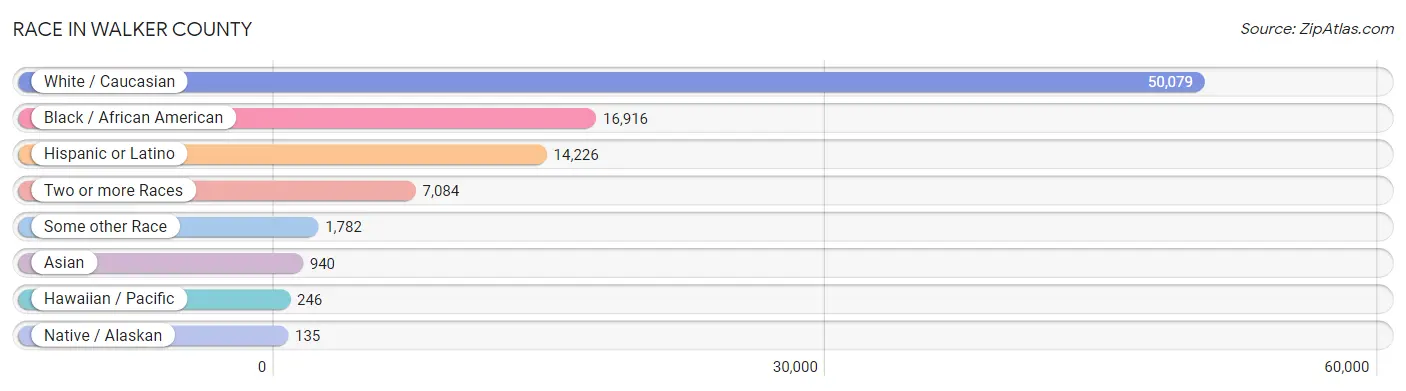
| Race | # Population | % Population |
| Asian | 940 | 1.2% |
| Black / African American | 16,916 | 21.9% |
| Hawaiian / Pacific | 246 | 0.3% |
| Hispanic or Latino | 14,226 | 18.4% |
| Native / Alaskan | 135 | 0.2% |
| White / Caucasian | 50,079 | 64.9% |
| Two or more Races | 7,084 | 9.2% |
| Some other Race | 1,782 | 2.3% |
| Total | 77,182 | 100.0% |
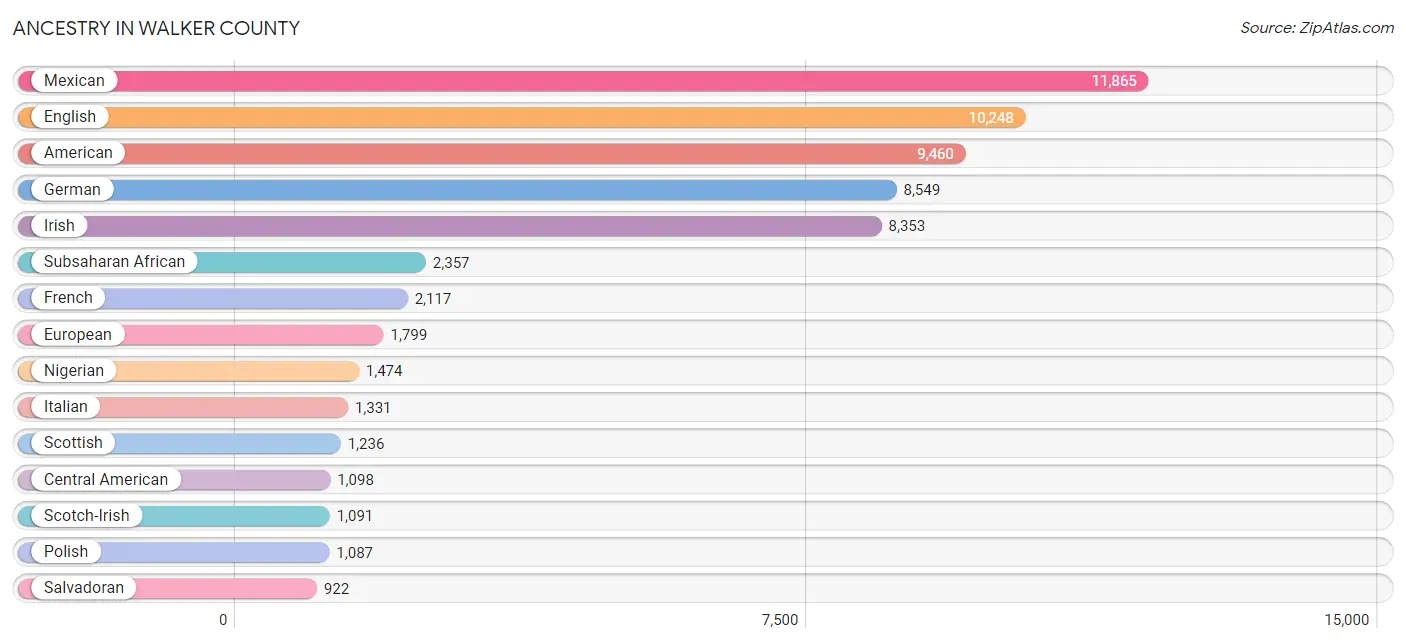
Ancestry in Walker County
The most populous ancestries reported in Walker County are Mexican (11,865 | 15.4%), English (10,248 | 13.3%), American (9,460 | 12.3%), German (8,549 | 11.1%), and Irish (8,353 | 10.8%), together accounting for 62.8% of all Walker County residents.
| Ancestry | # Population | % Population |
| African | 659 | 0.9% |
| American | 9,460 | 12.3% |
| Apache | 51 | 0.1% |
| Arab | 69 | 0.1% |
| Argentinean | 22 | 0.0% |
| Austrian | 12 | 0.0% |
| Bahamian | 5 | 0.0% |
| Belgian | 32 | 0.0% |
| Belizean | 20 | 0.0% |
| Bhutanese | 110 | 0.1% |
| Blackfeet | 16 | 0.0% |
| Brazilian | 6 | 0.0% |
| British | 215 | 0.3% |
| Burmese | 35 | 0.1% |
| Cajun | 30 | 0.0% |
| Cambodian | 23 | 0.0% |
| Canadian | 23 | 0.0% |
| Central American | 1,098 | 1.4% |
| Central American Indian | 19 | 0.0% |
| Cherokee | 394 | 0.5% |
| Chickasaw | 7 | 0.0% |
| Choctaw | 288 | 0.4% |
| Colombian | 37 | 0.1% |
| Comanche | 40 | 0.1% |
| Costa Rican | 6 | 0.0% |
| Cree | 15 | 0.0% |
| Cuban | 19 | 0.0% |
| Czech | 550 | 0.7% |
| Czechoslovakian | 9 | 0.0% |
| Danish | 81 | 0.1% |
| Dominican | 5 | 0.0% |
| Dutch | 238 | 0.3% |
| Eastern European | 54 | 0.1% |
| Ecuadorian | 55 | 0.1% |
| Egyptian | 17 | 0.0% |
| English | 10,248 | 13.3% |
| European | 1,799 | 2.3% |
| Finnish | 40 | 0.1% |
| French | 2,117 | 2.7% |
| French Canadian | 239 | 0.3% |
| German | 8,549 | 11.1% |
| Ghanaian | 22 | 0.0% |
| Greek | 104 | 0.1% |
| Guatemalan | 66 | 0.1% |
| Haitian | 78 | 0.1% |
| Honduran | 86 | 0.1% |
| Hungarian | 121 | 0.2% |
| Indian (Asian) | 181 | 0.2% |
| Irish | 8,353 | 10.8% |
| Israeli | 3 | 0.0% |
| Italian | 1,331 | 1.7% |
| Jamaican | 7 | 0.0% |
| Japanese | 39 | 0.1% |
| Kenyan | 196 | 0.3% |
| Korean | 204 | 0.3% |
| Lebanese | 19 | 0.0% |
| Mexican | 11,865 | 15.4% |
| Mexican American Indian | 34 | 0.0% |
| Moroccan | 17 | 0.0% |
| Native Hawaiian | 11 | 0.0% |
| Navajo | 44 | 0.1% |
| Nicaraguan | 18 | 0.0% |
| Nigerian | 1,474 | 1.9% |
| Northern European | 33 | 0.0% |
| Norwegian | 215 | 0.3% |
| Pakistani | 5 | 0.0% |
| Polish | 1,087 | 1.4% |
| Portuguese | 26 | 0.0% |
| Puerto Rican | 215 | 0.3% |
| Romanian | 5 | 0.0% |
| Russian | 146 | 0.2% |
| Salvadoran | 922 | 1.2% |
| Samoan | 225 | 0.3% |
| Scandinavian | 99 | 0.1% |
| Scotch-Irish | 1,091 | 1.4% |
| Scottish | 1,236 | 1.6% |
| Seminole | 2 | 0.0% |
| Serbian | 31 | 0.0% |
| Slovene | 19 | 0.0% |
| Somali | 6 | 0.0% |
| South American | 114 | 0.2% |
| South American Indian | 1 | 0.0% |
| Spaniard | 257 | 0.3% |
| Spanish | 82 | 0.1% |
| Sri Lankan | 250 | 0.3% |
| Subsaharan African | 2,357 | 3.0% |
| Swedish | 213 | 0.3% |
| Syrian | 16 | 0.0% |
| Thai | 195 | 0.3% |
| Tongan | 10 | 0.0% |
| Ukrainian | 13 | 0.0% |
| Welsh | 324 | 0.4% | View All 92 Rows |
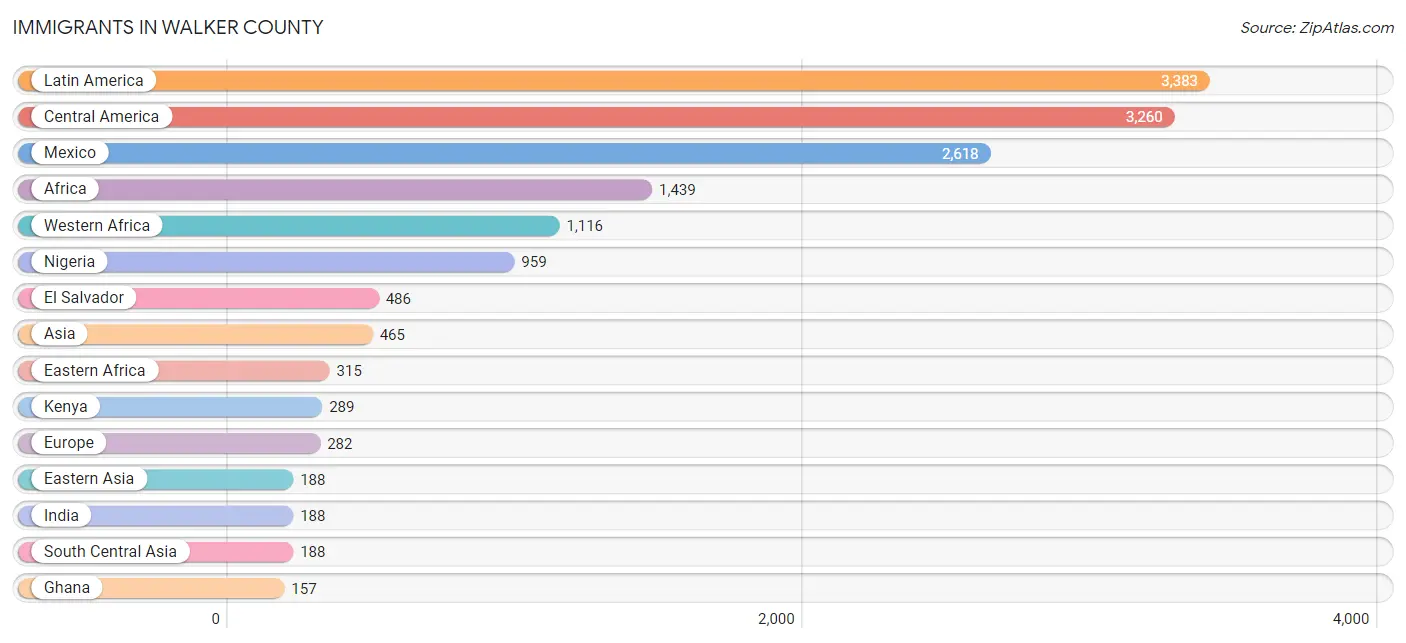
Immigrants in Walker County
The most numerous immigrant groups reported in Walker County came from Latin America (3,383 | 4.4%), Central America (3,260 | 4.2%), Mexico (2,618 | 3.4%), Africa (1,439 | 1.9%), and Western Africa (1,116 | 1.5%), together accounting for 15.3% of all Walker County residents.
| Immigration Origin | # Population | % Population |
| Africa | 1,439 | 1.9% |
| Argentina | 20 | 0.0% |
| Asia | 465 | 0.6% |
| Bahamas | 5 | 0.0% |
| Belize | 20 | 0.0% |
| Brazil | 6 | 0.0% |
| Cambodia | 20 | 0.0% |
| Canada | 13 | 0.0% |
| Caribbean | 73 | 0.1% |
| Central America | 3,260 | 4.2% |
| China | 143 | 0.2% |
| Colombia | 18 | 0.0% |
| Costa Rica | 6 | 0.0% |
| Cuba | 14 | 0.0% |
| Dominican Republic | 5 | 0.0% |
| Eastern Africa | 315 | 0.4% |
| Eastern Asia | 188 | 0.2% |
| Eastern Europe | 84 | 0.1% |
| Ecuador | 6 | 0.0% |
| El Salvador | 486 | 0.6% |
| England | 10 | 0.0% |
| Ethiopia | 1 | 0.0% |
| Europe | 282 | 0.4% |
| France | 22 | 0.0% |
| Germany | 59 | 0.1% |
| Ghana | 157 | 0.2% |
| Guatemala | 16 | 0.0% |
| Honduras | 24 | 0.0% |
| India | 188 | 0.2% |
| Ireland | 43 | 0.1% |
| Jamaica | 49 | 0.1% |
| Japan | 15 | 0.0% |
| Kenya | 289 | 0.4% |
| Korea | 7 | 0.0% |
| Latin America | 3,383 | 4.4% |
| Mexico | 2,618 | 3.4% |
| Morocco | 8 | 0.0% |
| Nicaragua | 90 | 0.1% |
| Nigeria | 959 | 1.2% |
| Northern Africa | 8 | 0.0% |
| Northern Europe | 87 | 0.1% |
| Oceania | 84 | 0.1% |
| Philippines | 15 | 0.0% |
| Russia | 66 | 0.1% |
| Serbia | 16 | 0.0% |
| South America | 50 | 0.1% |
| South Central Asia | 188 | 0.2% |
| South Eastern Asia | 89 | 0.1% |
| Southern Europe | 30 | 0.0% |
| Spain | 30 | 0.0% |
| Taiwan | 15 | 0.0% |
| Ukraine | 2 | 0.0% |
| Vietnam | 54 | 0.1% |
| Western Africa | 1,116 | 1.5% |
| Western Europe | 81 | 0.1% | View All 55 Rows |
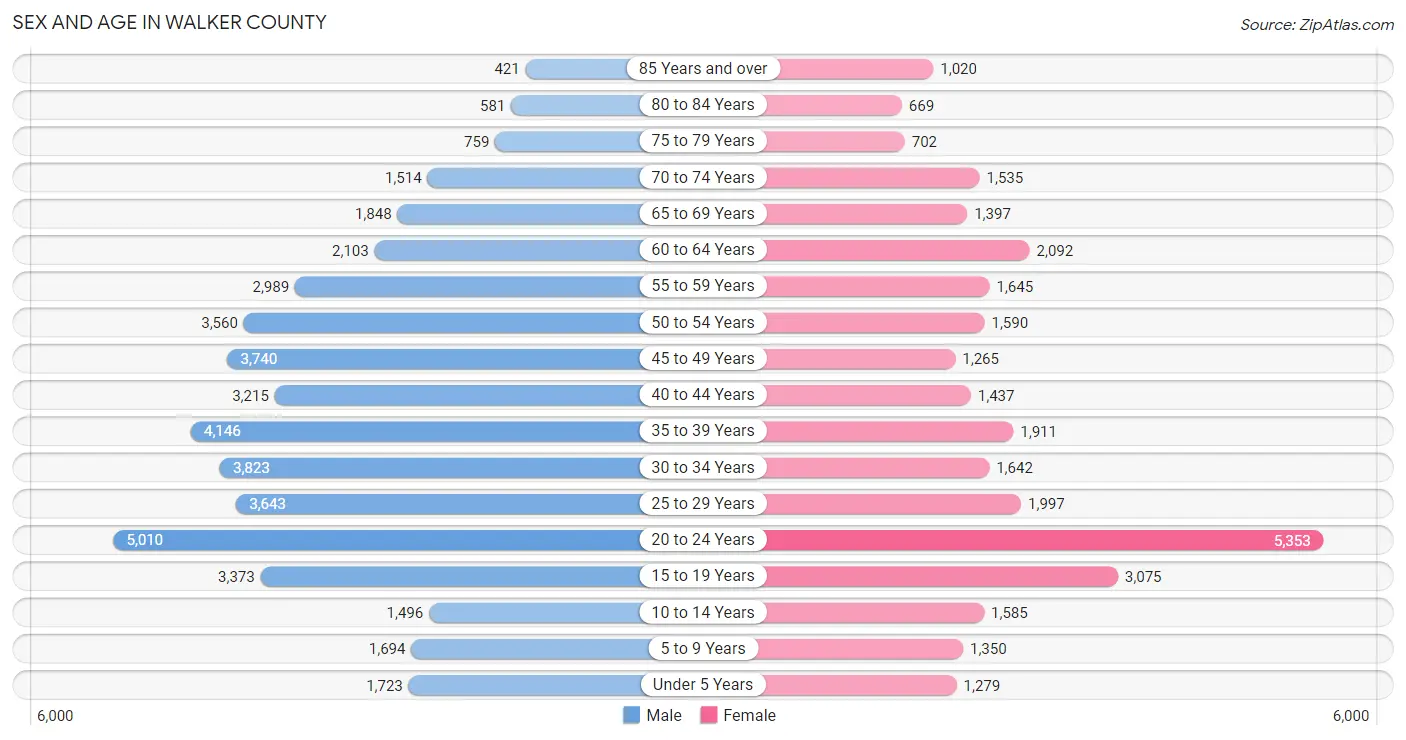
Sex and Age in Walker County
Sex and Age in Walker County
The most populous age groups in Walker County are 20 to 24 Years (5,010 | 11.0%) for men and 20 to 24 Years (5,353 | 17.0%) for women.
| Age Bracket | Male | Female |
| Under 5 Years | 1,723 (3.8%) | 1,279 (4.1%) |
| 5 to 9 Years | 1,694 (3.7%) | 1,350 (4.3%) |
| 10 to 14 Years | 1,496 (3.3%) | 1,585 (5.0%) |
| 15 to 19 Years | 3,373 (7.4%) | 3,075 (9.8%) |
| 20 to 24 Years | 5,010 (11.0%) | 5,353 (17.0%) |
| 25 to 29 Years | 3,643 (8.0%) | 1,997 (6.3%) |
| 30 to 34 Years | 3,823 (8.4%) | 1,642 (5.2%) |
| 35 to 39 Years | 4,146 (9.1%) | 1,911 (6.1%) |
| 40 to 44 Years | 3,215 (7.0%) | 1,437 (4.6%) |
| 45 to 49 Years | 3,740 (8.2%) | 1,265 (4.0%) |
| 50 to 54 Years | 3,560 (7.8%) | 1,590 (5.0%) |
| 55 to 59 Years | 2,989 (6.6%) | 1,645 (5.2%) |
| 60 to 64 Years | 2,103 (4.6%) | 2,092 (6.6%) |
| 65 to 69 Years | 1,848 (4.1%) | 1,397 (4.4%) |
| 70 to 74 Years | 1,514 (3.3%) | 1,535 (4.9%) |
| 75 to 79 Years | 759 (1.7%) | 702 (2.2%) |
| 80 to 84 Years | 581 (1.3%) | 669 (2.1%) |
| 85 Years and over | 421 (0.9%) | 1,020 (3.2%) |
| Total | 45,638 (100.0%) | 31,544 (100.0%) |
Families and Households in Walker County
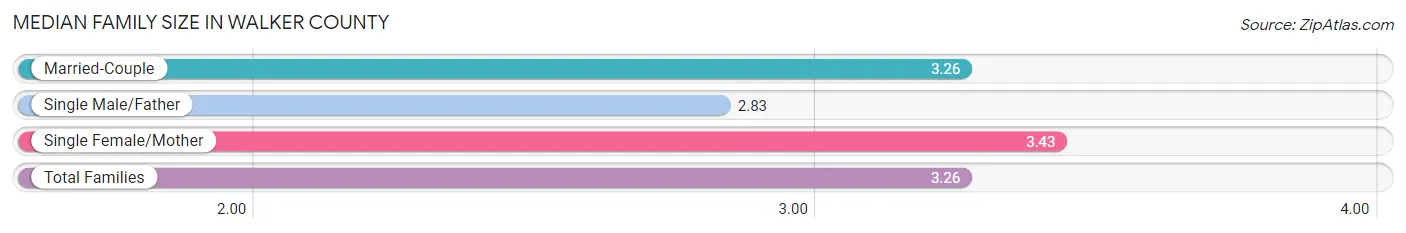
Median Family Size in Walker County
The median family size in Walker County is 3.26 persons per family, with single female/mother families (2,995 | 22.1%) accounting for the largest median family size of 3.43 persons per family. On the other hand, single male/father families (1,137 | 8.4%) represent the smallest median family size with 2.83 persons per family.
| Family Type | # Families | Family Size |
| Married-Couple | 9,429 (69.5%) | 3.26 |
| Single Male/Father | 1,137 (8.4%) | 2.83 |
| Single Female/Mother | 2,995 (22.1%) | 3.43 |
| Total Families | 13,561 (100.0%) | 3.26 |
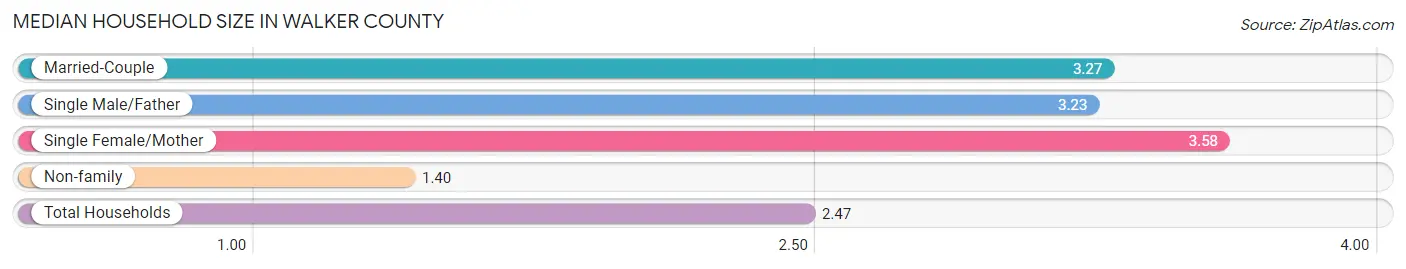
Median Household Size in Walker County
The median household size in Walker County is 2.47 persons per household, with single female/mother households (2,995 | 12.2%) accounting for the largest median household size of 3.58 persons per household. non-family households (11,031 | 44.9%) represent the smallest median household size with 1.40 persons per household.
| Household Type | # Households | Household Size |
| Married-Couple | 9,429 (38.3%) | 3.27 |
| Single Male/Father | 1,137 (4.6%) | 3.23 |
| Single Female/Mother | 2,995 (12.2%) | 3.58 |
| Non-family | 11,031 (44.9%) | 1.40 |
| Total Households | 24,592 (100.0%) | 2.47 |
Household Size by Marriage Status in Walker County
Out of a total of 24,592 households in Walker County, 13,561 (55.1%) are family households, while 11,031 (44.9%) are nonfamily households. The most numerous type of family households are 2-person households, comprising 6,267, and the most common type of nonfamily households are 1-person households, comprising 8,647.
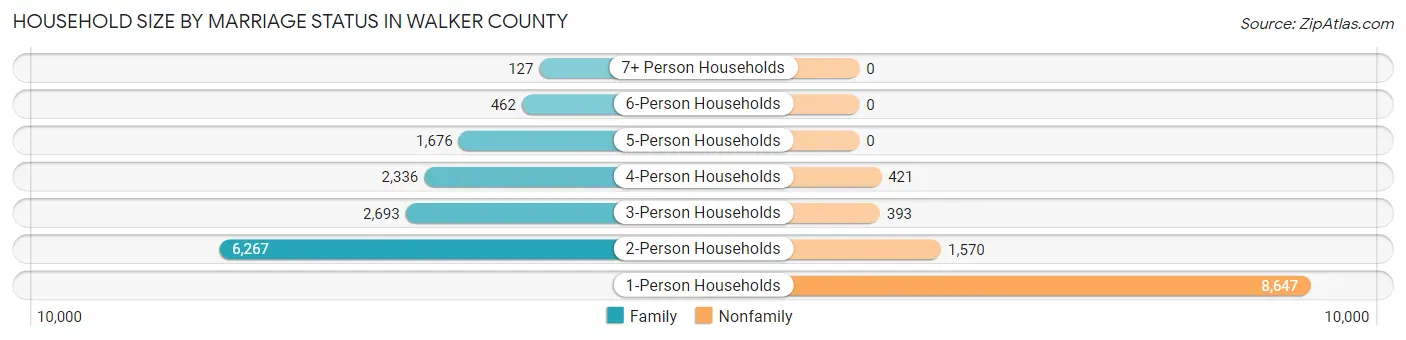
| Household Size | Family Households | Nonfamily Households |
| 1-Person Households | - | 8,647 (35.2%) |
| 2-Person Households | 6,267 (25.5%) | 1,570 (6.4%) |
| 3-Person Households | 2,693 (11.0%) | 393 (1.6%) |
| 4-Person Households | 2,336 (9.5%) | 421 (1.7%) |
| 5-Person Households | 1,676 (6.8%) | 0 (0.0%) |
| 6-Person Households | 462 (1.9%) | 0 (0.0%) |
| 7+ Person Households | 127 (0.5%) | 0 (0.0%) |
| Total | 13,561 (55.1%) | 11,031 (44.9%) |
Female Fertility in Walker County
Fertility by Age in Walker County
Average fertility rate in Walker County is 63.0 births per 1,000 women. Women in the age bracket of 20 to 34 years have the highest fertility rate with 86.0 births per 1,000 women. Women in the age bracket of 20 to 34 years acount for 71.4% of all women with births.
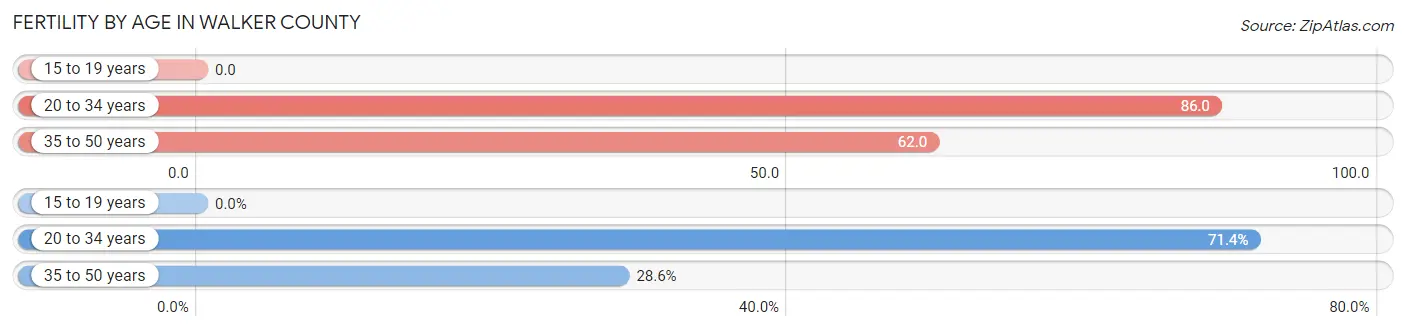
| Age Bracket | Women with Births | Births / 1,000 Women |
| 15 to 19 years | 0 (0.0%) | 0.0 |
| 20 to 34 years | 774 (71.4%) | 86.0 |
| 35 to 50 years | 310 (28.6%) | 62.0 |
| Total | 1,084 (100.0%) | 63.0 |
Fertility by Age by Marriage Status in Walker County
64.9% of women with births (1,084) in Walker County are married. The highest percentage of unmarried women with births falls into 20 to 34 years age bracket with 41.3% of them unmarried at the time of birth, while the lowest percentage of unmarried women with births belong to 35 to 50 years age bracket with 19.4% of them unmarried.
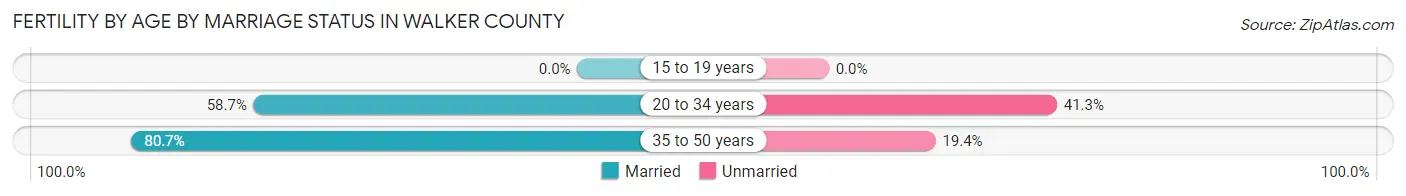
| Age Bracket | Married | Unmarried |
| 15 to 19 years | 0 (0.0%) | 0 (0.0%) |
| 20 to 34 years | 454 (58.7%) | 320 (41.3%) |
| 35 to 50 years | 250 (80.6%) | 60 (19.4%) |
| Total | 704 (64.9%) | 380 (35.1%) |
Fertility by Education in Walker County
Average fertility rate in Walker County is 63.0 births per 1,000 women. Women with the education attainment of graduate degree have the highest fertility rate of 109.0 births per 1,000 women, while women with the education attainment of bachelor's degree have the lowest fertility at 49.0 births per 1,000 women. Women with the education attainment of college or associate's degree represent 51.3% of all women with births.
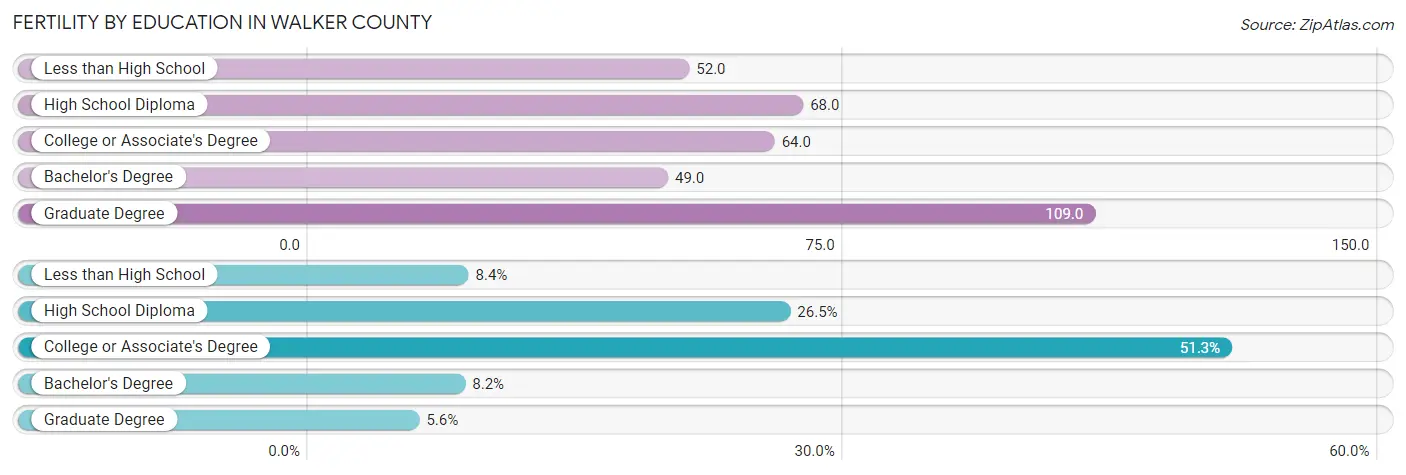
| Educational Attainment | Women with Births | Births / 1,000 Women |
| Less than High School | 91 (8.4%) | 52.0 |
| High School Diploma | 287 (26.5%) | 68.0 |
| College or Associate's Degree | 556 (51.3%) | 64.0 |
| Bachelor's Degree | 89 (8.2%) | 49.0 |
| Graduate Degree | 61 (5.6%) | 109.0 |
| Total | 1,084 (100.0%) | 63.0 |
Fertility by Education by Marriage Status in Walker County
35.1% of women with births in Walker County are unmarried. Women with the educational attainment of bachelor's degree are most likely to be married with 100.0% of them married at childbirth, while women with the educational attainment of high school diploma are least likely to be married with 57.5% of them unmarried at childbirth.
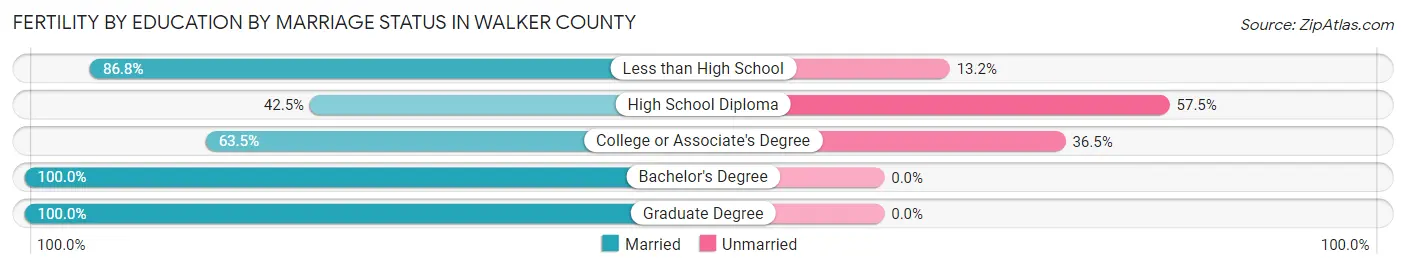
| Educational Attainment | Married | Unmarried |
| Less than High School | 79 (86.8%) | 12 (13.2%) |
| High School Diploma | 122 (42.5%) | 165 (57.5%) |
| College or Associate's Degree | 353 (63.5%) | 203 (36.5%) |
| Bachelor's Degree | 89 (100.0%) | 0 (0.0%) |
| Graduate Degree | 61 (100.0%) | 0 (0.0%) |
| Total | 704 (64.9%) | 380 (35.1%) |
Employment Characteristics in Walker County
Employment by Class of Employer in Walker County
Among the 28,340 employed individuals in Walker County, private company employees (15,951 | 56.3%), state government employees (6,822 | 24.1%), and local government employees (1,809 | 6.4%) make up the most common classes of employment.
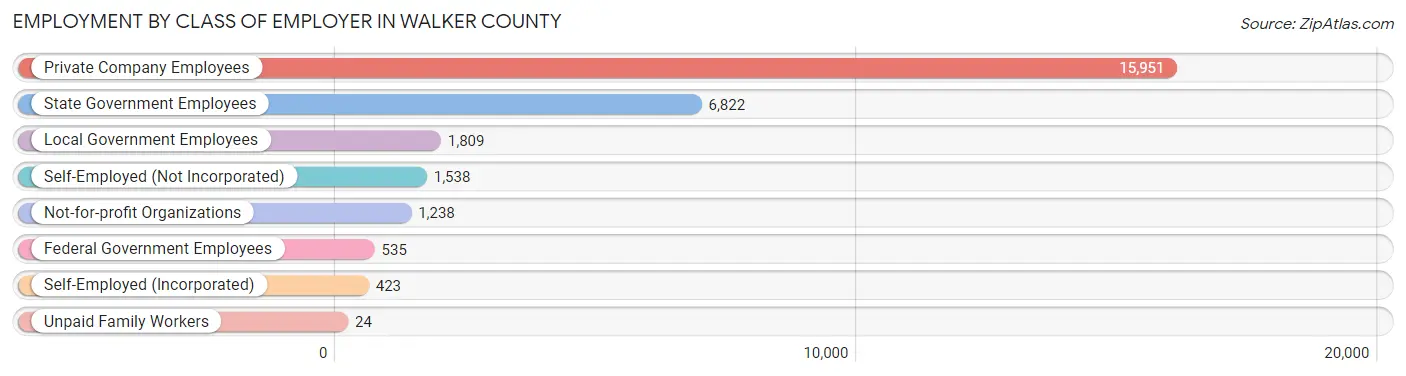
| Employer Class | # Employees | % Employees |
| Private Company Employees | 15,951 | 56.3% |
| Self-Employed (Incorporated) | 423 | 1.5% |
| Self-Employed (Not Incorporated) | 1,538 | 5.4% |
| Not-for-profit Organizations | 1,238 | 4.4% |
| Local Government Employees | 1,809 | 6.4% |
| State Government Employees | 6,822 | 24.1% |
| Federal Government Employees | 535 | 1.9% |
| Unpaid Family Workers | 24 | 0.1% |
| Total | 28,340 | 100.0% |
Employment Status by Age in Walker County
According to the labor force statistics for Walker County, out of the total population over 16 years of age (67,473), 46.5% or 31,375 individuals are in the labor force, with 7.0% or 2,196 of them unemployed. The age group with the highest labor force participation rate is 25 to 29 years, with 68.8% or 3,880 individuals in the labor force. Within the labor force, the 16 to 19 years age range has the highest percentage of unemployed individuals, with 26.7% or 451 of them being unemployed.
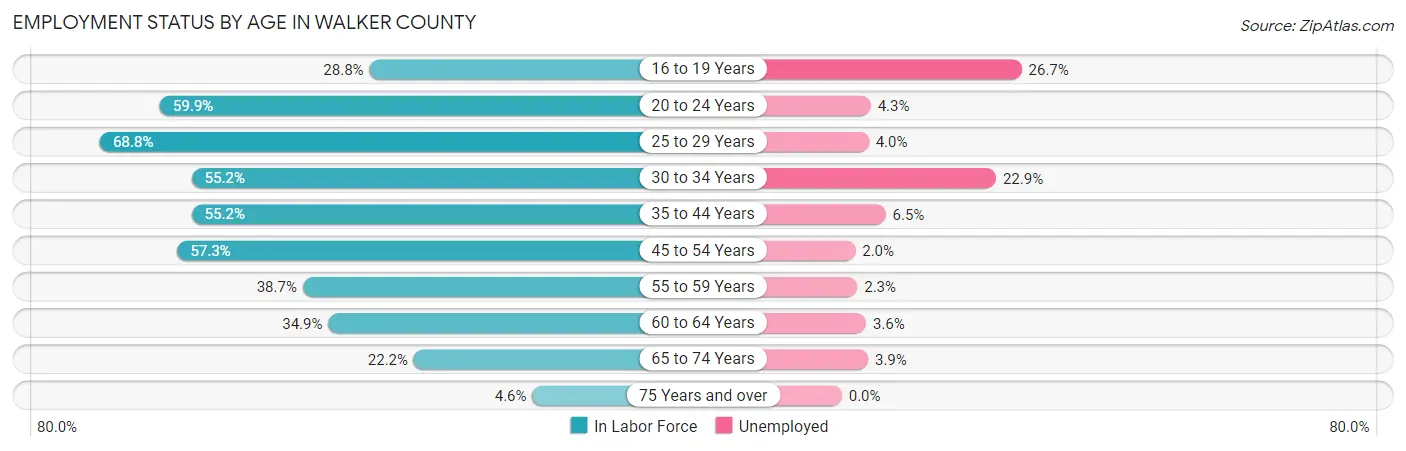
| Age Bracket | In Labor Force | Unemployed |
| 16 to 19 Years | 1,689 (28.8%) | 451 (26.7%) |
| 20 to 24 Years | 6,207 (59.9%) | 267 (4.3%) |
| 25 to 29 Years | 3,880 (68.8%) | 155 (4.0%) |
| 30 to 34 Years | 3,017 (55.2%) | 691 (22.9%) |
| 35 to 44 Years | 5,911 (55.2%) | 384 (6.5%) |
| 45 to 54 Years | 5,819 (57.3%) | 116 (2.0%) |
| 55 to 59 Years | 1,793 (38.7%) | 41 (2.3%) |
| 60 to 64 Years | 1,464 (34.9%) | 53 (3.6%) |
| 65 to 74 Years | 1,397 (22.2%) | 54 (3.9%) |
| 75 Years and over | 191 (4.6%) | 0 (0.0%) |
| Total | 31,375 (46.5%) | 2,196 (7.0%) |
Employment Status by Educational Attainment in Walker County
According to labor force statistics for Walker County, 53.6% of individuals (21,868) out of the total population between 25 and 64 years of age (40,798) are in the labor force, with 6.6% or 1,443 of them being unemployed. The group with the highest labor force participation rate are those with the educational attainment of bachelor's degree or higher, with 84.8% or 5,795 individuals in the labor force. Within the labor force, individuals with high school diploma education have the highest percentage of unemployment, with 15.6% or 1,176 of them being unemployed.
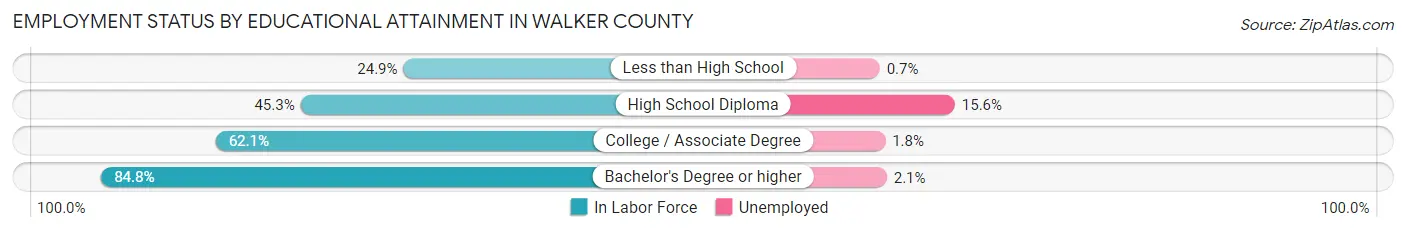
| Educational Attainment | In Labor Force | Unemployed |
| Less than High School | 1,484 (24.9%) | 42 (0.7%) |
| High School Diploma | 7,541 (45.3%) | 2,597 (15.6%) |
| College / Associate Degree | 7,055 (62.1%) | 204 (1.8%) |
| Bachelor's Degree or higher | 5,795 (84.8%) | 144 (2.1%) |
| Total | 21,868 (53.6%) | 2,693 (6.6%) |
Employment Occupations by Sex in Walker County
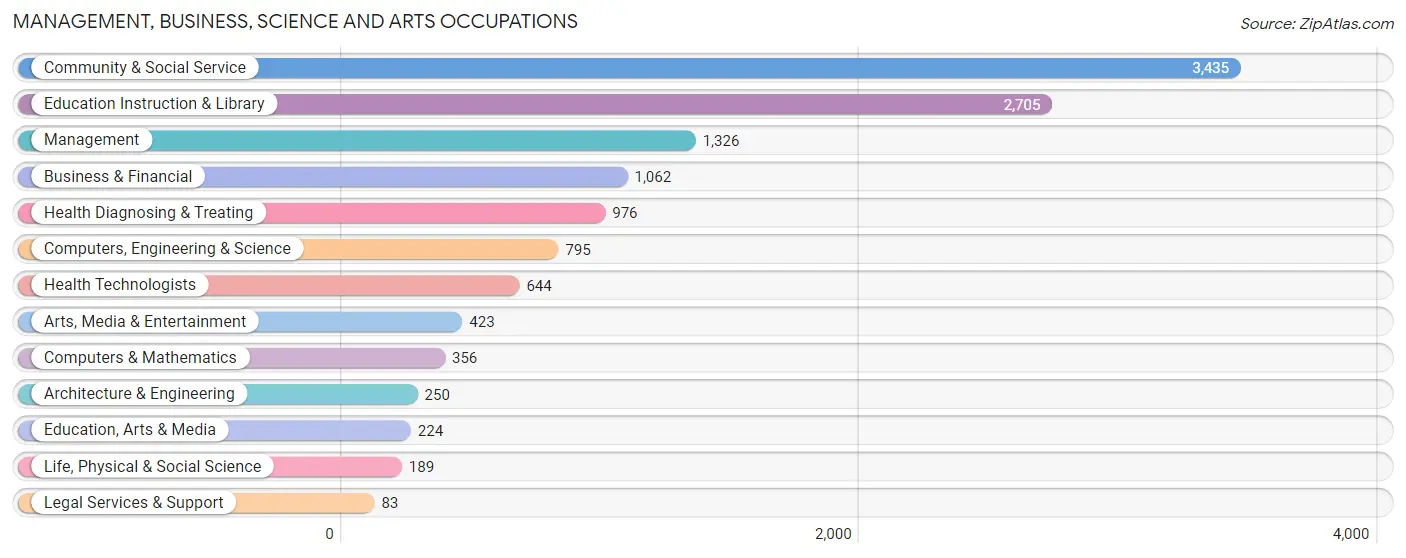
Management, Business, Science and Arts Occupations
The most common Management, Business, Science and Arts occupations in Walker County are Community & Social Service (3,435 | 11.8%), Education Instruction & Library (2,705 | 9.3%), Management (1,326 | 4.5%), Business & Financial (1,062 | 3.6%), and Health Diagnosing & Treating (976 | 3.4%).
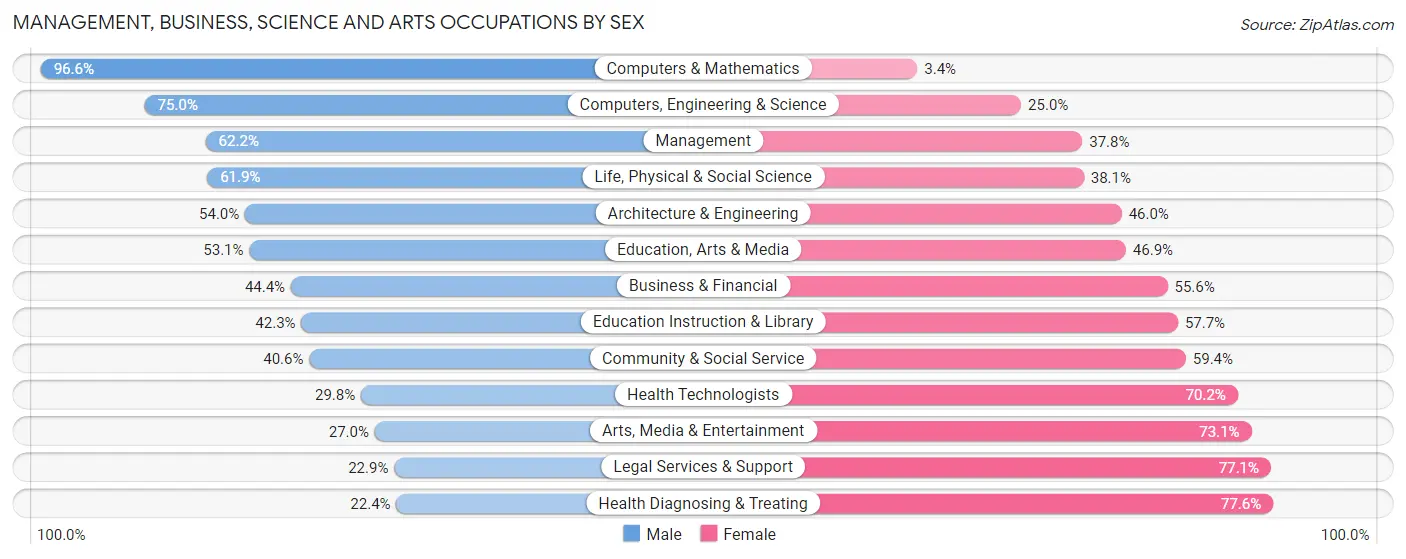
Management, Business, Science and Arts Occupations by Sex
Within the Management, Business, Science and Arts occupations in Walker County, the most male-oriented occupations are Computers & Mathematics (96.6%), Computers, Engineering & Science (75.0%), and Management (62.2%), while the most female-oriented occupations are Health Diagnosing & Treating (77.6%), Legal Services & Support (77.1%), and Arts, Media & Entertainment (73.1%).
| Occupation | Male | Female |
| Management | 825 (62.2%) | 501 (37.8%) |
| Business & Financial | 472 (44.4%) | 590 (55.6%) |
| Computers, Engineering & Science | 596 (75.0%) | 199 (25.0%) |
| Computers & Mathematics | 344 (96.6%) | 12 (3.4%) |
| Architecture & Engineering | 135 (54.0%) | 115 (46.0%) |
| Life, Physical & Social Science | 117 (61.9%) | 72 (38.1%) |
| Community & Social Service | 1,395 (40.6%) | 2,040 (59.4%) |
| Education, Arts & Media | 119 (53.1%) | 105 (46.9%) |
| Legal Services & Support | 19 (22.9%) | 64 (77.1%) |
| Education Instruction & Library | 1,143 (42.3%) | 1,562 (57.7%) |
| Arts, Media & Entertainment | 114 (27.0%) | 309 (73.1%) |
| Health Diagnosing & Treating | 219 (22.4%) | 757 (77.6%) |
| Health Technologists | 192 (29.8%) | 452 (70.2%) |
| Total (Category) | 3,507 (46.2%) | 4,087 (53.8%) |
| Total (Overall) | 16,990 (58.3%) | 12,130 (41.7%) |
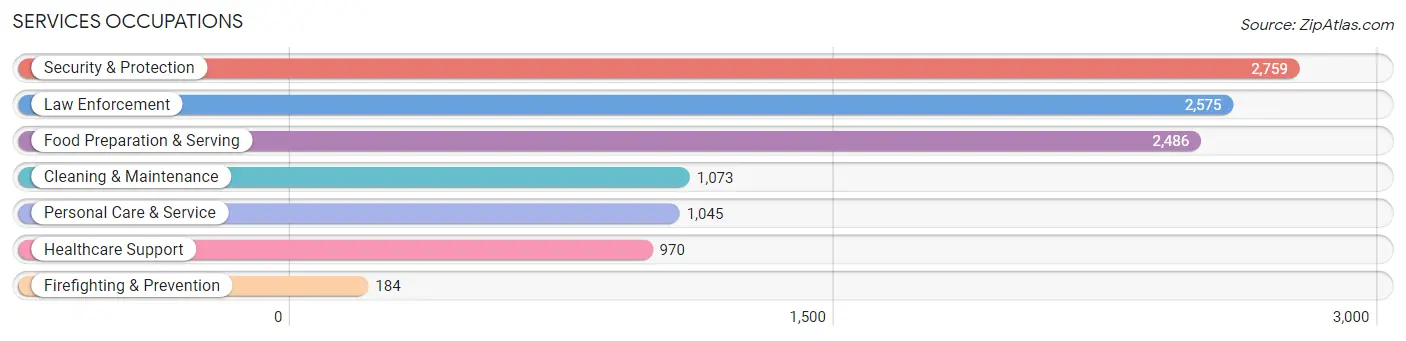
Services Occupations
The most common Services occupations in Walker County are Security & Protection (2,759 | 9.5%), Law Enforcement (2,575 | 8.8%), Food Preparation & Serving (2,486 | 8.5%), Cleaning & Maintenance (1,073 | 3.7%), and Personal Care & Service (1,045 | 3.6%).
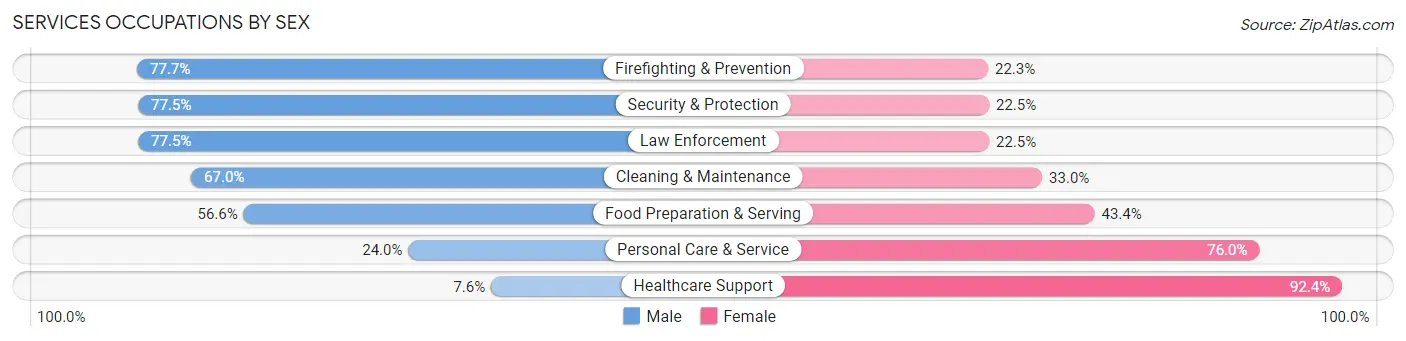
Services Occupations by Sex
Within the Services occupations in Walker County, the most male-oriented occupations are Firefighting & Prevention (77.7%), Security & Protection (77.5%), and Law Enforcement (77.5%), while the most female-oriented occupations are Healthcare Support (92.4%), Personal Care & Service (76.0%), and Food Preparation & Serving (43.4%).
| Occupation | Male | Female |
| Healthcare Support | 74 (7.6%) | 896 (92.4%) |
| Security & Protection | 2,139 (77.5%) | 620 (22.5%) |
| Firefighting & Prevention | 143 (77.7%) | 41 (22.3%) |
| Law Enforcement | 1,996 (77.5%) | 579 (22.5%) |
| Food Preparation & Serving | 1,408 (56.6%) | 1,078 (43.4%) |
| Cleaning & Maintenance | 719 (67.0%) | 354 (33.0%) |
| Personal Care & Service | 251 (24.0%) | 794 (76.0%) |
| Total (Category) | 4,591 (55.1%) | 3,742 (44.9%) |
| Total (Overall) | 16,990 (58.3%) | 12,130 (41.7%) |
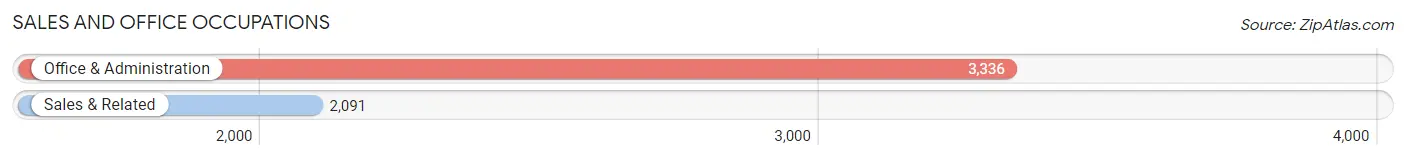
Sales and Office Occupations
The most common Sales and Office occupations in Walker County are Office & Administration (3,336 | 11.5%), and Sales & Related (2,091 | 7.2%).
Sales and Office Occupations by Sex
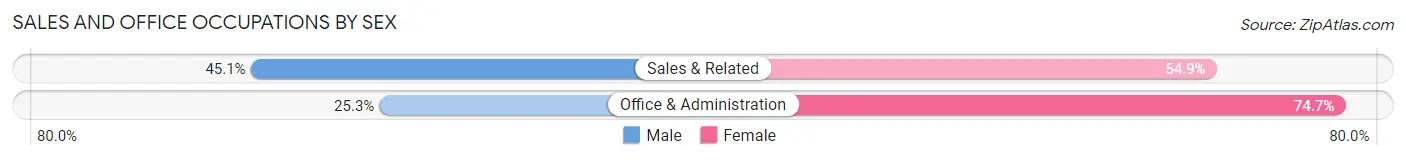
| Occupation | Male | Female |
| Sales & Related | 943 (45.1%) | 1,148 (54.9%) |
| Office & Administration | 844 (25.3%) | 2,492 (74.7%) |
| Total (Category) | 1,787 (32.9%) | 3,640 (67.1%) |
| Total (Overall) | 16,990 (58.3%) | 12,130 (41.7%) |
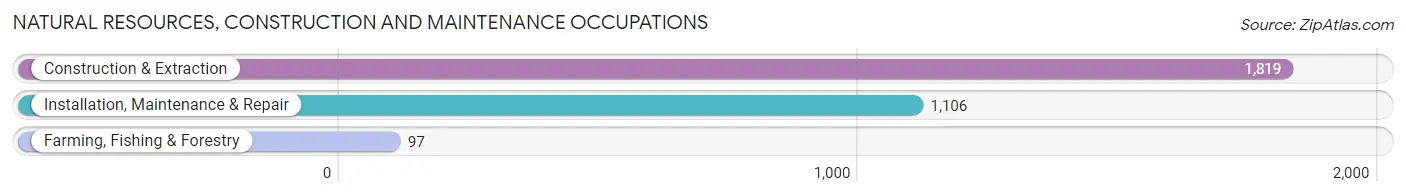
Natural Resources, Construction and Maintenance Occupations
The most common Natural Resources, Construction and Maintenance occupations in Walker County are Construction & Extraction (1,819 | 6.2%), Installation, Maintenance & Repair (1,106 | 3.8%), and Farming, Fishing & Forestry (97 | 0.3%).
Natural Resources, Construction and Maintenance Occupations by Sex
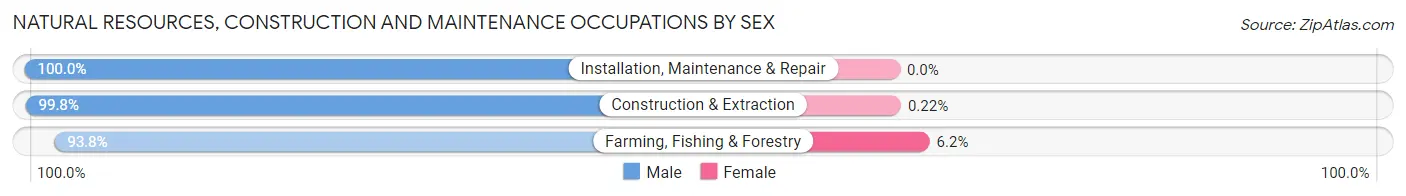
| Occupation | Male | Female |
| Farming, Fishing & Forestry | 91 (93.8%) | 6 (6.2%) |
| Construction & Extraction | 1,815 (99.8%) | 4 (0.2%) |
| Installation, Maintenance & Repair | 1,106 (100.0%) | 0 (0.0%) |
| Total (Category) | 3,012 (99.7%) | 10 (0.3%) |
| Total (Overall) | 16,990 (58.3%) | 12,130 (41.7%) |
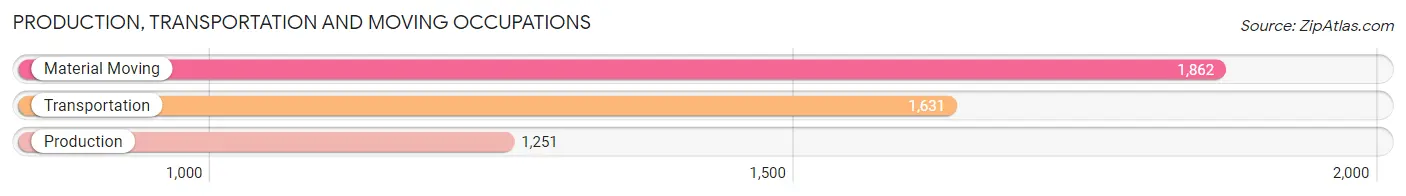
Production, Transportation and Moving Occupations
The most common Production, Transportation and Moving occupations in Walker County are Material Moving (1,862 | 6.4%), Transportation (1,631 | 5.6%), and Production (1,251 | 4.3%).
Production, Transportation and Moving Occupations by Sex
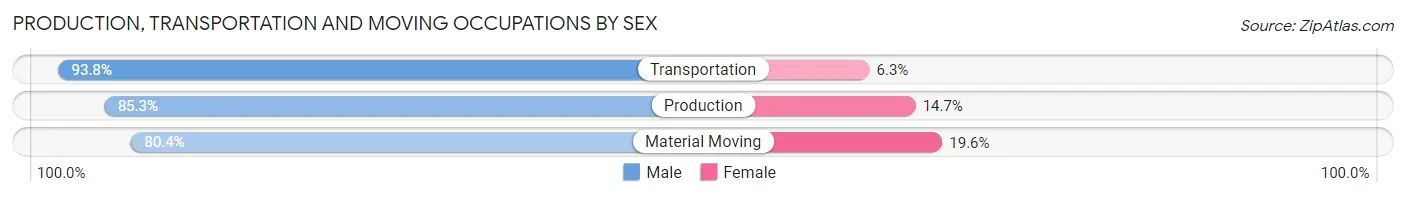
| Occupation | Male | Female |
| Production | 1,067 (85.3%) | 184 (14.7%) |
| Transportation | 1,529 (93.8%) | 102 (6.2%) |
| Material Moving | 1,497 (80.4%) | 365 (19.6%) |
| Total (Category) | 4,093 (86.3%) | 651 (13.7%) |
| Total (Overall) | 16,990 (58.3%) | 12,130 (41.7%) |
Employment Industries by Sex in Walker County
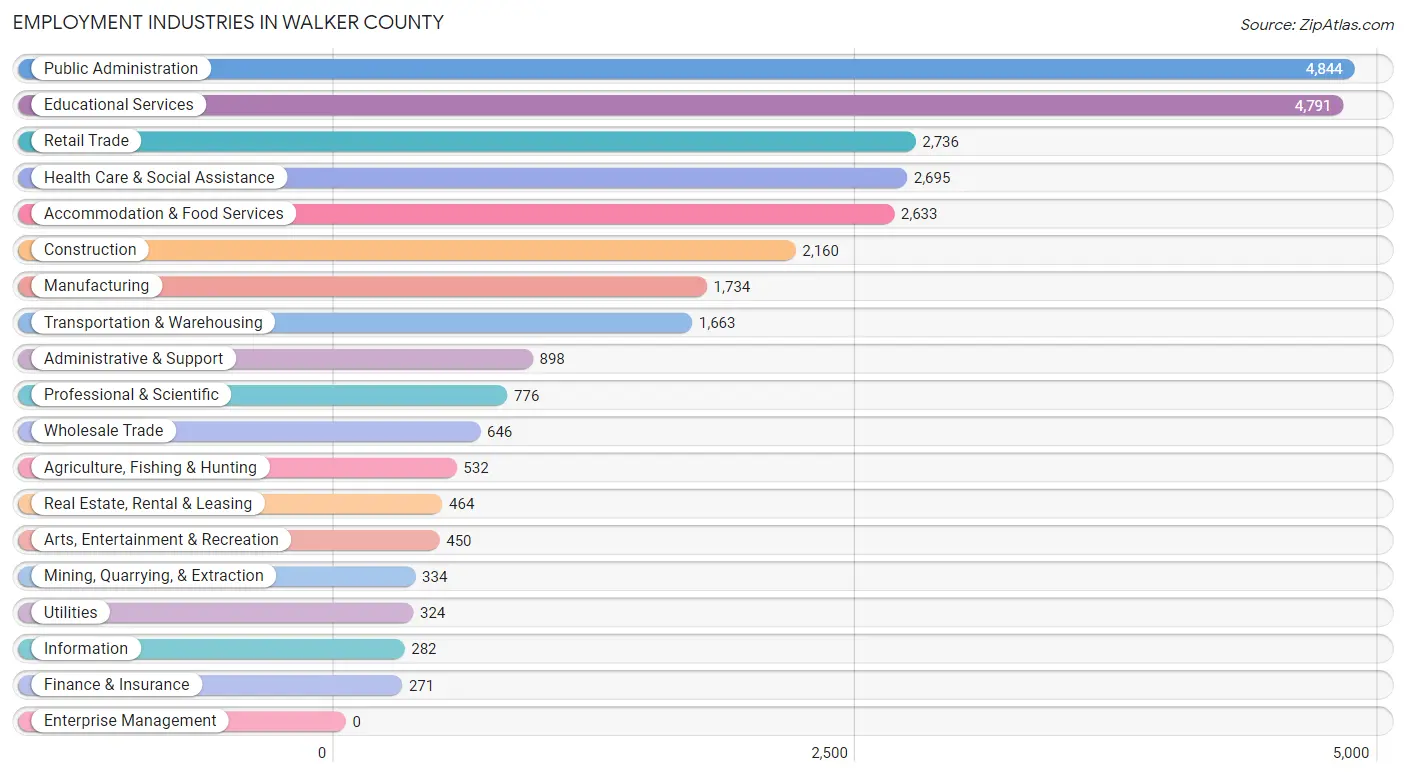
Employment Industries in Walker County
The major employment industries in Walker County include Public Administration (4,844 | 16.6%), Educational Services (4,791 | 16.5%), Retail Trade (2,736 | 9.4%), Health Care & Social Assistance (2,695 | 9.2%), and Accommodation & Food Services (2,633 | 9.0%).
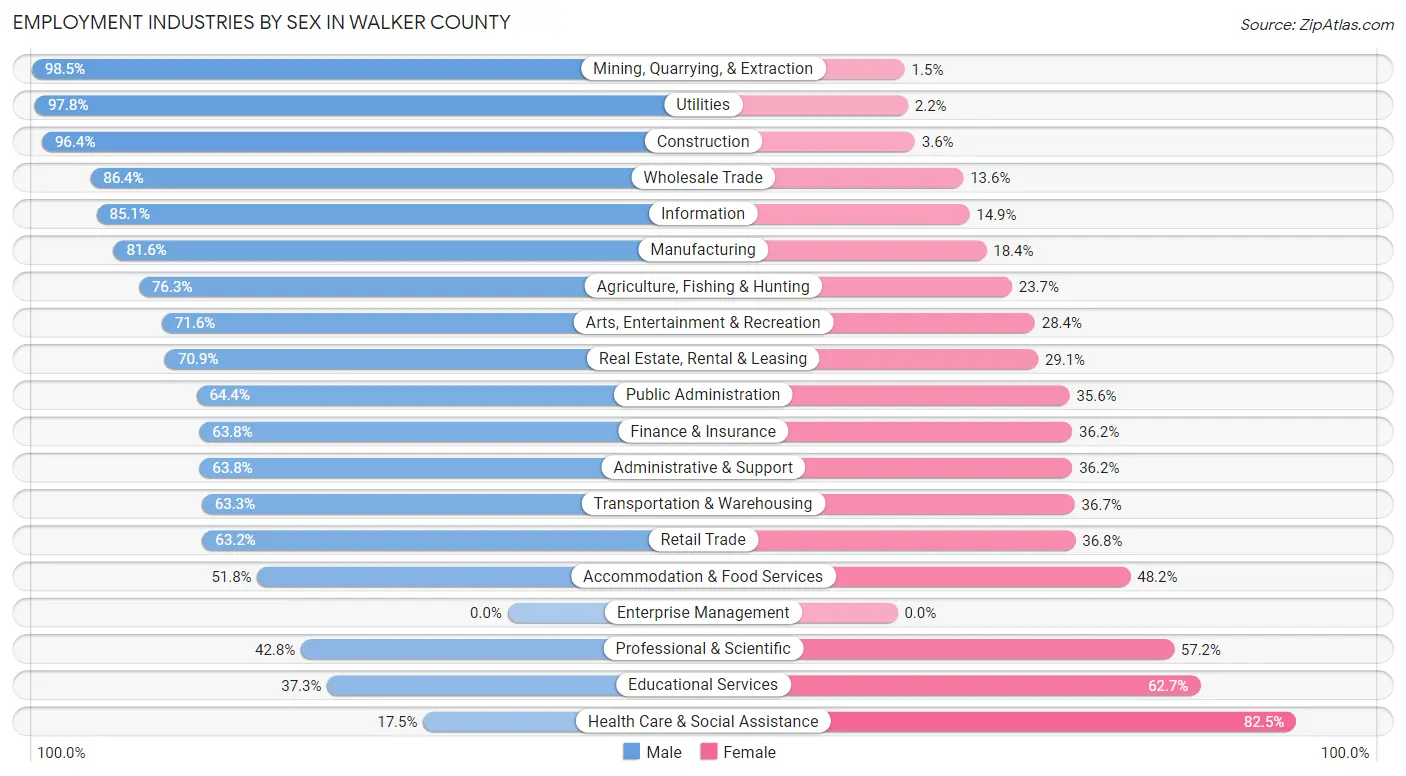
Employment Industries by Sex in Walker County
The Walker County industries that see more men than women are Mining, Quarrying, & Extraction (98.5%), Utilities (97.8%), and Construction (96.4%), whereas the industries that tend to have a higher number of women are Health Care & Social Assistance (82.5%), Educational Services (62.7%), and Professional & Scientific (57.2%).
| Industry | Male | Female |
| Agriculture, Fishing & Hunting | 406 (76.3%) | 126 (23.7%) |
| Mining, Quarrying, & Extraction | 329 (98.5%) | 5 (1.5%) |
| Construction | 2,082 (96.4%) | 78 (3.6%) |
| Manufacturing | 1,415 (81.6%) | 319 (18.4%) |
| Wholesale Trade | 558 (86.4%) | 88 (13.6%) |
| Retail Trade | 1,729 (63.2%) | 1,007 (36.8%) |
| Transportation & Warehousing | 1,053 (63.3%) | 610 (36.7%) |
| Utilities | 317 (97.8%) | 7 (2.2%) |
| Information | 240 (85.1%) | 42 (14.9%) |
| Finance & Insurance | 173 (63.8%) | 98 (36.2%) |
| Real Estate, Rental & Leasing | 329 (70.9%) | 135 (29.1%) |
| Professional & Scientific | 332 (42.8%) | 444 (57.2%) |
| Enterprise Management | 0 (0.0%) | 0 (0.0%) |
| Administrative & Support | 573 (63.8%) | 325 (36.2%) |
| Educational Services | 1,789 (37.3%) | 3,002 (62.7%) |
| Health Care & Social Assistance | 471 (17.5%) | 2,224 (82.5%) |
| Arts, Entertainment & Recreation | 322 (71.6%) | 128 (28.4%) |
| Accommodation & Food Services | 1,364 (51.8%) | 1,269 (48.2%) |
| Public Administration | 3,119 (64.4%) | 1,725 (35.6%) |
| Total | 16,990 (58.3%) | 12,130 (41.7%) |
Education in Walker County
School Enrollment in Walker County
The most common levels of schooling among the 20,178 students in Walker County are college / undergraduate (10,768 | 53.4%), elementary school (2,677 | 13.3%), and middle school (2,302 | 11.4%).
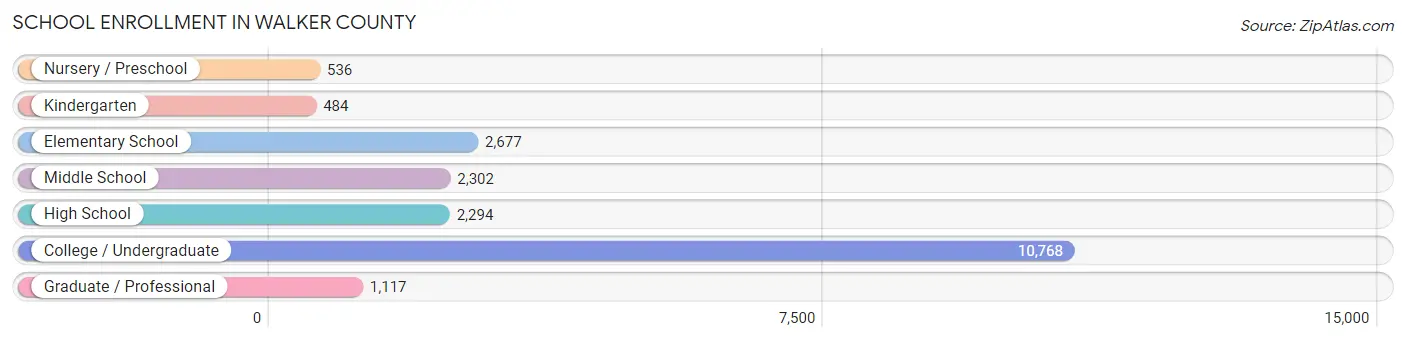
| School Level | # Students | % Students |
| Nursery / Preschool | 536 | 2.7% |
| Kindergarten | 484 | 2.4% |
| Elementary School | 2,677 | 13.3% |
| Middle School | 2,302 | 11.4% |
| High School | 2,294 | 11.4% |
| College / Undergraduate | 10,768 | 53.4% |
| Graduate / Professional | 1,117 | 5.5% |
| Total | 20,178 | 100.0% |
School Enrollment by Age by Funding Source in Walker County
Out of a total of 20,178 students who are enrolled in schools in Walker County, 1,574 (7.8%) attend a private institution, while the remaining 18,604 (92.2%) are enrolled in public schools. The age group of 3 to 4 year olds has the highest likelihood of being enrolled in private schools, with 103 (19.4% in the age bracket) enrolled. Conversely, the age group of 18 to 19 year olds has the lowest likelihood of being enrolled in a private school, with 3,522 (97.4% in the age bracket) attending a public institution.
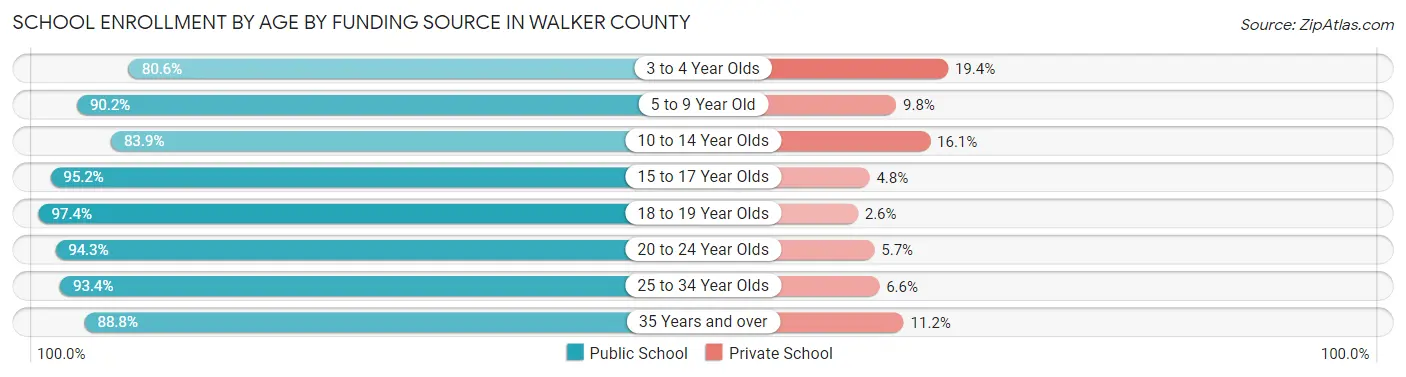
| Age Bracket | Public School | Private School |
| 3 to 4 Year Olds | 427 (80.6%) | 103 (19.4%) |
| 5 to 9 Year Old | 2,459 (90.2%) | 266 (9.8%) |
| 10 to 14 Year Olds | 2,497 (83.9%) | 479 (16.1%) |
| 15 to 17 Year Olds | 1,623 (95.2%) | 82 (4.8%) |
| 18 to 19 Year Olds | 3,522 (97.4%) | 95 (2.6%) |
| 20 to 24 Year Olds | 6,392 (94.3%) | 388 (5.7%) |
| 25 to 34 Year Olds | 987 (93.4%) | 70 (6.6%) |
| 35 Years and over | 700 (88.8%) | 88 (11.2%) |
| Total | 18,604 (92.2%) | 1,574 (7.8%) |
Educational Attainment by Field of Study in Walker County
Education (2,133 | 20.3%), business (1,783 | 17.0%), arts & humanities (1,042 | 9.9%), bio, nature & agricultural (967 | 9.2%), and science & technology (790 | 7.5%) are the most common fields of study among 10,511 individuals in Walker County who have obtained a bachelor's degree or higher.
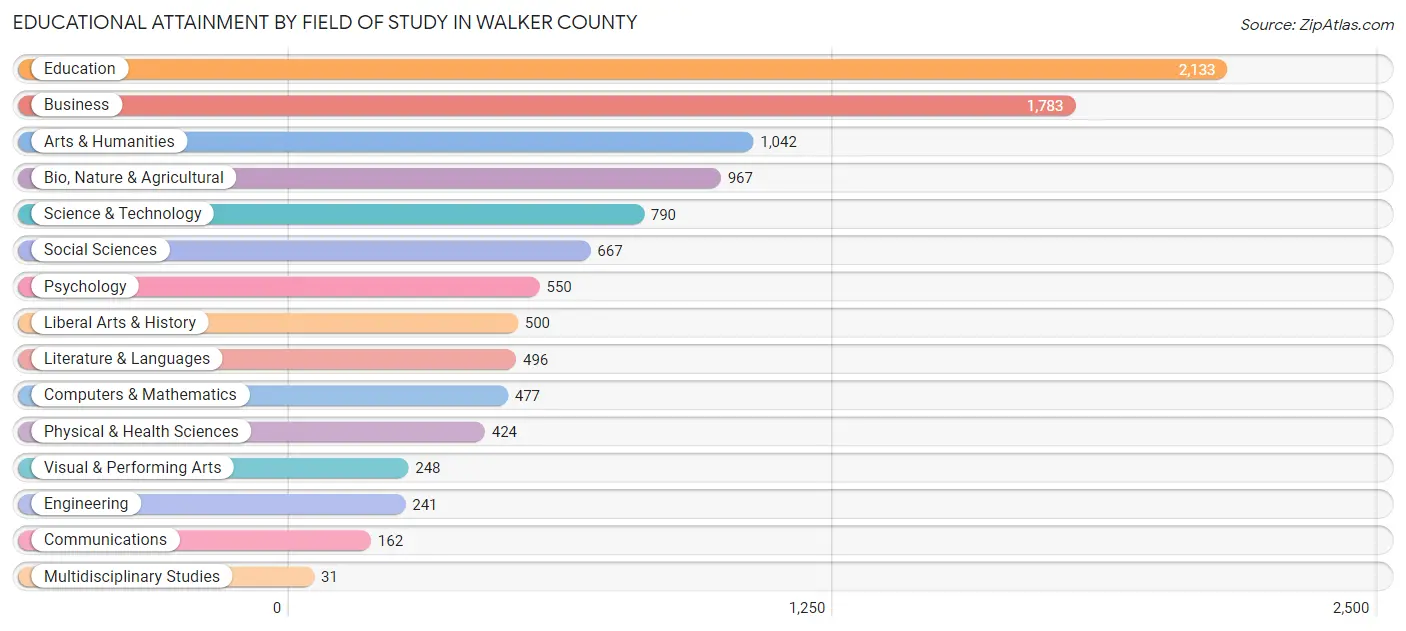
| Field of Study | # Graduates | % Graduates |
| Computers & Mathematics | 477 | 4.5% |
| Bio, Nature & Agricultural | 967 | 9.2% |
| Physical & Health Sciences | 424 | 4.0% |
| Psychology | 550 | 5.2% |
| Social Sciences | 667 | 6.4% |
| Engineering | 241 | 2.3% |
| Multidisciplinary Studies | 31 | 0.3% |
| Science & Technology | 790 | 7.5% |
| Business | 1,783 | 17.0% |
| Education | 2,133 | 20.3% |
| Literature & Languages | 496 | 4.7% |
| Liberal Arts & History | 500 | 4.8% |
| Visual & Performing Arts | 248 | 2.4% |
| Communications | 162 | 1.5% |
| Arts & Humanities | 1,042 | 9.9% |
| Total | 10,511 | 100.0% |
Transportation & Commute in Walker County
Vehicle Availability by Sex in Walker County
The most prevalent vehicle ownership categories in Walker County are males with 2 vehicles (7,229, accounting for 44.3%) and females with 2 vehicles (4,733, making up 65.8%).
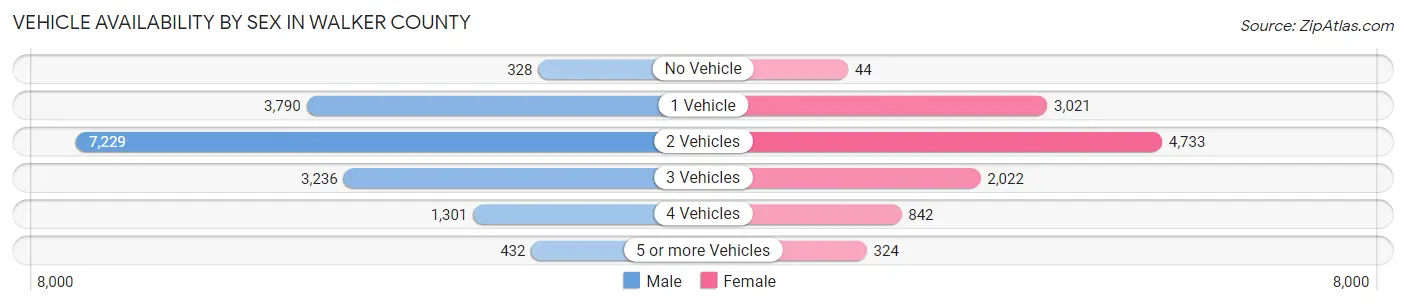
| Vehicles Available | Male | Female |
| No Vehicle | 328 (2.0%) | 44 (0.4%) |
| 1 Vehicle | 3,790 (23.2%) | 3,021 (27.5%) |
| 2 Vehicles | 7,229 (44.3%) | 4,733 (43.1%) |
| 3 Vehicles | 3,236 (19.8%) | 2,022 (18.4%) |
| 4 Vehicles | 1,301 (8.0%) | 842 (7.7%) |
| 5 or more Vehicles | 432 (2.6%) | 324 (2.9%) |
| Total | 16,316 (100.0%) | 10,986 (100.0%) |
Commute Time in Walker County
The most frequently occuring commute durations in Walker County are 20 to 24 minutes (4,936 commuters, 18.7%), 15 to 19 minutes (4,023 commuters, 15.3%), and 30 to 34 minutes (3,532 commuters, 13.4%).
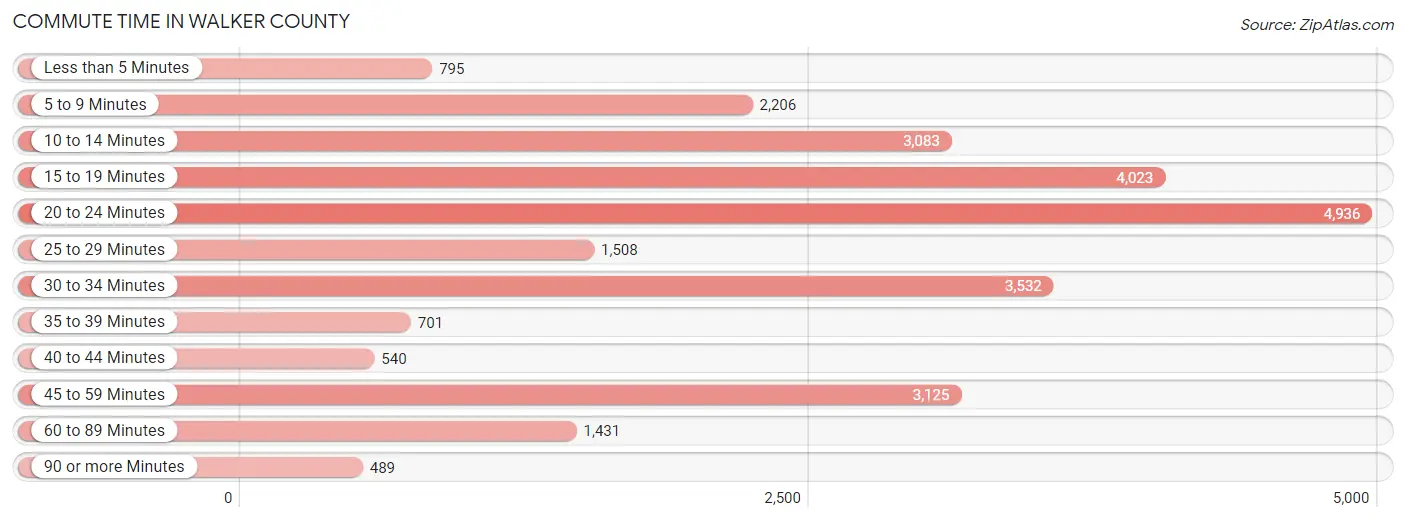
| Commute Time | # Commuters | % Commuters |
| Less than 5 Minutes | 795 | 3.0% |
| 5 to 9 Minutes | 2,206 | 8.4% |
| 10 to 14 Minutes | 3,083 | 11.7% |
| 15 to 19 Minutes | 4,023 | 15.3% |
| 20 to 24 Minutes | 4,936 | 18.7% |
| 25 to 29 Minutes | 1,508 | 5.7% |
| 30 to 34 Minutes | 3,532 | 13.4% |
| 35 to 39 Minutes | 701 | 2.7% |
| 40 to 44 Minutes | 540 | 2.1% |
| 45 to 59 Minutes | 3,125 | 11.8% |
| 60 to 89 Minutes | 1,431 | 5.4% |
| 90 or more Minutes | 489 | 1.8% |
Commute Time by Sex in Walker County
The most common commute times in Walker County are 20 to 24 minutes (2,786 commuters, 17.9%) for males and 20 to 24 minutes (2,150 commuters, 20.0%) for females.
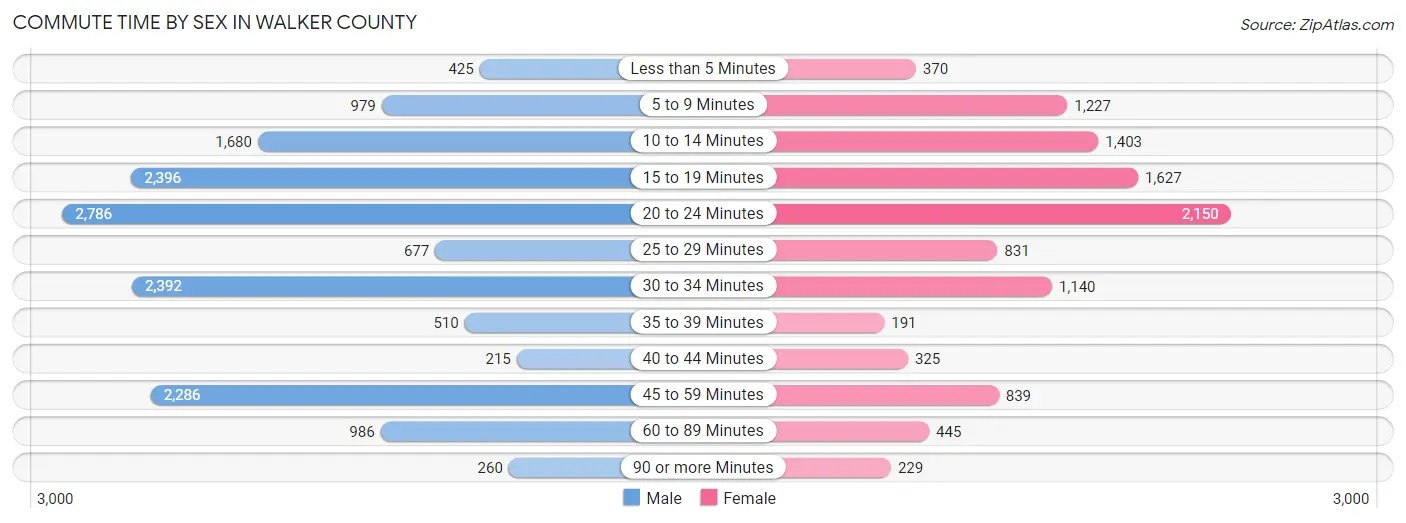
| Commute Time | Male | Female |
| Less than 5 Minutes | 425 (2.7%) | 370 (3.4%) |
| 5 to 9 Minutes | 979 (6.3%) | 1,227 (11.4%) |
| 10 to 14 Minutes | 1,680 (10.8%) | 1,403 (13.0%) |
| 15 to 19 Minutes | 2,396 (15.4%) | 1,627 (15.1%) |
| 20 to 24 Minutes | 2,786 (17.9%) | 2,150 (20.0%) |
| 25 to 29 Minutes | 677 (4.3%) | 831 (7.7%) |
| 30 to 34 Minutes | 2,392 (15.3%) | 1,140 (10.6%) |
| 35 to 39 Minutes | 510 (3.3%) | 191 (1.8%) |
| 40 to 44 Minutes | 215 (1.4%) | 325 (3.0%) |
| 45 to 59 Minutes | 2,286 (14.7%) | 839 (7.8%) |
| 60 to 89 Minutes | 986 (6.3%) | 445 (4.1%) |
| 90 or more Minutes | 260 (1.7%) | 229 (2.1%) |
Time of Departure to Work by Sex in Walker County
The most frequent times of departure to work in Walker County are 7:00 AM to 7:29 AM (2,319, 14.9%) for males and 7:30 AM to 7:59 AM (2,355, 21.8%) for females.
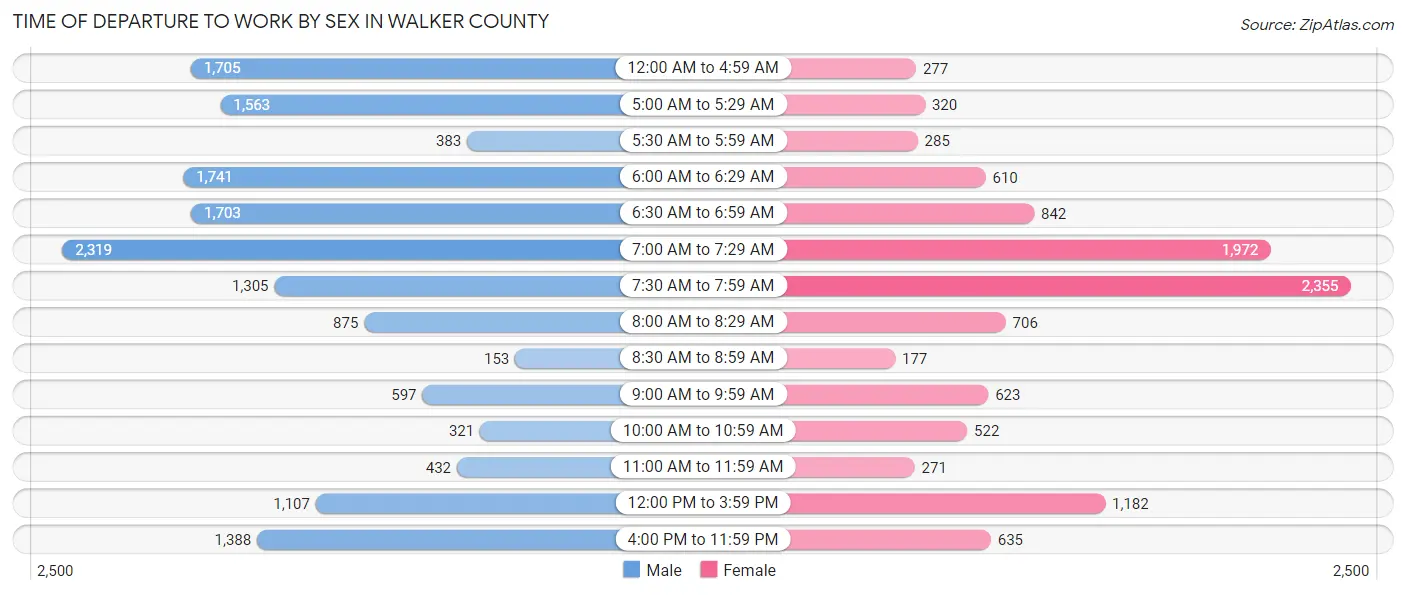
| Time of Departure | Male | Female |
| 12:00 AM to 4:59 AM | 1,705 (10.9%) | 277 (2.6%) |
| 5:00 AM to 5:29 AM | 1,563 (10.0%) | 320 (3.0%) |
| 5:30 AM to 5:59 AM | 383 (2.5%) | 285 (2.6%) |
| 6:00 AM to 6:29 AM | 1,741 (11.2%) | 610 (5.7%) |
| 6:30 AM to 6:59 AM | 1,703 (10.9%) | 842 (7.8%) |
| 7:00 AM to 7:29 AM | 2,319 (14.9%) | 1,972 (18.3%) |
| 7:30 AM to 7:59 AM | 1,305 (8.4%) | 2,355 (21.8%) |
| 8:00 AM to 8:29 AM | 875 (5.6%) | 706 (6.6%) |
| 8:30 AM to 8:59 AM | 153 (1.0%) | 177 (1.6%) |
| 9:00 AM to 9:59 AM | 597 (3.8%) | 623 (5.8%) |
| 10:00 AM to 10:59 AM | 321 (2.1%) | 522 (4.8%) |
| 11:00 AM to 11:59 AM | 432 (2.8%) | 271 (2.5%) |
| 12:00 PM to 3:59 PM | 1,107 (7.1%) | 1,182 (11.0%) |
| 4:00 PM to 11:59 PM | 1,388 (8.9%) | 635 (5.9%) |
| Total | 15,592 (100.0%) | 10,777 (100.0%) |
Housing Occupancy in Walker County
Occupancy by Ownership in Walker County
Of the total 24,592 dwellings in Walker County, owner-occupied units account for 13,493 (54.9%), while renter-occupied units make up 11,099 (45.1%).
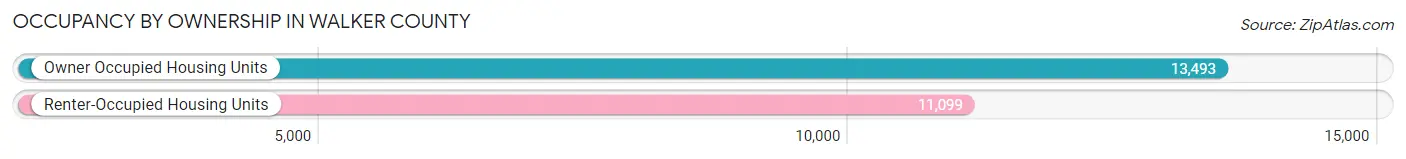
| Occupancy | # Housing Units | % Housing Units |
| Owner Occupied Housing Units | 13,493 | 54.9% |
| Renter-Occupied Housing Units | 11,099 | 45.1% |
| Total Occupied Housing Units | 24,592 | 100.0% |
Occupancy by Household Size in Walker County
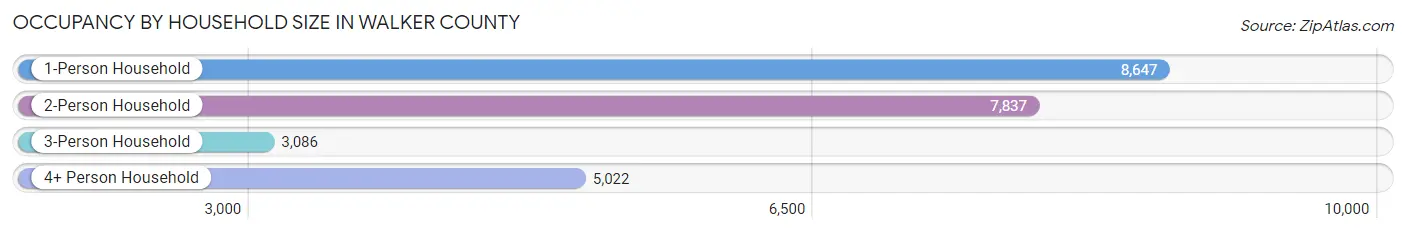
| Household Size | # Housing Units | % Housing Units |
| 1-Person Household | 8,647 | 35.2% |
| 2-Person Household | 7,837 | 31.9% |
| 3-Person Household | 3,086 | 12.6% |
| 4+ Person Household | 5,022 | 20.4% |
| Total Housing Units | 24,592 | 100.0% |
Occupancy by Ownership by Household Size in Walker County
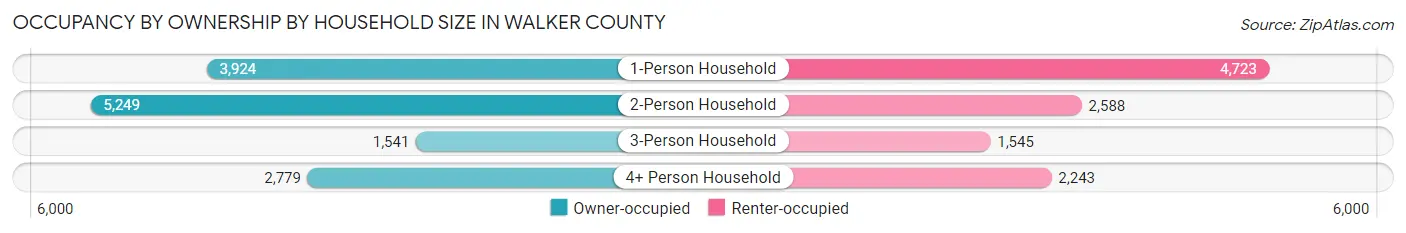
| Household Size | Owner-occupied | Renter-occupied |
| 1-Person Household | 3,924 (45.4%) | 4,723 (54.6%) |
| 2-Person Household | 5,249 (67.0%) | 2,588 (33.0%) |
| 3-Person Household | 1,541 (49.9%) | 1,545 (50.1%) |
| 4+ Person Household | 2,779 (55.3%) | 2,243 (44.7%) |
| Total Housing Units | 13,493 (54.9%) | 11,099 (45.1%) |
Occupancy by Educational Attainment in Walker County
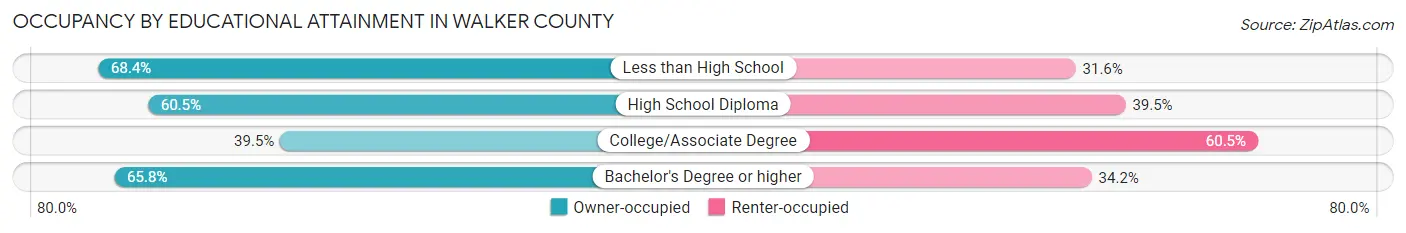
| Household Size | Owner-occupied | Renter-occupied |
| Less than High School | 1,068 (68.4%) | 494 (31.6%) |
| High School Diploma | 4,611 (60.5%) | 3,016 (39.5%) |
| College/Associate Degree | 3,482 (39.5%) | 5,339 (60.5%) |
| Bachelor's Degree or higher | 4,332 (65.8%) | 2,250 (34.2%) |
Occupancy by Age of Householder in Walker County
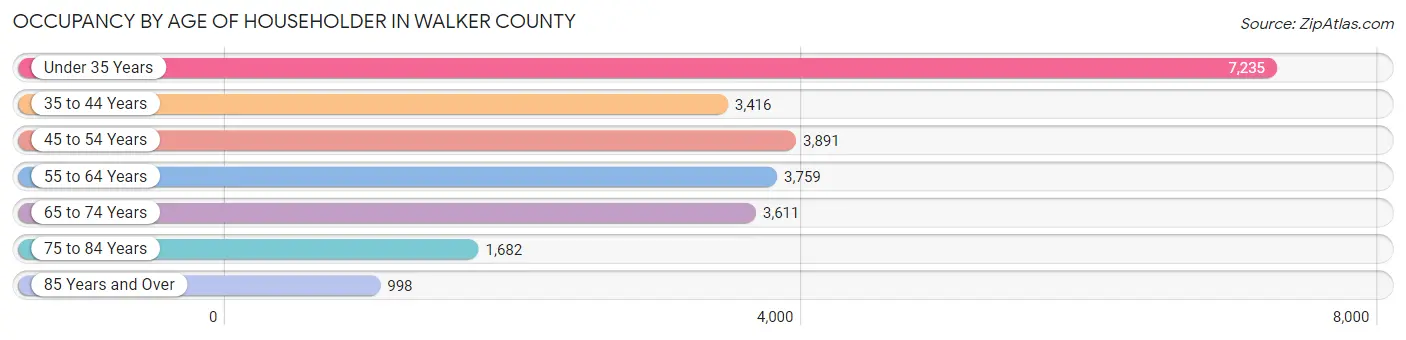
| Age Bracket | # Households | % Households |
| Under 35 Years | 7,235 | 29.4% |
| 35 to 44 Years | 3,416 | 13.9% |
| 45 to 54 Years | 3,891 | 15.8% |
| 55 to 64 Years | 3,759 | 15.3% |
| 65 to 74 Years | 3,611 | 14.7% |
| 75 to 84 Years | 1,682 | 6.8% |
| 85 Years and Over | 998 | 4.1% |
| Total | 24,592 | 100.0% |
Housing Finances in Walker County
Median Income by Occupancy in Walker County
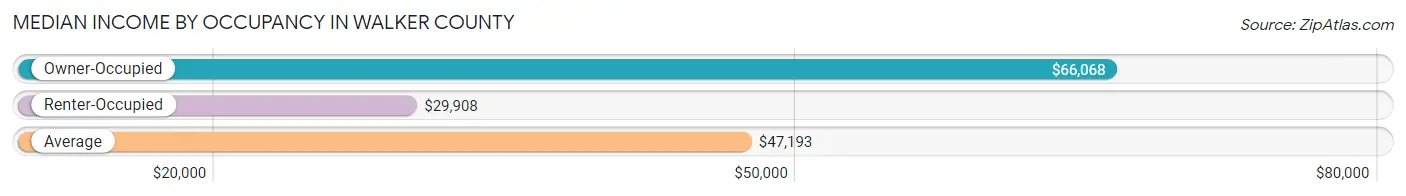
| Occupancy Type | # Households | Median Income |
| Owner-Occupied | 13,493 (54.9%) | $66,068 |
| Renter-Occupied | 11,099 (45.1%) | $29,908 |
| Average | 24,592 (100.0%) | $47,193 |
Occupancy by Householder Income Bracket in Walker County
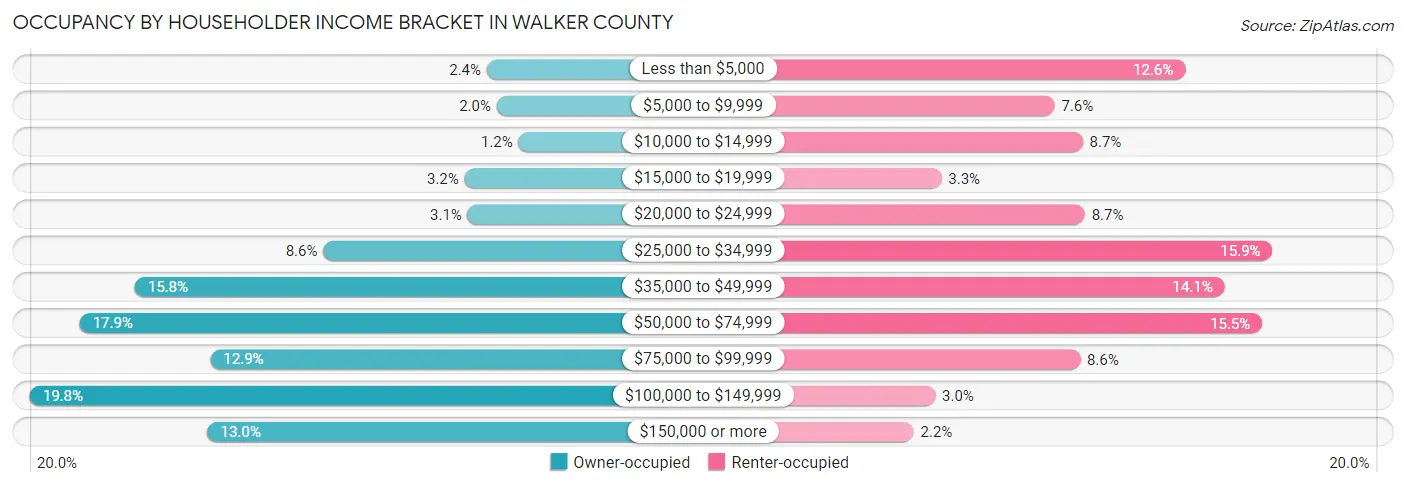
| Income Bracket | Owner-occupied | Renter-occupied |
| Less than $5,000 | 323 (2.4%) | 1,393 (12.6%) |
| $5,000 to $9,999 | 271 (2.0%) | 841 (7.6%) |
| $10,000 to $14,999 | 159 (1.2%) | 960 (8.6%) |
| $15,000 to $19,999 | 437 (3.2%) | 363 (3.3%) |
| $20,000 to $24,999 | 421 (3.1%) | 969 (8.7%) |
| $25,000 to $34,999 | 1,163 (8.6%) | 1,763 (15.9%) |
| $35,000 to $49,999 | 2,132 (15.8%) | 1,561 (14.1%) |
| $50,000 to $74,999 | 2,415 (17.9%) | 1,719 (15.5%) |
| $75,000 to $99,999 | 1,743 (12.9%) | 949 (8.6%) |
| $100,000 to $149,999 | 2,671 (19.8%) | 336 (3.0%) |
| $150,000 or more | 1,758 (13.0%) | 245 (2.2%) |
| Total | 13,493 (100.0%) | 11,099 (100.0%) |
Monthly Housing Cost Tiers in Walker County
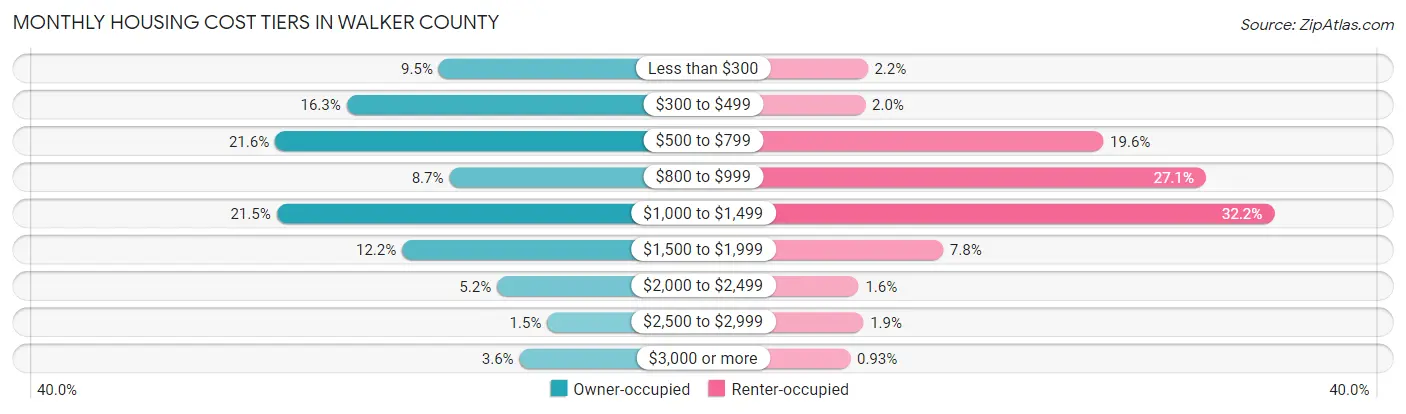
| Monthly Cost | Owner-occupied | Renter-occupied |
| Less than $300 | 1,282 (9.5%) | 245 (2.2%) |
| $300 to $499 | 2,198 (16.3%) | 226 (2.0%) |
| $500 to $799 | 2,909 (21.6%) | 2,172 (19.6%) |
| $800 to $999 | 1,177 (8.7%) | 3,011 (27.1%) |
| $1,000 to $1,499 | 2,894 (21.4%) | 3,569 (32.2%) |
| $1,500 to $1,999 | 1,646 (12.2%) | 862 (7.8%) |
| $2,000 to $2,499 | 703 (5.2%) | 172 (1.5%) |
| $2,500 to $2,999 | 204 (1.5%) | 211 (1.9%) |
| $3,000 or more | 480 (3.6%) | 103 (0.9%) |
| Total | 13,493 (100.0%) | 11,099 (100.0%) |
Physical Housing Characteristics in Walker County
Housing Structures in Walker County
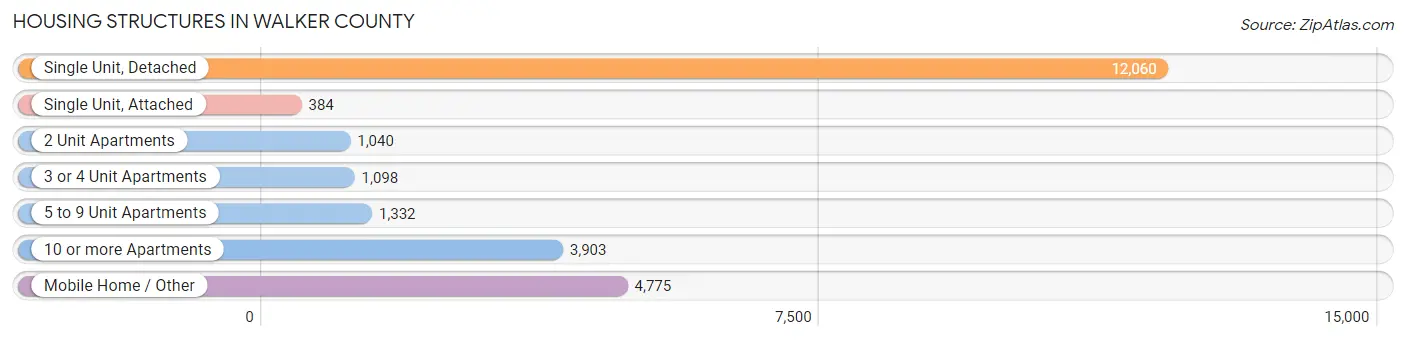
| Structure Type | # Housing Units | % Housing Units |
| Single Unit, Detached | 12,060 | 49.0% |
| Single Unit, Attached | 384 | 1.6% |
| 2 Unit Apartments | 1,040 | 4.2% |
| 3 or 4 Unit Apartments | 1,098 | 4.5% |
| 5 to 9 Unit Apartments | 1,332 | 5.4% |
| 10 or more Apartments | 3,903 | 15.9% |
| Mobile Home / Other | 4,775 | 19.4% |
| Total | 24,592 | 100.0% |
Housing Structures by Occupancy in Walker County
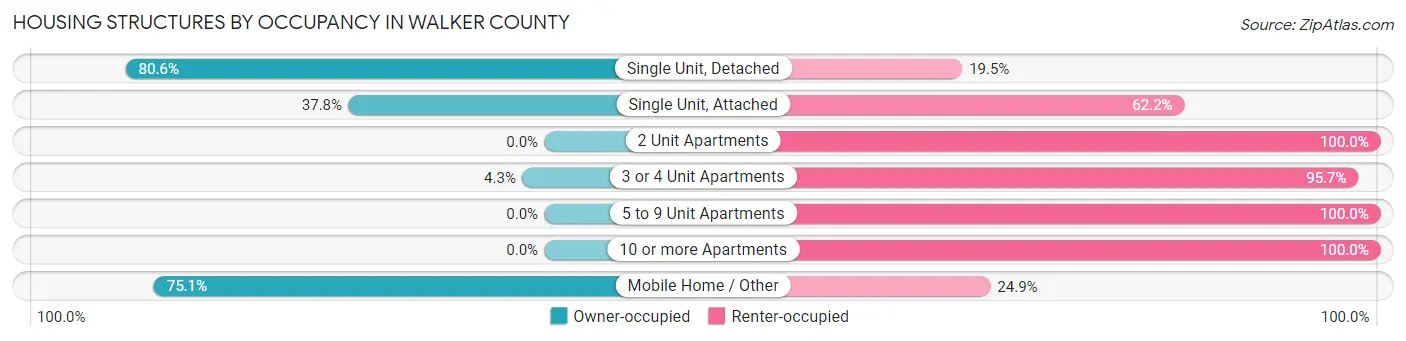
| Structure Type | Owner-occupied | Renter-occupied |
| Single Unit, Detached | 9,714 (80.5%) | 2,346 (19.5%) |
| Single Unit, Attached | 145 (37.8%) | 239 (62.2%) |
| 2 Unit Apartments | 0 (0.0%) | 1,040 (100.0%) |
| 3 or 4 Unit Apartments | 47 (4.3%) | 1,051 (95.7%) |
| 5 to 9 Unit Apartments | 0 (0.0%) | 1,332 (100.0%) |
| 10 or more Apartments | 0 (0.0%) | 3,903 (100.0%) |
| Mobile Home / Other | 3,587 (75.1%) | 1,188 (24.9%) |
| Total | 13,493 (54.9%) | 11,099 (45.1%) |
Housing Structures by Number of Rooms in Walker County
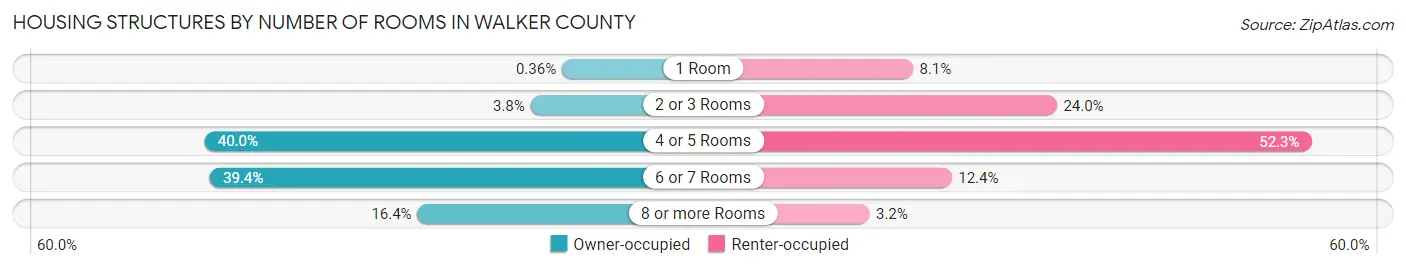
| Number of Rooms | Owner-occupied | Renter-occupied |
| 1 Room | 48 (0.4%) | 895 (8.1%) |
| 2 or 3 Rooms | 518 (3.8%) | 2,667 (24.0%) |
| 4 or 5 Rooms | 5,397 (40.0%) | 5,806 (52.3%) |
| 6 or 7 Rooms | 5,317 (39.4%) | 1,372 (12.4%) |
| 8 or more Rooms | 2,213 (16.4%) | 359 (3.2%) |
| Total | 13,493 (100.0%) | 11,099 (100.0%) |
Housing Structure by Heating Type in Walker County
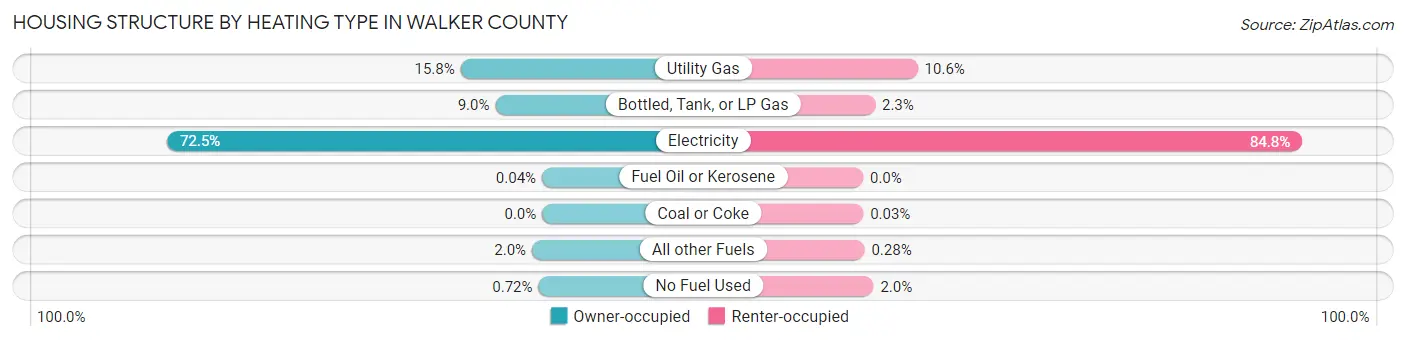
| Heating Type | Owner-occupied | Renter-occupied |
| Utility Gas | 2,126 (15.8%) | 1,171 (10.5%) |
| Bottled, Tank, or LP Gas | 1,220 (9.0%) | 256 (2.3%) |
| Electricity | 9,781 (72.5%) | 9,414 (84.8%) |
| Fuel Oil or Kerosene | 5 (0.0%) | 0 (0.0%) |
| Coal or Coke | 0 (0.0%) | 3 (0.0%) |
| All other Fuels | 264 (2.0%) | 31 (0.3%) |
| No Fuel Used | 97 (0.7%) | 224 (2.0%) |
| Total | 13,493 (100.0%) | 11,099 (100.0%) |
Household Vehicle Usage in Walker County
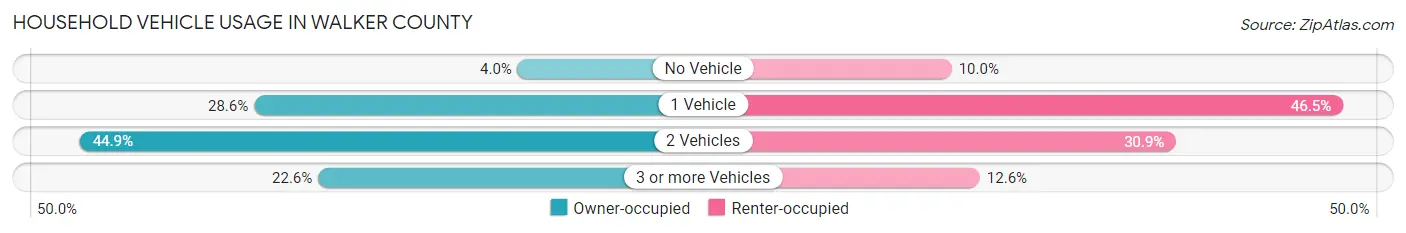
| Vehicles per Household | Owner-occupied | Renter-occupied |
| No Vehicle | 536 (4.0%) | 1,107 (10.0%) |
| 1 Vehicle | 3,856 (28.6%) | 5,161 (46.5%) |
| 2 Vehicles | 6,051 (44.9%) | 3,432 (30.9%) |
| 3 or more Vehicles | 3,050 (22.6%) | 1,399 (12.6%) |
| Total | 13,493 (100.0%) | 11,099 (100.0%) |
Real Estate & Mortgages in Walker County
Real Estate and Mortgage Overview in Walker County
| Characteristic | Without Mortgage | With Mortgage |
| Housing Units | 7,030 | 6,463 |
| Median Property Value | $156,400 | $207,500 |
| Median Household Income | $51,216 | $1,094 |
| Monthly Housing Costs | $508 | $480 |
| Real Estate Taxes | $1,622 | $290 |
Property Value by Mortgage Status in Walker County
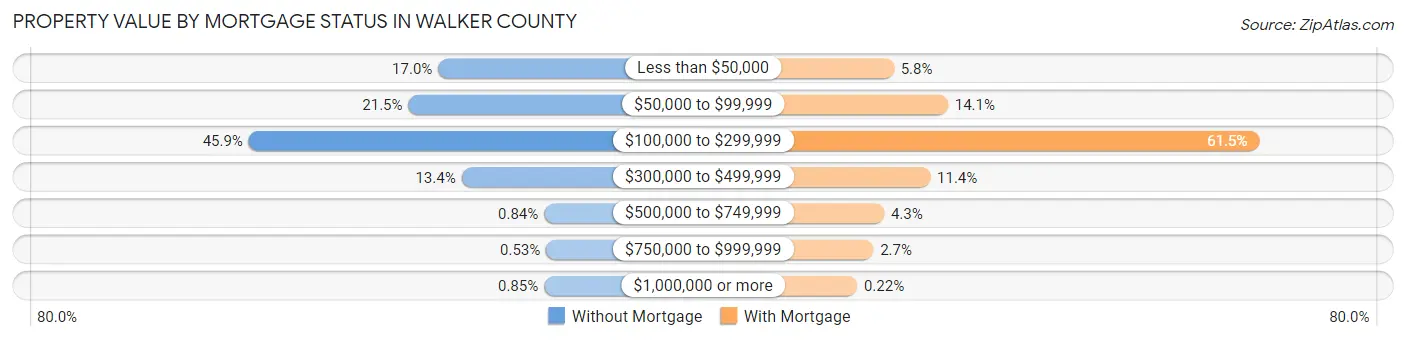
| Property Value | Without Mortgage | With Mortgage |
| Less than $50,000 | 1,194 (17.0%) | 376 (5.8%) |
| $50,000 to $99,999 | 1,513 (21.5%) | 909 (14.1%) |
| $100,000 to $299,999 | 3,223 (45.9%) | 3,976 (61.5%) |
| $300,000 to $499,999 | 944 (13.4%) | 734 (11.4%) |
| $500,000 to $749,999 | 59 (0.8%) | 280 (4.3%) |
| $750,000 to $999,999 | 37 (0.5%) | 174 (2.7%) |
| $1,000,000 or more | 60 (0.9%) | 14 (0.2%) |
| Total | 7,030 (100.0%) | 6,463 (100.0%) |
Household Income by Mortgage Status in Walker County
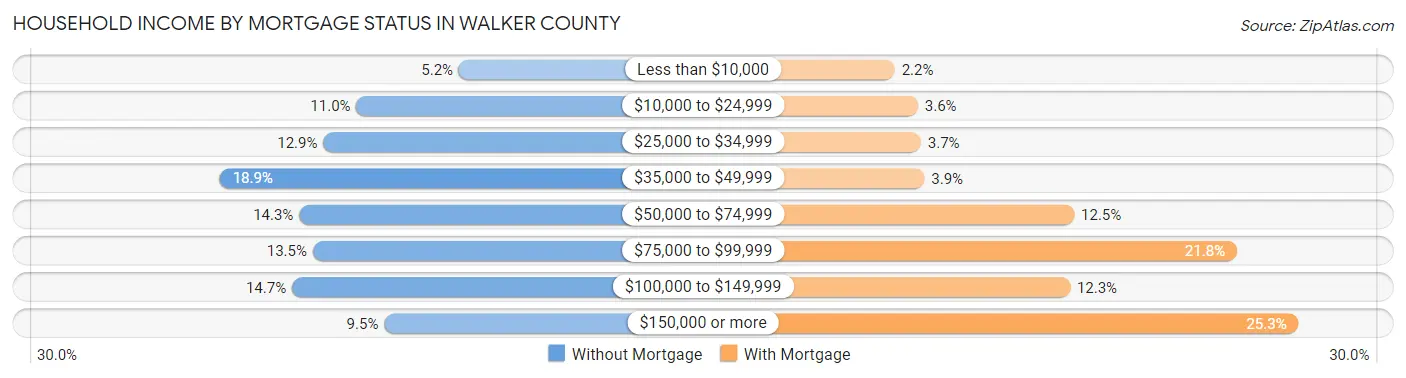
| Household Income | Without Mortgage | With Mortgage |
| Less than $10,000 | 364 (5.2%) | 145 (2.2%) |
| $10,000 to $24,999 | 776 (11.0%) | 230 (3.6%) |
| $25,000 to $34,999 | 909 (12.9%) | 241 (3.7%) |
| $35,000 to $49,999 | 1,325 (18.9%) | 254 (3.9%) |
| $50,000 to $74,999 | 1,006 (14.3%) | 807 (12.5%) |
| $75,000 to $99,999 | 951 (13.5%) | 1,409 (21.8%) |
| $100,000 to $149,999 | 1,035 (14.7%) | 792 (12.2%) |
| $150,000 or more | 664 (9.5%) | 1,636 (25.3%) |
| Total | 7,030 (100.0%) | 6,463 (100.0%) |
Property Value to Household Income Ratio in Walker County
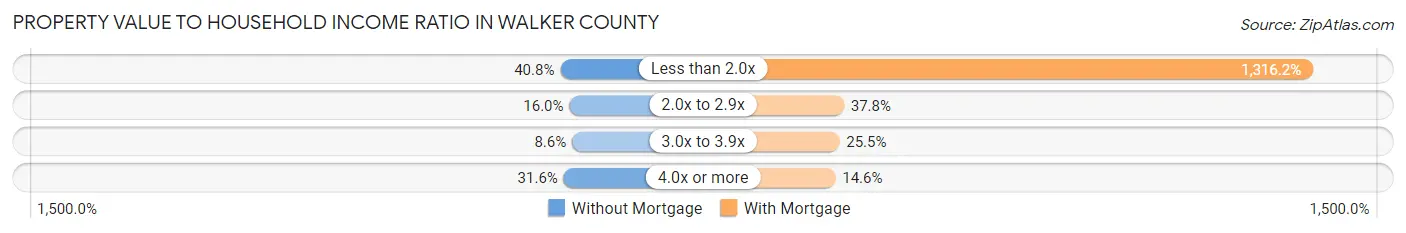
| Value-to-Income Ratio | Without Mortgage | With Mortgage |
| Less than 2.0x | 2,871 (40.8%) | 85,068 (1,316.2%) |
| 2.0x to 2.9x | 1,127 (16.0%) | 2,443 (37.8%) |
| 3.0x to 3.9x | 607 (8.6%) | 1,648 (25.5%) |
| 4.0x or more | 2,218 (31.6%) | 943 (14.6%) |
| Total | 7,030 (100.0%) | 6,463 (100.0%) |
Real Estate Taxes by Mortgage Status in Walker County
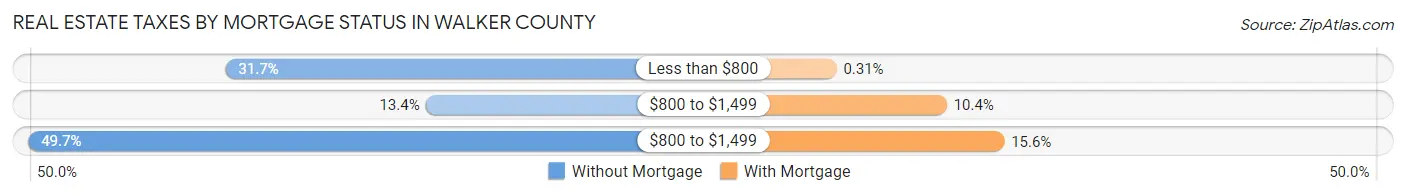
| Property Taxes | Without Mortgage | With Mortgage |
| Less than $800 | 2,226 (31.7%) | 20 (0.3%) |
| $800 to $1,499 | 941 (13.4%) | 671 (10.4%) |
| $800 to $1,499 | 3,492 (49.7%) | 1,010 (15.6%) |
| Total | 7,030 (100.0%) | 6,463 (100.0%) |
Health & Disability in Walker County
Health Insurance Coverage by Age in Walker County
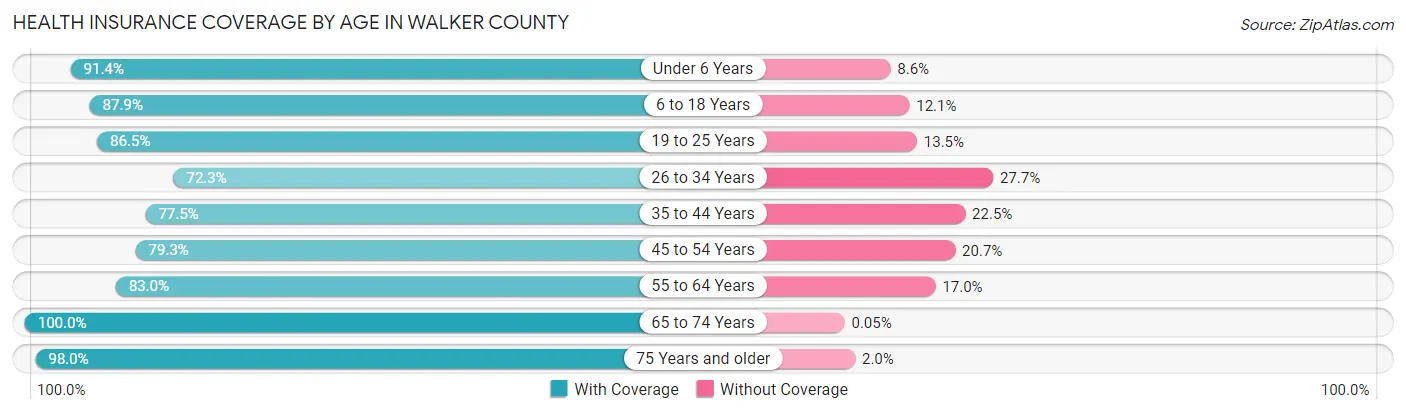
| Age Bracket | With Coverage | Without Coverage |
| Under 6 Years | 3,193 (91.4%) | 300 (8.6%) |
| 6 to 18 Years | 7,885 (87.9%) | 1,087 (12.1%) |
| 19 to 25 Years | 11,974 (86.5%) | 1,873 (13.5%) |
| 26 to 34 Years | 5,576 (72.3%) | 2,141 (27.7%) |
| 35 to 44 Years | 5,583 (77.5%) | 1,625 (22.5%) |
| 45 to 54 Years | 5,553 (79.3%) | 1,447 (20.7%) |
| 55 to 64 Years | 5,503 (83.0%) | 1,127 (17.0%) |
| 65 to 74 Years | 5,581 (100.0%) | 3 (0.1%) |
| 75 Years and older | 3,869 (98.0%) | 79 (2.0%) |
| Total | 54,717 (85.0%) | 9,682 (15.0%) |
Health Insurance Coverage by Citizenship Status in Walker County
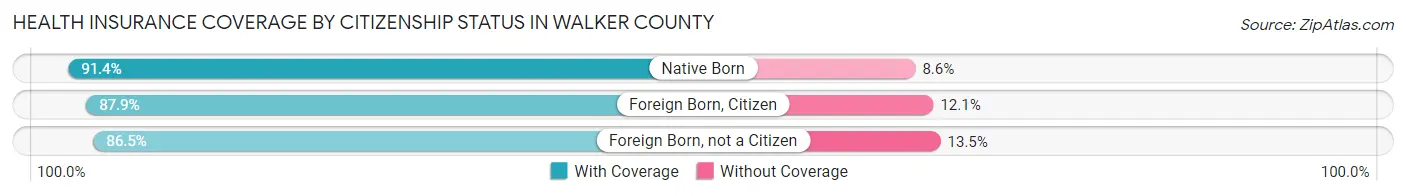
| Citizenship Status | With Coverage | Without Coverage |
| Native Born | 3,193 (91.4%) | 300 (8.6%) |
| Foreign Born, Citizen | 7,885 (87.9%) | 1,087 (12.1%) |
| Foreign Born, not a Citizen | 11,974 (86.5%) | 1,873 (13.5%) |
Health Insurance Coverage by Household Income in Walker County
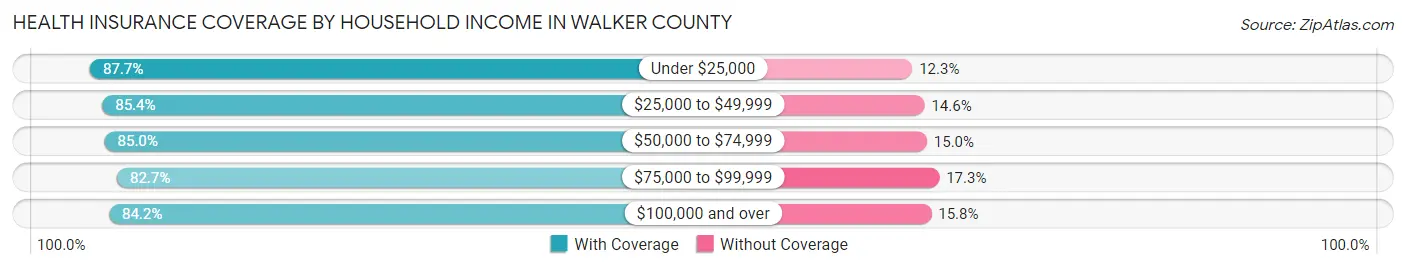
| Household Income | With Coverage | Without Coverage |
| Under $25,000 | 10,258 (87.7%) | 1,434 (12.3%) |
| $25,000 to $49,999 | 11,834 (85.4%) | 2,017 (14.6%) |
| $50,000 to $74,999 | 8,918 (85.0%) | 1,574 (15.0%) |
| $75,000 to $99,999 | 6,487 (82.7%) | 1,359 (17.3%) |
| $100,000 and over | 14,065 (84.2%) | 2,646 (15.8%) |
Public vs Private Health Insurance Coverage by Age in Walker County
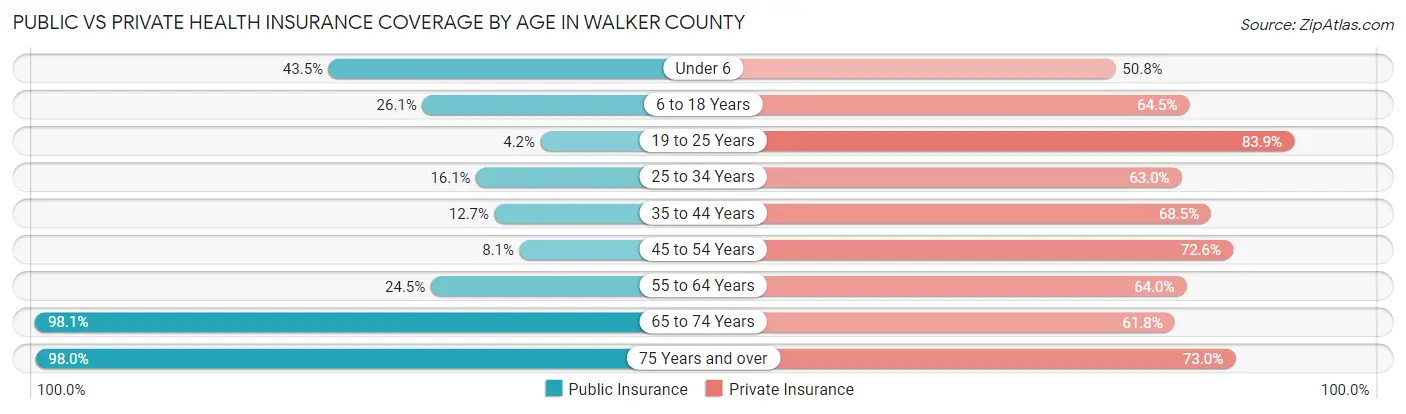
| Age Bracket | Public Insurance | Private Insurance |
| Under 6 | 1,520 (43.5%) | 1,774 (50.8%) |
| 6 to 18 Years | 2,343 (26.1%) | 5,786 (64.5%) |
| 19 to 25 Years | 578 (4.2%) | 11,620 (83.9%) |
| 25 to 34 Years | 1,245 (16.1%) | 4,865 (63.0%) |
| 35 to 44 Years | 916 (12.7%) | 4,940 (68.5%) |
| 45 to 54 Years | 565 (8.1%) | 5,080 (72.6%) |
| 55 to 64 Years | 1,627 (24.5%) | 4,240 (63.9%) |
| 65 to 74 Years | 5,476 (98.1%) | 3,449 (61.8%) |
| 75 Years and over | 3,869 (98.0%) | 2,882 (73.0%) |
| Total | 18,139 (28.2%) | 44,636 (69.3%) |
Disability Status by Sex by Age in Walker County
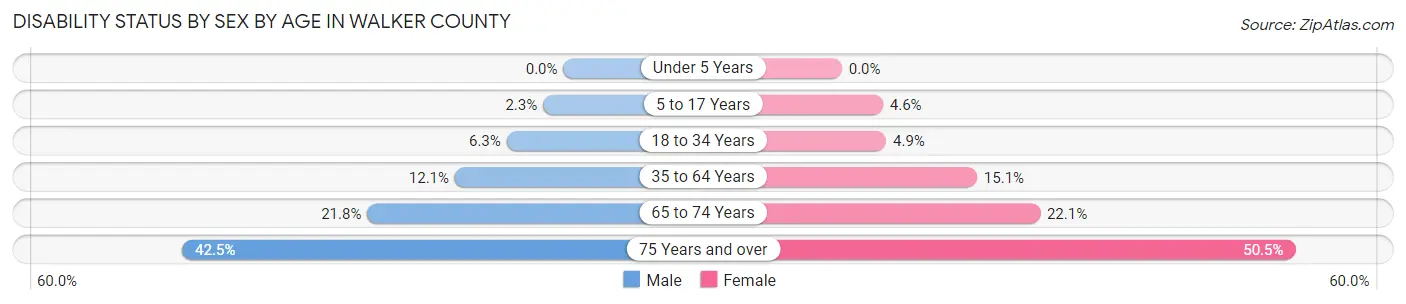
| Age Bracket | Male | Female |
| Under 5 Years | 0 (0.0%) | 0 (0.0%) |
| 5 to 17 Years | 95 (2.3%) | 165 (4.6%) |
| 18 to 34 Years | 749 (6.3%) | 560 (4.9%) |
| 35 to 64 Years | 1,318 (12.1%) | 1,494 (15.0%) |
| 65 to 74 Years | 583 (21.8%) | 643 (22.1%) |
| 75 Years and over | 696 (42.5%) | 1,166 (50.5%) |
Disability Class by Sex by Age in Walker County
Disability Class: Hearing Difficulty
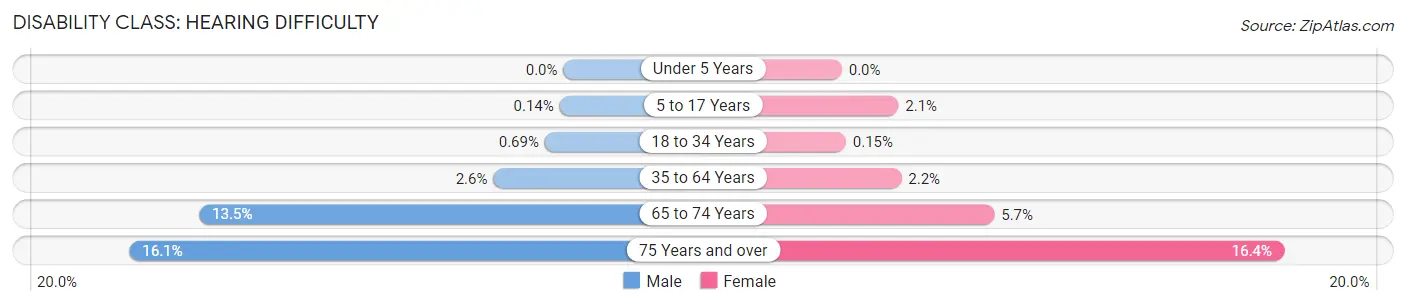
| Age Bracket | Male | Female |
| Under 5 Years | 0 (0.0%) | 0 (0.0%) |
| 5 to 17 Years | 6 (0.1%) | 76 (2.1%) |
| 18 to 34 Years | 82 (0.7%) | 17 (0.2%) |
| 35 to 64 Years | 284 (2.6%) | 219 (2.2%) |
| 65 to 74 Years | 361 (13.5%) | 165 (5.7%) |
| 75 Years and over | 264 (16.1%) | 379 (16.4%) |
Disability Class: Vision Difficulty
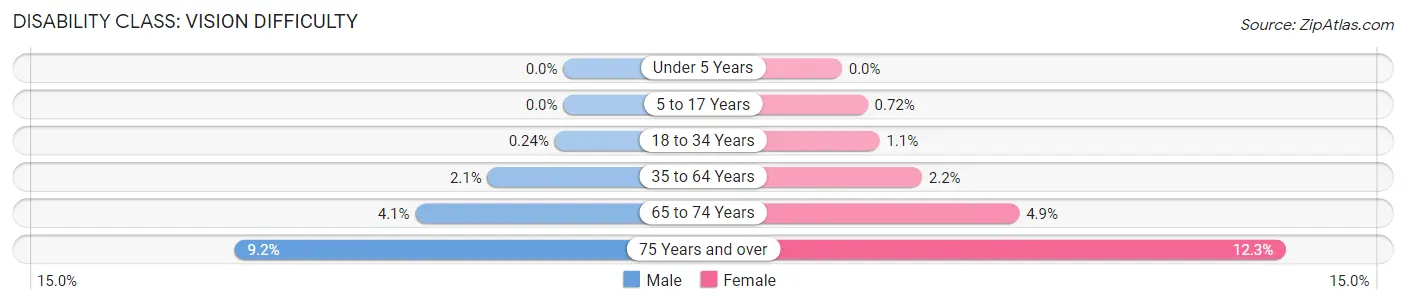
| Age Bracket | Male | Female |
| Under 5 Years | 0 (0.0%) | 0 (0.0%) |
| 5 to 17 Years | 0 (0.0%) | 26 (0.7%) |
| 18 to 34 Years | 29 (0.2%) | 119 (1.1%) |
| 35 to 64 Years | 230 (2.1%) | 221 (2.2%) |
| 65 to 74 Years | 110 (4.1%) | 144 (4.9%) |
| 75 Years and over | 150 (9.1%) | 285 (12.3%) |
Disability Class: Cognitive Difficulty
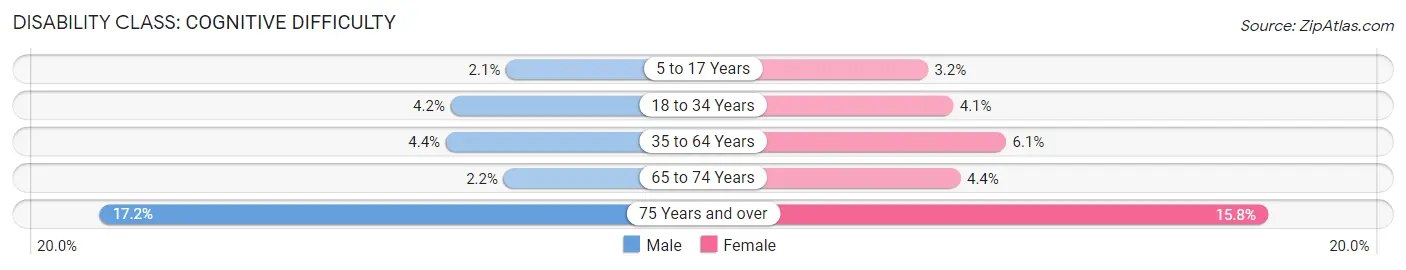
| Age Bracket | Male | Female |
| 5 to 17 Years | 89 (2.1%) | 115 (3.2%) |
| 18 to 34 Years | 495 (4.2%) | 468 (4.1%) |
| 35 to 64 Years | 476 (4.4%) | 604 (6.1%) |
| 65 to 74 Years | 59 (2.2%) | 128 (4.4%) |
| 75 Years and over | 282 (17.2%) | 365 (15.8%) |
Disability Class: Ambulatory Difficulty
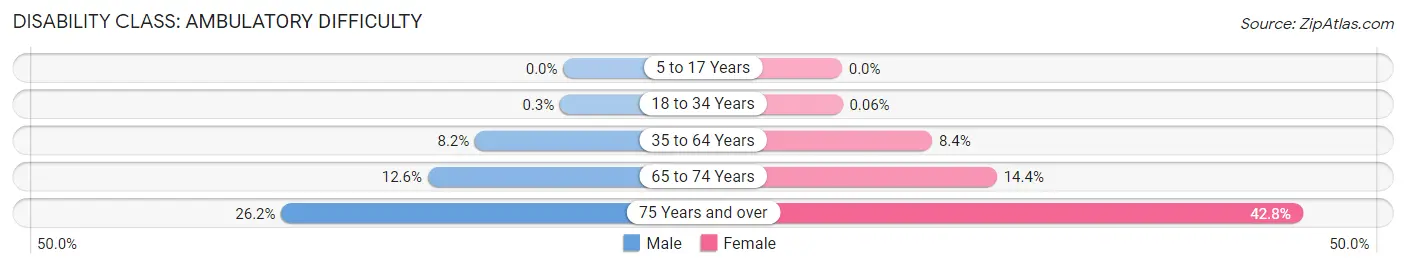
| Age Bracket | Male | Female |
| 5 to 17 Years | 0 (0.0%) | 0 (0.0%) |
| 18 to 34 Years | 36 (0.3%) | 7 (0.1%) |
| 35 to 64 Years | 894 (8.2%) | 831 (8.4%) |
| 65 to 74 Years | 336 (12.6%) | 419 (14.4%) |
| 75 Years and over | 429 (26.2%) | 987 (42.7%) |
Disability Class: Self-Care Difficulty
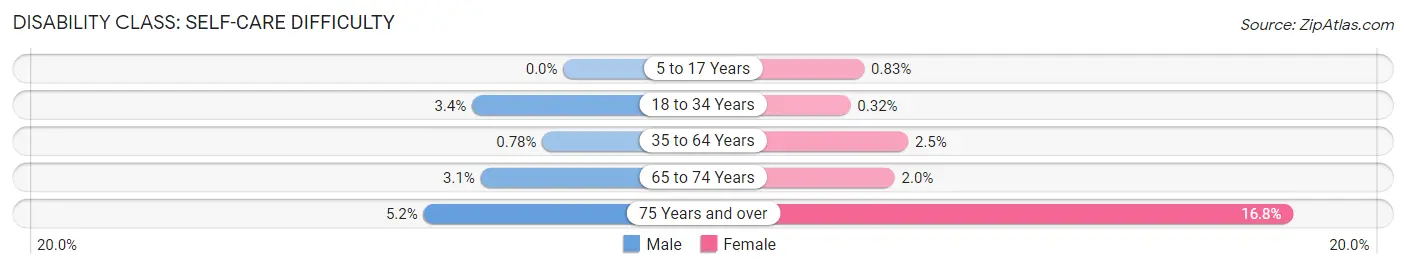
| Age Bracket | Male | Female |
| 5 to 17 Years | 0 (0.0%) | 30 (0.8%) |
| 18 to 34 Years | 402 (3.4%) | 36 (0.3%) |
| 35 to 64 Years | 85 (0.8%) | 244 (2.5%) |
| 65 to 74 Years | 82 (3.1%) | 57 (2.0%) |
| 75 Years and over | 85 (5.2%) | 387 (16.8%) |
Technology Access in Walker County
Computing Device Access in Walker County
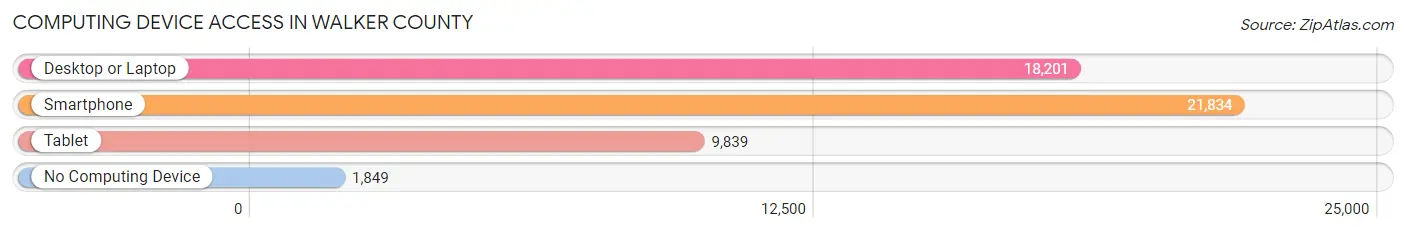
| Device Type | # Households | % Households |
| Desktop or Laptop | 18,201 | 74.0% |
| Smartphone | 21,834 | 88.8% |
| Tablet | 9,839 | 40.0% |
| No Computing Device | 1,849 | 7.5% |
| Total | 24,592 | 100.0% |
Internet Access in Walker County
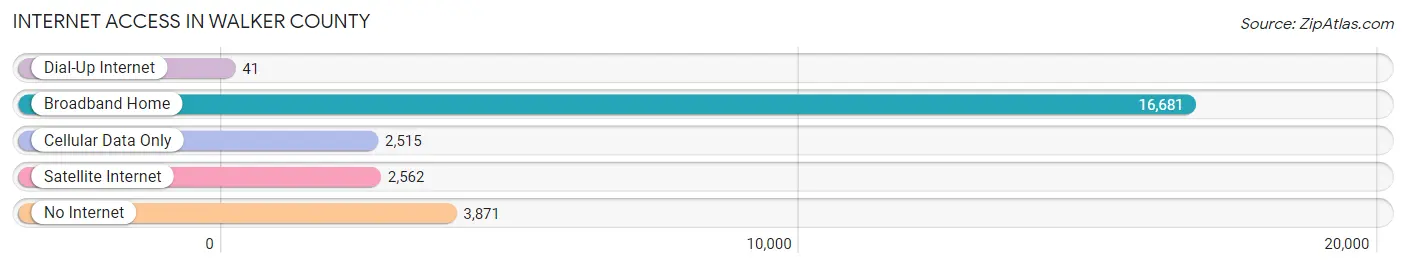
| Internet Type | # Households | % Households |
| Dial-Up Internet | 41 | 0.2% |
| Broadband Home | 16,681 | 67.8% |
| Cellular Data Only | 2,515 | 10.2% |
| Satellite Internet | 2,562 | 10.4% |
| No Internet | 3,871 | 15.7% |
| Total | 24,592 | 100.0% |
Walker County Summary
History
Walker County, Texas is located in the East Texas region of the state and is part of the Houston-The Woodlands-Sugar Land metropolitan area. The county was established in 1846 and named after Samuel Walker, a soldier in the Texas Revolution. The county seat is Huntsville, which is also the home of Sam Houston State University.
The area that is now Walker County was originally inhabited by the Atakapan and Alabama-Coushatta tribes. The first European settlers arrived in the area in the early 19th century, and the county was officially established in 1846. The county was largely agricultural, with cotton and corn being the main crops. The county also had a thriving timber industry, and the town of Huntsville became a major center for the lumber industry.
In the late 19th century, the county began to experience a population boom as the railroad arrived in the area. This led to the development of several small towns, such as Riverside, New Waverly, and Riverside. The county also experienced a surge in population during the Great Depression, as many people moved to the area in search of work.
Geography
Walker County is located in the East Texas region of the state and is bordered by Madison County to the north, San Jacinto County to the east, Montgomery County to the south, and Grimes County to the west. The county covers an area of 845 square miles and is home to a population of approximately 67,000 people.
The terrain of Walker County is mostly flat, with some rolling hills in the northern part of the county. The county is drained by the Trinity River and its tributaries, including the San Jacinto River, the Navasota River, and the East Fork of the San Jacinto River. The county is also home to several lakes, including Lake Conroe, Lake Livingston, and Lake Raven.
Economy
Walker County’s economy is largely based on agriculture, with cotton, corn, and soybeans being the main crops. The county also has a thriving timber industry, and the town of Huntsville is home to several lumber mills.
The county is also home to several manufacturing companies, including Huntsville Manufacturing, which produces automotive parts, and Huntsville Plastics, which produces plastic products. The county is also home to several oil and gas companies, including ExxonMobil and Chevron.
The county is also home to several educational institutions, including Sam Houston State University, which is located in Huntsville. The university is the third-largest university in the state and is home to more than 20,000 students.
Demographics
As of the 2010 census, Walker County had a population of 67,863 people. The racial makeup of the county was 79.2% White, 15.3% African American, 0.7% Native American, 0.7% Asian, 0.1% Pacific Islander, 2.3% from other races, and 1.9% from two or more races. Hispanic or Latino of any race were 8.2% of the population.
The median income for a household in the county was $41,945, and the median income for a family was $50,945. The per capita income for the county was $20,945. About 14.2% of the population was below the poverty line.
Common Questions
What is Per Capita Income in Walker County?
Per Capita income in Walker County is $23,220.
What is the Median Family Income in Walker County?
Median Family Income in Walker County is $70,169.
What is the Median Household income in Walker County?
Median Household Income in Walker County is $47,193.
What is Income or Wage Gap in Walker County?
Income or Wage Gap in Walker County is 27.1%.
Women in Walker County earn 72.9 cents for every dollar earned by a man.
What is Family Income Deficit in Walker County?
Family Income Deficit in Walker County is $12,467.
Families that are below poverty line in Walker County earn $12,467 less on average than the poverty threshold level.
What is Inequality or Gini Index in Walker County?
Inequality or Gini Index in Walker County is 0.47.
What is the Total Population of Walker County?
Total Population of Walker County is 77,182.
What is the Total Male Population of Walker County?
Total Male Population of Walker County is 45,638.
What is the Total Female Population of Walker County?
Total Female Population of Walker County is 31,544.
What is the Ratio of Males per 100 Females in Walker County?
There are 144.68 Males per 100 Females in Walker County.
What is the Ratio of Females per 100 Males in Walker County?
There are 69.12 Females per 100 Males in Walker County.
What is the Median Population Age in Walker County?
Median Population Age in Walker County is 36.5 Years.
What is the Average Family Size in Walker County
Average Family Size in Walker County is 3.3 People.
What is the Average Household Size in Walker County
Average Household Size in Walker County is 2.5 People.
How Large is the Labor Force in Walker County?
There are 31,375 People in the Labor Forcein in Walker County.
What is the Percentage of People in the Labor Force in Walker County?
46.5% of People are in the Labor Force in Walker County.
What is the Unemployment Rate in Walker County?
Unemployment Rate in Walker County is 7.0%.