Van Zandt County, TX Map & Demographics
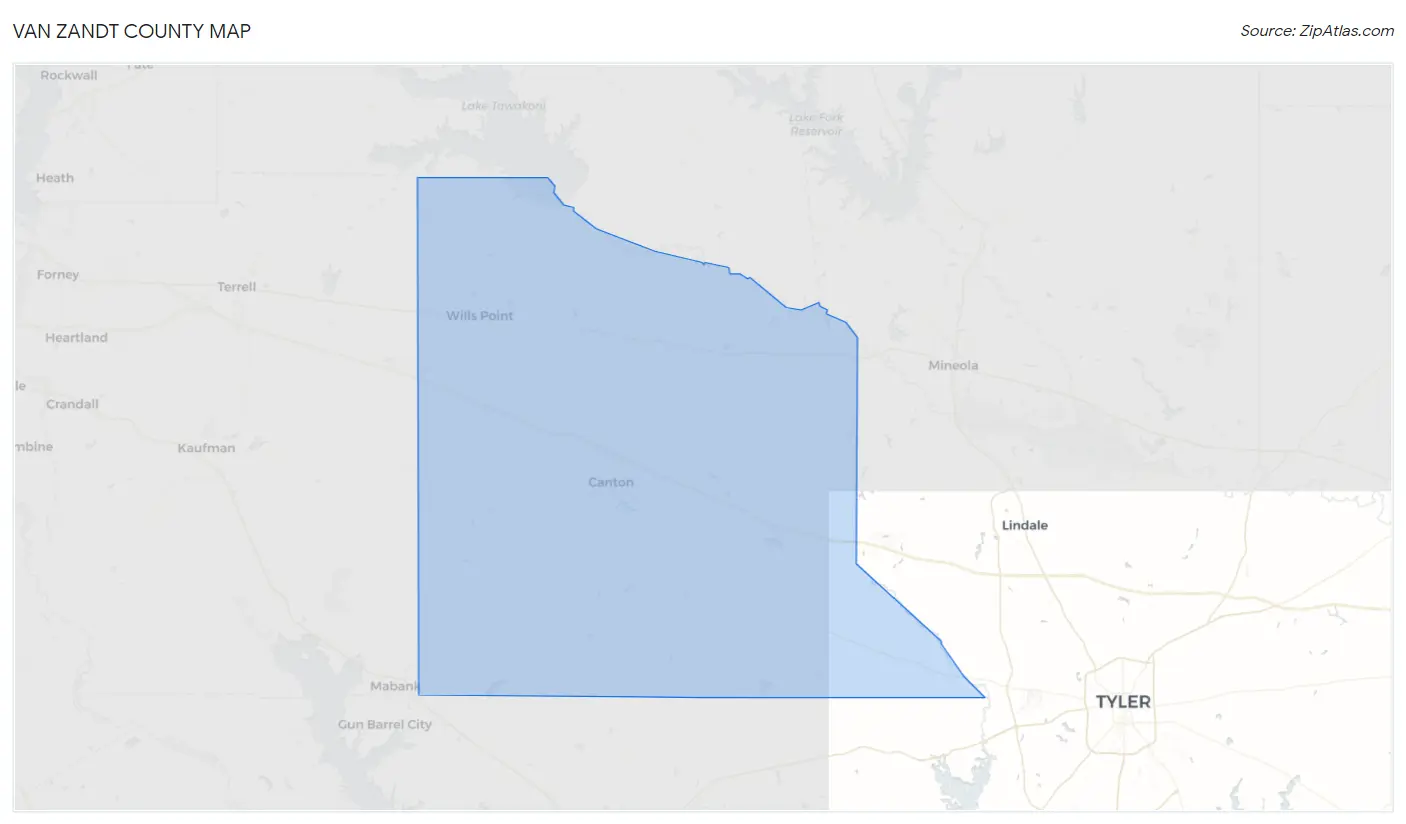
Van Zandt County Map
Van Zandt County Overview
$33,092
PER CAPITA INCOME
$75,313
AVG FAMILY INCOME
$62,334
AVG HOUSEHOLD INCOME
38.6%
WAGE / INCOME GAP [ % ]
61.4¢/ $1
WAGE / INCOME GAP [ $ ]
$9,495
FAMILY INCOME DEFICIT
0.47
INEQUALITY / GINI INDEX
60,053
TOTAL POPULATION
29,603
MALE POPULATION
30,450
FEMALE POPULATION
97.22
MALES / 100 FEMALES
102.86
FEMALES / 100 MALES
42.0
MEDIAN AGE
3.1
AVG FAMILY SIZE
2.7
AVG HOUSEHOLD SIZE
26,171
LABOR FORCE [ PEOPLE ]
54.5%
PERCENT IN LABOR FORCE
3.1%
UNEMPLOYMENT RATE
Income in Van Zandt County
Income Overview in Van Zandt County
Per Capita Income in Van Zandt County is $33,092, while median incomes of families and households are $75,313 and $62,334 respectively.
| Characteristic | Number | Measure |
| Per Capita Income | 60,053 | $33,092 |
| Median Family Income | 16,143 | $75,313 |
| Mean Family Income | 16,143 | $98,072 |
| Median Household Income | 22,326 | $62,334 |
| Mean Household Income | 22,326 | $85,932 |
| Income Deficit | 16,143 | $9,495 |
| Wage / Income Gap (%) | 60,053 | 38.56% |
| Wage / Income Gap ($) | 60,053 | 61.44¢ per $1 |
| Gini / Inequality Index | 60,053 | 0.47 |
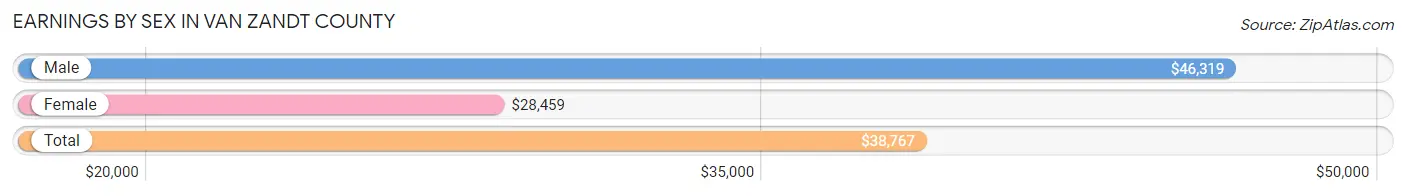
Earnings by Sex in Van Zandt County
Average Earnings in Van Zandt County are $38,767, $46,319 for men and $28,459 for women, a difference of 38.6%.
| Sex | Number | Average Earnings |
| Male | 15,528 (56.7%) | $46,319 |
| Female | 11,855 (43.3%) | $28,459 |
| Total | 27,383 (100.0%) | $38,767 |
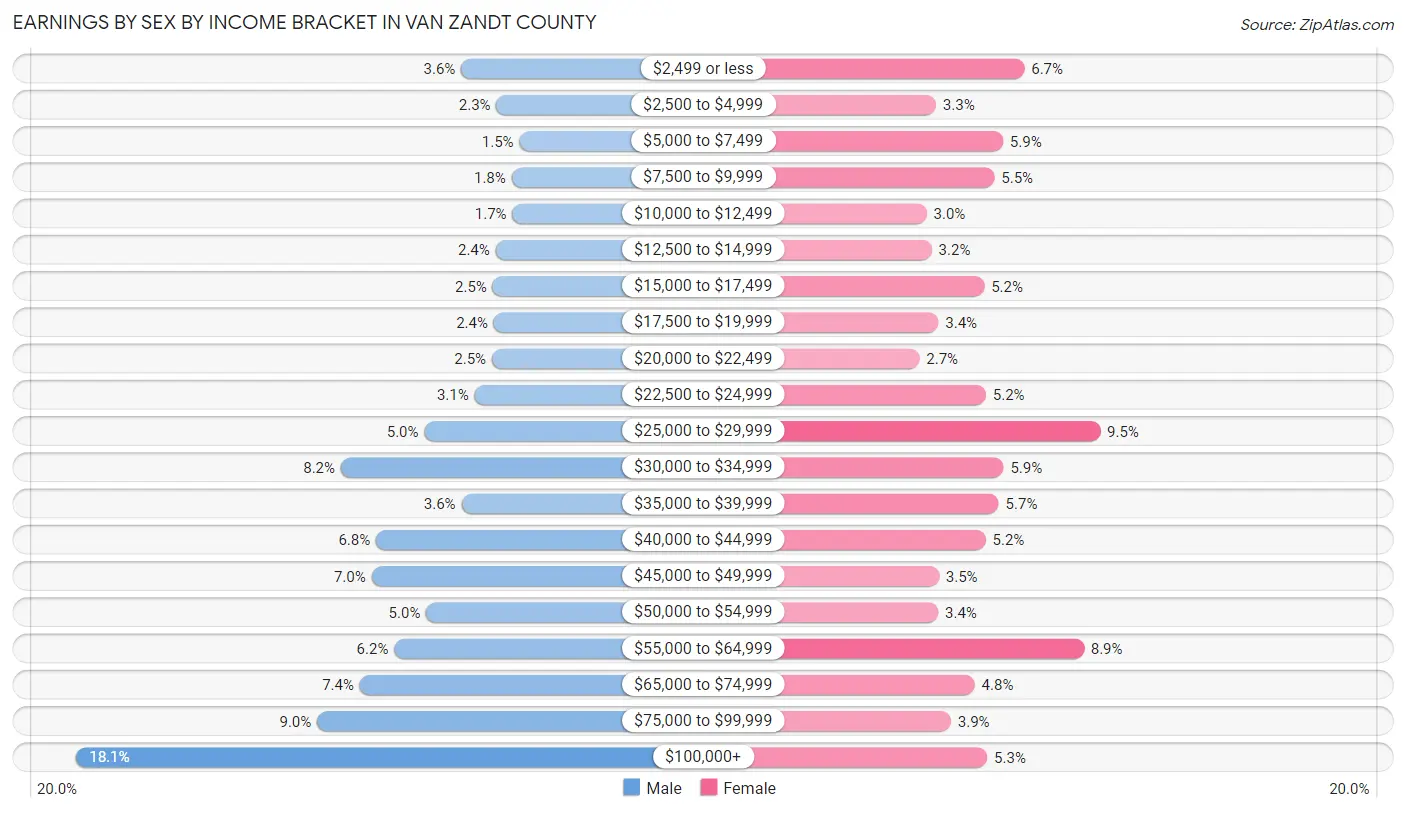
Earnings by Sex by Income Bracket in Van Zandt County
The most common earnings brackets in Van Zandt County are $100,000+ for men (2,805 | 18.1%) and $25,000 to $29,999 for women (1,125 | 9.5%).
| Income | Male | Female |
| $2,499 or less | 565 (3.6%) | 788 (6.7%) |
| $2,500 to $4,999 | 361 (2.3%) | 396 (3.3%) |
| $5,000 to $7,499 | 226 (1.5%) | 693 (5.9%) |
| $7,500 to $9,999 | 272 (1.8%) | 656 (5.5%) |
| $10,000 to $12,499 | 267 (1.7%) | 355 (3.0%) |
| $12,500 to $14,999 | 365 (2.4%) | 377 (3.2%) |
| $15,000 to $17,499 | 382 (2.5%) | 611 (5.1%) |
| $17,500 to $19,999 | 376 (2.4%) | 407 (3.4%) |
| $20,000 to $22,499 | 386 (2.5%) | 322 (2.7%) |
| $22,500 to $24,999 | 487 (3.1%) | 618 (5.2%) |
| $25,000 to $29,999 | 779 (5.0%) | 1,125 (9.5%) |
| $30,000 to $34,999 | 1,265 (8.2%) | 696 (5.9%) |
| $35,000 to $39,999 | 563 (3.6%) | 675 (5.7%) |
| $40,000 to $44,999 | 1,060 (6.8%) | 616 (5.2%) |
| $45,000 to $49,999 | 1,087 (7.0%) | 409 (3.5%) |
| $50,000 to $54,999 | 769 (5.0%) | 405 (3.4%) |
| $55,000 to $64,999 | 955 (6.1%) | 1,053 (8.9%) |
| $65,000 to $74,999 | 1,155 (7.4%) | 568 (4.8%) |
| $75,000 to $99,999 | 1,403 (9.0%) | 462 (3.9%) |
| $100,000+ | 2,805 (18.1%) | 623 (5.3%) |
| Total | 15,528 (100.0%) | 11,855 (100.0%) |
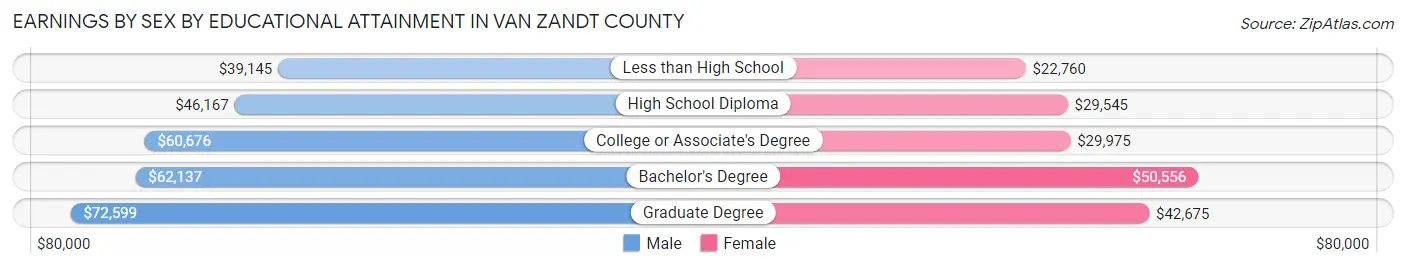
Earnings by Sex by Educational Attainment in Van Zandt County
Average earnings in Van Zandt County are $50,511 for men and $31,438 for women, a difference of 37.8%. Men with an educational attainment of graduate degree enjoy the highest average annual earnings of $72,599, while those with less than high school education earn the least with $39,145. Women with an educational attainment of bachelor's degree earn the most with the average annual earnings of $50,556, while those with less than high school education have the smallest earnings of $22,760.
| Educational Attainment | Male Income | Female Income |
| Less than High School | $39,145 | $22,760 |
| High School Diploma | $46,167 | $29,545 |
| College or Associate's Degree | $60,676 | $29,975 |
| Bachelor's Degree | $62,137 | $50,556 |
| Graduate Degree | $72,599 | $42,675 |
| Total | $50,511 | $31,438 |
Family Income in Van Zandt County
Family Income Brackets in Van Zandt County
According to the Van Zandt County family income data, there are 3,309 families falling into the $100,000 to $149,999 income range, which is the most common income bracket and makes up 20.5% of all families. Conversely, the $10,000 to $14,999 income bracket is the least frequent group with only 355 families (2.2%) belonging to this category.
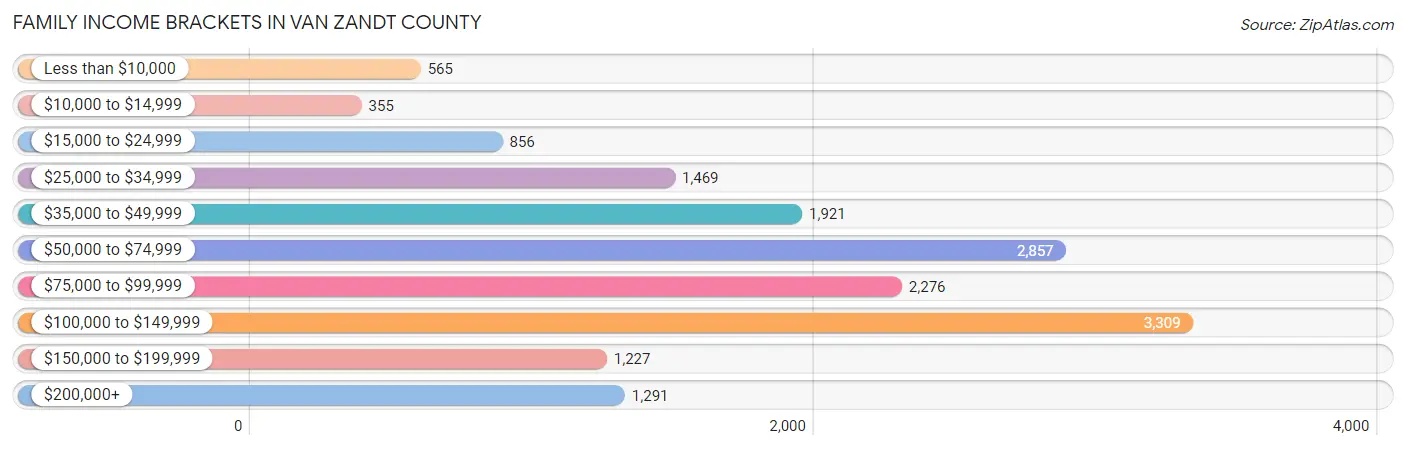
| Income Bracket | # Families | % Families |
| Less than $10,000 | 565 | 3.5% |
| $10,000 to $14,999 | 355 | 2.2% |
| $15,000 to $24,999 | 856 | 5.3% |
| $25,000 to $34,999 | 1,469 | 9.1% |
| $35,000 to $49,999 | 1,921 | 11.9% |
| $50,000 to $74,999 | 2,857 | 17.7% |
| $75,000 to $99,999 | 2,276 | 14.1% |
| $100,000 to $149,999 | 3,309 | 20.5% |
| $150,000 to $199,999 | 1,227 | 7.6% |
| $200,000+ | 1,291 | 8.0% |
Family Income by Famaliy Size in Van Zandt County
7+ person families (291 | 1.8%) account for the highest median family income in Van Zandt County with $170,583 per family, while 2-person families (7,878 | 48.8%) have the highest median income of $32,806 per family member.
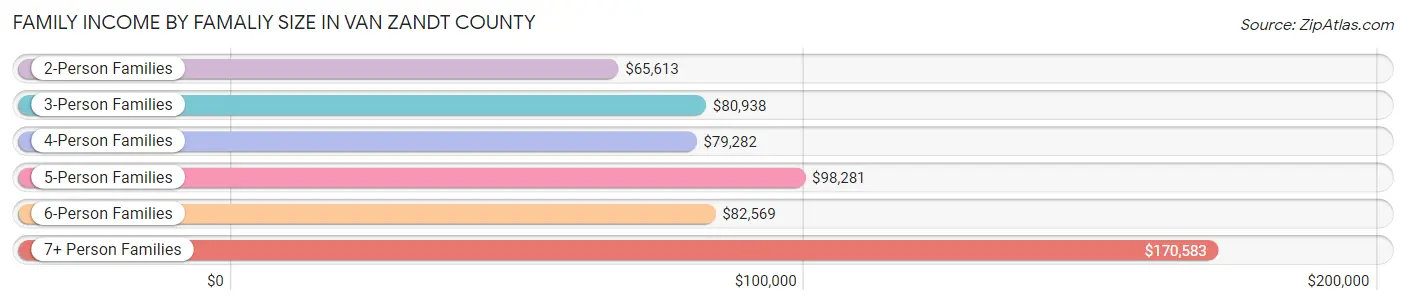
| Income Bracket | # Families | Median Income |
| 2-Person Families | 7,878 (48.8%) | $65,613 |
| 3-Person Families | 3,608 (22.4%) | $80,938 |
| 4-Person Families | 2,313 (14.3%) | $79,282 |
| 5-Person Families | 1,454 (9.0%) | $98,281 |
| 6-Person Families | 599 (3.7%) | $82,569 |
| 7+ Person Families | 291 (1.8%) | $170,583 |
| Total | 16,143 (100.0%) | $75,313 |
Family Income by Number of Earners in Van Zandt County
The median family income in Van Zandt County is $75,313, with families comprising 3+ earners (1,687) having the highest median family income of $114,965, while families with no earners (3,120) have the lowest median family income of $37,967, accounting for 10.4% and 19.3% of families, respectively.
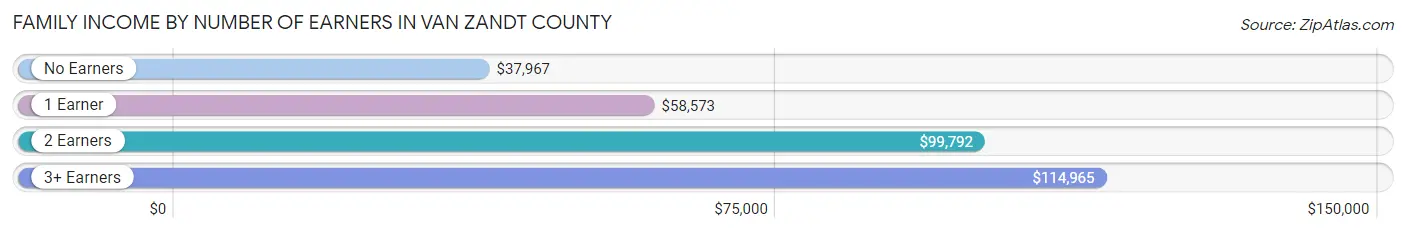
| Number of Earners | # Families | Median Income |
| No Earners | 3,120 (19.3%) | $37,967 |
| 1 Earner | 5,667 (35.1%) | $58,573 |
| 2 Earners | 5,669 (35.1%) | $99,792 |
| 3+ Earners | 1,687 (10.4%) | $114,965 |
| Total | 16,143 (100.0%) | $75,313 |
Household Income in Van Zandt County
Household Income Brackets in Van Zandt County
With 3,840 households falling in the category, the $50,000 to $74,999 income range is the most frequent in Van Zandt County, accounting for 17.2% of all households. In contrast, only 1,005 households (4.5%) fall into the less than $10,000 income bracket, making it the least populous group.
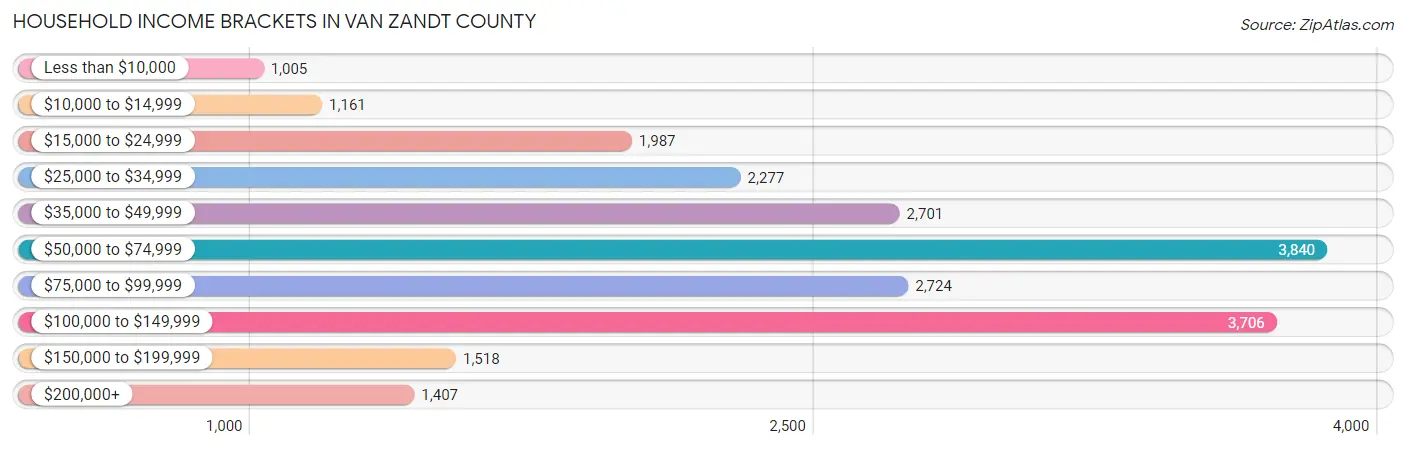
| Income Bracket | # Households | % Households |
| Less than $10,000 | 1,005 | 4.5% |
| $10,000 to $14,999 | 1,161 | 5.2% |
| $15,000 to $24,999 | 1,987 | 8.9% |
| $25,000 to $34,999 | 2,277 | 10.2% |
| $35,000 to $49,999 | 2,701 | 12.1% |
| $50,000 to $74,999 | 3,840 | 17.2% |
| $75,000 to $99,999 | 2,724 | 12.2% |
| $100,000 to $149,999 | 3,706 | 16.6% |
| $150,000 to $199,999 | 1,518 | 6.8% |
| $200,000+ | 1,407 | 6.3% |
Household Income by Householder Age in Van Zandt County
The median household income in Van Zandt County is $62,334, with the highest median household income of $80,938 found in the 45 to 64 years age bracket for the primary householder. A total of 8,107 households (36.3%) fall into this category. Meanwhile, the 65+ years age bracket for the primary householder has the lowest median household income of $41,817, with 7,628 households (34.2%) in this group.
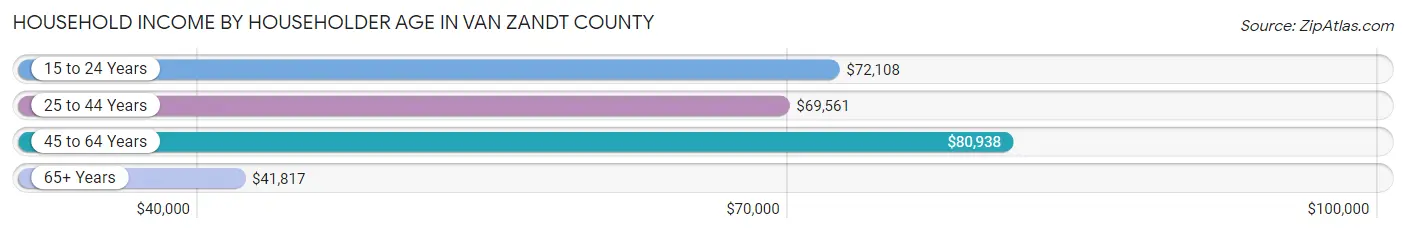
| Income Bracket | # Households | Median Income |
| 15 to 24 Years | 694 (3.1%) | $72,108 |
| 25 to 44 Years | 5,897 (26.4%) | $69,561 |
| 45 to 64 Years | 8,107 (36.3%) | $80,938 |
| 65+ Years | 7,628 (34.2%) | $41,817 |
| Total | 22,326 (100.0%) | $62,334 |
Poverty in Van Zandt County
Income Below Poverty by Sex and Age in Van Zandt County
With 11.4% poverty level for males and 14.8% for females among the residents of Van Zandt County, 12 to 14 year old males and under 5 year old females are the most vulnerable to poverty, with 196 males (20.4%) and 422 females (26.5%) in their respective age groups living below the poverty level.
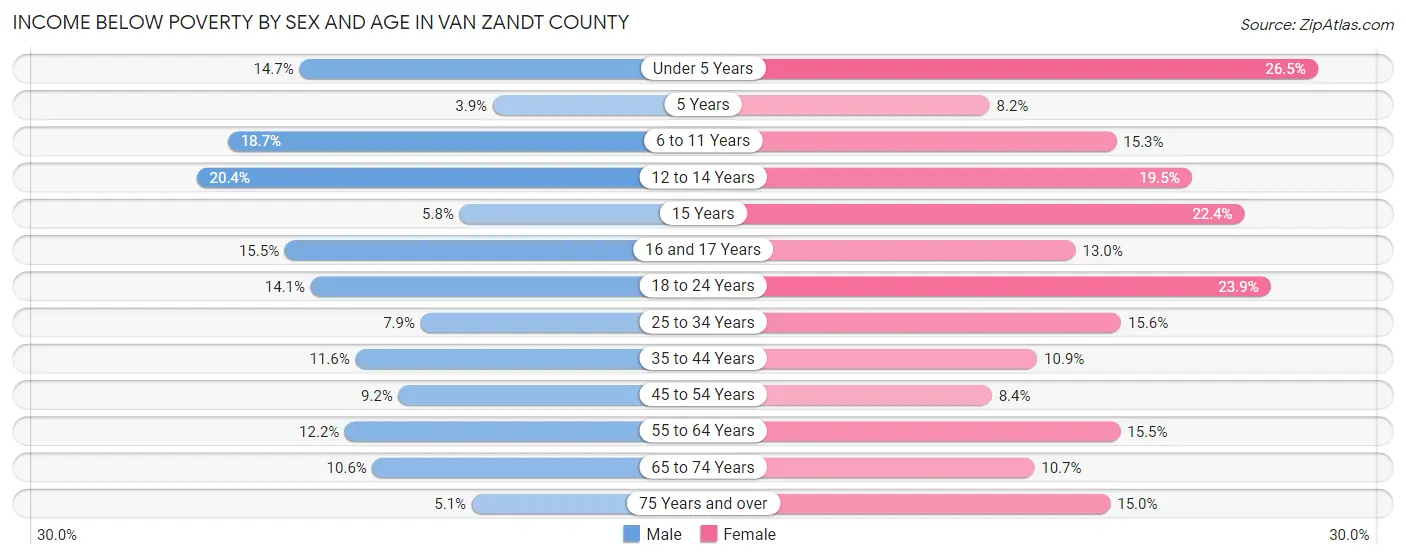
| Age Bracket | Male | Female |
| Under 5 Years | 263 (14.7%) | 422 (26.5%) |
| 5 Years | 23 (3.9%) | 19 (8.2%) |
| 6 to 11 Years | 401 (18.7%) | 322 (15.3%) |
| 12 to 14 Years | 196 (20.4%) | 264 (19.5%) |
| 15 Years | 24 (5.8%) | 87 (22.4%) |
| 16 and 17 Years | 135 (15.5%) | 106 (13.0%) |
| 18 to 24 Years | 318 (14.1%) | 546 (23.9%) |
| 25 to 34 Years | 265 (7.9%) | 509 (15.5%) |
| 35 to 44 Years | 393 (11.6%) | 389 (10.9%) |
| 45 to 54 Years | 330 (9.2%) | 308 (8.4%) |
| 55 to 64 Years | 523 (12.1%) | 661 (15.5%) |
| 65 to 74 Years | 349 (10.6%) | 389 (10.7%) |
| 75 Years and over | 109 (5.1%) | 409 (14.9%) |
| Total | 3,329 (11.4%) | 4,431 (14.8%) |
Income Above Poverty by Sex and Age in Van Zandt County
According to the poverty statistics in Van Zandt County, males aged 5 years and females aged 5 years are the age groups that are most secure financially, with 96.1% of males and 91.8% of females in these age groups living above the poverty line.
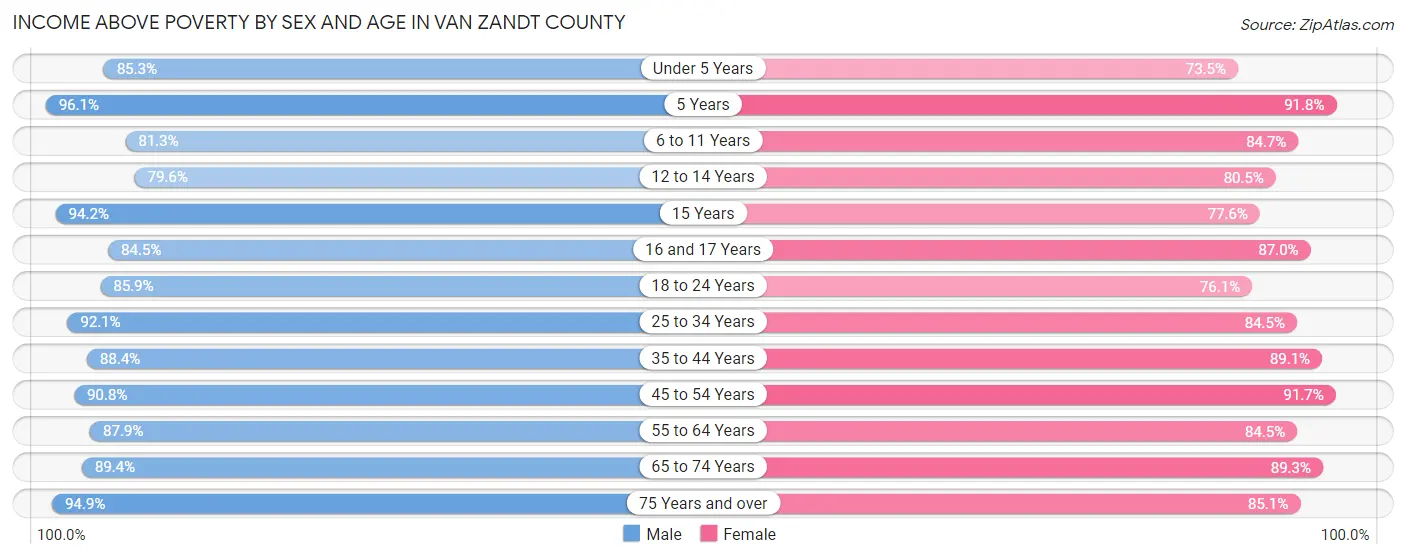
| Age Bracket | Male | Female |
| Under 5 Years | 1,527 (85.3%) | 1,171 (73.5%) |
| 5 Years | 564 (96.1%) | 212 (91.8%) |
| 6 to 11 Years | 1,744 (81.3%) | 1,784 (84.7%) |
| 12 to 14 Years | 764 (79.6%) | 1,092 (80.5%) |
| 15 Years | 392 (94.2%) | 301 (77.6%) |
| 16 and 17 Years | 736 (84.5%) | 708 (87.0%) |
| 18 to 24 Years | 1,943 (85.9%) | 1,741 (76.1%) |
| 25 to 34 Years | 3,072 (92.1%) | 2,765 (84.5%) |
| 35 to 44 Years | 3,005 (88.4%) | 3,185 (89.1%) |
| 45 to 54 Years | 3,268 (90.8%) | 3,380 (91.6%) |
| 55 to 64 Years | 3,781 (87.8%) | 3,602 (84.5%) |
| 65 to 74 Years | 2,938 (89.4%) | 3,240 (89.3%) |
| 75 Years and over | 2,031 (94.9%) | 2,327 (85.1%) |
| Total | 25,765 (88.6%) | 25,508 (85.2%) |
Income Below Poverty Among Married-Couple Families in Van Zandt County
The poverty statistics for married-couple families in Van Zandt County show that 5.9% or 742 of the total 12,518 families live below the poverty line. Families with 5 or more children have the highest poverty rate of 19.8%, comprising of 20 families. On the other hand, families with 1 or 2 children have the lowest poverty rate of 3.9%, which includes 147 families.
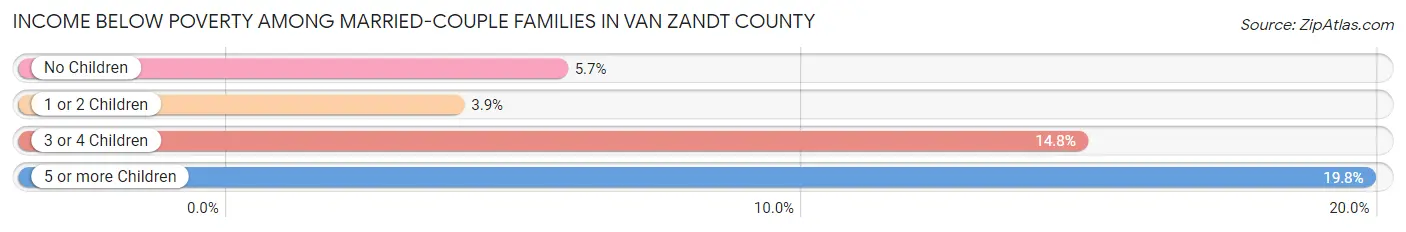
| Children | Above Poverty | Below Poverty |
| No Children | 7,389 (94.3%) | 450 (5.7%) |
| 1 or 2 Children | 3,586 (96.1%) | 147 (3.9%) |
| 3 or 4 Children | 720 (85.2%) | 125 (14.8%) |
| 5 or more Children | 81 (80.2%) | 20 (19.8%) |
| Total | 11,776 (94.1%) | 742 (5.9%) |
Income Below Poverty Among Single-Parent Households in Van Zandt County
According to the poverty data in Van Zandt County, 20.7% or 224 single-father households and 25.8% or 656 single-mother households are living below the poverty line. Among single-father households, those with 5 or more children have the highest poverty rate, with 11 households (64.7%) experiencing poverty. Likewise, among single-mother households, those with 3 or 4 children have the highest poverty rate, with 143 households (74.1%) falling below the poverty line.
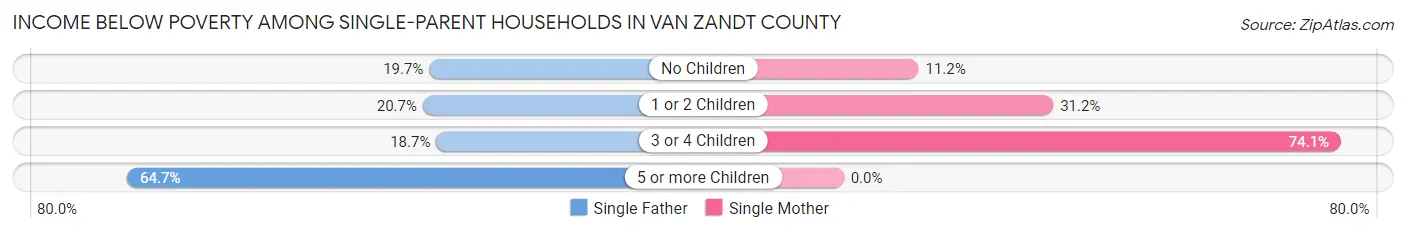
| Children | Single Father | Single Mother |
| No Children | 55 (19.7%) | 123 (11.2%) |
| 1 or 2 Children | 119 (20.7%) | 390 (31.2%) |
| 3 or 4 Children | 39 (18.7%) | 143 (74.1%) |
| 5 or more Children | 11 (64.7%) | 0 (0.0%) |
| Total | 224 (20.7%) | 656 (25.8%) |
Income Below Poverty Among Married-Couple vs Single-Parent Households in Van Zandt County
The poverty data for Van Zandt County shows that 742 of the married-couple family households (5.9%) and 880 of the single-parent households (24.3%) are living below the poverty level. Within the married-couple family households, those with 5 or more children have the highest poverty rate, with 20 households (19.8%) falling below the poverty line. Among the single-parent households, those with 5 or more children have the highest poverty rate, with 11 household (64.7%) living below poverty.
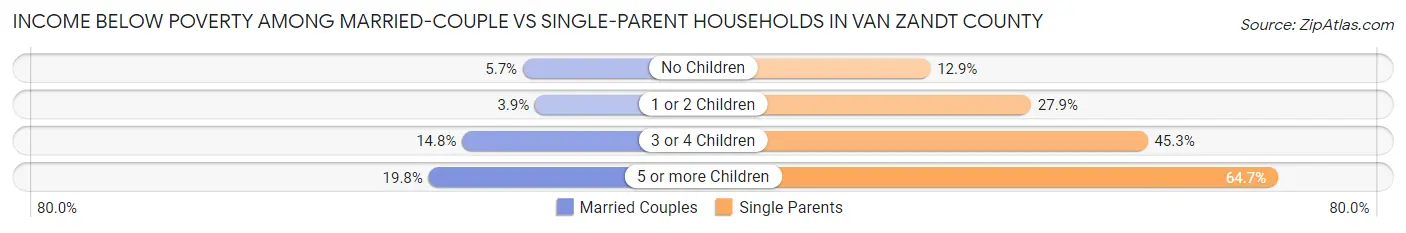
| Children | Married-Couple Families | Single-Parent Households |
| No Children | 450 (5.7%) | 178 (12.9%) |
| 1 or 2 Children | 147 (3.9%) | 509 (27.9%) |
| 3 or 4 Children | 125 (14.8%) | 182 (45.3%) |
| 5 or more Children | 20 (19.8%) | 11 (64.7%) |
| Total | 742 (5.9%) | 880 (24.3%) |
Race in Van Zandt County
The most populous races in Van Zandt County are White / Caucasian (54,017 | 89.9%), Hispanic or Latino (7,440 | 12.4%), and Two or more Races (2,410 | 4.0%).
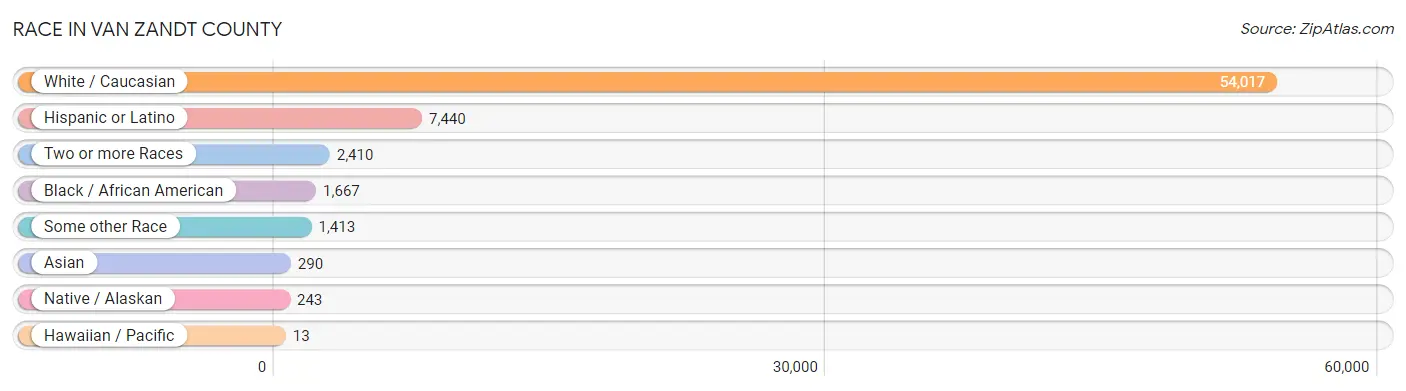
| Race | # Population | % Population |
| Asian | 290 | 0.5% |
| Black / African American | 1,667 | 2.8% |
| Hawaiian / Pacific | 13 | 0.0% |
| Hispanic or Latino | 7,440 | 12.4% |
| Native / Alaskan | 243 | 0.4% |
| White / Caucasian | 54,017 | 89.9% |
| Two or more Races | 2,410 | 4.0% |
| Some other Race | 1,413 | 2.4% |
| Total | 60,053 | 100.0% |
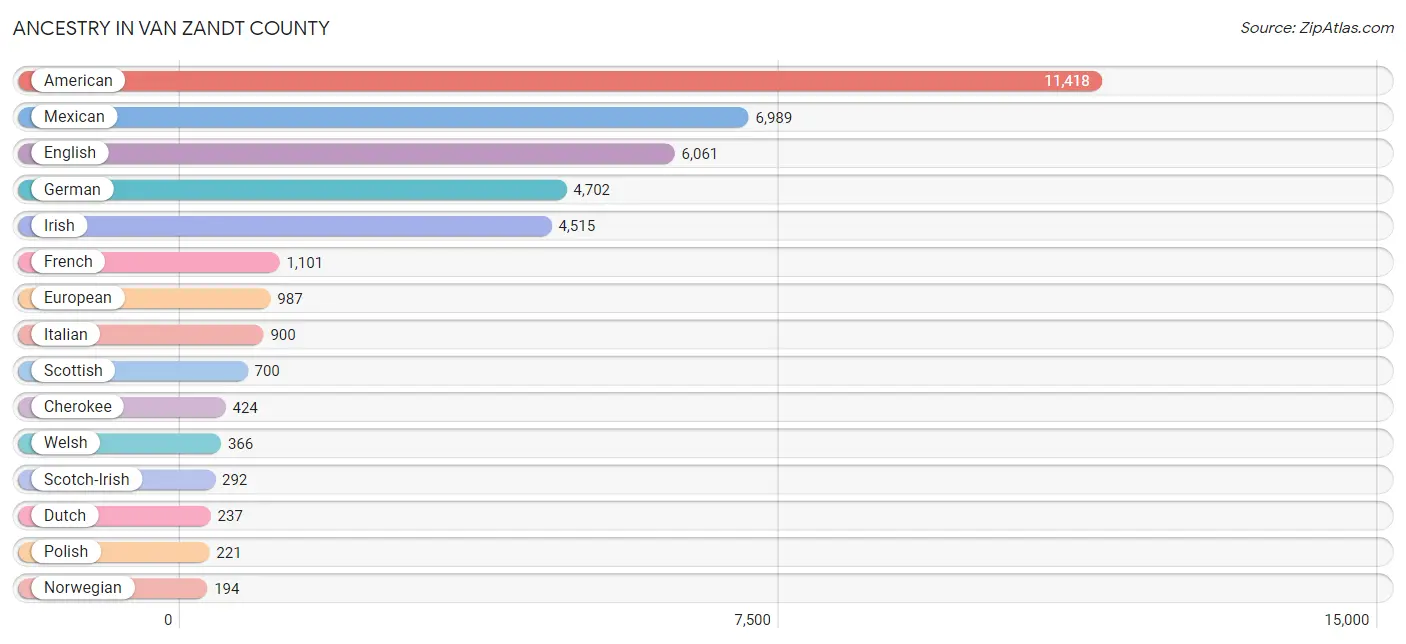
Ancestry in Van Zandt County
The most populous ancestries reported in Van Zandt County are American (11,418 | 19.0%), Mexican (6,989 | 11.6%), English (6,061 | 10.1%), German (4,702 | 7.8%), and Irish (4,515 | 7.5%), together accounting for 56.1% of all Van Zandt County residents.
| Ancestry | # Population | % Population |
| African | 23 | 0.0% |
| American | 11,418 | 19.0% |
| Apache | 30 | 0.1% |
| Arab | 72 | 0.1% |
| Australian | 13 | 0.0% |
| Belgian | 2 | 0.0% |
| Belizean | 6 | 0.0% |
| Bhutanese | 26 | 0.0% |
| Blackfeet | 10 | 0.0% |
| British | 193 | 0.3% |
| Burmese | 29 | 0.1% |
| Cajun | 24 | 0.0% |
| Canadian | 9 | 0.0% |
| Celtic | 37 | 0.1% |
| Central American | 122 | 0.2% |
| Central American Indian | 16 | 0.0% |
| Cherokee | 424 | 0.7% |
| Choctaw | 120 | 0.2% |
| Colombian | 11 | 0.0% |
| Comanche | 38 | 0.1% |
| Costa Rican | 69 | 0.1% |
| Croatian | 30 | 0.1% |
| Cuban | 21 | 0.0% |
| Czech | 105 | 0.2% |
| Czechoslovakian | 128 | 0.2% |
| Danish | 106 | 0.2% |
| Dutch | 237 | 0.4% |
| Dutch West Indian | 95 | 0.2% |
| Eastern European | 27 | 0.0% |
| English | 6,061 | 10.1% |
| European | 987 | 1.6% |
| Filipino | 1 | 0.0% |
| Finnish | 17 | 0.0% |
| French | 1,101 | 1.8% |
| French Canadian | 75 | 0.1% |
| German | 4,702 | 7.8% |
| Greek | 64 | 0.1% |
| Guamanian / Chamorro | 13 | 0.0% |
| Honduran | 30 | 0.1% |
| Hungarian | 70 | 0.1% |
| Indian (Asian) | 76 | 0.1% |
| Irish | 4,515 | 7.5% |
| Italian | 900 | 1.5% |
| Jamaican | 27 | 0.0% |
| Japanese | 16 | 0.0% |
| Korean | 23 | 0.0% |
| Lebanese | 53 | 0.1% |
| Lithuanian | 14 | 0.0% |
| Lumbee | 8 | 0.0% |
| Luxembourger | 8 | 0.0% |
| Mexican | 6,989 | 11.6% |
| Native Hawaiian | 30 | 0.1% |
| Nicaraguan | 7 | 0.0% |
| Northern European | 75 | 0.1% |
| Norwegian | 194 | 0.3% |
| Pennsylvania German | 25 | 0.0% |
| Peruvian | 6 | 0.0% |
| Polish | 221 | 0.4% |
| Portuguese | 171 | 0.3% |
| Puerto Rican | 154 | 0.3% |
| Romanian | 20 | 0.0% |
| Russian | 79 | 0.1% |
| Salvadoran | 16 | 0.0% |
| Scandinavian | 144 | 0.2% |
| Scotch-Irish | 292 | 0.5% |
| Scottish | 700 | 1.2% |
| Seminole | 35 | 0.1% |
| South African | 3 | 0.0% |
| South American | 17 | 0.0% |
| Spaniard | 50 | 0.1% |
| Spanish | 10 | 0.0% |
| Sri Lankan | 47 | 0.1% |
| Subsaharan African | 26 | 0.0% |
| Swedish | 144 | 0.2% |
| Swiss | 26 | 0.0% |
| Syrian | 19 | 0.0% |
| Thai | 134 | 0.2% |
| Ukrainian | 55 | 0.1% |
| Welsh | 366 | 0.6% |
| Yugoslavian | 5 | 0.0% | View All 80 Rows |
Immigrants in Van Zandt County
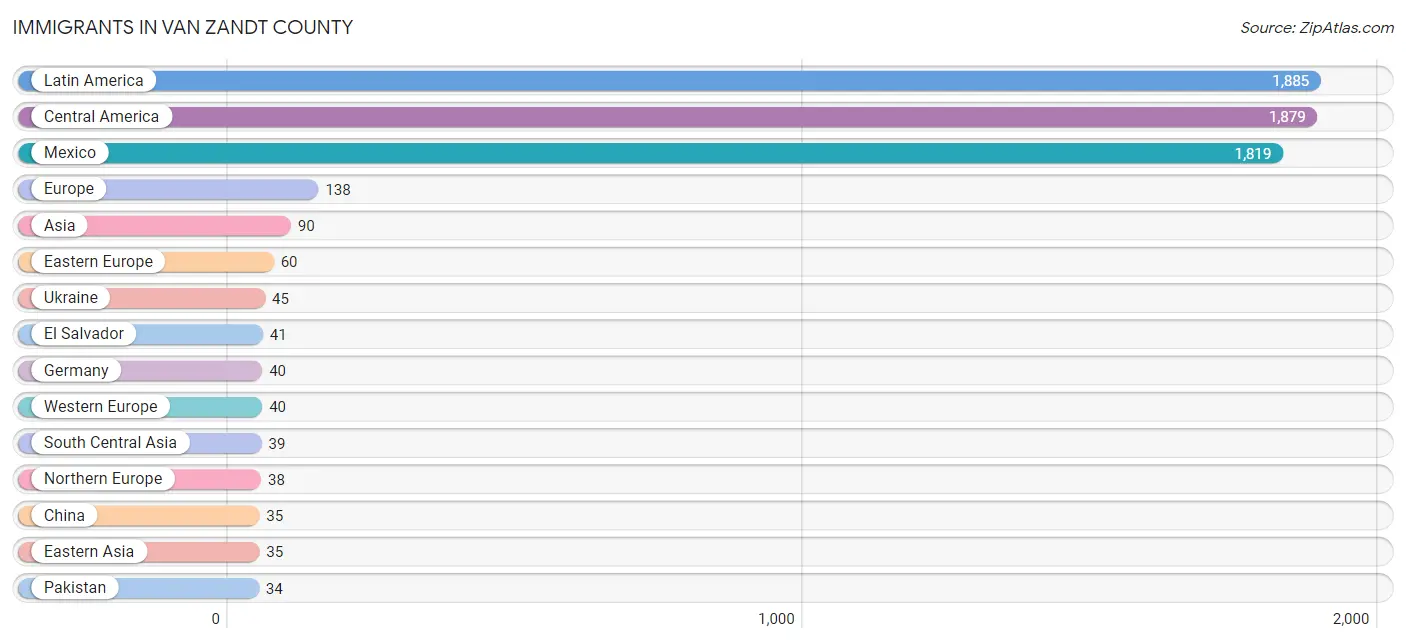
The most numerous immigrant groups reported in Van Zandt County came from Latin America (1,885 | 3.1%), Central America (1,879 | 3.1%), Mexico (1,819 | 3.0%), Europe (138 | 0.2%), and Asia (90 | 0.2%), together accounting for 9.7% of all Van Zandt County residents.
| Immigration Origin | # Population | % Population |
| Africa | 3 | 0.0% |
| Asia | 90 | 0.2% |
| Australia | 13 | 0.0% |
| Belize | 6 | 0.0% |
| Canada | 33 | 0.1% |
| Central America | 1,879 | 3.1% |
| China | 35 | 0.1% |
| Eastern Asia | 35 | 0.1% |
| Eastern Europe | 60 | 0.1% |
| El Salvador | 41 | 0.1% |
| England | 18 | 0.0% |
| Europe | 138 | 0.2% |
| Germany | 40 | 0.1% |
| Honduras | 13 | 0.0% |
| India | 5 | 0.0% |
| Latin America | 1,885 | 3.1% |
| Mexico | 1,819 | 3.0% |
| Northern Europe | 38 | 0.1% |
| Oceania | 29 | 0.1% |
| Pakistan | 34 | 0.1% |
| Peru | 6 | 0.0% |
| Philippines | 10 | 0.0% |
| Russia | 15 | 0.0% |
| South Africa | 3 | 0.0% |
| South America | 6 | 0.0% |
| South Central Asia | 39 | 0.1% |
| South Eastern Asia | 16 | 0.0% |
| Taiwan | 1 | 0.0% |
| Ukraine | 45 | 0.1% |
| Vietnam | 6 | 0.0% |
| Western Europe | 40 | 0.1% | View All 31 Rows |
Sex and Age in Van Zandt County
Sex and Age in Van Zandt County
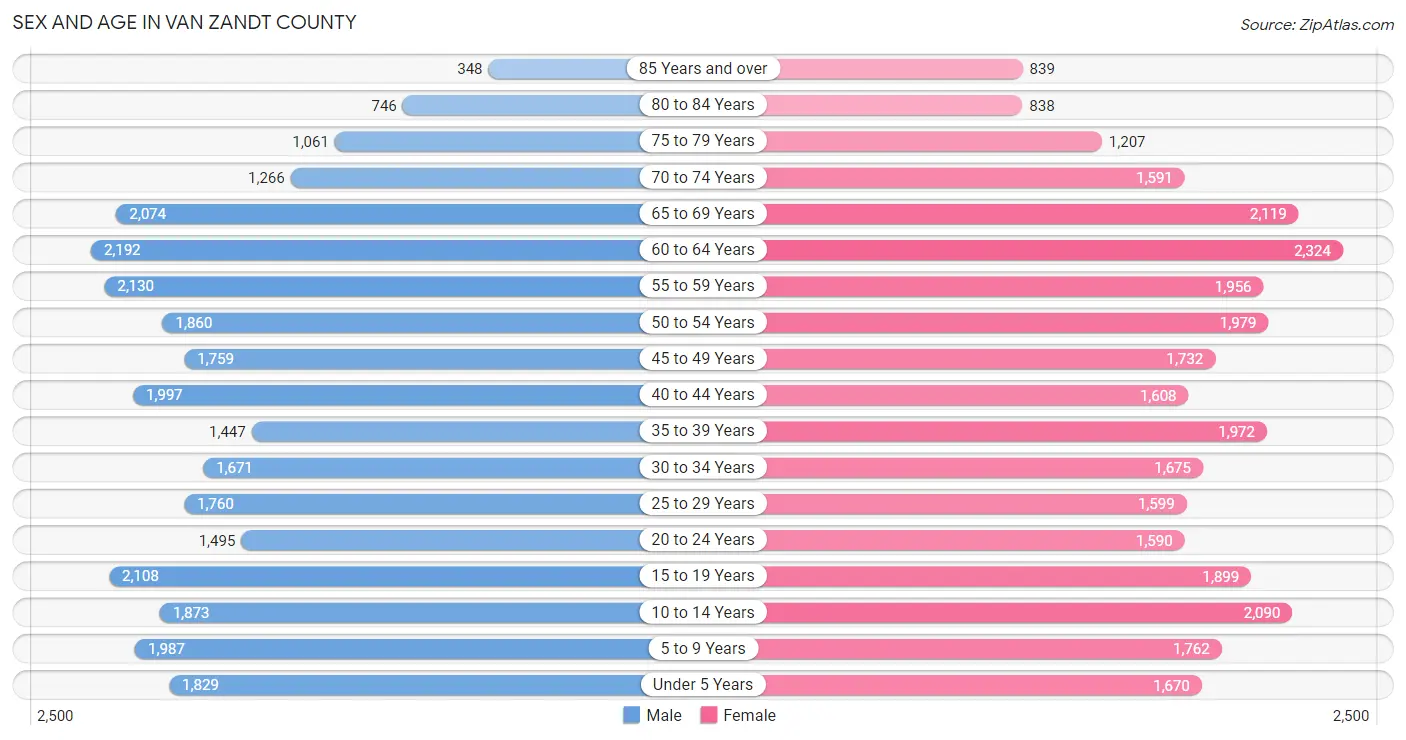
The most populous age groups in Van Zandt County are 60 to 64 Years (2,192 | 7.4%) for men and 60 to 64 Years (2,324 | 7.6%) for women.
| Age Bracket | Male | Female |
| Under 5 Years | 1,829 (6.2%) | 1,670 (5.5%) |
| 5 to 9 Years | 1,987 (6.7%) | 1,762 (5.8%) |
| 10 to 14 Years | 1,873 (6.3%) | 2,090 (6.9%) |
| 15 to 19 Years | 2,108 (7.1%) | 1,899 (6.2%) |
| 20 to 24 Years | 1,495 (5.1%) | 1,590 (5.2%) |
| 25 to 29 Years | 1,760 (5.9%) | 1,599 (5.2%) |
| 30 to 34 Years | 1,671 (5.6%) | 1,675 (5.5%) |
| 35 to 39 Years | 1,447 (4.9%) | 1,972 (6.5%) |
| 40 to 44 Years | 1,997 (6.8%) | 1,608 (5.3%) |
| 45 to 49 Years | 1,759 (5.9%) | 1,732 (5.7%) |
| 50 to 54 Years | 1,860 (6.3%) | 1,979 (6.5%) |
| 55 to 59 Years | 2,130 (7.2%) | 1,956 (6.4%) |
| 60 to 64 Years | 2,192 (7.4%) | 2,324 (7.6%) |
| 65 to 69 Years | 2,074 (7.0%) | 2,119 (7.0%) |
| 70 to 74 Years | 1,266 (4.3%) | 1,591 (5.2%) |
| 75 to 79 Years | 1,061 (3.6%) | 1,207 (4.0%) |
| 80 to 84 Years | 746 (2.5%) | 838 (2.8%) |
| 85 Years and over | 348 (1.2%) | 839 (2.8%) |
| Total | 29,603 (100.0%) | 30,450 (100.0%) |
Families and Households in Van Zandt County
Median Family Size in Van Zandt County
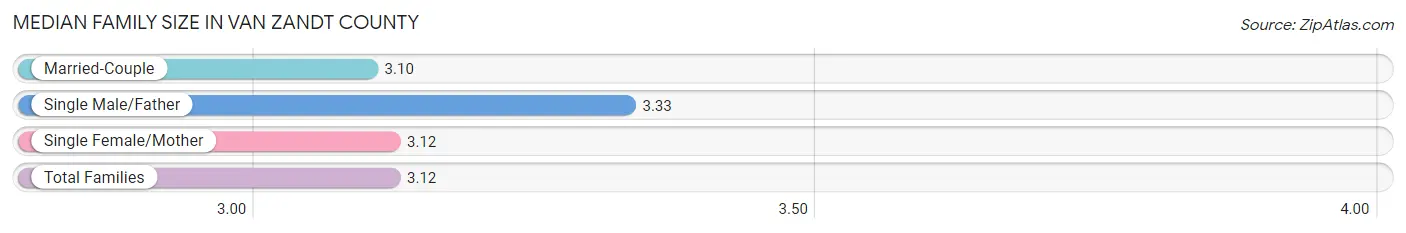
The median family size in Van Zandt County is 3.12 persons per family, with single male/father families (1,081 | 6.7%) accounting for the largest median family size of 3.33 persons per family. On the other hand, married-couple families (12,518 | 77.5%) represent the smallest median family size with 3.10 persons per family.
| Family Type | # Families | Family Size |
| Married-Couple | 12,518 (77.5%) | 3.10 |
| Single Male/Father | 1,081 (6.7%) | 3.33 |
| Single Female/Mother | 2,544 (15.8%) | 3.12 |
| Total Families | 16,143 (100.0%) | 3.12 |
Median Household Size in Van Zandt County
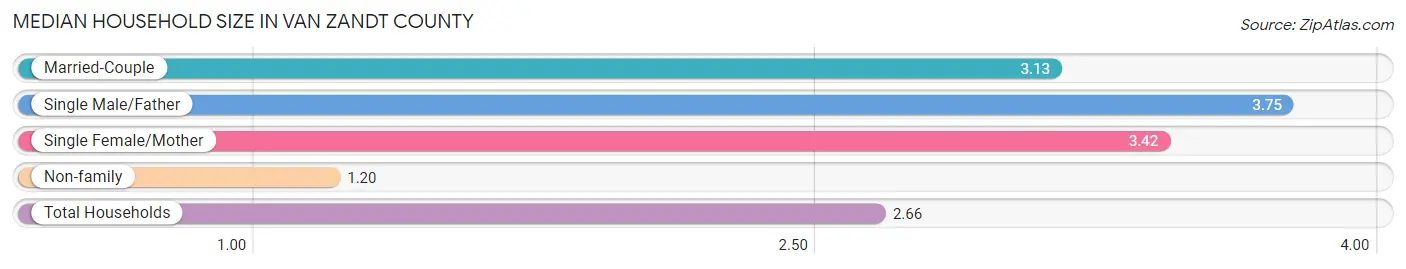
The median household size in Van Zandt County is 2.66 persons per household, with single male/father households (1,081 | 4.8%) accounting for the largest median household size of 3.75 persons per household. non-family households (6,183 | 27.7%) represent the smallest median household size with 1.20 persons per household.
| Household Type | # Households | Household Size |
| Married-Couple | 12,518 (56.1%) | 3.13 |
| Single Male/Father | 1,081 (4.8%) | 3.75 |
| Single Female/Mother | 2,544 (11.4%) | 3.42 |
| Non-family | 6,183 (27.7%) | 1.20 |
| Total Households | 22,326 (100.0%) | 2.66 |
Household Size by Marriage Status in Van Zandt County
Out of a total of 22,326 households in Van Zandt County, 16,143 (72.3%) are family households, while 6,183 (27.7%) are nonfamily households. The most numerous type of family households are 2-person households, comprising 7,481, and the most common type of nonfamily households are 1-person households, comprising 5,283.
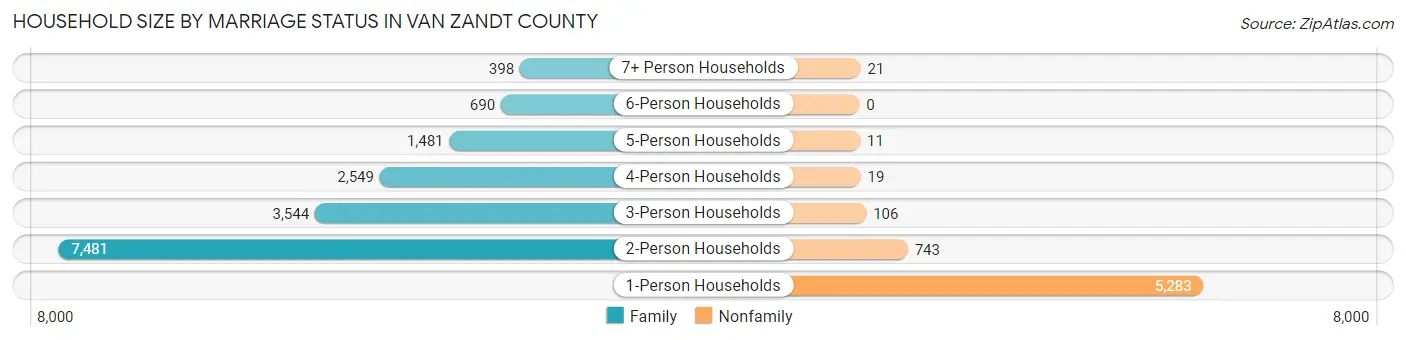
| Household Size | Family Households | Nonfamily Households |
| 1-Person Households | - | 5,283 (23.7%) |
| 2-Person Households | 7,481 (33.5%) | 743 (3.3%) |
| 3-Person Households | 3,544 (15.9%) | 106 (0.5%) |
| 4-Person Households | 2,549 (11.4%) | 19 (0.1%) |
| 5-Person Households | 1,481 (6.6%) | 11 (0.1%) |
| 6-Person Households | 690 (3.1%) | 0 (0.0%) |
| 7+ Person Households | 398 (1.8%) | 21 (0.1%) |
| Total | 16,143 (72.3%) | 6,183 (27.7%) |
Female Fertility in Van Zandt County
Fertility by Age in Van Zandt County
Average fertility rate in Van Zandt County is 79.0 births per 1,000 women. Women in the age bracket of 20 to 34 years have the highest fertility rate with 160.0 births per 1,000 women. Women in the age bracket of 20 to 34 years acount for 78.1% of all women with births.
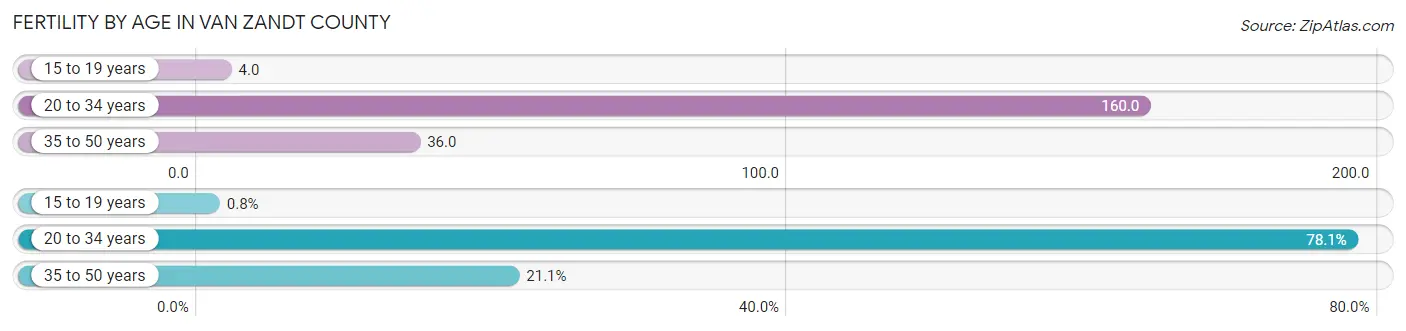
| Age Bracket | Women with Births | Births / 1,000 Women |
| 15 to 19 years | 8 (0.8%) | 4.0 |
| 20 to 34 years | 776 (78.1%) | 160.0 |
| 35 to 50 years | 210 (21.1%) | 36.0 |
| Total | 994 (100.0%) | 79.0 |
Fertility by Age by Marriage Status in Van Zandt County
74.1% of women with births (994) in Van Zandt County are married. The highest percentage of unmarried women with births falls into 15 to 19 years age bracket with 100.0% of them unmarried at the time of birth, while the lowest percentage of unmarried women with births belong to 20 to 34 years age bracket with 19.2% of them unmarried.
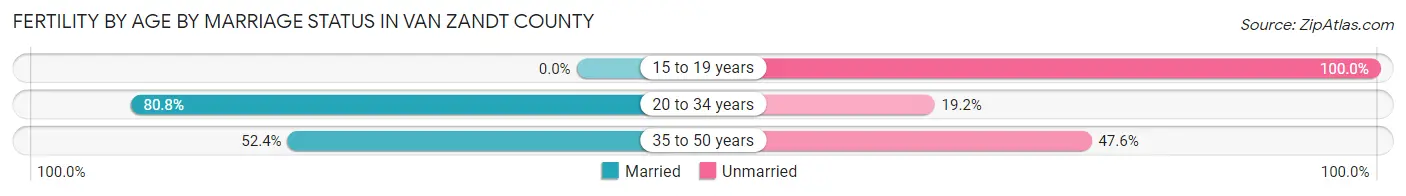
| Age Bracket | Married | Unmarried |
| 15 to 19 years | 0 (0.0%) | 8 (100.0%) |
| 20 to 34 years | 627 (80.8%) | 149 (19.2%) |
| 35 to 50 years | 110 (52.4%) | 100 (47.6%) |
| Total | 737 (74.1%) | 257 (25.9%) |
Fertility by Education in Van Zandt County
Average fertility rate in Van Zandt County is 79.0 births per 1,000 women. Women with the education attainment of college or associate's degree have the highest fertility rate of 107.0 births per 1,000 women, while women with the education attainment of less than high school have the lowest fertility at 35.0 births per 1,000 women. Women with the education attainment of college or associate's degree represent 44.9% of all women with births.
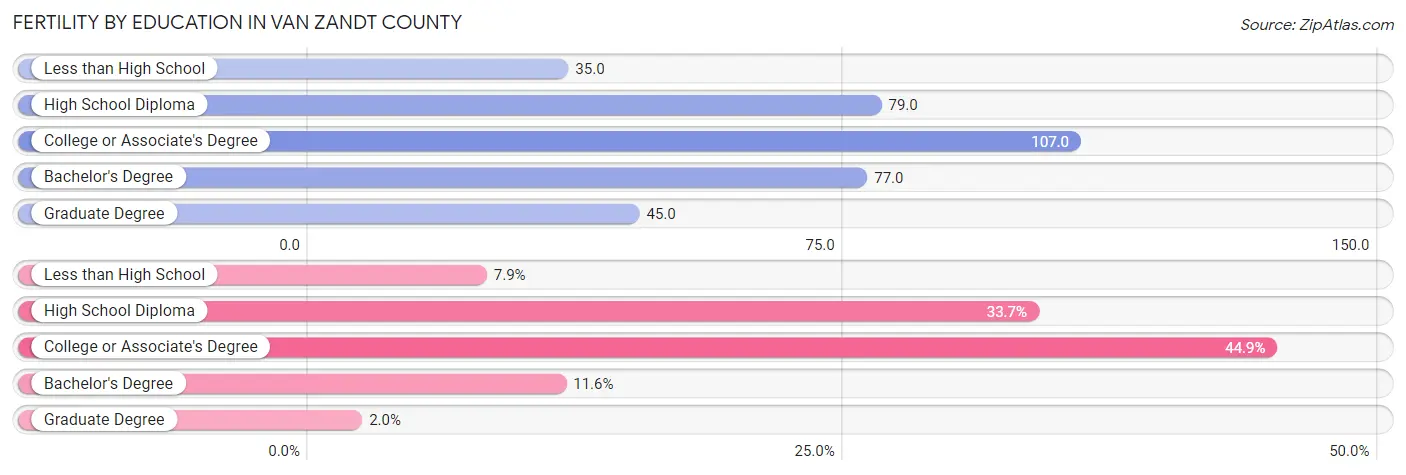
| Educational Attainment | Women with Births | Births / 1,000 Women |
| Less than High School | 78 (7.9%) | 35.0 |
| High School Diploma | 335 (33.7%) | 79.0 |
| College or Associate's Degree | 446 (44.9%) | 107.0 |
| Bachelor's Degree | 115 (11.6%) | 77.0 |
| Graduate Degree | 20 (2.0%) | 45.0 |
| Total | 994 (100.0%) | 79.0 |
Fertility by Education by Marriage Status in Van Zandt County
25.9% of women with births in Van Zandt County are unmarried. Women with the educational attainment of bachelor's degree are most likely to be married with 100.0% of them married at childbirth, while women with the educational attainment of college or associate's degree are least likely to be married with 51.1% of them unmarried at childbirth.
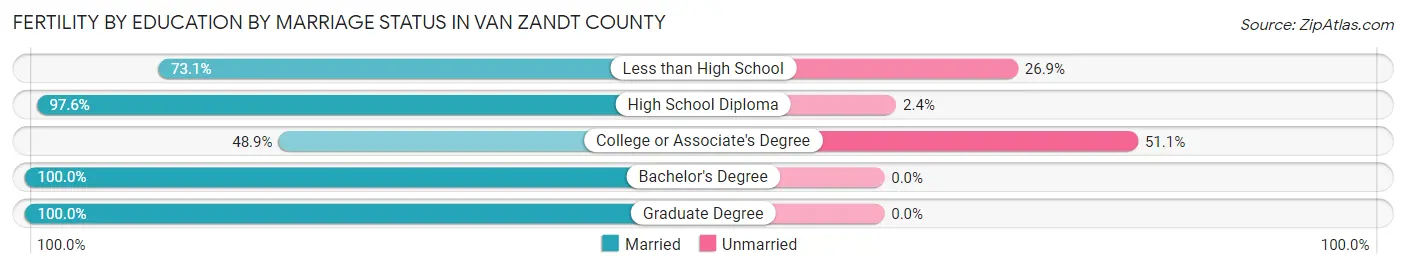
| Educational Attainment | Married | Unmarried |
| Less than High School | 57 (73.1%) | 21 (26.9%) |
| High School Diploma | 327 (97.6%) | 8 (2.4%) |
| College or Associate's Degree | 218 (48.9%) | 228 (51.1%) |
| Bachelor's Degree | 115 (100.0%) | 0 (0.0%) |
| Graduate Degree | 20 (100.0%) | 0 (0.0%) |
| Total | 737 (74.1%) | 257 (25.9%) |
Employment Characteristics in Van Zandt County
Employment by Class of Employer in Van Zandt County
Among the 24,887 employed individuals in Van Zandt County, private company employees (17,049 | 68.5%), self-employed (not incorporated) (2,076 | 8.3%), and local government employees (1,759 | 7.1%) make up the most common classes of employment.
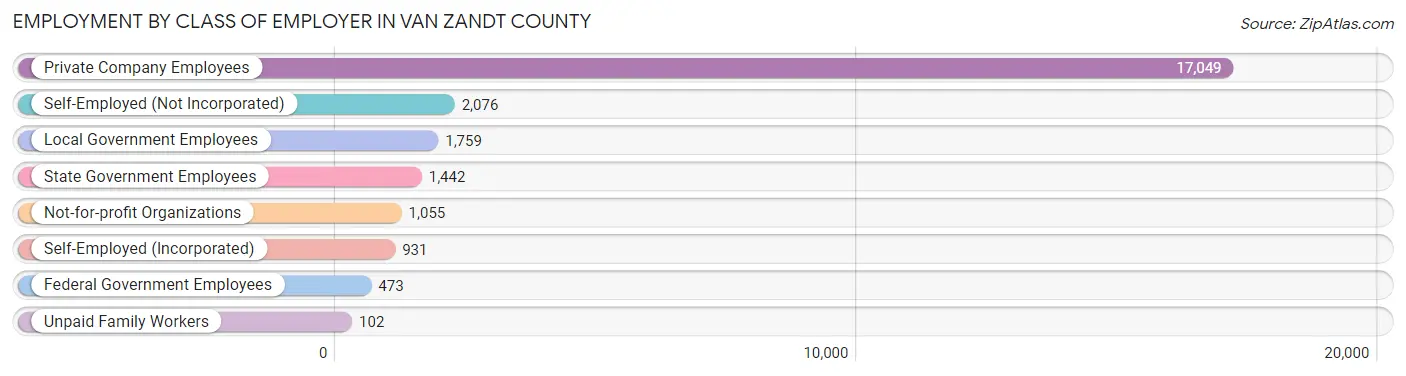
| Employer Class | # Employees | % Employees |
| Private Company Employees | 17,049 | 68.5% |
| Self-Employed (Incorporated) | 931 | 3.7% |
| Self-Employed (Not Incorporated) | 2,076 | 8.3% |
| Not-for-profit Organizations | 1,055 | 4.2% |
| Local Government Employees | 1,759 | 7.1% |
| State Government Employees | 1,442 | 5.8% |
| Federal Government Employees | 473 | 1.9% |
| Unpaid Family Workers | 102 | 0.4% |
| Total | 24,887 | 100.0% |
Employment Status by Age in Van Zandt County
According to the labor force statistics for Van Zandt County, out of the total population over 16 years of age (48,020), 54.5% or 26,171 individuals are in the labor force, with 3.1% or 811 of them unemployed. The age group with the highest labor force participation rate is 35 to 44 years, with 78.6% or 5,521 individuals in the labor force. Within the labor force, the 16 to 19 years age range has the highest percentage of unemployed individuals, with 6.9% or 84 of them being unemployed.
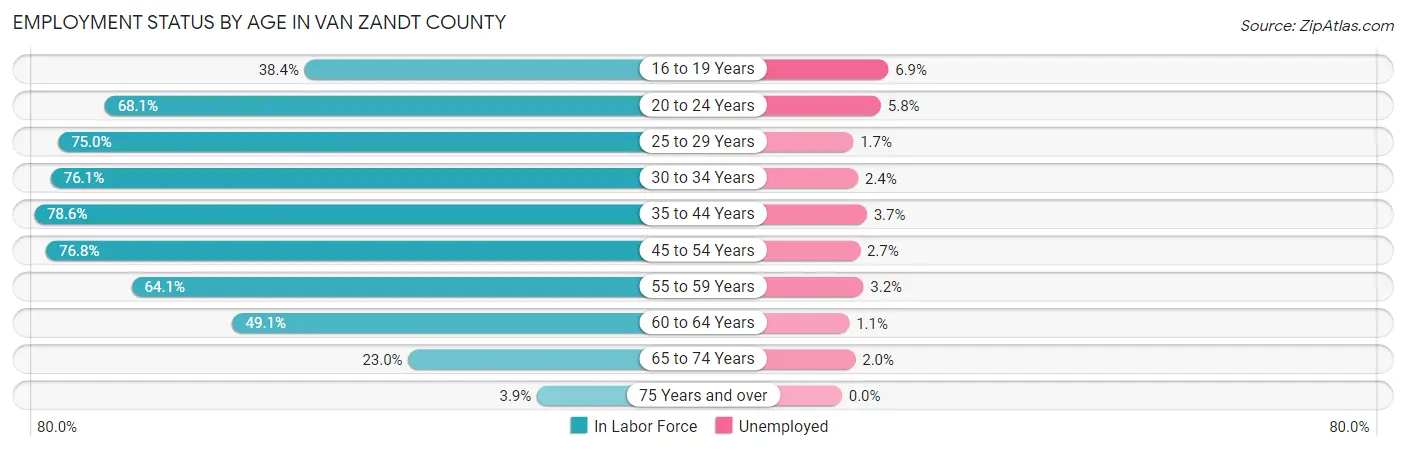
| Age Bracket | In Labor Force | Unemployed |
| 16 to 19 Years | 1,223 (38.4%) | 84 (6.9%) |
| 20 to 24 Years | 2,101 (68.1%) | 122 (5.8%) |
| 25 to 29 Years | 2,519 (75.0%) | 43 (1.7%) |
| 30 to 34 Years | 2,546 (76.1%) | 61 (2.4%) |
| 35 to 44 Years | 5,521 (78.6%) | 204 (3.7%) |
| 45 to 54 Years | 5,629 (76.8%) | 152 (2.7%) |
| 55 to 59 Years | 2,619 (64.1%) | 84 (3.2%) |
| 60 to 64 Years | 2,217 (49.1%) | 24 (1.1%) |
| 65 to 74 Years | 1,622 (23.0%) | 32 (2.0%) |
| 75 Years and over | 197 (3.9%) | 0 (0.0%) |
| Total | 26,171 (54.5%) | 811 (3.1%) |
Employment Status by Educational Attainment in Van Zandt County
According to labor force statistics for Van Zandt County, 71.0% of individuals (21,059) out of the total population between 25 and 64 years of age (29,661) are in the labor force, with 2.7% or 569 of them being unemployed. The group with the highest labor force participation rate are those with the educational attainment of bachelor's degree or higher, with 75.2% or 3,846 individuals in the labor force. Within the labor force, individuals with less than high school education have the highest percentage of unemployment, with 4.3% or 98 of them being unemployed.
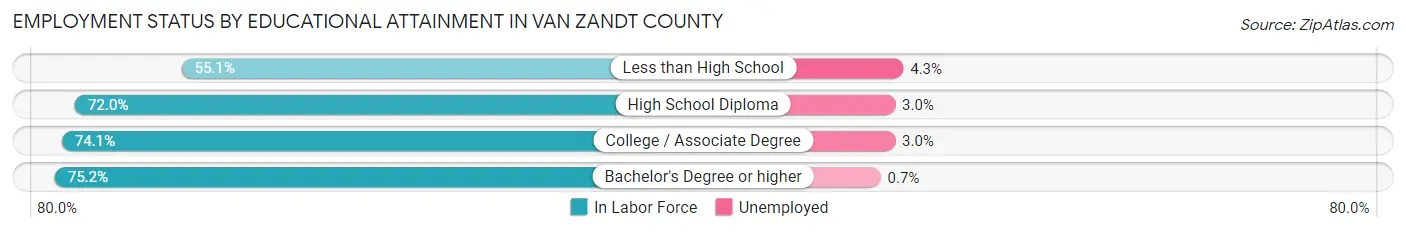
| Educational Attainment | In Labor Force | Unemployed |
| Less than High School | 2,287 (55.1%) | 178 (4.3%) |
| High School Diploma | 6,931 (72.0%) | 289 (3.0%) |
| College / Associate Degree | 7,981 (74.1%) | 323 (3.0%) |
| Bachelor's Degree or higher | 3,846 (75.2%) | 36 (0.7%) |
| Total | 21,059 (71.0%) | 801 (2.7%) |
Employment Occupations by Sex in Van Zandt County
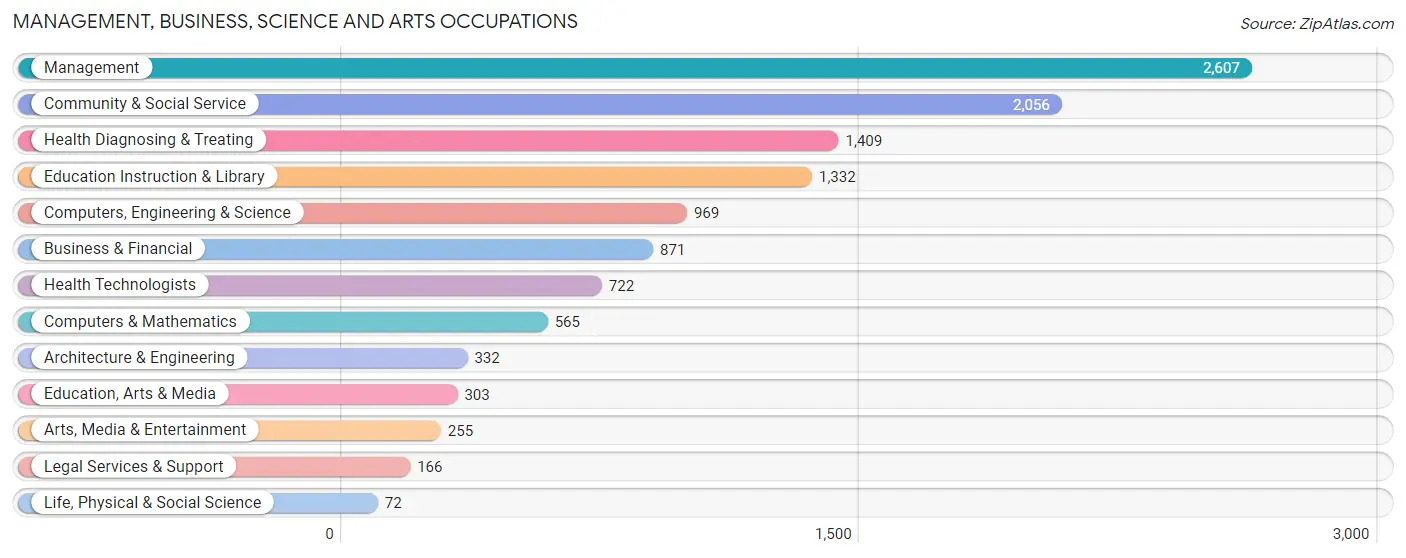
Management, Business, Science and Arts Occupations
The most common Management, Business, Science and Arts occupations in Van Zandt County are Management (2,607 | 10.3%), Community & Social Service (2,056 | 8.1%), Health Diagnosing & Treating (1,409 | 5.6%), Education Instruction & Library (1,332 | 5.2%), and Computers, Engineering & Science (969 | 3.8%).
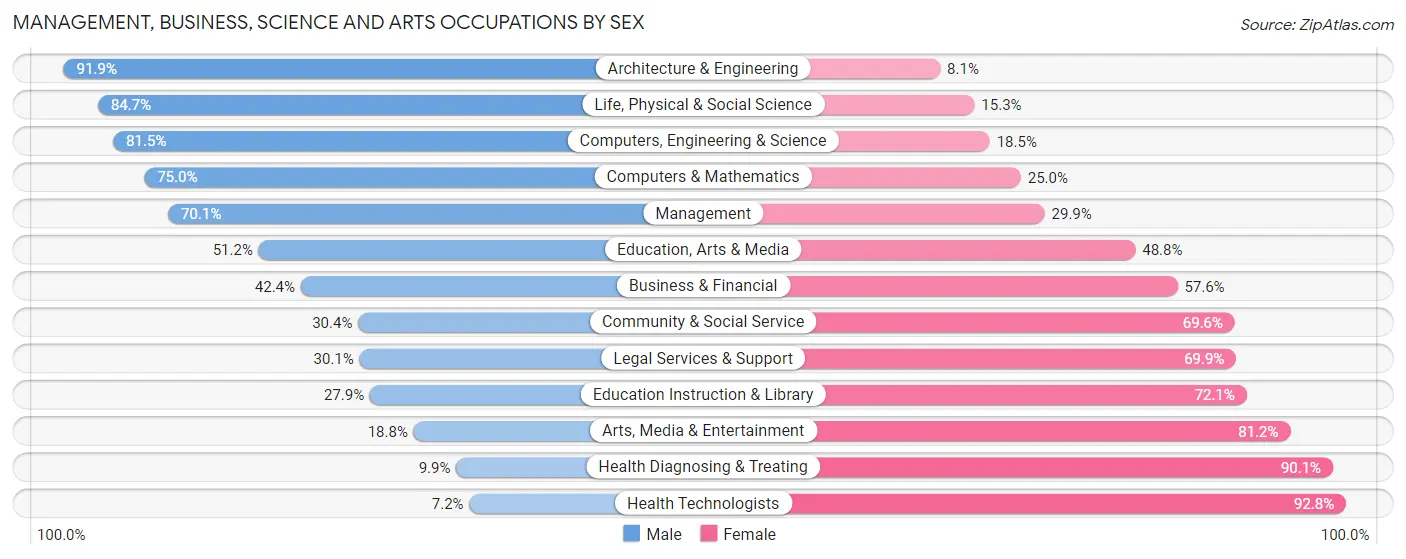
Management, Business, Science and Arts Occupations by Sex
Within the Management, Business, Science and Arts occupations in Van Zandt County, the most male-oriented occupations are Architecture & Engineering (91.9%), Life, Physical & Social Science (84.7%), and Computers, Engineering & Science (81.5%), while the most female-oriented occupations are Health Technologists (92.8%), Health Diagnosing & Treating (90.1%), and Arts, Media & Entertainment (81.2%).
| Occupation | Male | Female |
| Management | 1,827 (70.1%) | 780 (29.9%) |
| Business & Financial | 369 (42.4%) | 502 (57.6%) |
| Computers, Engineering & Science | 790 (81.5%) | 179 (18.5%) |
| Computers & Mathematics | 424 (75.0%) | 141 (25.0%) |
| Architecture & Engineering | 305 (91.9%) | 27 (8.1%) |
| Life, Physical & Social Science | 61 (84.7%) | 11 (15.3%) |
| Community & Social Service | 625 (30.4%) | 1,431 (69.6%) |
| Education, Arts & Media | 155 (51.2%) | 148 (48.8%) |
| Legal Services & Support | 50 (30.1%) | 116 (69.9%) |
| Education Instruction & Library | 372 (27.9%) | 960 (72.1%) |
| Arts, Media & Entertainment | 48 (18.8%) | 207 (81.2%) |
| Health Diagnosing & Treating | 140 (9.9%) | 1,269 (90.1%) |
| Health Technologists | 52 (7.2%) | 670 (92.8%) |
| Total (Category) | 3,751 (47.4%) | 4,161 (52.6%) |
| Total (Overall) | 14,488 (57.1%) | 10,876 (42.9%) |
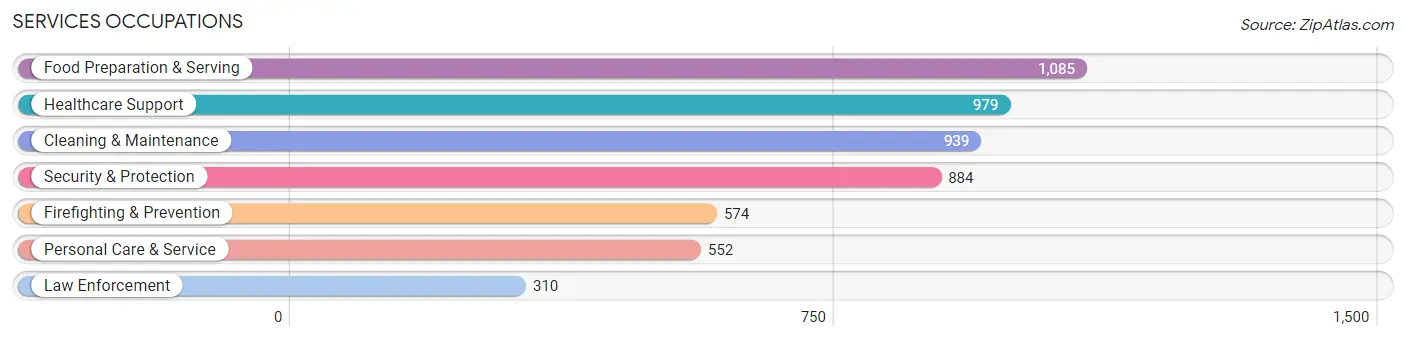
Services Occupations
The most common Services occupations in Van Zandt County are Food Preparation & Serving (1,085 | 4.3%), Healthcare Support (979 | 3.9%), Cleaning & Maintenance (939 | 3.7%), Security & Protection (884 | 3.5%), and Firefighting & Prevention (574 | 2.3%).
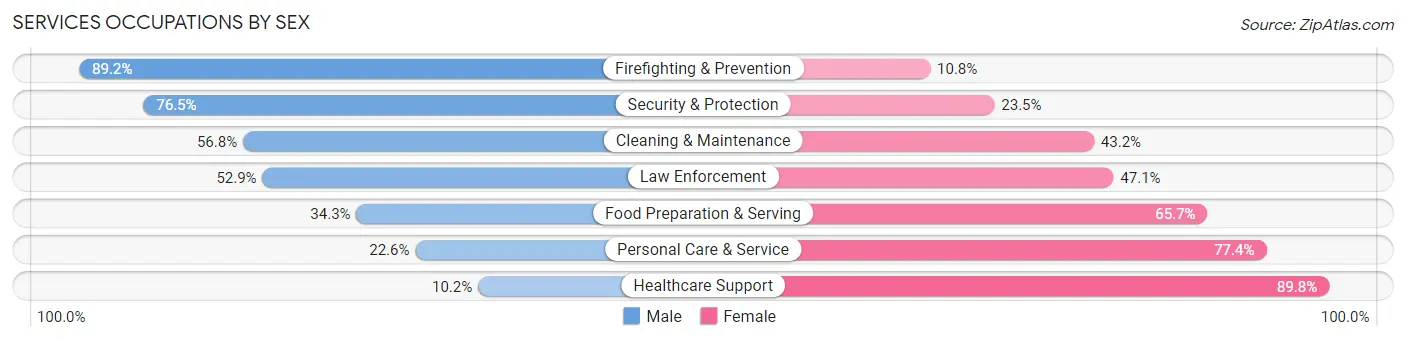
Services Occupations by Sex
Within the Services occupations in Van Zandt County, the most male-oriented occupations are Firefighting & Prevention (89.2%), Security & Protection (76.5%), and Cleaning & Maintenance (56.8%), while the most female-oriented occupations are Healthcare Support (89.8%), Personal Care & Service (77.4%), and Food Preparation & Serving (65.7%).
| Occupation | Male | Female |
| Healthcare Support | 100 (10.2%) | 879 (89.8%) |
| Security & Protection | 676 (76.5%) | 208 (23.5%) |
| Firefighting & Prevention | 512 (89.2%) | 62 (10.8%) |
| Law Enforcement | 164 (52.9%) | 146 (47.1%) |
| Food Preparation & Serving | 372 (34.3%) | 713 (65.7%) |
| Cleaning & Maintenance | 533 (56.8%) | 406 (43.2%) |
| Personal Care & Service | 125 (22.6%) | 427 (77.4%) |
| Total (Category) | 1,806 (40.7%) | 2,633 (59.3%) |
| Total (Overall) | 14,488 (57.1%) | 10,876 (42.9%) |
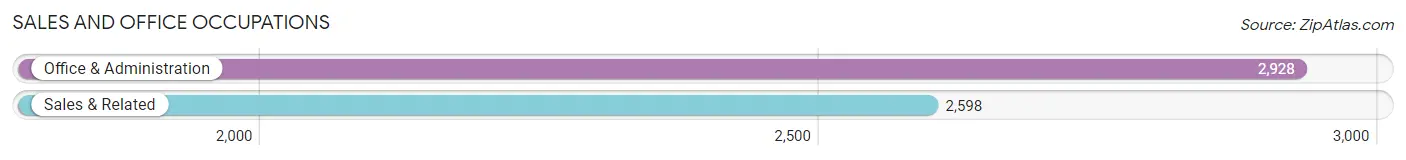
Sales and Office Occupations
The most common Sales and Office occupations in Van Zandt County are Office & Administration (2,928 | 11.5%), and Sales & Related (2,598 | 10.2%).
Sales and Office Occupations by Sex
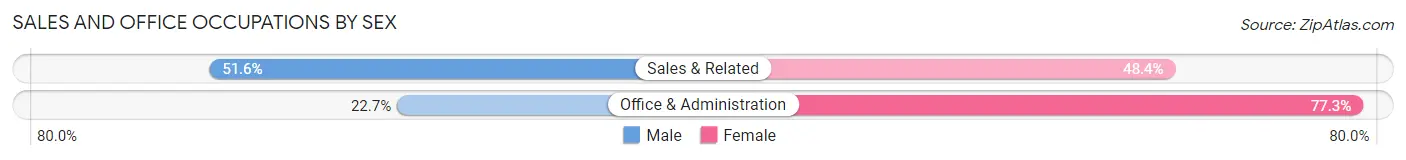
| Occupation | Male | Female |
| Sales & Related | 1,340 (51.6%) | 1,258 (48.4%) |
| Office & Administration | 665 (22.7%) | 2,263 (77.3%) |
| Total (Category) | 2,005 (36.3%) | 3,521 (63.7%) |
| Total (Overall) | 14,488 (57.1%) | 10,876 (42.9%) |
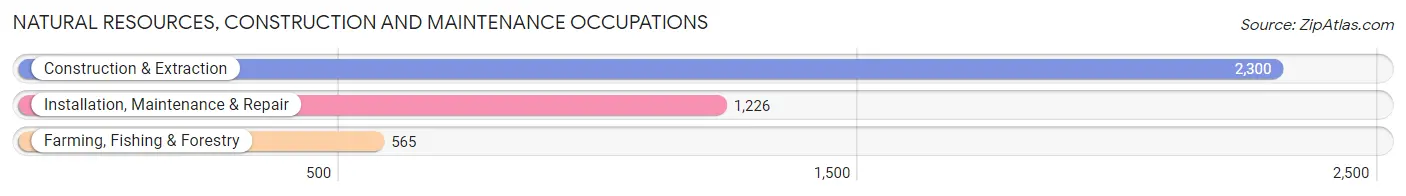
Natural Resources, Construction and Maintenance Occupations
The most common Natural Resources, Construction and Maintenance occupations in Van Zandt County are Construction & Extraction (2,300 | 9.1%), Installation, Maintenance & Repair (1,226 | 4.8%), and Farming, Fishing & Forestry (565 | 2.2%).
Natural Resources, Construction and Maintenance Occupations by Sex
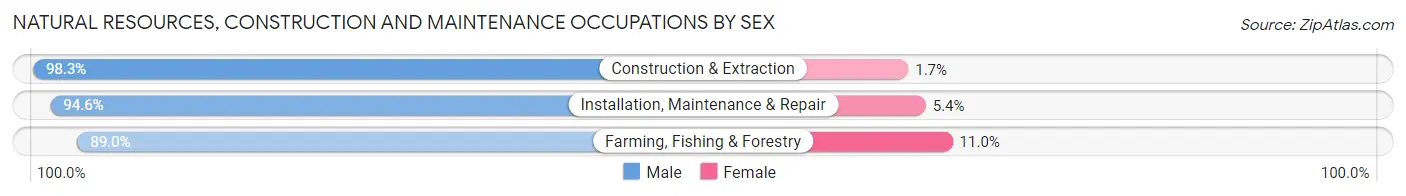
| Occupation | Male | Female |
| Farming, Fishing & Forestry | 503 (89.0%) | 62 (11.0%) |
| Construction & Extraction | 2,260 (98.3%) | 40 (1.7%) |
| Installation, Maintenance & Repair | 1,160 (94.6%) | 66 (5.4%) |
| Total (Category) | 3,923 (95.9%) | 168 (4.1%) |
| Total (Overall) | 14,488 (57.1%) | 10,876 (42.9%) |
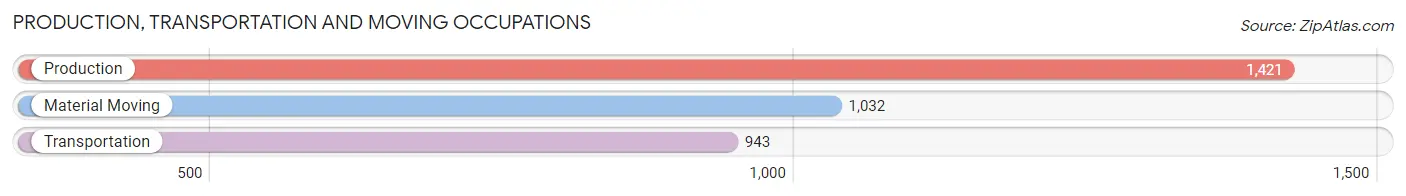
Production, Transportation and Moving Occupations
The most common Production, Transportation and Moving occupations in Van Zandt County are Production (1,421 | 5.6%), Material Moving (1,032 | 4.1%), and Transportation (943 | 3.7%).
Production, Transportation and Moving Occupations by Sex
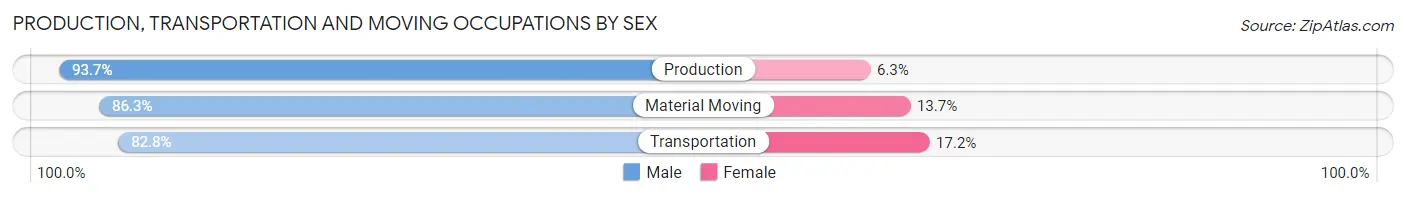
| Occupation | Male | Female |
| Production | 1,331 (93.7%) | 90 (6.3%) |
| Transportation | 781 (82.8%) | 162 (17.2%) |
| Material Moving | 891 (86.3%) | 141 (13.7%) |
| Total (Category) | 3,003 (88.4%) | 393 (11.6%) |
| Total (Overall) | 14,488 (57.1%) | 10,876 (42.9%) |
Employment Industries by Sex in Van Zandt County
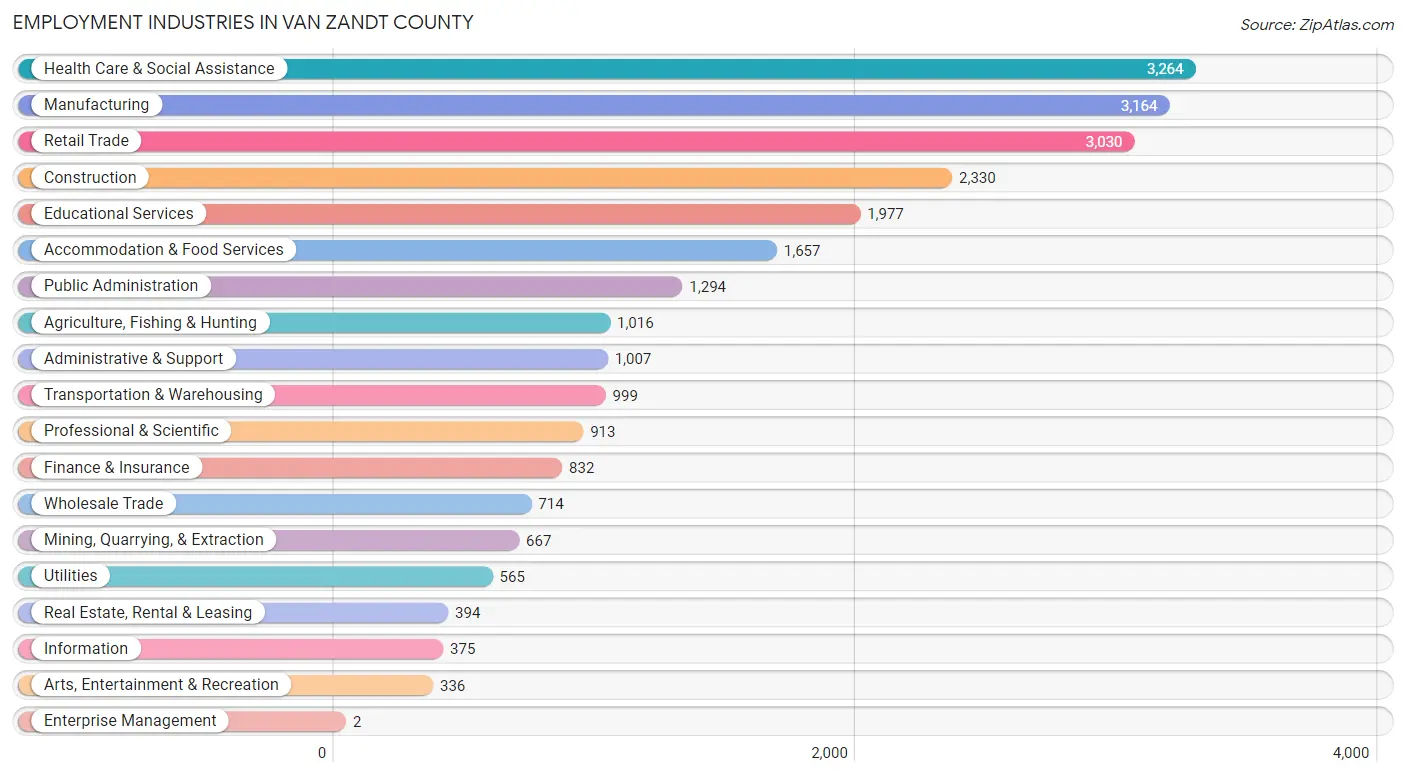
Employment Industries in Van Zandt County
The major employment industries in Van Zandt County include Health Care & Social Assistance (3,264 | 12.9%), Manufacturing (3,164 | 12.5%), Retail Trade (3,030 | 11.9%), Construction (2,330 | 9.2%), and Educational Services (1,977 | 7.8%).
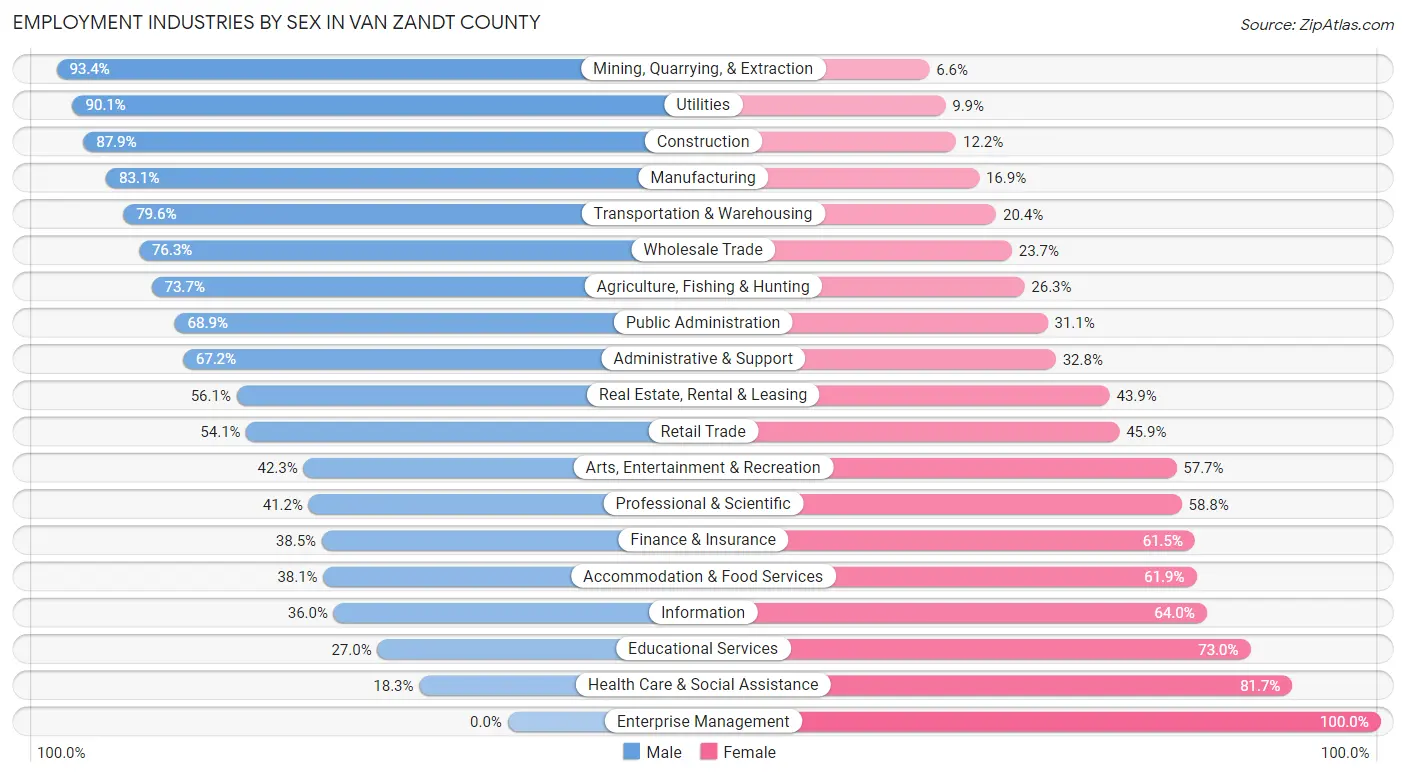
Employment Industries by Sex in Van Zandt County
The Van Zandt County industries that see more men than women are Mining, Quarrying, & Extraction (93.4%), Utilities (90.1%), and Construction (87.8%), whereas the industries that tend to have a higher number of women are Enterprise Management (100.0%), Health Care & Social Assistance (81.7%), and Educational Services (73.0%).
| Industry | Male | Female |
| Agriculture, Fishing & Hunting | 749 (73.7%) | 267 (26.3%) |
| Mining, Quarrying, & Extraction | 623 (93.4%) | 44 (6.6%) |
| Construction | 2,047 (87.8%) | 283 (12.1%) |
| Manufacturing | 2,630 (83.1%) | 534 (16.9%) |
| Wholesale Trade | 545 (76.3%) | 169 (23.7%) |
| Retail Trade | 1,639 (54.1%) | 1,391 (45.9%) |
| Transportation & Warehousing | 795 (79.6%) | 204 (20.4%) |
| Utilities | 509 (90.1%) | 56 (9.9%) |
| Information | 135 (36.0%) | 240 (64.0%) |
| Finance & Insurance | 320 (38.5%) | 512 (61.5%) |
| Real Estate, Rental & Leasing | 221 (56.1%) | 173 (43.9%) |
| Professional & Scientific | 376 (41.2%) | 537 (58.8%) |
| Enterprise Management | 0 (0.0%) | 2 (100.0%) |
| Administrative & Support | 677 (67.2%) | 330 (32.8%) |
| Educational Services | 533 (27.0%) | 1,444 (73.0%) |
| Health Care & Social Assistance | 597 (18.3%) | 2,667 (81.7%) |
| Arts, Entertainment & Recreation | 142 (42.3%) | 194 (57.7%) |
| Accommodation & Food Services | 632 (38.1%) | 1,025 (61.9%) |
| Public Administration | 892 (68.9%) | 402 (31.1%) |
| Total | 14,488 (57.1%) | 10,876 (42.9%) |
Education in Van Zandt County
School Enrollment in Van Zandt County
The most common levels of schooling among the 13,276 students in Van Zandt County are high school (3,400 | 25.6%), middle school (3,062 | 23.1%), and elementary school (3,030 | 22.8%).
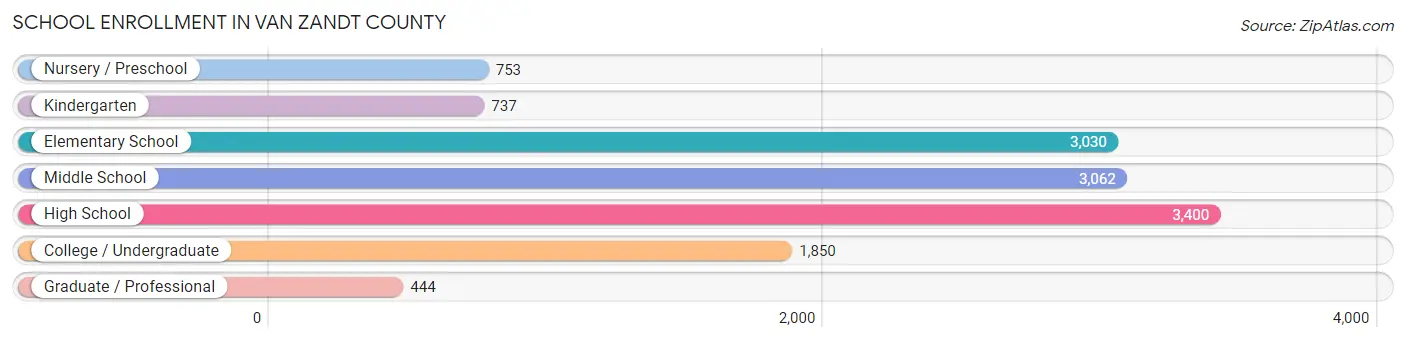
| School Level | # Students | % Students |
| Nursery / Preschool | 753 | 5.7% |
| Kindergarten | 737 | 5.6% |
| Elementary School | 3,030 | 22.8% |
| Middle School | 3,062 | 23.1% |
| High School | 3,400 | 25.6% |
| College / Undergraduate | 1,850 | 13.9% |
| Graduate / Professional | 444 | 3.3% |
| Total | 13,276 | 100.0% |
School Enrollment by Age by Funding Source in Van Zandt County
Out of a total of 13,276 students who are enrolled in schools in Van Zandt County, 1,965 (14.8%) attend a private institution, while the remaining 11,311 (85.2%) are enrolled in public schools. The age group of 3 to 4 year olds has the highest likelihood of being enrolled in private schools, with 155 (39.2% in the age bracket) enrolled. Conversely, the age group of 18 to 19 year olds has the lowest likelihood of being enrolled in a private school, with 783 (94.3% in the age bracket) attending a public institution.
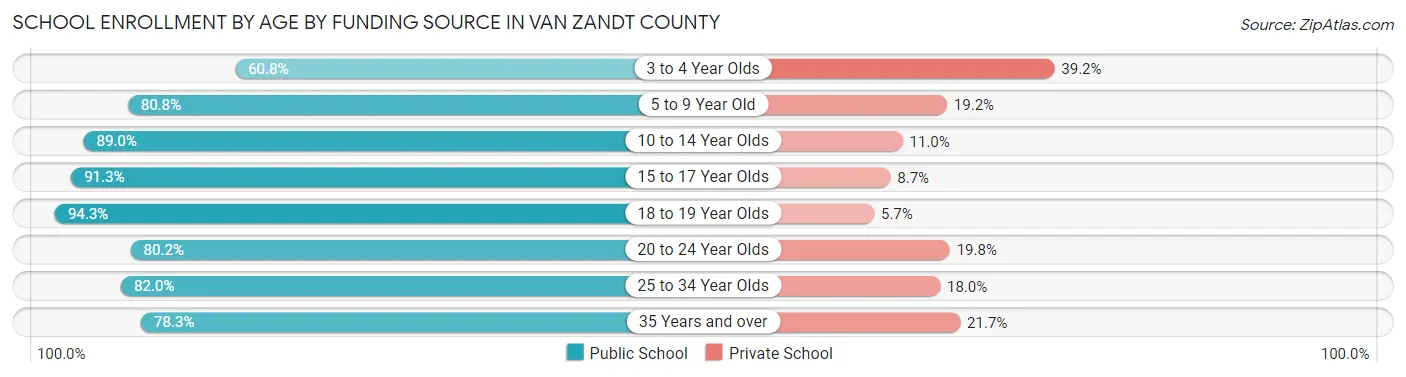
| Age Bracket | Public School | Private School |
| 3 to 4 Year Olds | 240 (60.8%) | 155 (39.2%) |
| 5 to 9 Year Old | 2,957 (80.8%) | 704 (19.2%) |
| 10 to 14 Year Olds | 3,436 (89.0%) | 424 (11.0%) |
| 15 to 17 Year Olds | 2,207 (91.3%) | 210 (8.7%) |
| 18 to 19 Year Olds | 783 (94.3%) | 47 (5.7%) |
| 20 to 24 Year Olds | 536 (80.2%) | 132 (19.8%) |
| 25 to 34 Year Olds | 539 (82.0%) | 118 (18.0%) |
| 35 Years and over | 617 (78.3%) | 171 (21.7%) |
| Total | 11,311 (85.2%) | 1,965 (14.8%) |
Educational Attainment by Field of Study in Van Zandt County
Education (1,565 | 20.7%), business (1,410 | 18.6%), science & technology (821 | 10.8%), liberal arts & history (620 | 8.2%), and bio, nature & agricultural (518 | 6.8%) are the most common fields of study among 7,571 individuals in Van Zandt County who have obtained a bachelor's degree or higher.
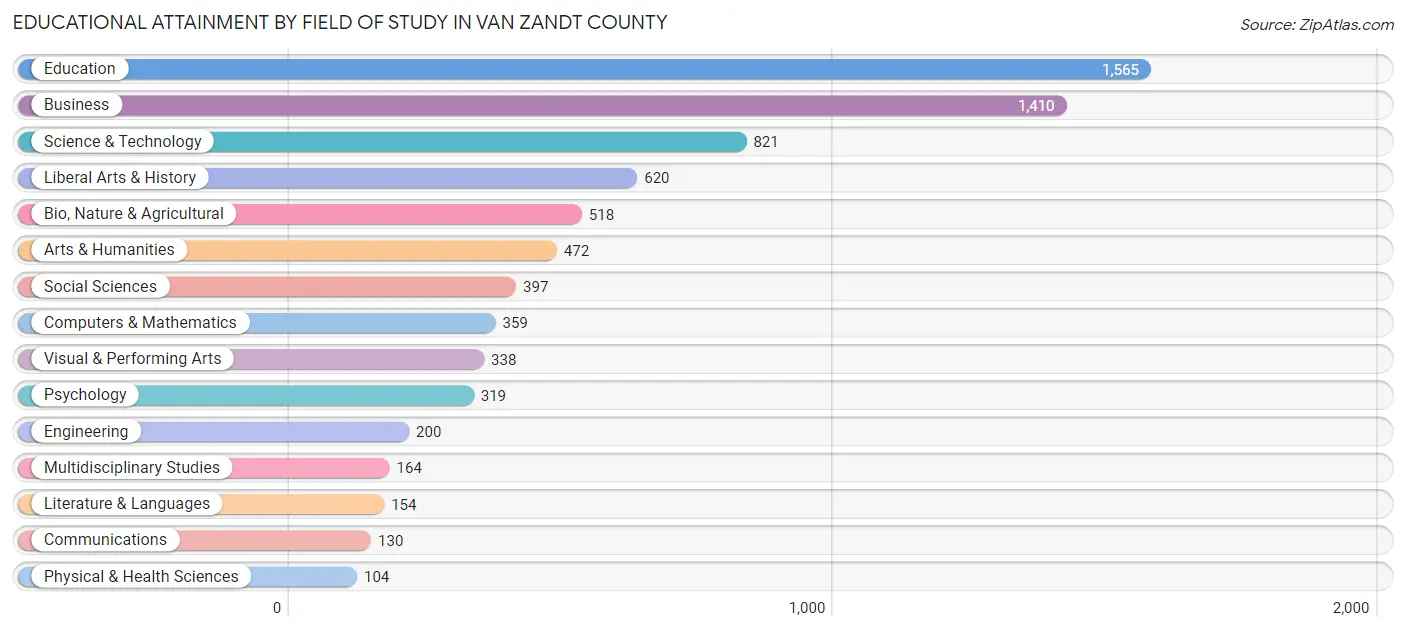
| Field of Study | # Graduates | % Graduates |
| Computers & Mathematics | 359 | 4.7% |
| Bio, Nature & Agricultural | 518 | 6.8% |
| Physical & Health Sciences | 104 | 1.4% |
| Psychology | 319 | 4.2% |
| Social Sciences | 397 | 5.2% |
| Engineering | 200 | 2.6% |
| Multidisciplinary Studies | 164 | 2.2% |
| Science & Technology | 821 | 10.8% |
| Business | 1,410 | 18.6% |
| Education | 1,565 | 20.7% |
| Literature & Languages | 154 | 2.0% |
| Liberal Arts & History | 620 | 8.2% |
| Visual & Performing Arts | 338 | 4.5% |
| Communications | 130 | 1.7% |
| Arts & Humanities | 472 | 6.2% |
| Total | 7,571 | 100.0% |
Transportation & Commute in Van Zandt County
Vehicle Availability by Sex in Van Zandt County
The most prevalent vehicle ownership categories in Van Zandt County are males with 2 vehicles (5,248, accounting for 37.0%) and females with 2 vehicles (3,623, making up 49.0%).
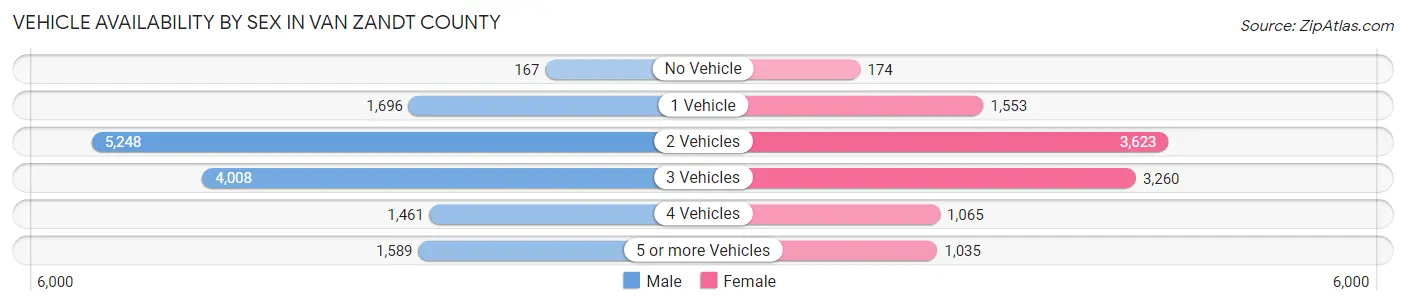
| Vehicles Available | Male | Female |
| No Vehicle | 167 (1.2%) | 174 (1.6%) |
| 1 Vehicle | 1,696 (12.0%) | 1,553 (14.5%) |
| 2 Vehicles | 5,248 (37.0%) | 3,623 (33.8%) |
| 3 Vehicles | 4,008 (28.3%) | 3,260 (30.4%) |
| 4 Vehicles | 1,461 (10.3%) | 1,065 (9.9%) |
| 5 or more Vehicles | 1,589 (11.2%) | 1,035 (9.7%) |
| Total | 14,169 (100.0%) | 10,710 (100.0%) |
Commute Time in Van Zandt County
The most frequently occuring commute durations in Van Zandt County are 60 to 89 minutes (3,268 commuters, 14.2%), 30 to 34 minutes (2,936 commuters, 12.8%), and 45 to 59 minutes (2,727 commuters, 11.9%).
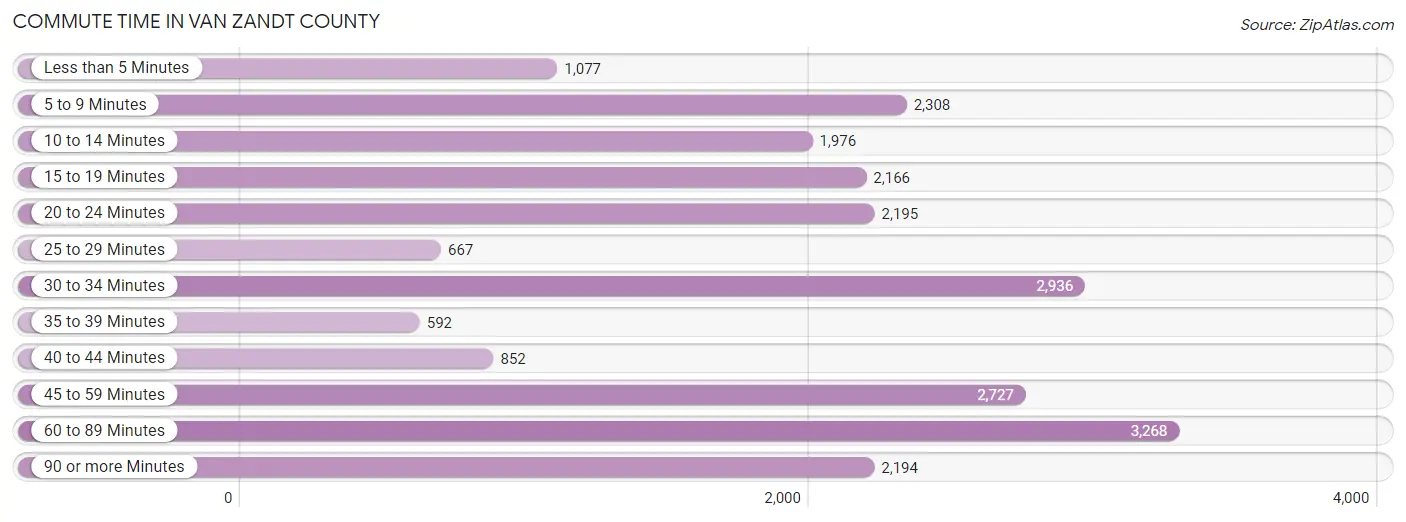
| Commute Time | # Commuters | % Commuters |
| Less than 5 Minutes | 1,077 | 4.7% |
| 5 to 9 Minutes | 2,308 | 10.1% |
| 10 to 14 Minutes | 1,976 | 8.6% |
| 15 to 19 Minutes | 2,166 | 9.4% |
| 20 to 24 Minutes | 2,195 | 9.6% |
| 25 to 29 Minutes | 667 | 2.9% |
| 30 to 34 Minutes | 2,936 | 12.8% |
| 35 to 39 Minutes | 592 | 2.6% |
| 40 to 44 Minutes | 852 | 3.7% |
| 45 to 59 Minutes | 2,727 | 11.9% |
| 60 to 89 Minutes | 3,268 | 14.2% |
| 90 or more Minutes | 2,194 | 9.6% |
Commute Time by Sex in Van Zandt County
The most common commute times in Van Zandt County are 60 to 89 minutes (2,061 commuters, 15.6%) for males and 30 to 34 minutes (1,344 commuters, 13.8%) for females.
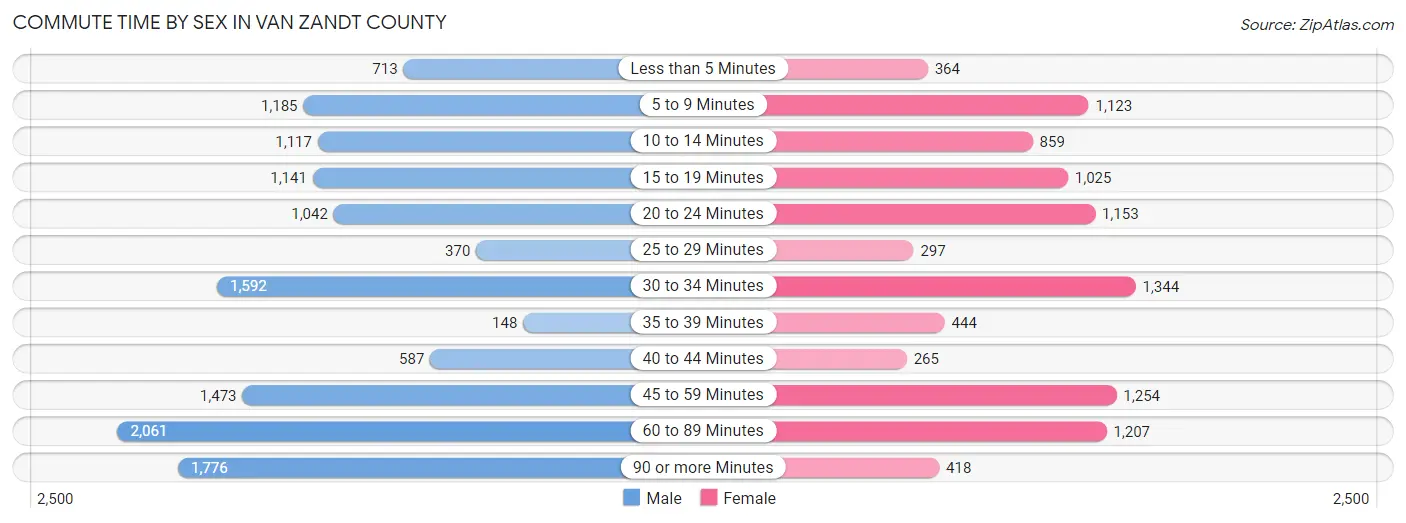
| Commute Time | Male | Female |
| Less than 5 Minutes | 713 (5.4%) | 364 (3.7%) |
| 5 to 9 Minutes | 1,185 (9.0%) | 1,123 (11.5%) |
| 10 to 14 Minutes | 1,117 (8.5%) | 859 (8.8%) |
| 15 to 19 Minutes | 1,141 (8.6%) | 1,025 (10.5%) |
| 20 to 24 Minutes | 1,042 (7.9%) | 1,153 (11.8%) |
| 25 to 29 Minutes | 370 (2.8%) | 297 (3.0%) |
| 30 to 34 Minutes | 1,592 (12.1%) | 1,344 (13.8%) |
| 35 to 39 Minutes | 148 (1.1%) | 444 (4.5%) |
| 40 to 44 Minutes | 587 (4.4%) | 265 (2.7%) |
| 45 to 59 Minutes | 1,473 (11.2%) | 1,254 (12.9%) |
| 60 to 89 Minutes | 2,061 (15.6%) | 1,207 (12.4%) |
| 90 or more Minutes | 1,776 (13.5%) | 418 (4.3%) |
Time of Departure to Work by Sex in Van Zandt County
The most frequent times of departure to work in Van Zandt County are 7:00 AM to 7:29 AM (2,480, 18.8%) for males and 7:00 AM to 7:29 AM (1,920, 19.7%) for females.
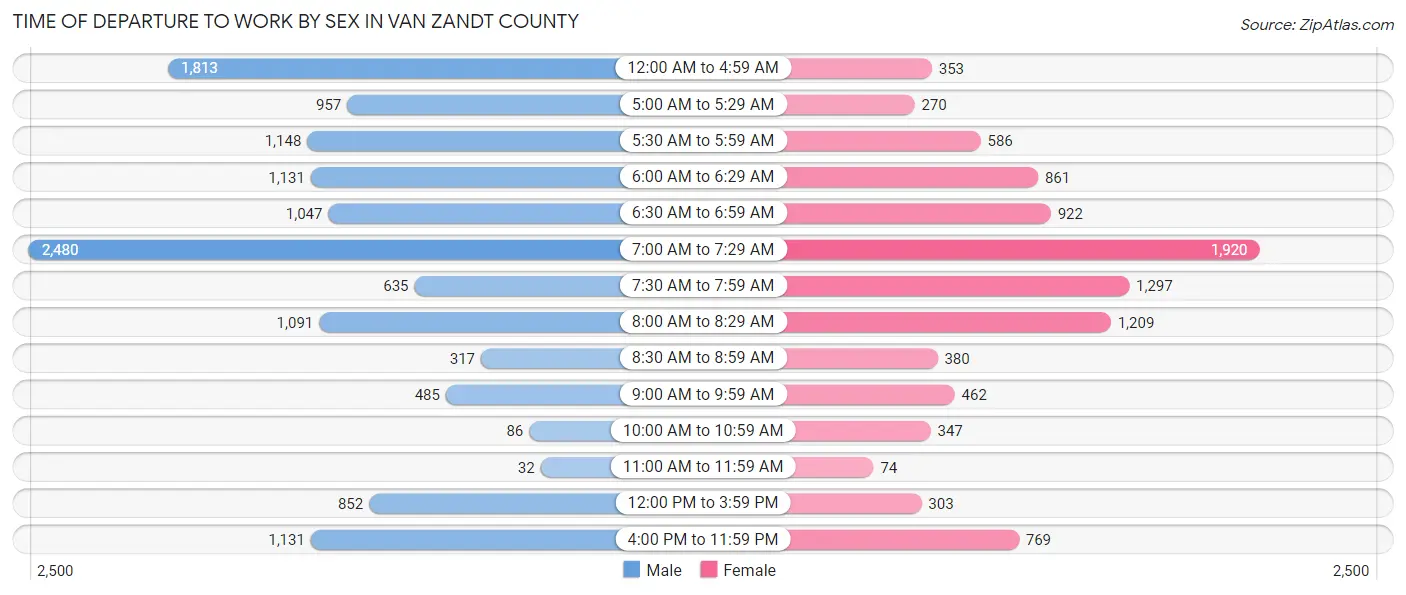
| Time of Departure | Male | Female |
| 12:00 AM to 4:59 AM | 1,813 (13.7%) | 353 (3.6%) |
| 5:00 AM to 5:29 AM | 957 (7.2%) | 270 (2.8%) |
| 5:30 AM to 5:59 AM | 1,148 (8.7%) | 586 (6.0%) |
| 6:00 AM to 6:29 AM | 1,131 (8.6%) | 861 (8.8%) |
| 6:30 AM to 6:59 AM | 1,047 (7.9%) | 922 (9.5%) |
| 7:00 AM to 7:29 AM | 2,480 (18.8%) | 1,920 (19.7%) |
| 7:30 AM to 7:59 AM | 635 (4.8%) | 1,297 (13.3%) |
| 8:00 AM to 8:29 AM | 1,091 (8.3%) | 1,209 (12.4%) |
| 8:30 AM to 8:59 AM | 317 (2.4%) | 380 (3.9%) |
| 9:00 AM to 9:59 AM | 485 (3.7%) | 462 (4.7%) |
| 10:00 AM to 10:59 AM | 86 (0.6%) | 347 (3.6%) |
| 11:00 AM to 11:59 AM | 32 (0.2%) | 74 (0.8%) |
| 12:00 PM to 3:59 PM | 852 (6.5%) | 303 (3.1%) |
| 4:00 PM to 11:59 PM | 1,131 (8.6%) | 769 (7.9%) |
| Total | 13,205 (100.0%) | 9,753 (100.0%) |
Housing Occupancy in Van Zandt County
Occupancy by Ownership in Van Zandt County
Of the total 22,326 dwellings in Van Zandt County, owner-occupied units account for 17,784 (79.7%), while renter-occupied units make up 4,542 (20.3%).
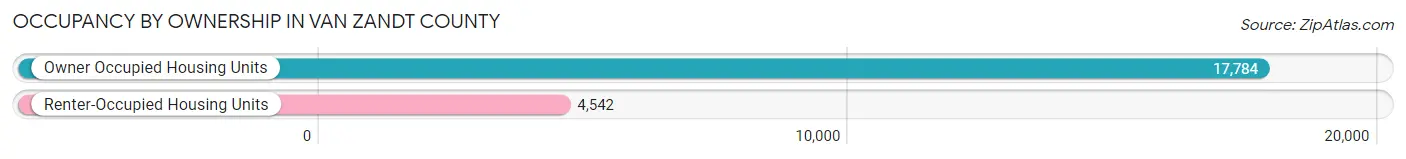
| Occupancy | # Housing Units | % Housing Units |
| Owner Occupied Housing Units | 17,784 | 79.7% |
| Renter-Occupied Housing Units | 4,542 | 20.3% |
| Total Occupied Housing Units | 22,326 | 100.0% |
Occupancy by Household Size in Van Zandt County
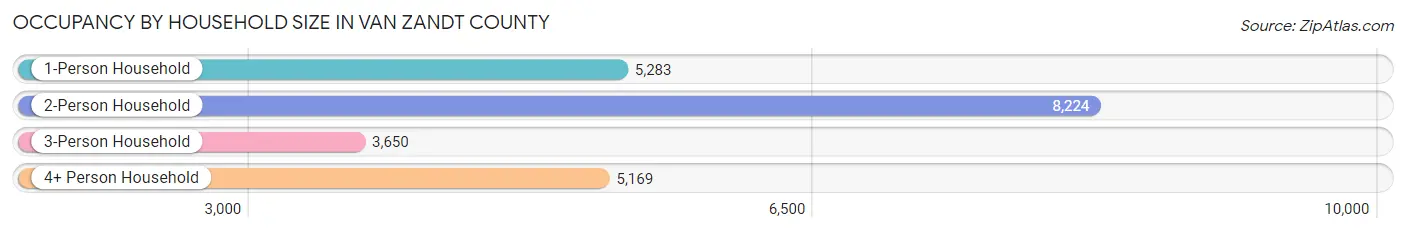
| Household Size | # Housing Units | % Housing Units |
| 1-Person Household | 5,283 | 23.7% |
| 2-Person Household | 8,224 | 36.8% |
| 3-Person Household | 3,650 | 16.4% |
| 4+ Person Household | 5,169 | 23.2% |
| Total Housing Units | 22,326 | 100.0% |
Occupancy by Ownership by Household Size in Van Zandt County
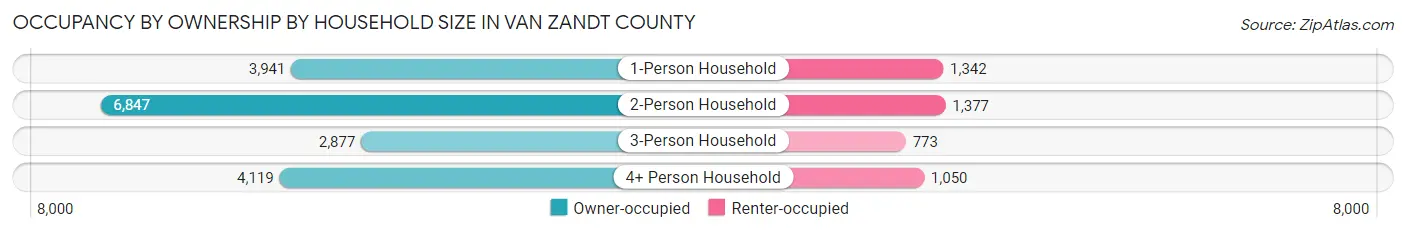
| Household Size | Owner-occupied | Renter-occupied |
| 1-Person Household | 3,941 (74.6%) | 1,342 (25.4%) |
| 2-Person Household | 6,847 (83.3%) | 1,377 (16.7%) |
| 3-Person Household | 2,877 (78.8%) | 773 (21.2%) |
| 4+ Person Household | 4,119 (79.7%) | 1,050 (20.3%) |
| Total Housing Units | 17,784 (79.7%) | 4,542 (20.3%) |
Occupancy by Educational Attainment in Van Zandt County
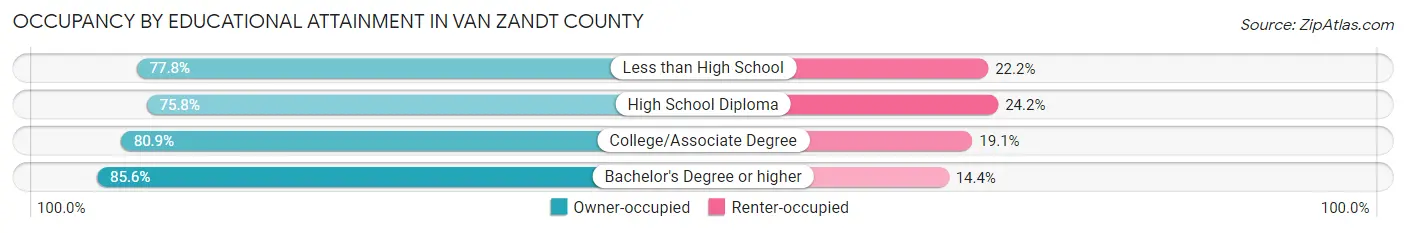
| Household Size | Owner-occupied | Renter-occupied |
| Less than High School | 2,188 (77.8%) | 625 (22.2%) |
| High School Diploma | 5,499 (75.8%) | 1,756 (24.2%) |
| College/Associate Degree | 6,859 (80.9%) | 1,617 (19.1%) |
| Bachelor's Degree or higher | 3,238 (85.6%) | 544 (14.4%) |
Occupancy by Age of Householder in Van Zandt County
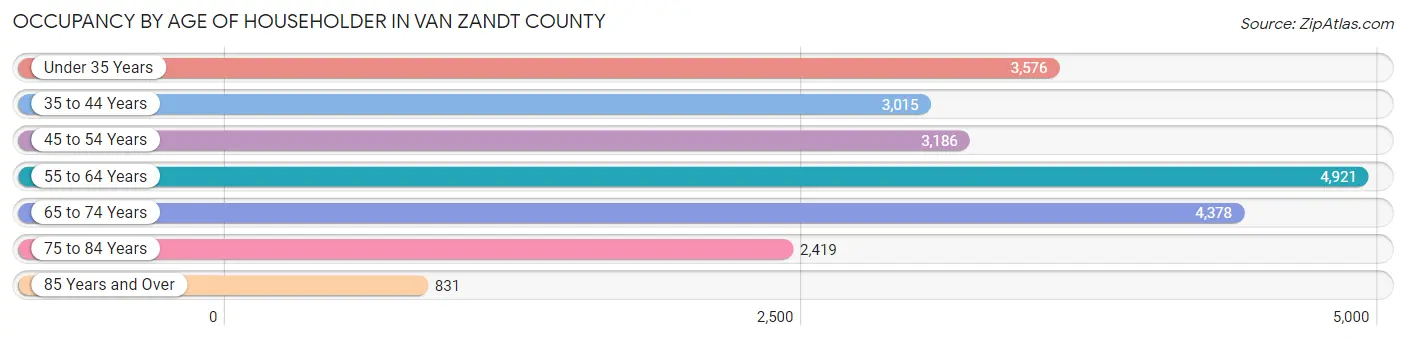
| Age Bracket | # Households | % Households |
| Under 35 Years | 3,576 | 16.0% |
| 35 to 44 Years | 3,015 | 13.5% |
| 45 to 54 Years | 3,186 | 14.3% |
| 55 to 64 Years | 4,921 | 22.0% |
| 65 to 74 Years | 4,378 | 19.6% |
| 75 to 84 Years | 2,419 | 10.8% |
| 85 Years and Over | 831 | 3.7% |
| Total | 22,326 | 100.0% |
Housing Finances in Van Zandt County
Median Income by Occupancy in Van Zandt County
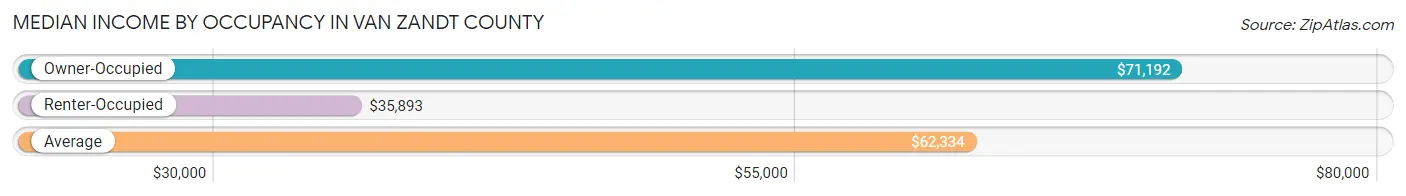
| Occupancy Type | # Households | Median Income |
| Owner-Occupied | 17,784 (79.7%) | $71,192 |
| Renter-Occupied | 4,542 (20.3%) | $35,893 |
| Average | 22,326 (100.0%) | $62,334 |
Occupancy by Householder Income Bracket in Van Zandt County
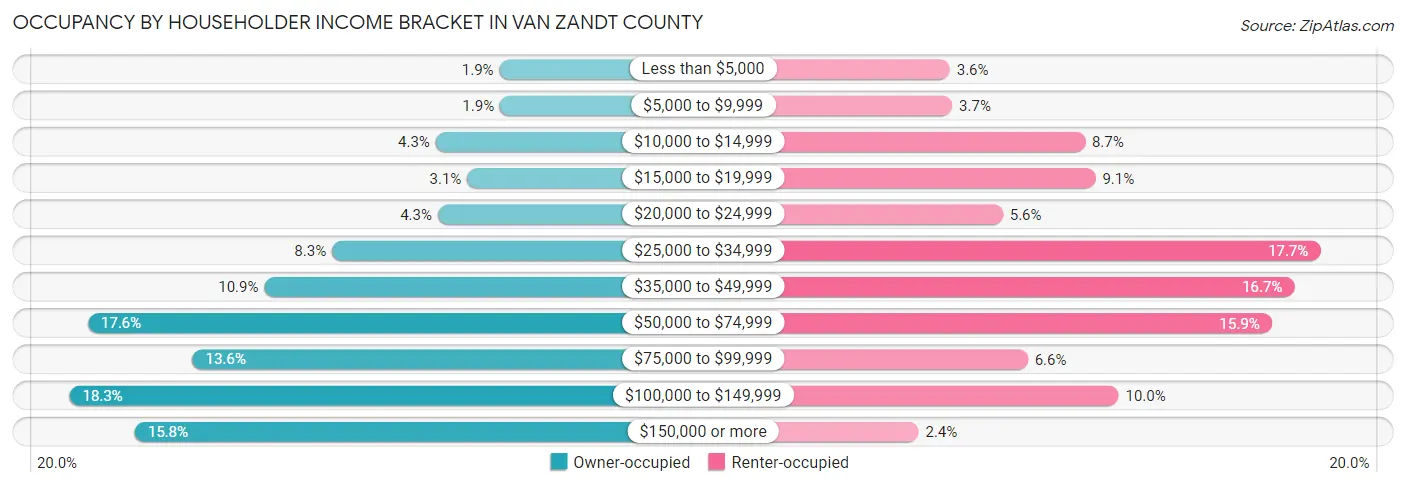
| Income Bracket | Owner-occupied | Renter-occupied |
| Less than $5,000 | 340 (1.9%) | 163 (3.6%) |
| $5,000 to $9,999 | 336 (1.9%) | 167 (3.7%) |
| $10,000 to $14,999 | 772 (4.3%) | 397 (8.7%) |
| $15,000 to $19,999 | 559 (3.1%) | 415 (9.1%) |
| $20,000 to $24,999 | 758 (4.3%) | 255 (5.6%) |
| $25,000 to $34,999 | 1,475 (8.3%) | 804 (17.7%) |
| $35,000 to $49,999 | 1,934 (10.9%) | 759 (16.7%) |
| $50,000 to $74,999 | 3,129 (17.6%) | 720 (15.9%) |
| $75,000 to $99,999 | 2,418 (13.6%) | 298 (6.6%) |
| $100,000 to $149,999 | 3,253 (18.3%) | 455 (10.0%) |
| $150,000 or more | 2,810 (15.8%) | 109 (2.4%) |
| Total | 17,784 (100.0%) | 4,542 (100.0%) |
Monthly Housing Cost Tiers in Van Zandt County
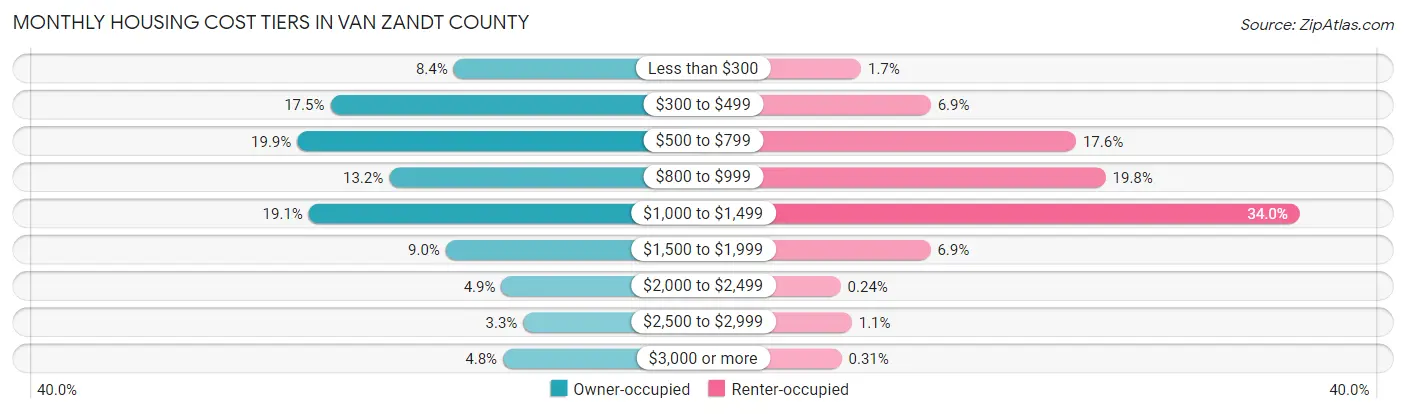
| Monthly Cost | Owner-occupied | Renter-occupied |
| Less than $300 | 1,496 (8.4%) | 79 (1.7%) |
| $300 to $499 | 3,110 (17.5%) | 312 (6.9%) |
| $500 to $799 | 3,545 (19.9%) | 798 (17.6%) |
| $800 to $999 | 2,341 (13.2%) | 897 (19.8%) |
| $1,000 to $1,499 | 3,393 (19.1%) | 1,546 (34.0%) |
| $1,500 to $1,999 | 1,599 (9.0%) | 311 (6.9%) |
| $2,000 to $2,499 | 869 (4.9%) | 11 (0.2%) |
| $2,500 to $2,999 | 583 (3.3%) | 48 (1.1%) |
| $3,000 or more | 848 (4.8%) | 14 (0.3%) |
| Total | 17,784 (100.0%) | 4,542 (100.0%) |
Physical Housing Characteristics in Van Zandt County
Housing Structures in Van Zandt County
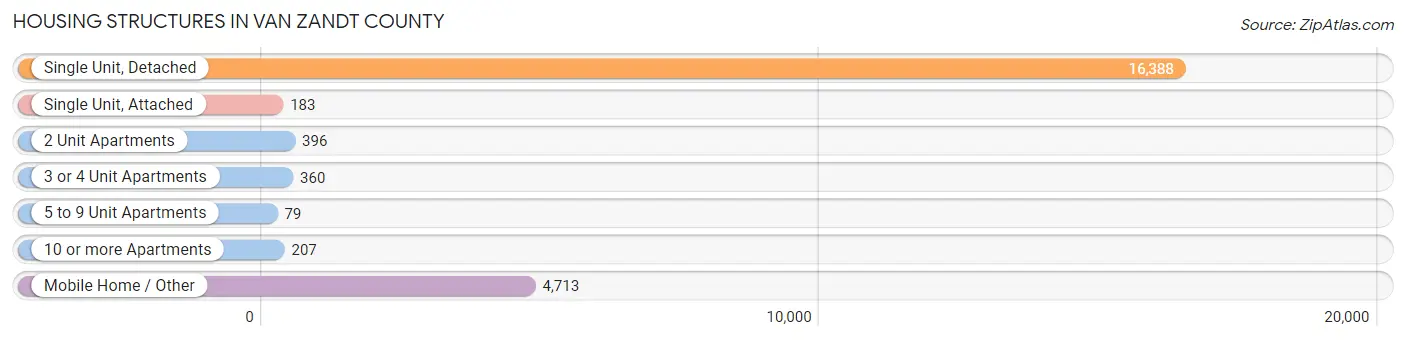
| Structure Type | # Housing Units | % Housing Units |
| Single Unit, Detached | 16,388 | 73.4% |
| Single Unit, Attached | 183 | 0.8% |
| 2 Unit Apartments | 396 | 1.8% |
| 3 or 4 Unit Apartments | 360 | 1.6% |
| 5 to 9 Unit Apartments | 79 | 0.4% |
| 10 or more Apartments | 207 | 0.9% |
| Mobile Home / Other | 4,713 | 21.1% |
| Total | 22,326 | 100.0% |
Housing Structures by Occupancy in Van Zandt County
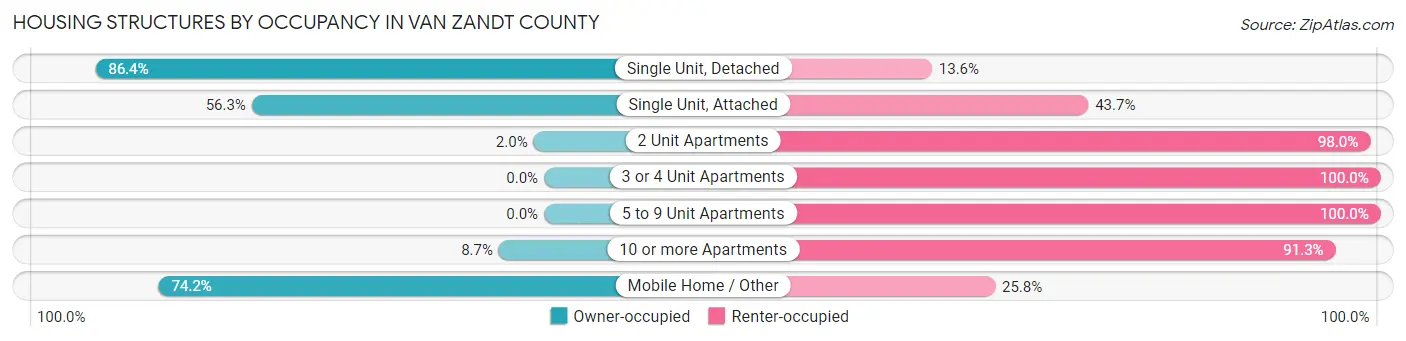
| Structure Type | Owner-occupied | Renter-occupied |
| Single Unit, Detached | 14,157 (86.4%) | 2,231 (13.6%) |
| Single Unit, Attached | 103 (56.3%) | 80 (43.7%) |
| 2 Unit Apartments | 8 (2.0%) | 388 (98.0%) |
| 3 or 4 Unit Apartments | 0 (0.0%) | 360 (100.0%) |
| 5 to 9 Unit Apartments | 0 (0.0%) | 79 (100.0%) |
| 10 or more Apartments | 18 (8.7%) | 189 (91.3%) |
| Mobile Home / Other | 3,498 (74.2%) | 1,215 (25.8%) |
| Total | 17,784 (79.7%) | 4,542 (20.3%) |
Housing Structures by Number of Rooms in Van Zandt County
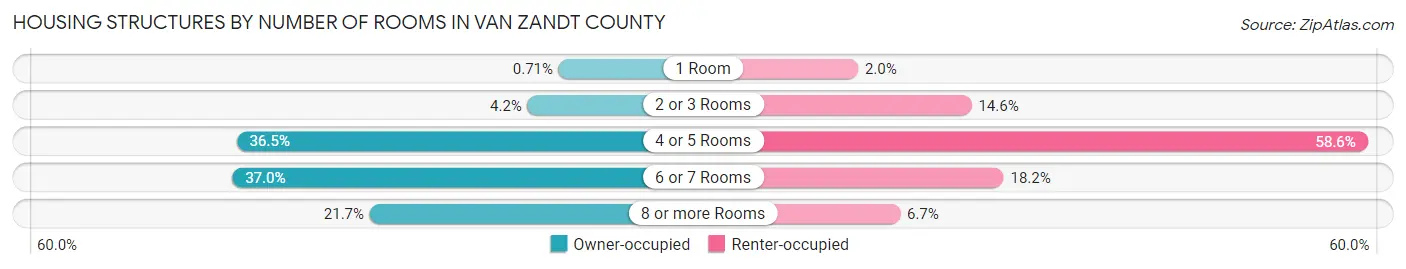
| Number of Rooms | Owner-occupied | Renter-occupied |
| 1 Room | 127 (0.7%) | 91 (2.0%) |
| 2 or 3 Rooms | 742 (4.2%) | 663 (14.6%) |
| 4 or 5 Rooms | 6,487 (36.5%) | 2,660 (58.6%) |
| 6 or 7 Rooms | 6,572 (36.9%) | 825 (18.2%) |
| 8 or more Rooms | 3,856 (21.7%) | 303 (6.7%) |
| Total | 17,784 (100.0%) | 4,542 (100.0%) |
Housing Structure by Heating Type in Van Zandt County
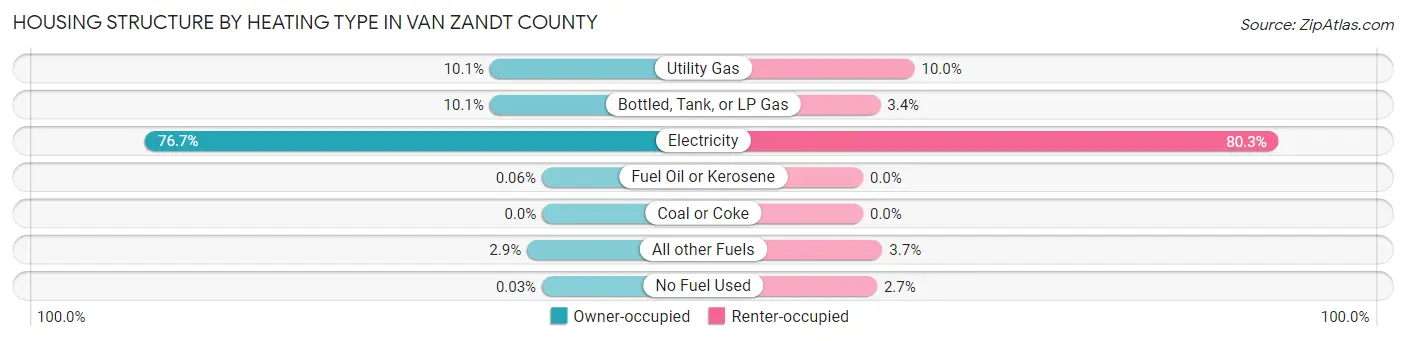
| Heating Type | Owner-occupied | Renter-occupied |
| Utility Gas | 1,800 (10.1%) | 452 (10.0%) |
| Bottled, Tank, or LP Gas | 1,804 (10.1%) | 152 (3.4%) |
| Electricity | 13,643 (76.7%) | 3,646 (80.3%) |
| Fuel Oil or Kerosene | 11 (0.1%) | 0 (0.0%) |
| Coal or Coke | 0 (0.0%) | 0 (0.0%) |
| All other Fuels | 520 (2.9%) | 170 (3.7%) |
| No Fuel Used | 6 (0.0%) | 122 (2.7%) |
| Total | 17,784 (100.0%) | 4,542 (100.0%) |
Household Vehicle Usage in Van Zandt County
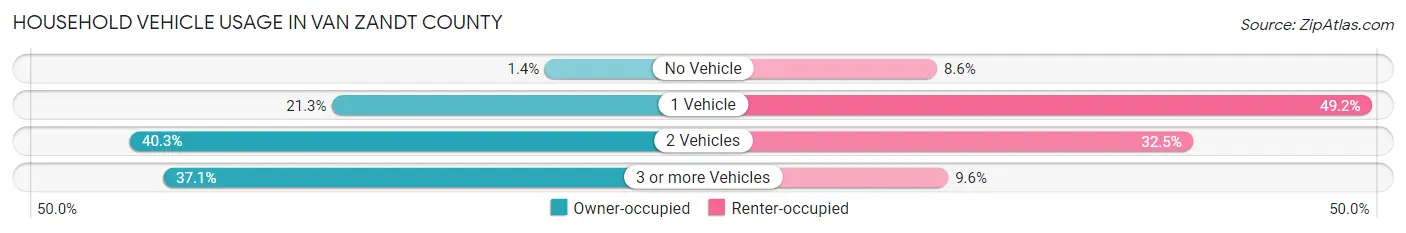
| Vehicles per Household | Owner-occupied | Renter-occupied |
| No Vehicle | 251 (1.4%) | 390 (8.6%) |
| 1 Vehicle | 3,782 (21.3%) | 2,236 (49.2%) |
| 2 Vehicles | 7,158 (40.3%) | 1,478 (32.5%) |
| 3 or more Vehicles | 6,593 (37.1%) | 438 (9.6%) |
| Total | 17,784 (100.0%) | 4,542 (100.0%) |
Real Estate & Mortgages in Van Zandt County
Real Estate and Mortgage Overview in Van Zandt County
| Characteristic | Without Mortgage | With Mortgage |
| Housing Units | 10,152 | 7,632 |
| Median Property Value | $168,000 | $198,800 |
| Median Household Income | $54,834 | $1,679 |
| Monthly Housing Costs | $539 | $689 |
| Real Estate Taxes | $1,697 | $319 |
Property Value by Mortgage Status in Van Zandt County
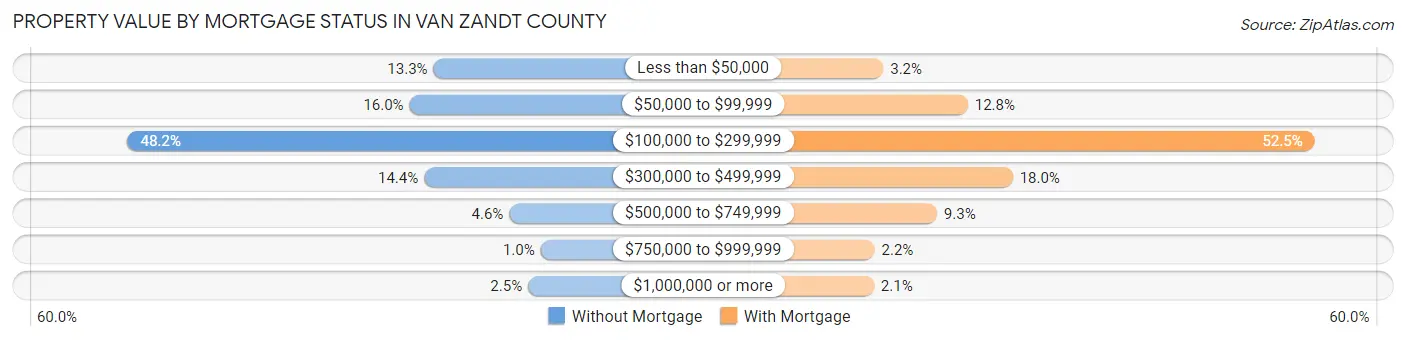
| Property Value | Without Mortgage | With Mortgage |
| Less than $50,000 | 1,348 (13.3%) | 242 (3.2%) |
| $50,000 to $99,999 | 1,626 (16.0%) | 979 (12.8%) |
| $100,000 to $299,999 | 4,896 (48.2%) | 4,004 (52.5%) |
| $300,000 to $499,999 | 1,457 (14.3%) | 1,371 (18.0%) |
| $500,000 to $749,999 | 469 (4.6%) | 710 (9.3%) |
| $750,000 to $999,999 | 105 (1.0%) | 166 (2.2%) |
| $1,000,000 or more | 251 (2.5%) | 160 (2.1%) |
| Total | 10,152 (100.0%) | 7,632 (100.0%) |
Household Income by Mortgage Status in Van Zandt County
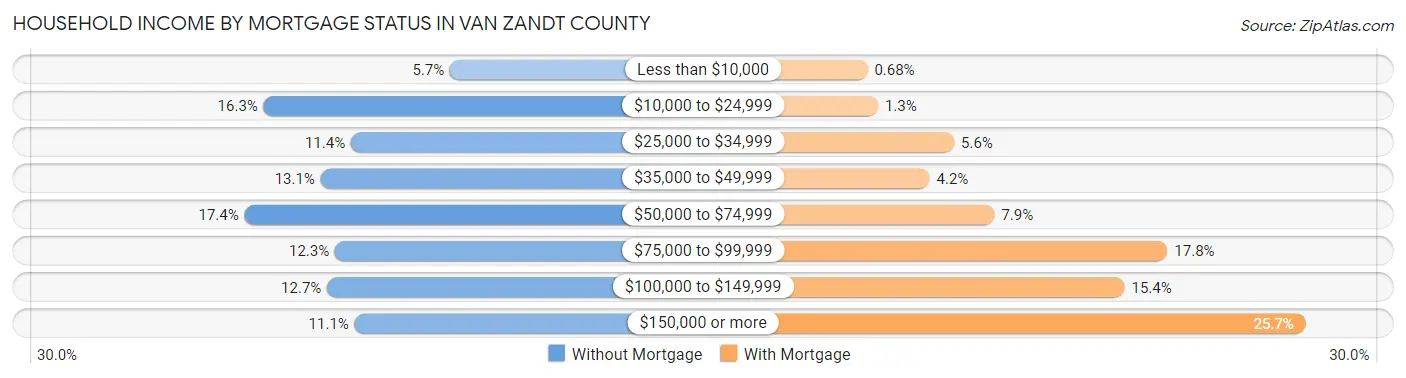
| Household Income | Without Mortgage | With Mortgage |
| Less than $10,000 | 578 (5.7%) | 52 (0.7%) |
| $10,000 to $24,999 | 1,659 (16.3%) | 98 (1.3%) |
| $25,000 to $34,999 | 1,152 (11.4%) | 430 (5.6%) |
| $35,000 to $49,999 | 1,328 (13.1%) | 323 (4.2%) |
| $50,000 to $74,999 | 1,769 (17.4%) | 606 (7.9%) |
| $75,000 to $99,999 | 1,245 (12.3%) | 1,360 (17.8%) |
| $100,000 to $149,999 | 1,290 (12.7%) | 1,173 (15.4%) |
| $150,000 or more | 1,131 (11.1%) | 1,963 (25.7%) |
| Total | 10,152 (100.0%) | 7,632 (100.0%) |
Property Value to Household Income Ratio in Van Zandt County
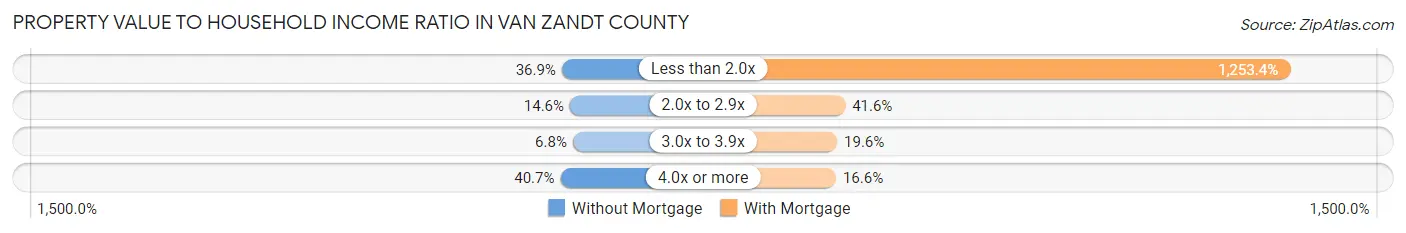
| Value-to-Income Ratio | Without Mortgage | With Mortgage |
| Less than 2.0x | 3,745 (36.9%) | 95,662 (1,253.4%) |
| 2.0x to 2.9x | 1,477 (14.5%) | 3,173 (41.6%) |
| 3.0x to 3.9x | 686 (6.8%) | 1,492 (19.6%) |
| 4.0x or more | 4,131 (40.7%) | 1,266 (16.6%) |
| Total | 10,152 (100.0%) | 7,632 (100.0%) |
Real Estate Taxes by Mortgage Status in Van Zandt County
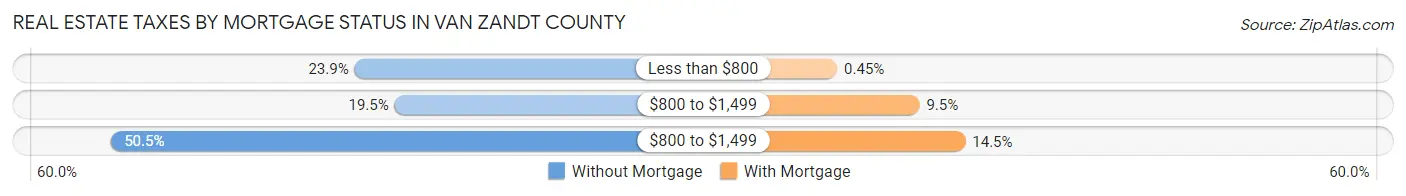
| Property Taxes | Without Mortgage | With Mortgage |
| Less than $800 | 2,421 (23.8%) | 34 (0.4%) |
| $800 to $1,499 | 1,976 (19.5%) | 723 (9.5%) |
| $800 to $1,499 | 5,127 (50.5%) | 1,107 (14.5%) |
| Total | 10,152 (100.0%) | 7,632 (100.0%) |
Health & Disability in Van Zandt County
Health Insurance Coverage by Age in Van Zandt County
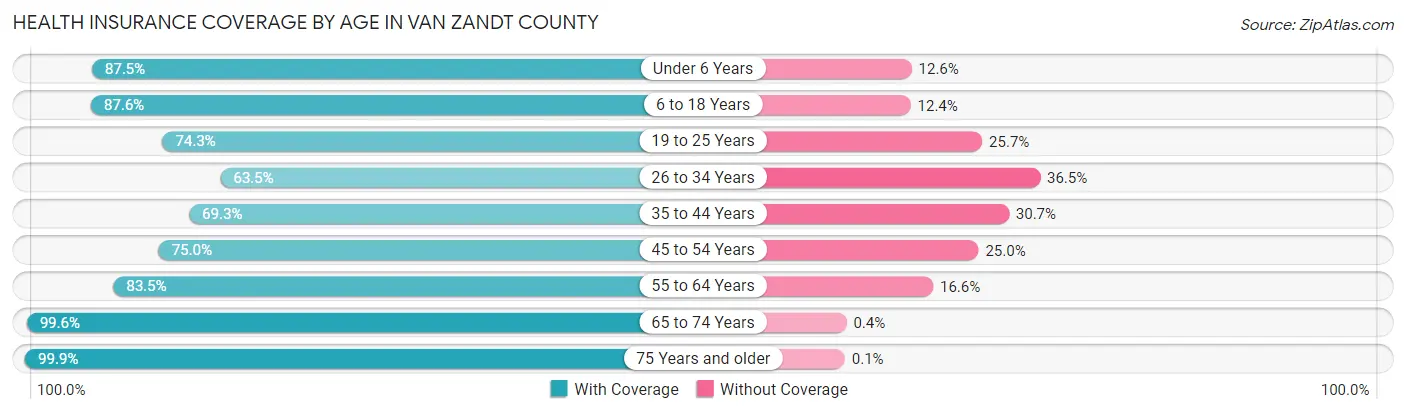
| Age Bracket | With Coverage | Without Coverage |
| Under 6 Years | 3,784 (87.5%) | 543 (12.6%) |
| 6 to 18 Years | 8,907 (87.6%) | 1,257 (12.4%) |
| 19 to 25 Years | 3,173 (74.3%) | 1,098 (25.7%) |
| 26 to 34 Years | 3,858 (63.5%) | 2,218 (36.5%) |
| 35 to 44 Years | 4,832 (69.3%) | 2,140 (30.7%) |
| 45 to 54 Years | 5,454 (75.0%) | 1,820 (25.0%) |
| 55 to 64 Years | 7,149 (83.5%) | 1,418 (16.6%) |
| 65 to 74 Years | 6,888 (99.6%) | 28 (0.4%) |
| 75 Years and older | 4,871 (99.9%) | 5 (0.1%) |
| Total | 48,916 (82.3%) | 10,527 (17.7%) |
Health Insurance Coverage by Citizenship Status in Van Zandt County
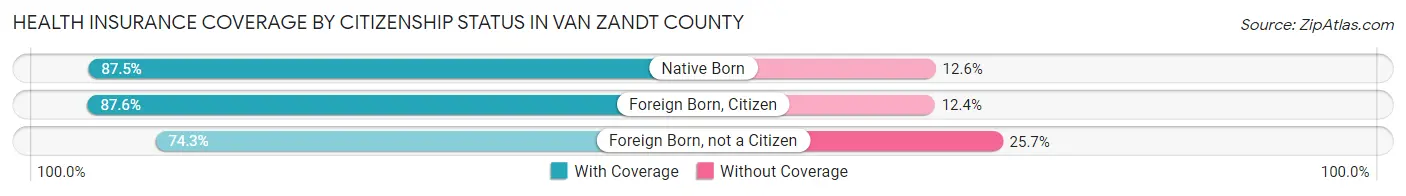
| Citizenship Status | With Coverage | Without Coverage |
| Native Born | 3,784 (87.5%) | 543 (12.6%) |
| Foreign Born, Citizen | 8,907 (87.6%) | 1,257 (12.4%) |
| Foreign Born, not a Citizen | 3,173 (74.3%) | 1,098 (25.7%) |
Health Insurance Coverage by Household Income in Van Zandt County
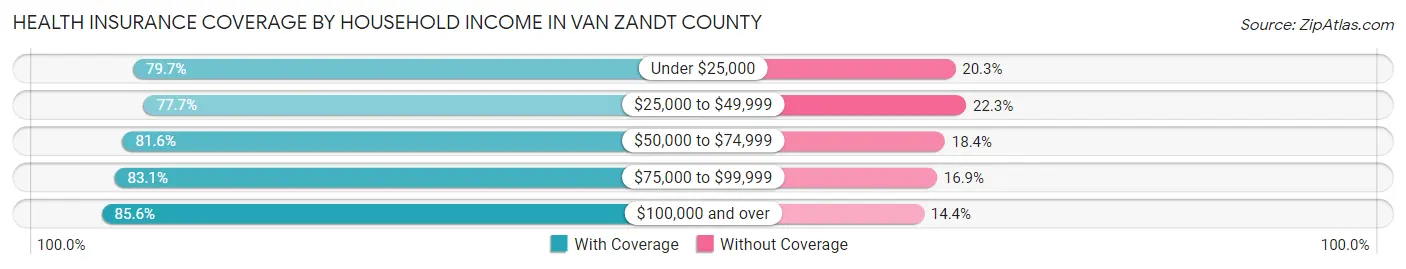
| Household Income | With Coverage | Without Coverage |
| Under $25,000 | 5,820 (79.7%) | 1,485 (20.3%) |
| $25,000 to $49,999 | 8,693 (77.7%) | 2,501 (22.3%) |
| $50,000 to $74,999 | 8,784 (81.6%) | 1,977 (18.4%) |
| $75,000 to $99,999 | 6,746 (83.1%) | 1,369 (16.9%) |
| $100,000 and over | 18,856 (85.6%) | 3,183 (14.4%) |
Public vs Private Health Insurance Coverage by Age in Van Zandt County
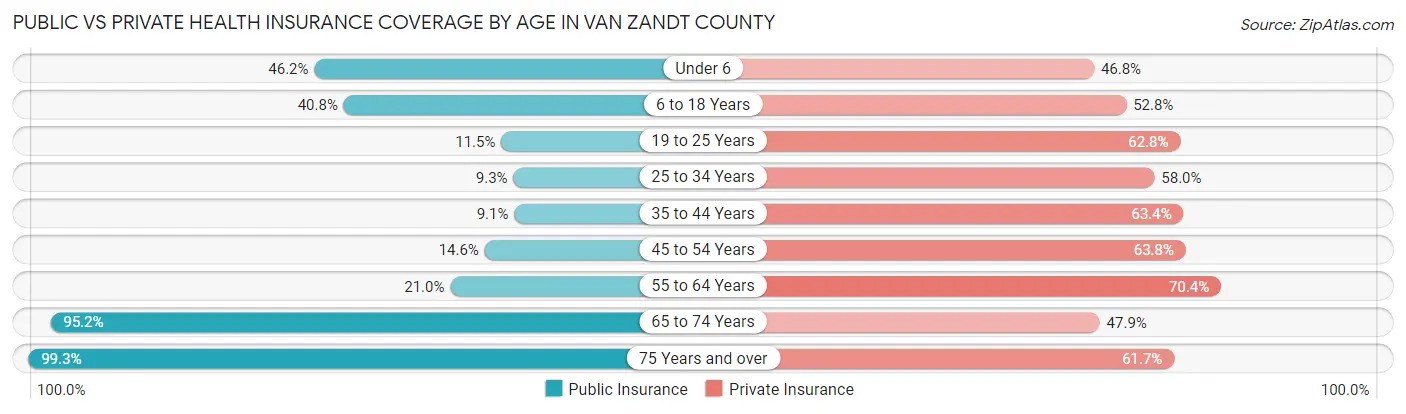
| Age Bracket | Public Insurance | Private Insurance |
| Under 6 | 2,000 (46.2%) | 2,025 (46.8%) |
| 6 to 18 Years | 4,143 (40.8%) | 5,366 (52.8%) |
| 19 to 25 Years | 492 (11.5%) | 2,684 (62.8%) |
| 25 to 34 Years | 563 (9.3%) | 3,525 (58.0%) |
| 35 to 44 Years | 635 (9.1%) | 4,422 (63.4%) |
| 45 to 54 Years | 1,062 (14.6%) | 4,644 (63.8%) |
| 55 to 64 Years | 1,798 (21.0%) | 6,031 (70.4%) |
| 65 to 74 Years | 6,586 (95.2%) | 3,310 (47.9%) |
| 75 Years and over | 4,843 (99.3%) | 3,008 (61.7%) |
| Total | 22,122 (37.2%) | 35,015 (58.9%) |
Disability Status by Sex by Age in Van Zandt County
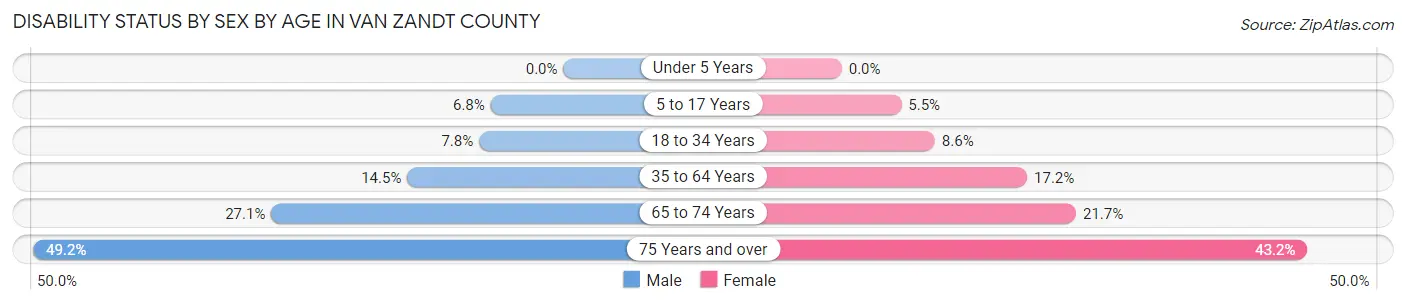
| Age Bracket | Male | Female |
| Under 5 Years | 0 (0.0%) | 0 (0.0%) |
| 5 to 17 Years | 347 (6.8%) | 279 (5.5%) |
| 18 to 34 Years | 438 (7.8%) | 480 (8.6%) |
| 35 to 64 Years | 1,636 (14.5%) | 1,982 (17.2%) |
| 65 to 74 Years | 891 (27.1%) | 789 (21.7%) |
| 75 Years and over | 1,053 (49.2%) | 1,182 (43.2%) |
Disability Class by Sex by Age in Van Zandt County
Disability Class: Hearing Difficulty
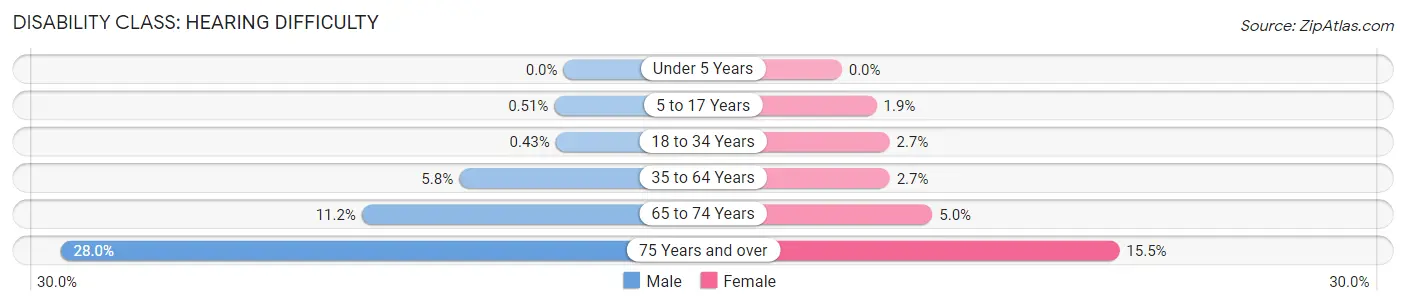
| Age Bracket | Male | Female |
| Under 5 Years | 0 (0.0%) | 0 (0.0%) |
| 5 to 17 Years | 26 (0.5%) | 98 (1.9%) |
| 18 to 34 Years | 24 (0.4%) | 148 (2.7%) |
| 35 to 64 Years | 656 (5.8%) | 308 (2.7%) |
| 65 to 74 Years | 369 (11.2%) | 183 (5.0%) |
| 75 Years and over | 599 (28.0%) | 423 (15.5%) |
Disability Class: Vision Difficulty
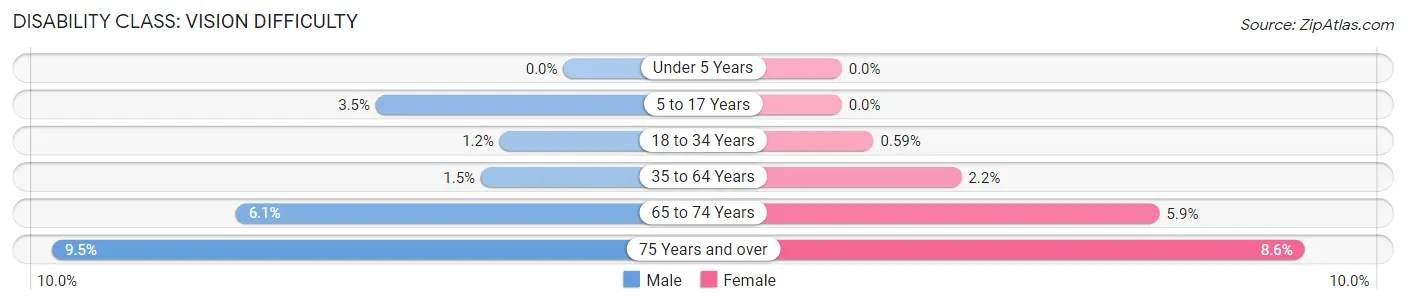
| Age Bracket | Male | Female |
| Under 5 Years | 0 (0.0%) | 0 (0.0%) |
| 5 to 17 Years | 179 (3.5%) | 0 (0.0%) |
| 18 to 34 Years | 66 (1.2%) | 33 (0.6%) |
| 35 to 64 Years | 173 (1.5%) | 256 (2.2%) |
| 65 to 74 Years | 200 (6.1%) | 214 (5.9%) |
| 75 Years and over | 203 (9.5%) | 235 (8.6%) |
Disability Class: Cognitive Difficulty
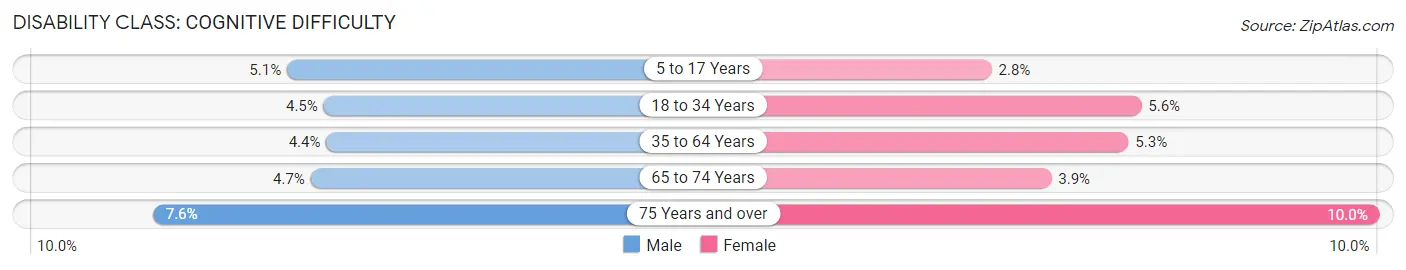
| Age Bracket | Male | Female |
| 5 to 17 Years | 264 (5.1%) | 140 (2.8%) |
| 18 to 34 Years | 249 (4.4%) | 309 (5.6%) |
| 35 to 64 Years | 497 (4.4%) | 613 (5.3%) |
| 65 to 74 Years | 154 (4.7%) | 141 (3.9%) |
| 75 Years and over | 163 (7.6%) | 273 (10.0%) |
Disability Class: Ambulatory Difficulty
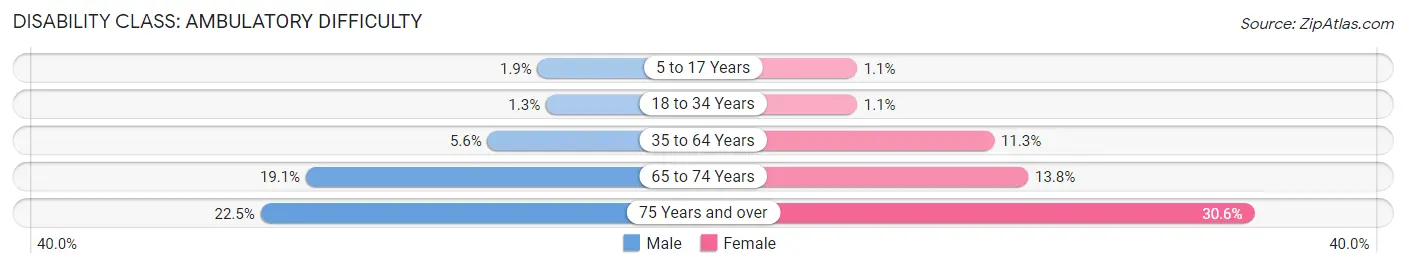
| Age Bracket | Male | Female |
| 5 to 17 Years | 98 (1.9%) | 56 (1.1%) |
| 18 to 34 Years | 72 (1.3%) | 62 (1.1%) |
| 35 to 64 Years | 636 (5.6%) | 1,302 (11.3%) |
| 65 to 74 Years | 628 (19.1%) | 502 (13.8%) |
| 75 Years and over | 481 (22.5%) | 838 (30.6%) |
Disability Class: Self-Care Difficulty
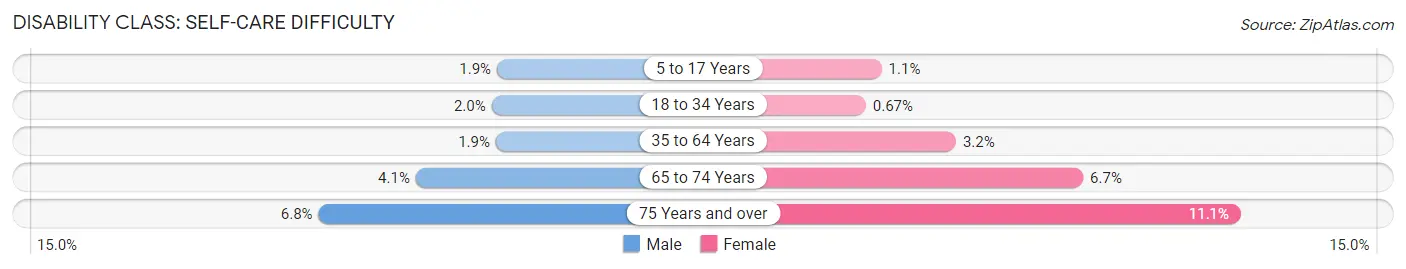
| Age Bracket | Male | Female |
| 5 to 17 Years | 95 (1.8%) | 56 (1.1%) |
| 18 to 34 Years | 112 (2.0%) | 37 (0.7%) |
| 35 to 64 Years | 212 (1.9%) | 366 (3.2%) |
| 65 to 74 Years | 135 (4.1%) | 244 (6.7%) |
| 75 Years and over | 146 (6.8%) | 304 (11.1%) |
Technology Access in Van Zandt County
Computing Device Access in Van Zandt County
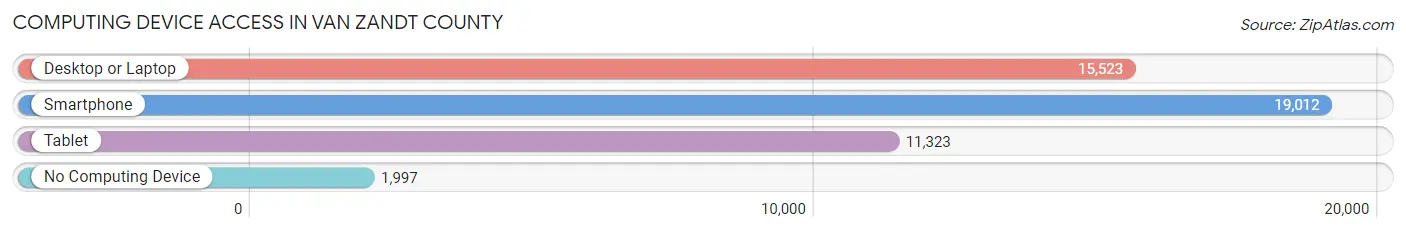
| Device Type | # Households | % Households |
| Desktop or Laptop | 15,523 | 69.5% |
| Smartphone | 19,012 | 85.2% |
| Tablet | 11,323 | 50.7% |
| No Computing Device | 1,997 | 8.9% |
| Total | 22,326 | 100.0% |
Internet Access in Van Zandt County
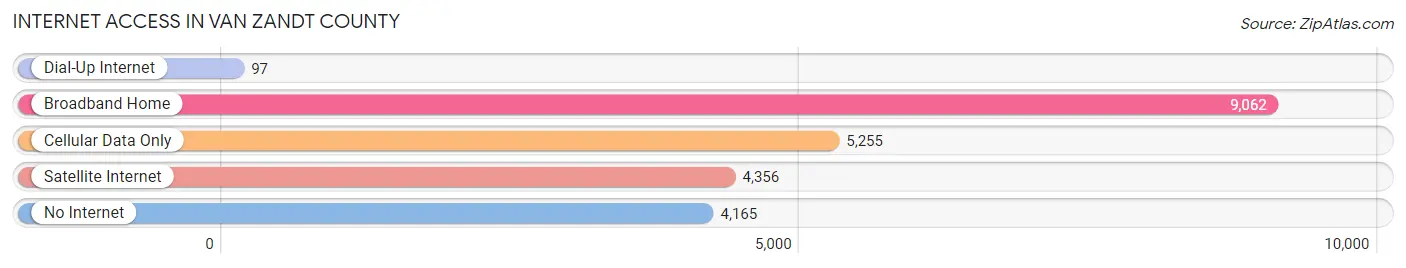
| Internet Type | # Households | % Households |
| Dial-Up Internet | 97 | 0.4% |
| Broadband Home | 9,062 | 40.6% |
| Cellular Data Only | 5,255 | 23.5% |
| Satellite Internet | 4,356 | 19.5% |
| No Internet | 4,165 | 18.7% |
| Total | 22,326 | 100.0% |
Van Zandt County Summary
Van Zandt County is located in the northeast corner of Texas, and is part of the Tyler-Longview metropolitan area. It is bordered by Hunt County to the north, Rains County to the east, Wood County to the south, and Smith and Henderson Counties to the west. The county seat is Canton, and the largest city is Grand Saline. The county has a total area of 845 square miles, and a population of 52,579 as of the 2010 census.
History
Van Zandt County was established in 1848, and was named for Isaac Van Zandt, a prominent politician and diplomat from the Republic of Texas. The county was originally part of the Peters Colony, a land grant given to settlers by the Republic of Texas in 1841. The first settlers in the area were mostly farmers and ranchers, and the county was largely rural until the early 20th century.
In the early 1900s, the county began to experience an economic boom due to the discovery of oil and natural gas. This led to the development of several towns, including Grand Saline, Edom, and Wills Point. The county also experienced a population boom, as many people moved to the area to take advantage of the new economic opportunities.
Geography
Van Zandt County is located in the northeast corner of Texas, and is part of the Tyler-Longview metropolitan area. It is bordered by Hunt County to the north, Rains County to the east, Wood County to the south, and Smith and Henderson Counties to the west. The county has a total area of 845 square miles, and is mostly rural, with only a few small towns and cities. The terrain is mostly flat, with some rolling hills in the western part of the county. The county is drained by the Sabine River, which forms its northern border.
Economy
Van Zandt County has a diverse economy, with a mix of agriculture, manufacturing, and service industries. The county is home to several large employers, including Pilgrim’s Pride, a poultry processing plant, and the Grand Saline Salt Mine. Agriculture is also an important part of the economy, with the county producing hay, cotton, corn, and other crops.
The county also has a thriving tourism industry, with several popular attractions, including the Canton Trade Days, a large flea market held on the first weekend of every month, and the Van Zandt County Historical Museum.
Demographics
As of the 2010 census, Van Zandt County had a population of 52,579. The racial makeup of the county was 79.3% White, 15.2% African American, 0.7% Native American, 0.5% Asian, 0.1% Pacific Islander, 2.7% from other races, and 1.5% from two or more races. Hispanic or Latino of any race were 6.7% of the population.
The median income for a household in the county was $37,945, and the median income for a family was $45,945. The per capita income for the county was $19,945. About 14.3% of families and 17.7% of the population were below the poverty line, including 25.2% of those under age 18 and 11.7% of those age 65 or over.
Common Questions
What is Per Capita Income in Van Zandt County?
Per Capita income in Van Zandt County is $33,092.
What is the Median Family Income in Van Zandt County?
Median Family Income in Van Zandt County is $75,313.
What is the Median Household income in Van Zandt County?
Median Household Income in Van Zandt County is $62,334.
What is Income or Wage Gap in Van Zandt County?
Income or Wage Gap in Van Zandt County is 38.6%.
Women in Van Zandt County earn 61.4 cents for every dollar earned by a man.
What is Family Income Deficit in Van Zandt County?
Family Income Deficit in Van Zandt County is $9,495.
Families that are below poverty line in Van Zandt County earn $9,495 less on average than the poverty threshold level.
What is Inequality or Gini Index in Van Zandt County?
Inequality or Gini Index in Van Zandt County is 0.47.
What is the Total Population of Van Zandt County?
Total Population of Van Zandt County is 60,053.
What is the Total Male Population of Van Zandt County?
Total Male Population of Van Zandt County is 29,603.
What is the Total Female Population of Van Zandt County?
Total Female Population of Van Zandt County is 30,450.
What is the Ratio of Males per 100 Females in Van Zandt County?
There are 97.22 Males per 100 Females in Van Zandt County.
What is the Ratio of Females per 100 Males in Van Zandt County?
There are 102.86 Females per 100 Males in Van Zandt County.
What is the Median Population Age in Van Zandt County?
Median Population Age in Van Zandt County is 42.0 Years.
What is the Average Family Size in Van Zandt County
Average Family Size in Van Zandt County is 3.1 People.
What is the Average Household Size in Van Zandt County
Average Household Size in Van Zandt County is 2.7 People.
How Large is the Labor Force in Van Zandt County?
There are 26,171 People in the Labor Forcein in Van Zandt County.
What is the Percentage of People in the Labor Force in Van Zandt County?
54.5% of People are in the Labor Force in Van Zandt County.
What is the Unemployment Rate in Van Zandt County?
Unemployment Rate in Van Zandt County is 3.1%.