Uvalde County, TX Map & Demographics
Uvalde County Map
Uvalde County Overview
$26,141
PER CAPITA INCOME
$61,135
AVG FAMILY INCOME
$55,000
AVG HOUSEHOLD INCOME
42.8%
WAGE / INCOME GAP [ % ]
57.2¢/ $1
WAGE / INCOME GAP [ $ ]
$10,246
FAMILY INCOME DEFICIT
0.50
INEQUALITY / GINI INDEX
24,833
TOTAL POPULATION
12,409
MALE POPULATION
12,424
FEMALE POPULATION
99.88
MALES / 100 FEMALES
100.12
FEMALES / 100 MALES
34.2
MEDIAN AGE
3.5
AVG FAMILY SIZE
2.9
AVG HOUSEHOLD SIZE
10,255
LABOR FORCE [ PEOPLE ]
53.8%
PERCENT IN LABOR FORCE
3.2%
UNEMPLOYMENT RATE
Uvalde County Area Codes
Income in Uvalde County
Income Overview in Uvalde County
Per Capita Income in Uvalde County is $26,141, while median incomes of families and households are $61,135 and $55,000 respectively.
| Characteristic | Number | Measure |
| Per Capita Income | 24,833 | $26,141 |
| Median Family Income | 5,992 | $61,135 |
| Mean Family Income | 5,992 | $82,596 |
| Median Household Income | 8,420 | $55,000 |
| Mean Household Income | 8,420 | $72,307 |
| Income Deficit | 5,992 | $10,246 |
| Wage / Income Gap (%) | 24,833 | 42.83% |
| Wage / Income Gap ($) | 24,833 | 57.17¢ per $1 |
| Gini / Inequality Index | 24,833 | 0.50 |
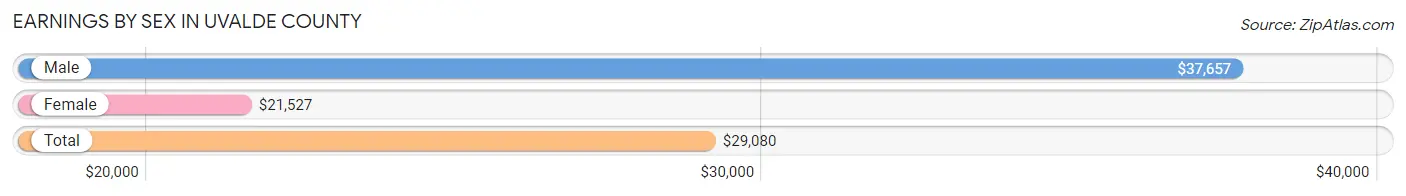
Earnings by Sex in Uvalde County
Average Earnings in Uvalde County are $29,080, $37,657 for men and $21,527 for women, a difference of 42.8%.
| Sex | Number | Average Earnings |
| Male | 5,576 (49.1%) | $37,657 |
| Female | 5,780 (50.9%) | $21,527 |
| Total | 11,356 (100.0%) | $29,080 |
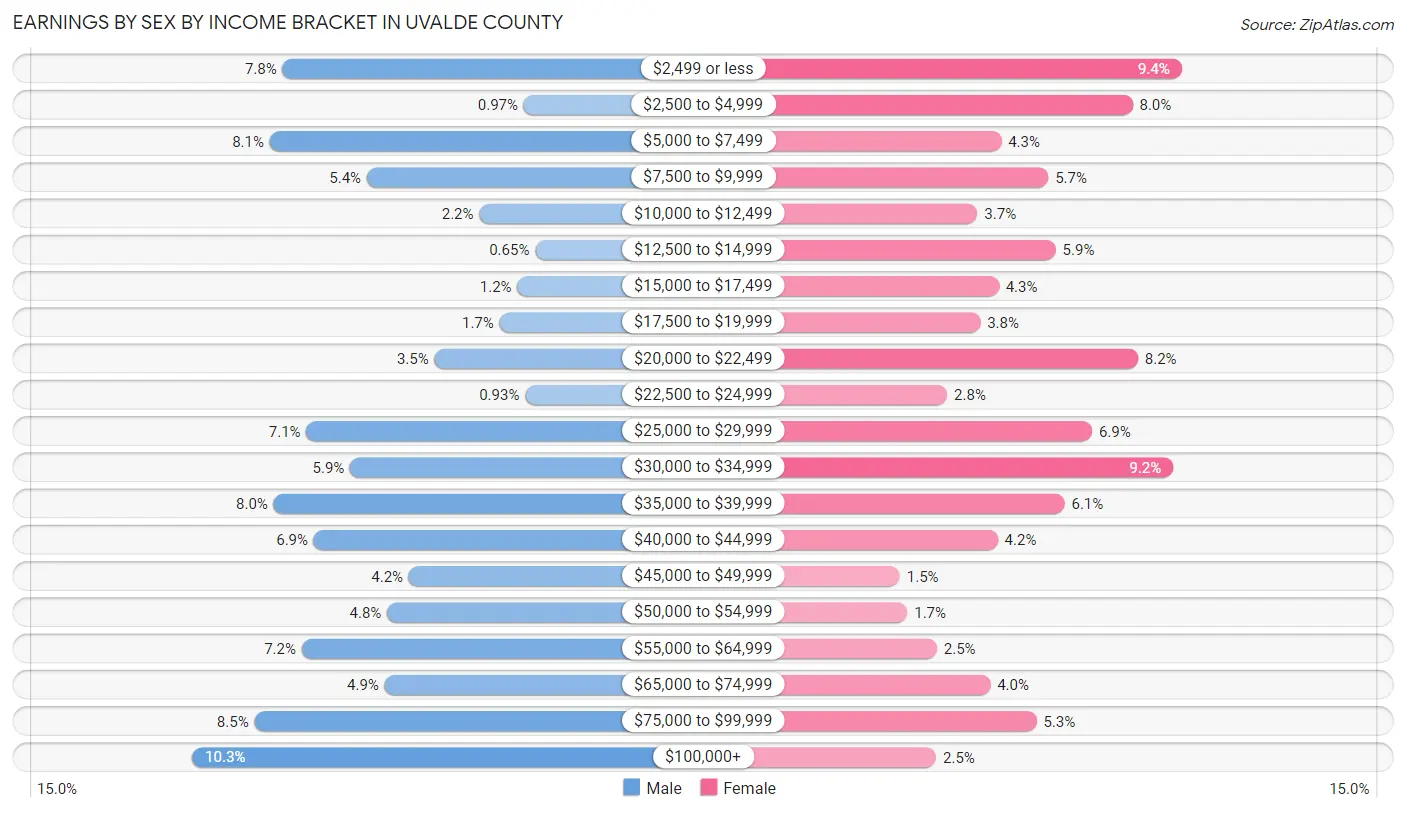
Earnings by Sex by Income Bracket in Uvalde County
The most common earnings brackets in Uvalde County are $100,000+ for men (574 | 10.3%) and $2,499 or less for women (544 | 9.4%).
| Income | Male | Female |
| $2,499 or less | 432 (7.7%) | 544 (9.4%) |
| $2,500 to $4,999 | 54 (1.0%) | 464 (8.0%) |
| $5,000 to $7,499 | 452 (8.1%) | 251 (4.3%) |
| $7,500 to $9,999 | 300 (5.4%) | 327 (5.7%) |
| $10,000 to $12,499 | 124 (2.2%) | 212 (3.7%) |
| $12,500 to $14,999 | 36 (0.6%) | 339 (5.9%) |
| $15,000 to $17,499 | 64 (1.1%) | 247 (4.3%) |
| $17,500 to $19,999 | 92 (1.7%) | 217 (3.7%) |
| $20,000 to $22,499 | 194 (3.5%) | 473 (8.2%) |
| $22,500 to $24,999 | 52 (0.9%) | 163 (2.8%) |
| $25,000 to $29,999 | 395 (7.1%) | 398 (6.9%) |
| $30,000 to $34,999 | 326 (5.9%) | 530 (9.2%) |
| $35,000 to $39,999 | 446 (8.0%) | 354 (6.1%) |
| $40,000 to $44,999 | 383 (6.9%) | 245 (4.2%) |
| $45,000 to $49,999 | 234 (4.2%) | 86 (1.5%) |
| $50,000 to $54,999 | 268 (4.8%) | 98 (1.7%) |
| $55,000 to $64,999 | 402 (7.2%) | 146 (2.5%) |
| $65,000 to $74,999 | 272 (4.9%) | 233 (4.0%) |
| $75,000 to $99,999 | 476 (8.5%) | 308 (5.3%) |
| $100,000+ | 574 (10.3%) | 145 (2.5%) |
| Total | 5,576 (100.0%) | 5,780 (100.0%) |
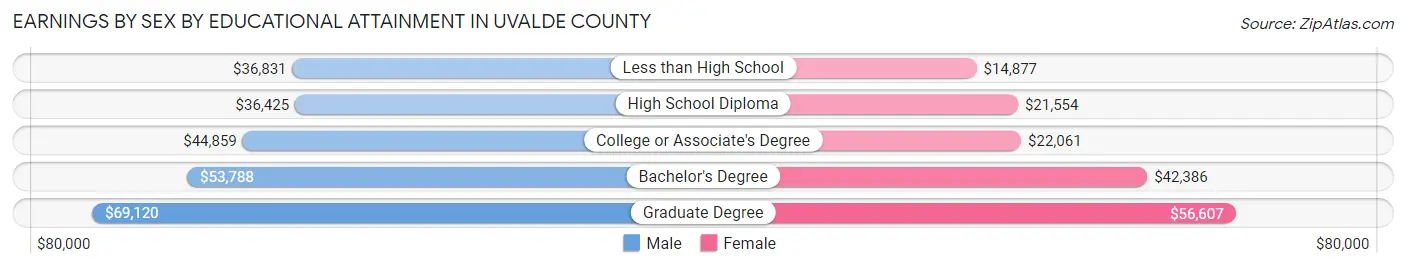
Earnings by Sex by Educational Attainment in Uvalde County
Average earnings in Uvalde County are $44,098 for men and $24,866 for women, a difference of 43.6%. Men with an educational attainment of graduate degree enjoy the highest average annual earnings of $69,120, while those with high school diploma education earn the least with $36,425. Women with an educational attainment of graduate degree earn the most with the average annual earnings of $56,607, while those with less than high school education have the smallest earnings of $14,877.
| Educational Attainment | Male Income | Female Income |
| Less than High School | $36,831 | $14,877 |
| High School Diploma | $36,425 | $21,554 |
| College or Associate's Degree | $44,859 | $22,061 |
| Bachelor's Degree | $53,788 | $42,386 |
| Graduate Degree | $69,120 | $56,607 |
| Total | $44,098 | $24,866 |
Family Income in Uvalde County
Family Income Brackets in Uvalde County
According to the Uvalde County family income data, there are 1,366 families falling into the $50,000 to $74,999 income range, which is the most common income bracket and makes up 22.8% of all families. Conversely, the $150,000 to $199,999 income bracket is the least frequent group with only 270 families (4.5%) belonging to this category.
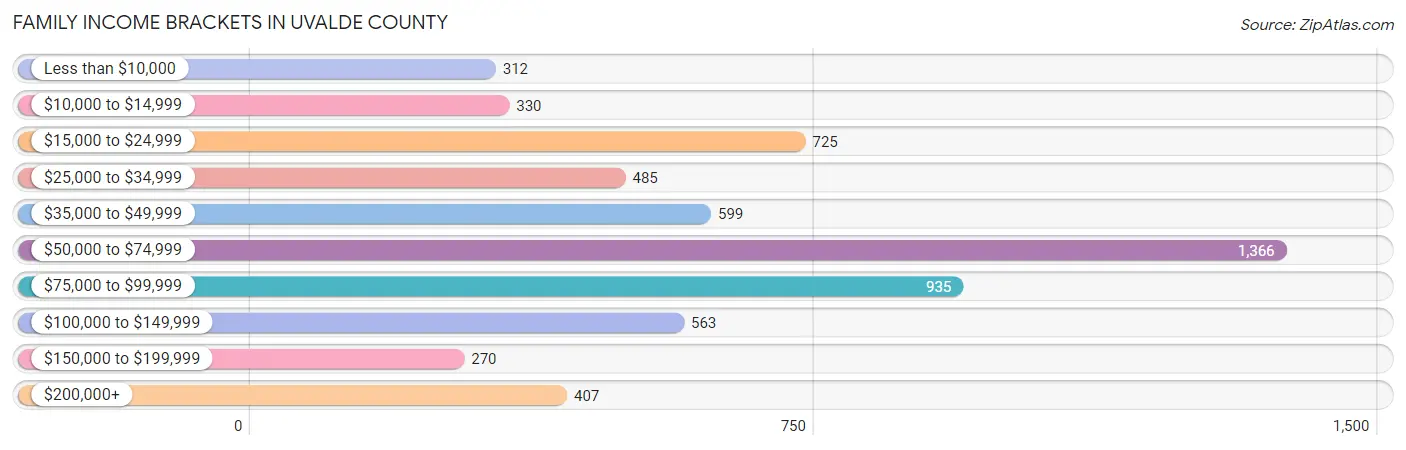
| Income Bracket | # Families | % Families |
| Less than $10,000 | 312 | 5.2% |
| $10,000 to $14,999 | 330 | 5.5% |
| $15,000 to $24,999 | 725 | 12.1% |
| $25,000 to $34,999 | 485 | 8.1% |
| $35,000 to $49,999 | 599 | 10.0% |
| $50,000 to $74,999 | 1,366 | 22.8% |
| $75,000 to $99,999 | 935 | 15.6% |
| $100,000 to $149,999 | 563 | 9.4% |
| $150,000 to $199,999 | 270 | 4.5% |
| $200,000+ | 407 | 6.8% |
Family Income by Famaliy Size in Uvalde County
7+ person families (195 | 3.3%) account for the highest median family income in Uvalde County with $93,375 per family, while 2-person families (2,342 | 39.1%) have the highest median income of $30,252 per family member.
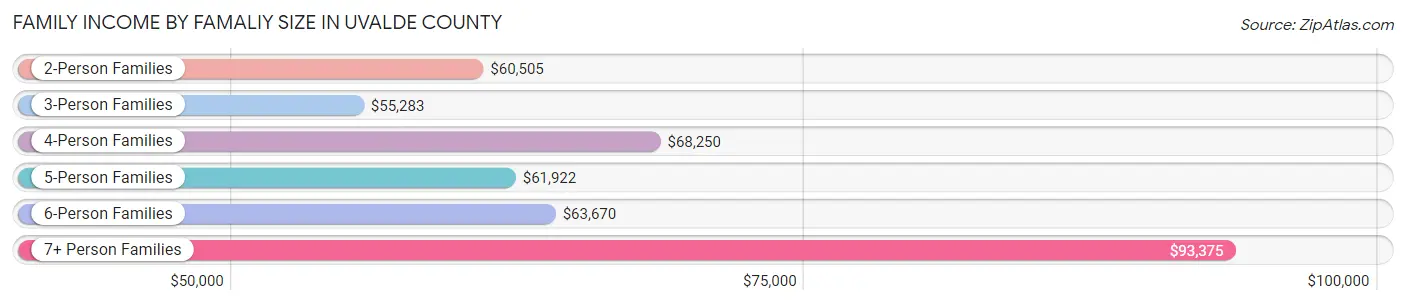
| Income Bracket | # Families | Median Income |
| 2-Person Families | 2,342 (39.1%) | $60,505 |
| 3-Person Families | 1,577 (26.3%) | $55,283 |
| 4-Person Families | 884 (14.7%) | $68,250 |
| 5-Person Families | 930 (15.5%) | $61,922 |
| 6-Person Families | 64 (1.1%) | $63,670 |
| 7+ Person Families | 195 (3.3%) | $93,375 |
| Total | 5,992 (100.0%) | $61,135 |
Family Income by Number of Earners in Uvalde County
The median family income in Uvalde County is $61,135, with families comprising 2 earners (1,502) having the highest median family income of $95,309, while families with no earners (1,102) have the lowest median family income of $23,480, accounting for 25.1% and 18.4% of families, respectively.
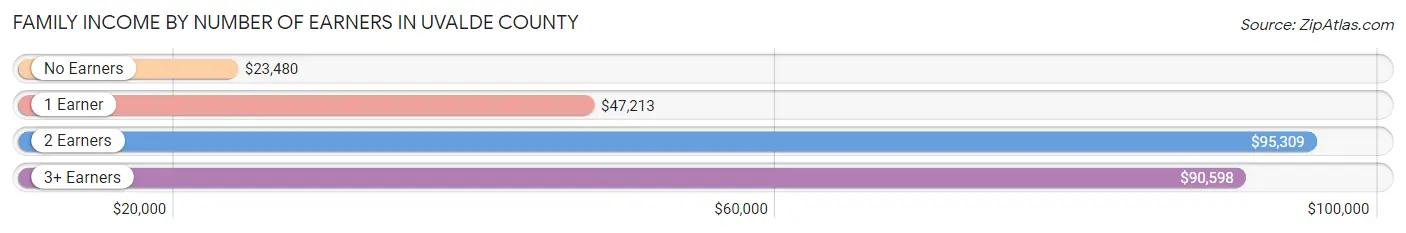
| Number of Earners | # Families | Median Income |
| No Earners | 1,102 (18.4%) | $23,480 |
| 1 Earner | 2,556 (42.7%) | $47,213 |
| 2 Earners | 1,502 (25.1%) | $95,309 |
| 3+ Earners | 832 (13.9%) | $90,598 |
| Total | 5,992 (100.0%) | $61,135 |
Household Income in Uvalde County
Household Income Brackets in Uvalde County
With 1,709 households falling in the category, the $50,000 to $74,999 income range is the most frequent in Uvalde County, accounting for 20.3% of all households. In contrast, only 278 households (3.3%) fall into the $150,000 to $199,999 income bracket, making it the least populous group.
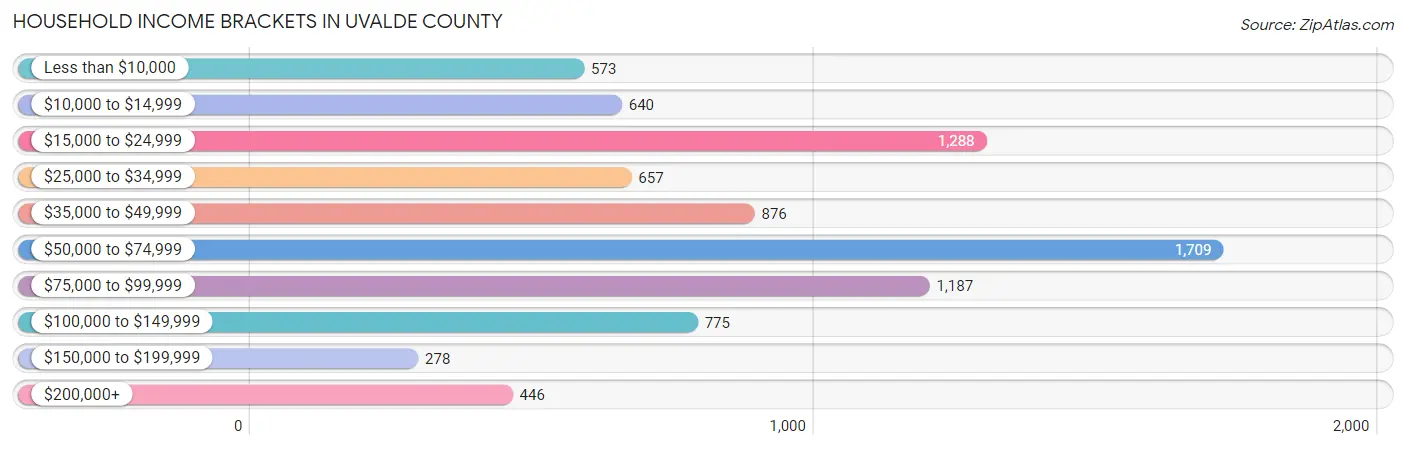
| Income Bracket | # Households | % Households |
| Less than $10,000 | 573 | 6.8% |
| $10,000 to $14,999 | 640 | 7.6% |
| $15,000 to $24,999 | 1,288 | 15.3% |
| $25,000 to $34,999 | 657 | 7.8% |
| $35,000 to $49,999 | 876 | 10.4% |
| $50,000 to $74,999 | 1,709 | 20.3% |
| $75,000 to $99,999 | 1,187 | 14.1% |
| $100,000 to $149,999 | 775 | 9.2% |
| $150,000 to $199,999 | 278 | 3.3% |
| $200,000+ | 446 | 5.3% |
Household Income by Householder Age in Uvalde County
The median household income in Uvalde County is $55,000, with the highest median household income of $62,269 found in the 25 to 44 years age bracket for the primary householder. A total of 2,788 households (33.1%) fall into this category. Meanwhile, the 15 to 24 years age bracket for the primary householder has the lowest median household income of $0, with 259 households (3.1%) in this group.
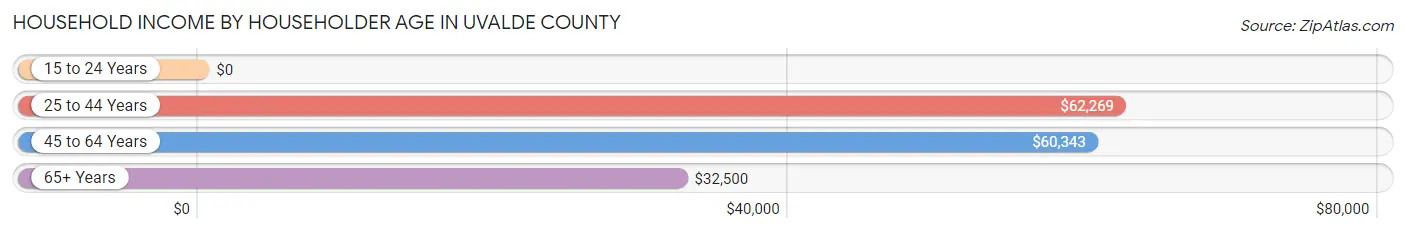
| Income Bracket | # Households | Median Income |
| 15 to 24 Years | 259 (3.1%) | $0 |
| 25 to 44 Years | 2,788 (33.1%) | $62,269 |
| 45 to 64 Years | 2,943 (34.9%) | $60,343 |
| 65+ Years | 2,430 (28.9%) | $32,500 |
| Total | 8,420 (100.0%) | $55,000 |
Poverty in Uvalde County
Income Below Poverty by Sex and Age in Uvalde County
With 25.1% poverty level for males and 23.2% for females among the residents of Uvalde County, 16 and 17 year old males and 12 to 14 year old females are the most vulnerable to poverty, with 215 males (47.4%) and 237 females (40.7%) in their respective age groups living below the poverty level.
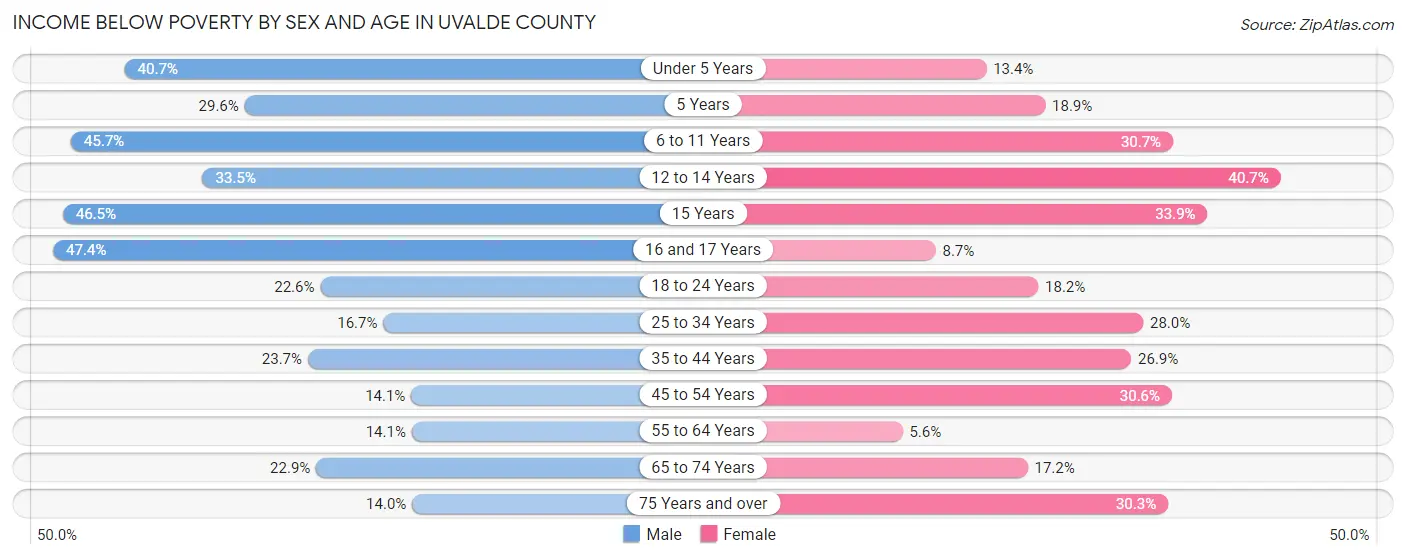
| Age Bracket | Male | Female |
| Under 5 Years | 357 (40.7%) | 108 (13.4%) |
| 5 Years | 42 (29.6%) | 30 (18.9%) |
| 6 to 11 Years | 356 (45.7%) | 323 (30.7%) |
| 12 to 14 Years | 285 (33.5%) | 237 (40.7%) |
| 15 Years | 157 (46.5%) | 19 (33.9%) |
| 16 and 17 Years | 215 (47.4%) | 22 (8.7%) |
| 18 to 24 Years | 330 (22.6%) | 221 (18.2%) |
| 25 to 34 Years | 256 (16.7%) | 470 (28.0%) |
| 35 to 44 Years | 332 (23.7%) | 400 (26.9%) |
| 45 to 54 Years | 171 (14.1%) | 400 (30.6%) |
| 55 to 64 Years | 165 (14.1%) | 76 (5.6%) |
| 65 to 74 Years | 226 (22.9%) | 200 (17.2%) |
| 75 Years and over | 103 (14.0%) | 290 (30.3%) |
| Total | 2,995 (25.1%) | 2,796 (23.2%) |
Income Above Poverty by Sex and Age in Uvalde County
According to the poverty statistics in Uvalde County, males aged 75 years and over and females aged 55 to 64 years are the age groups that are most secure financially, with 86.0% of males and 94.4% of females in these age groups living above the poverty line.
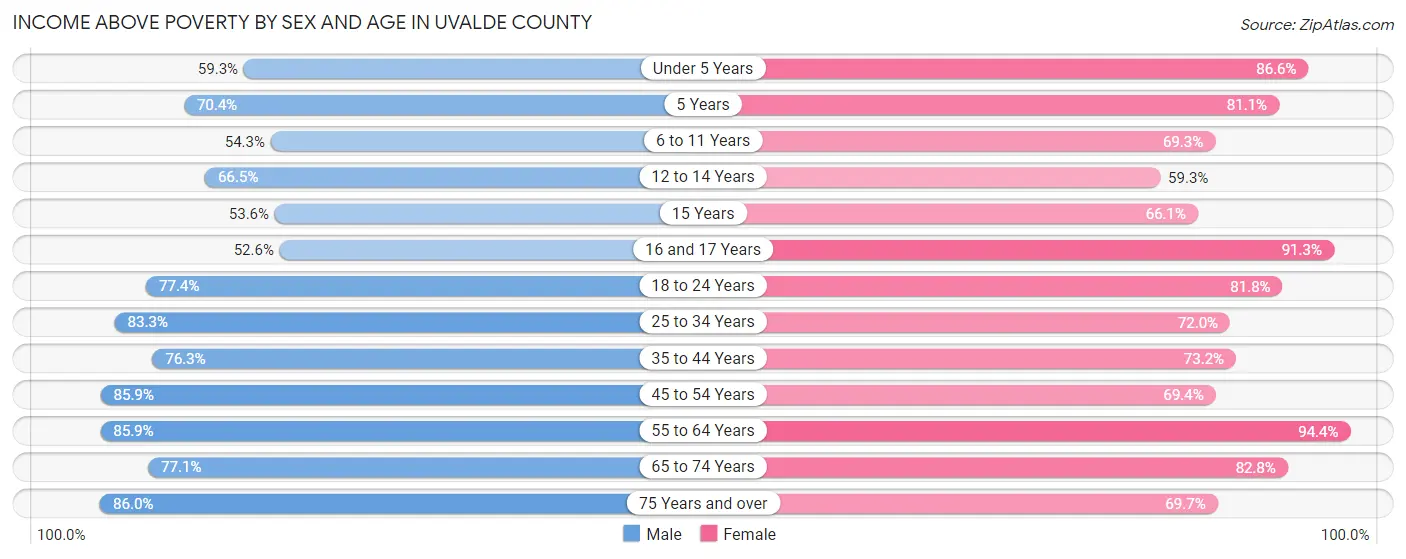
| Age Bracket | Male | Female |
| Under 5 Years | 520 (59.3%) | 698 (86.6%) |
| 5 Years | 100 (70.4%) | 129 (81.1%) |
| 6 to 11 Years | 423 (54.3%) | 728 (69.3%) |
| 12 to 14 Years | 566 (66.5%) | 345 (59.3%) |
| 15 Years | 181 (53.5%) | 37 (66.1%) |
| 16 and 17 Years | 239 (52.6%) | 231 (91.3%) |
| 18 to 24 Years | 1,133 (77.4%) | 992 (81.8%) |
| 25 to 34 Years | 1,276 (83.3%) | 1,211 (72.0%) |
| 35 to 44 Years | 1,068 (76.3%) | 1,090 (73.2%) |
| 45 to 54 Years | 1,040 (85.9%) | 906 (69.4%) |
| 55 to 64 Years | 1,008 (85.9%) | 1,275 (94.4%) |
| 65 to 74 Years | 759 (77.1%) | 960 (82.8%) |
| 75 Years and over | 631 (86.0%) | 668 (69.7%) |
| Total | 8,944 (74.9%) | 9,270 (76.8%) |
Income Below Poverty Among Married-Couple Families in Uvalde County
The poverty statistics for married-couple families in Uvalde County show that 12.1% or 471 of the total 3,897 families live below the poverty line. Families with 5 or more children have the highest poverty rate of 100.0%, comprising of 82 families. On the other hand, families with no children have the lowest poverty rate of 5.8%, which includes 106 families.
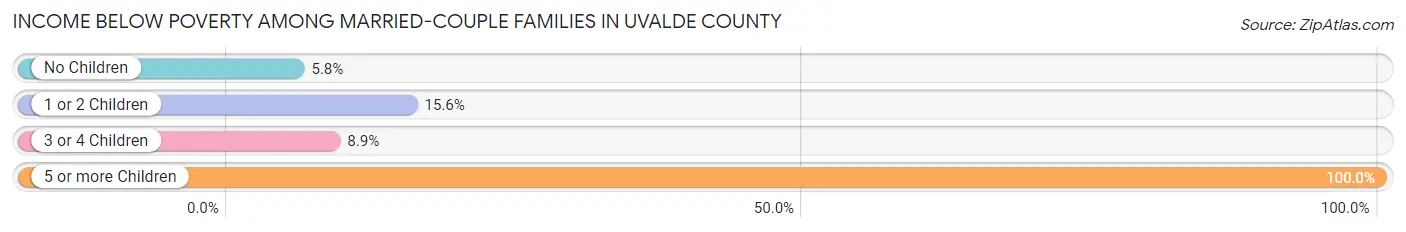
| Children | Above Poverty | Below Poverty |
| No Children | 1,725 (94.2%) | 106 (5.8%) |
| 1 or 2 Children | 1,333 (84.4%) | 247 (15.6%) |
| 3 or 4 Children | 368 (91.1%) | 36 (8.9%) |
| 5 or more Children | 0 (0.0%) | 82 (100.0%) |
| Total | 3,426 (87.9%) | 471 (12.1%) |
Income Below Poverty Among Single-Parent Households in Uvalde County
According to the poverty data in Uvalde County, 31.7% or 186 single-father households and 46.8% or 706 single-mother households are living below the poverty line. Among single-father households, those with no children have the highest poverty rate, with 132 households (44.4%) experiencing poverty. Likewise, among single-mother households, those with 1 or 2 children have the highest poverty rate, with 532 households (64.0%) falling below the poverty line.
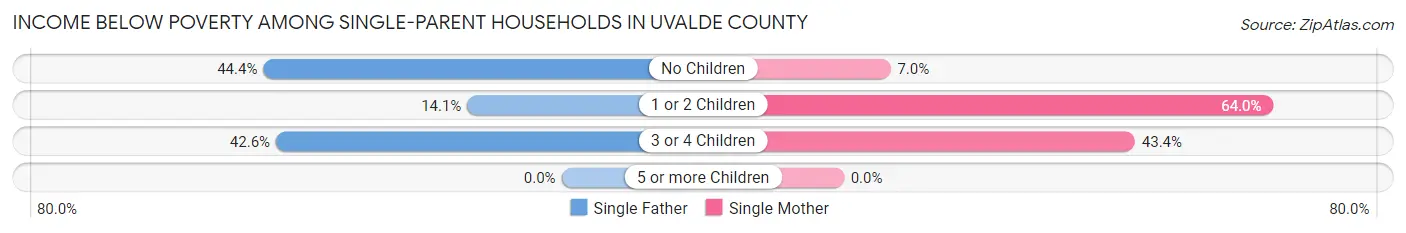
| Children | Single Father | Single Mother |
| No Children | 132 (44.4%) | 23 (7.0%) |
| 1 or 2 Children | 34 (14.1%) | 532 (64.0%) |
| 3 or 4 Children | 20 (42.5%) | 151 (43.4%) |
| 5 or more Children | 0 (0.0%) | 0 (0.0%) |
| Total | 186 (31.7%) | 706 (46.8%) |
Income Below Poverty Among Married-Couple vs Single-Parent Households in Uvalde County
The poverty data for Uvalde County shows that 471 of the married-couple family households (12.1%) and 892 of the single-parent households (42.6%) are living below the poverty level. Within the married-couple family households, those with 5 or more children have the highest poverty rate, with 82 households (100.0%) falling below the poverty line. Among the single-parent households, those with 1 or 2 children have the highest poverty rate, with 566 household (52.7%) living below poverty.
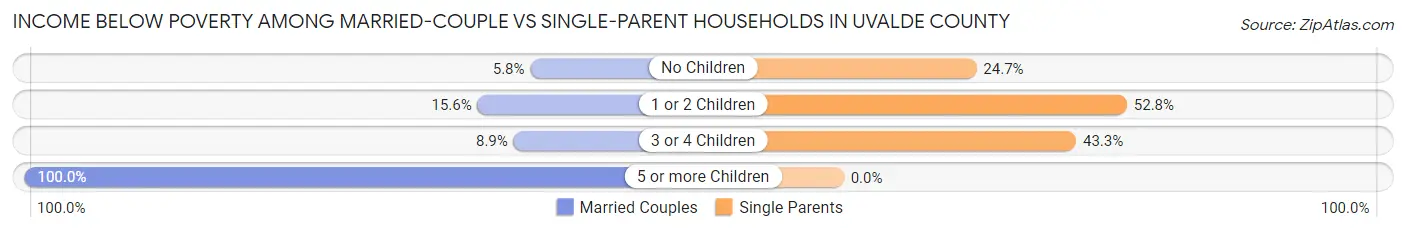
| Children | Married-Couple Families | Single-Parent Households |
| No Children | 106 (5.8%) | 155 (24.7%) |
| 1 or 2 Children | 247 (15.6%) | 566 (52.7%) |
| 3 or 4 Children | 36 (8.9%) | 171 (43.3%) |
| 5 or more Children | 82 (100.0%) | 0 (0.0%) |
| Total | 471 (12.1%) | 892 (42.6%) |
Race in Uvalde County
The most populous races in Uvalde County are White / Caucasian (19,111 | 77.0%), Hispanic or Latino (17,942 | 72.3%), and Two or more Races (2,868 | 11.6%).
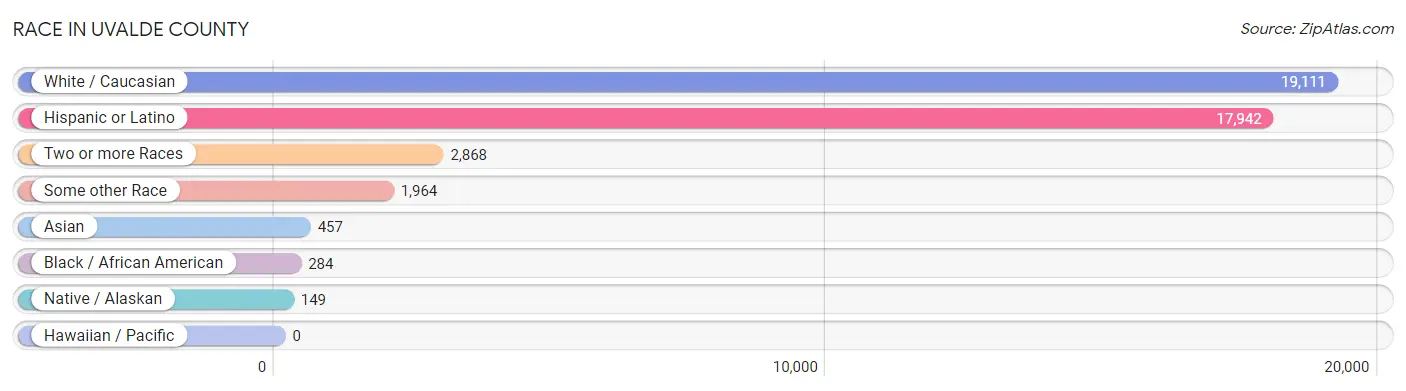
| Race | # Population | % Population |
| Asian | 457 | 1.8% |
| Black / African American | 284 | 1.1% |
| Hawaiian / Pacific | 0 | 0.0% |
| Hispanic or Latino | 17,942 | 72.3% |
| Native / Alaskan | 149 | 0.6% |
| White / Caucasian | 19,111 | 77.0% |
| Two or more Races | 2,868 | 11.6% |
| Some other Race | 1,964 | 7.9% |
| Total | 24,833 | 100.0% |
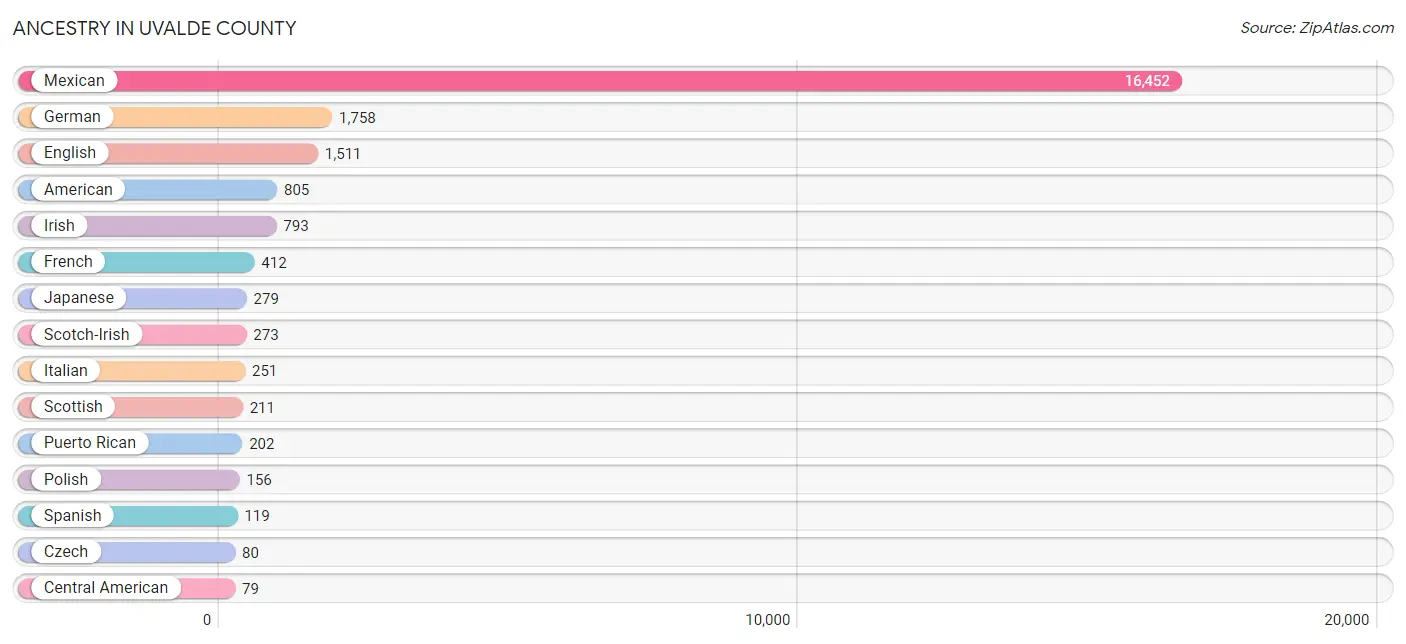
Ancestry in Uvalde County
The most populous ancestries reported in Uvalde County are Mexican (16,452 | 66.2%), German (1,758 | 7.1%), English (1,511 | 6.1%), American (805 | 3.2%), and Irish (793 | 3.2%), together accounting for 85.8% of all Uvalde County residents.
| Ancestry | # Population | % Population |
| African | 12 | 0.1% |
| Alsatian | 14 | 0.1% |
| American | 805 | 3.2% |
| Apache | 69 | 0.3% |
| Australian | 7 | 0.0% |
| Bhutanese | 15 | 0.1% |
| Blackfeet | 15 | 0.1% |
| Brazilian | 16 | 0.1% |
| British | 30 | 0.1% |
| Burmese | 25 | 0.1% |
| Central American | 79 | 0.3% |
| Cherokee | 27 | 0.1% |
| Choctaw | 24 | 0.1% |
| Colombian | 4 | 0.0% |
| Czech | 80 | 0.3% |
| Danish | 24 | 0.1% |
| Dutch | 65 | 0.3% |
| Dutch West Indian | 13 | 0.1% |
| Eastern European | 5 | 0.0% |
| English | 1,511 | 6.1% |
| European | 32 | 0.1% |
| French | 412 | 1.7% |
| German | 1,758 | 7.1% |
| Greek | 15 | 0.1% |
| Guatemalan | 4 | 0.0% |
| Honduran | 5 | 0.0% |
| Hungarian | 10 | 0.0% |
| Indian (Asian) | 71 | 0.3% |
| Irish | 793 | 3.2% |
| Italian | 251 | 1.0% |
| Japanese | 279 | 1.1% |
| Korean | 28 | 0.1% |
| Lithuanian | 40 | 0.2% |
| Mexican | 16,452 | 66.2% |
| Mexican American Indian | 15 | 0.1% |
| Native Hawaiian | 29 | 0.1% |
| Navajo | 54 | 0.2% |
| New Zealander | 11 | 0.0% |
| Northern European | 8 | 0.0% |
| Norwegian | 47 | 0.2% |
| Panamanian | 5 | 0.0% |
| Polish | 156 | 0.6% |
| Portuguese | 79 | 0.3% |
| Pueblo | 18 | 0.1% |
| Puerto Rican | 202 | 0.8% |
| Russian | 13 | 0.1% |
| Salvadoran | 65 | 0.3% |
| Scandinavian | 36 | 0.1% |
| Scotch-Irish | 273 | 1.1% |
| Scottish | 211 | 0.9% |
| South American | 4 | 0.0% |
| Spaniard | 44 | 0.2% |
| Spanish | 119 | 0.5% |
| Sri Lankan | 75 | 0.3% |
| Subsaharan African | 12 | 0.1% |
| Swedish | 58 | 0.2% |
| Thai | 14 | 0.1% |
| Ukrainian | 26 | 0.1% |
| Welsh | 55 | 0.2% | View All 59 Rows |
Immigrants in Uvalde County
The most numerous immigrant groups reported in Uvalde County came from Latin America (2,432 | 9.8%), Central America (2,412 | 9.7%), Mexico (2,384 | 9.6%), Asia (227 | 0.9%), and South Eastern Asia (153 | 0.6%), together accounting for 30.6% of all Uvalde County residents.
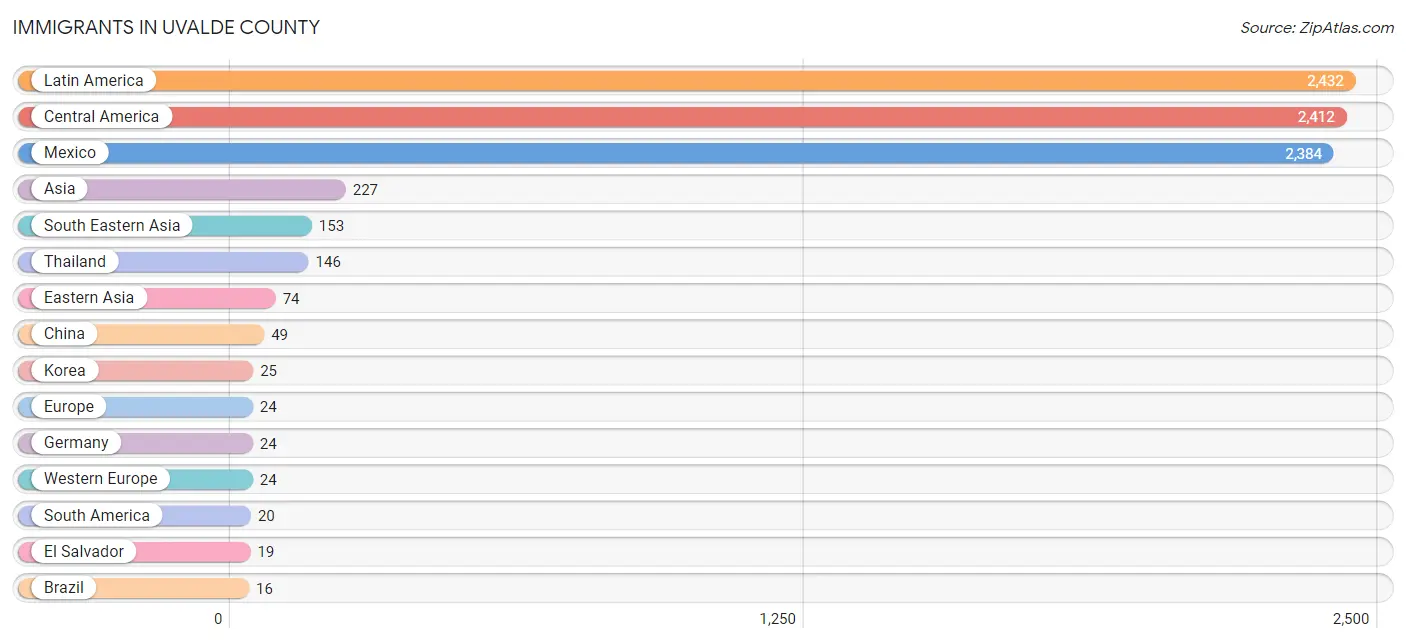
| Immigration Origin | # Population | % Population |
| Asia | 227 | 0.9% |
| Brazil | 16 | 0.1% |
| Central America | 2,412 | 9.7% |
| China | 49 | 0.2% |
| Colombia | 4 | 0.0% |
| Eastern Asia | 74 | 0.3% |
| El Salvador | 19 | 0.1% |
| Europe | 24 | 0.1% |
| Germany | 24 | 0.1% |
| Honduras | 9 | 0.0% |
| Korea | 25 | 0.1% |
| Latin America | 2,432 | 9.8% |
| Mexico | 2,384 | 9.6% |
| Oceania | 11 | 0.0% |
| Philippines | 7 | 0.0% |
| South America | 20 | 0.1% |
| South Eastern Asia | 153 | 0.6% |
| Thailand | 146 | 0.6% |
| Western Europe | 24 | 0.1% | View All 19 Rows |
Sex and Age in Uvalde County
Sex and Age in Uvalde County
The most populous age groups in Uvalde County are 15 to 19 Years (1,283 | 10.3%) for men and 10 to 14 Years (970 | 7.8%) for women.
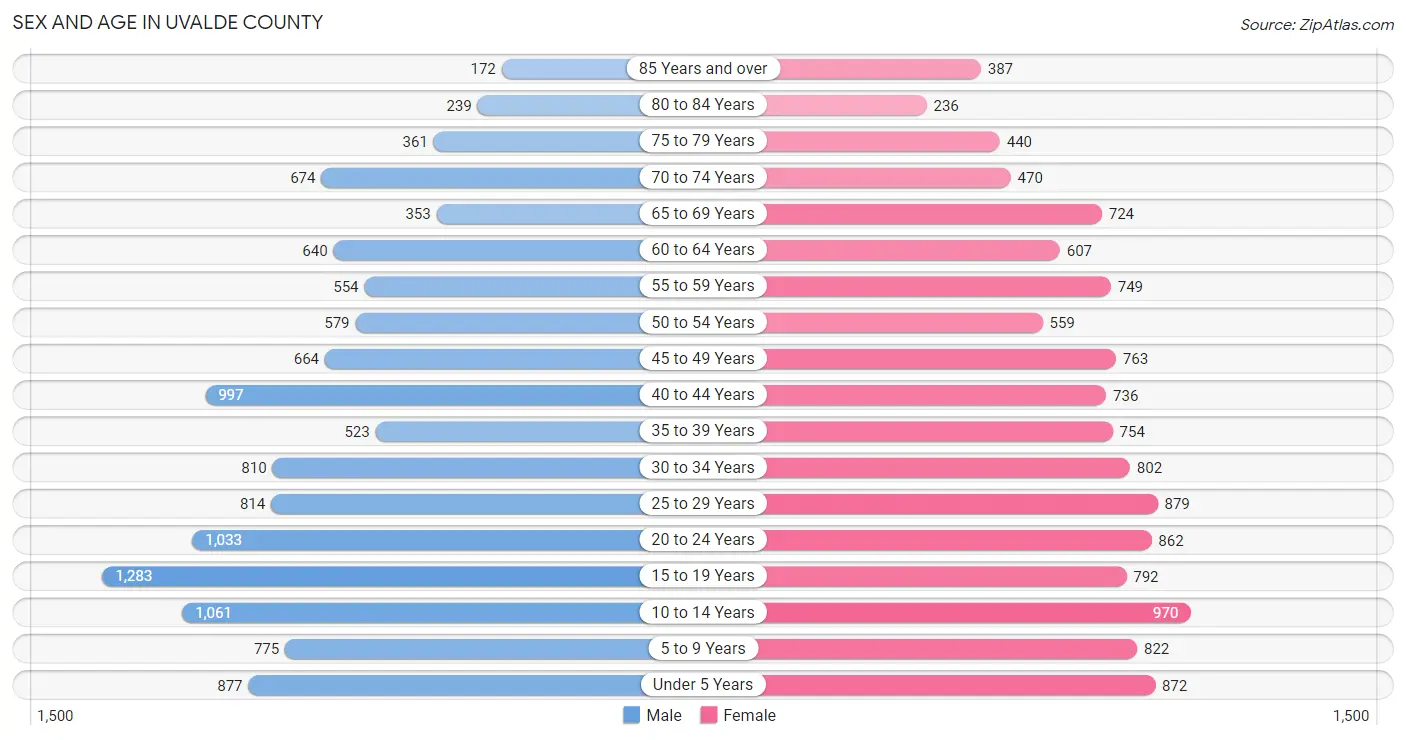
| Age Bracket | Male | Female |
| Under 5 Years | 877 (7.1%) | 872 (7.0%) |
| 5 to 9 Years | 775 (6.2%) | 822 (6.6%) |
| 10 to 14 Years | 1,061 (8.6%) | 970 (7.8%) |
| 15 to 19 Years | 1,283 (10.3%) | 792 (6.4%) |
| 20 to 24 Years | 1,033 (8.3%) | 862 (6.9%) |
| 25 to 29 Years | 814 (6.6%) | 879 (7.1%) |
| 30 to 34 Years | 810 (6.5%) | 802 (6.5%) |
| 35 to 39 Years | 523 (4.2%) | 754 (6.1%) |
| 40 to 44 Years | 997 (8.0%) | 736 (5.9%) |
| 45 to 49 Years | 664 (5.3%) | 763 (6.1%) |
| 50 to 54 Years | 579 (4.7%) | 559 (4.5%) |
| 55 to 59 Years | 554 (4.5%) | 749 (6.0%) |
| 60 to 64 Years | 640 (5.2%) | 607 (4.9%) |
| 65 to 69 Years | 353 (2.8%) | 724 (5.8%) |
| 70 to 74 Years | 674 (5.4%) | 470 (3.8%) |
| 75 to 79 Years | 361 (2.9%) | 440 (3.5%) |
| 80 to 84 Years | 239 (1.9%) | 236 (1.9%) |
| 85 Years and over | 172 (1.4%) | 387 (3.1%) |
| Total | 12,409 (100.0%) | 12,424 (100.0%) |
Families and Households in Uvalde County
Median Family Size in Uvalde County
The median family size in Uvalde County is 3.46 persons per family, with single female/mother families (1,509 | 25.2%) accounting for the largest median family size of 3.6 persons per family. On the other hand, single male/father families (586 | 9.8%) represent the smallest median family size with 2.99 persons per family.
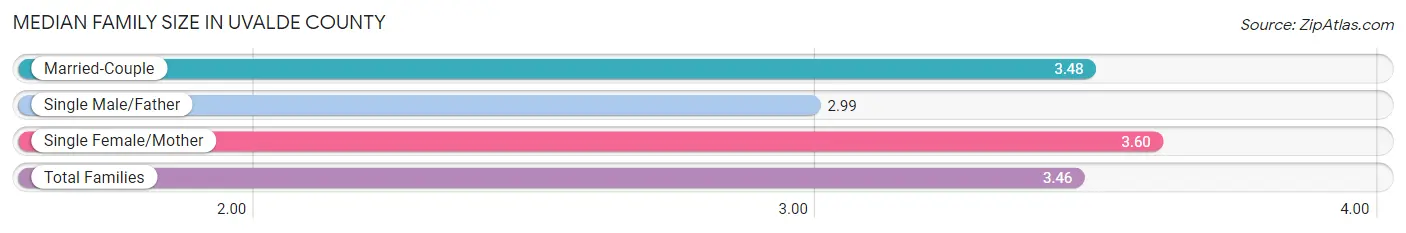
| Family Type | # Families | Family Size |
| Married-Couple | 3,897 (65.0%) | 3.48 |
| Single Male/Father | 586 (9.8%) | 2.99 |
| Single Female/Mother | 1,509 (25.2%) | 3.60 |
| Total Families | 5,992 (100.0%) | 3.46 |
Median Household Size in Uvalde County
The median household size in Uvalde County is 2.86 persons per household, with single female/mother households (1,509 | 17.9%) accounting for the largest median household size of 3.79 persons per household. non-family households (2,428 | 28.8%) represent the smallest median household size with 1.14 persons per household.
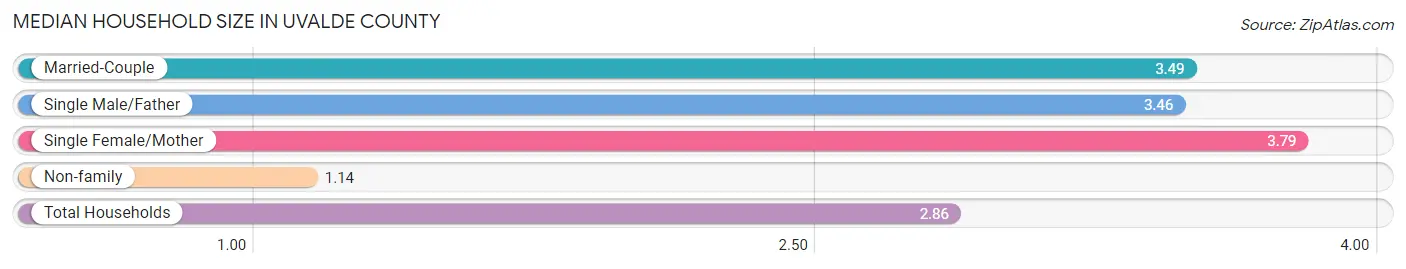
| Household Type | # Households | Household Size |
| Married-Couple | 3,897 (46.3%) | 3.49 |
| Single Male/Father | 586 (7.0%) | 3.46 |
| Single Female/Mother | 1,509 (17.9%) | 3.79 |
| Non-family | 2,428 (28.8%) | 1.14 |
| Total Households | 8,420 (100.0%) | 2.86 |
Household Size by Marriage Status in Uvalde County
Out of a total of 8,420 households in Uvalde County, 5,992 (71.2%) are family households, while 2,428 (28.8%) are nonfamily households. The most numerous type of family households are 2-person households, comprising 2,238, and the most common type of nonfamily households are 1-person households, comprising 2,121.
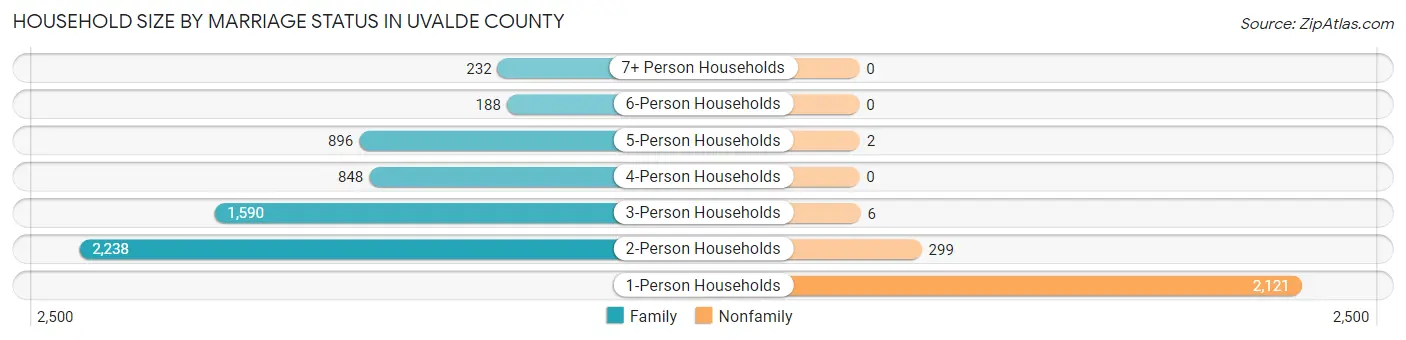
| Household Size | Family Households | Nonfamily Households |
| 1-Person Households | - | 2,121 (25.2%) |
| 2-Person Households | 2,238 (26.6%) | 299 (3.5%) |
| 3-Person Households | 1,590 (18.9%) | 6 (0.1%) |
| 4-Person Households | 848 (10.1%) | 0 (0.0%) |
| 5-Person Households | 896 (10.6%) | 2 (0.0%) |
| 6-Person Households | 188 (2.2%) | 0 (0.0%) |
| 7+ Person Households | 232 (2.8%) | 0 (0.0%) |
| Total | 5,992 (71.2%) | 2,428 (28.8%) |
Female Fertility in Uvalde County
Fertility by Age in Uvalde County
Average fertility rate in Uvalde County is 102.0 births per 1,000 women. Women in the age bracket of 20 to 34 years have the highest fertility rate with 153.0 births per 1,000 women. Women in the age bracket of 20 to 34 years acount for 67.3% of all women with births.
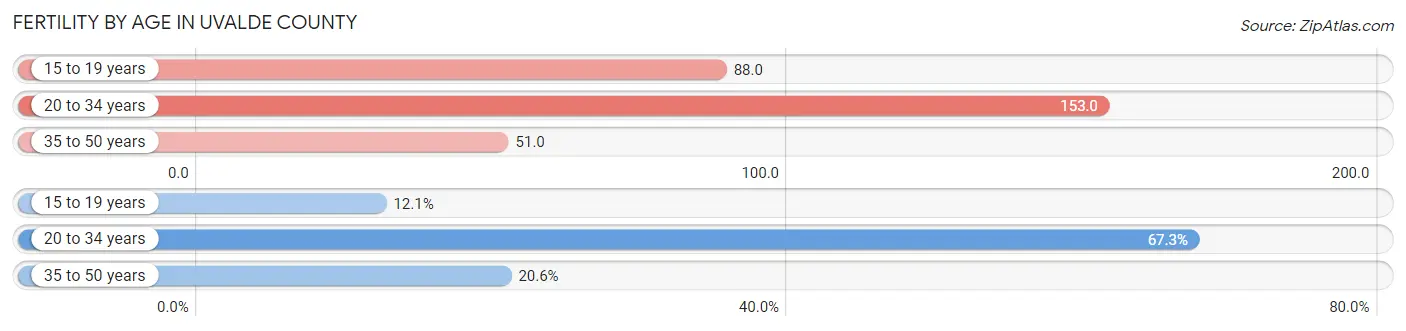
| Age Bracket | Women with Births | Births / 1,000 Women |
| 15 to 19 years | 70 (12.1%) | 88.0 |
| 20 to 34 years | 389 (67.3%) | 153.0 |
| 35 to 50 years | 119 (20.6%) | 51.0 |
| Total | 578 (100.0%) | 102.0 |
Fertility by Age by Marriage Status in Uvalde County
75.4% of women with births (578) in Uvalde County are married. The highest percentage of unmarried women with births falls into 20 to 34 years age bracket with 31.4% of them unmarried at the time of birth, while the lowest percentage of unmarried women with births belong to 35 to 50 years age bracket with 0.0% of them unmarried.
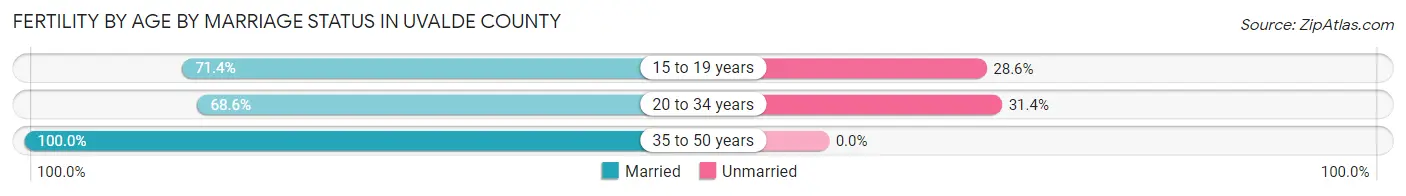
| Age Bracket | Married | Unmarried |
| 15 to 19 years | 50 (71.4%) | 20 (28.6%) |
| 20 to 34 years | 267 (68.6%) | 122 (31.4%) |
| 35 to 50 years | 119 (100.0%) | 0 (0.0%) |
| Total | 436 (75.4%) | 142 (24.6%) |
Fertility by Education in Uvalde County
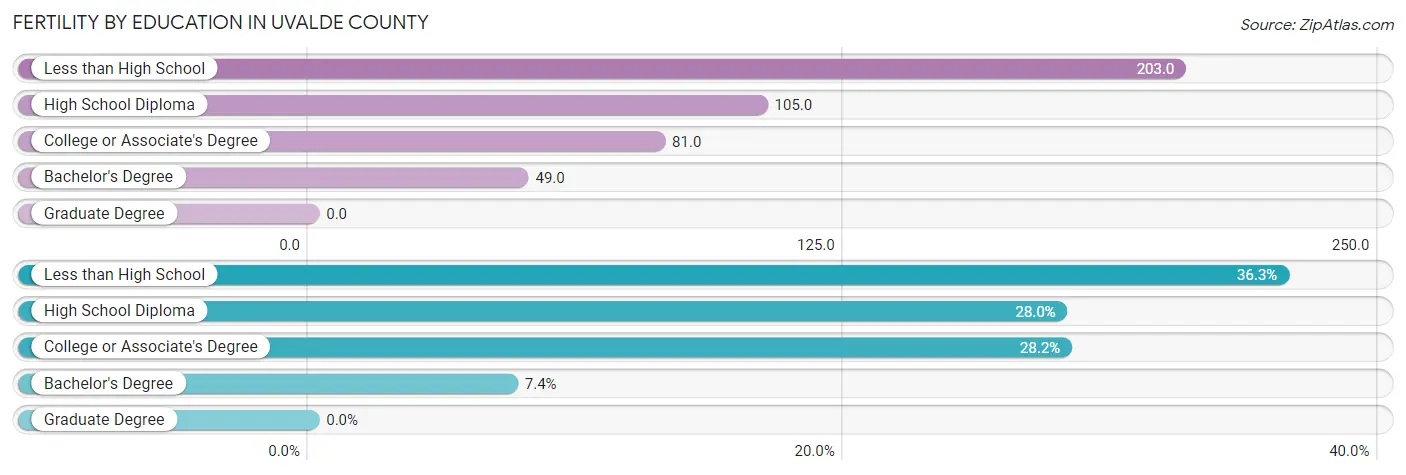
| Educational Attainment | Women with Births | Births / 1,000 Women |
| Less than High School | 210 (36.3%) | 203.0 |
| High School Diploma | 162 (28.0%) | 105.0 |
| College or Associate's Degree | 163 (28.2%) | 81.0 |
| Bachelor's Degree | 43 (7.4%) | 49.0 |
| Graduate Degree | 0 (0.0%) | 0.0 |
| Total | 578 (100.0%) | 102.0 |
Fertility by Education by Marriage Status in Uvalde County
24.6% of women with births in Uvalde County are unmarried. Women with the educational attainment of less than high school are most likely to be married with 100.0% of them married at childbirth, while women with the educational attainment of college or associate's degree are least likely to be married with 74.9% of them unmarried at childbirth.
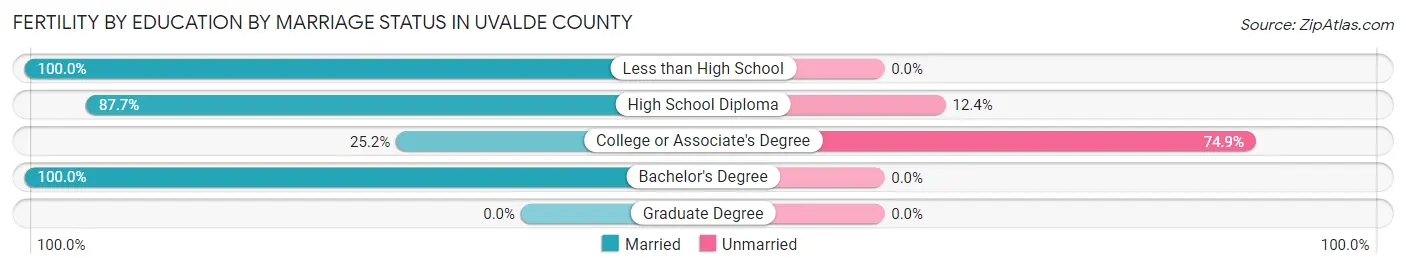
| Educational Attainment | Married | Unmarried |
| Less than High School | 210 (100.0%) | 0 (0.0%) |
| High School Diploma | 142 (87.6%) | 20 (12.3%) |
| College or Associate's Degree | 41 (25.2%) | 122 (74.9%) |
| Bachelor's Degree | 43 (100.0%) | 0 (0.0%) |
| Graduate Degree | 0 (0.0%) | 0 (0.0%) |
| Total | 436 (75.4%) | 142 (24.6%) |
Employment Characteristics in Uvalde County
Employment by Class of Employer in Uvalde County
Among the 9,661 employed individuals in Uvalde County, private company employees (5,918 | 61.3%), local government employees (991 | 10.3%), and state government employees (857 | 8.9%) make up the most common classes of employment.
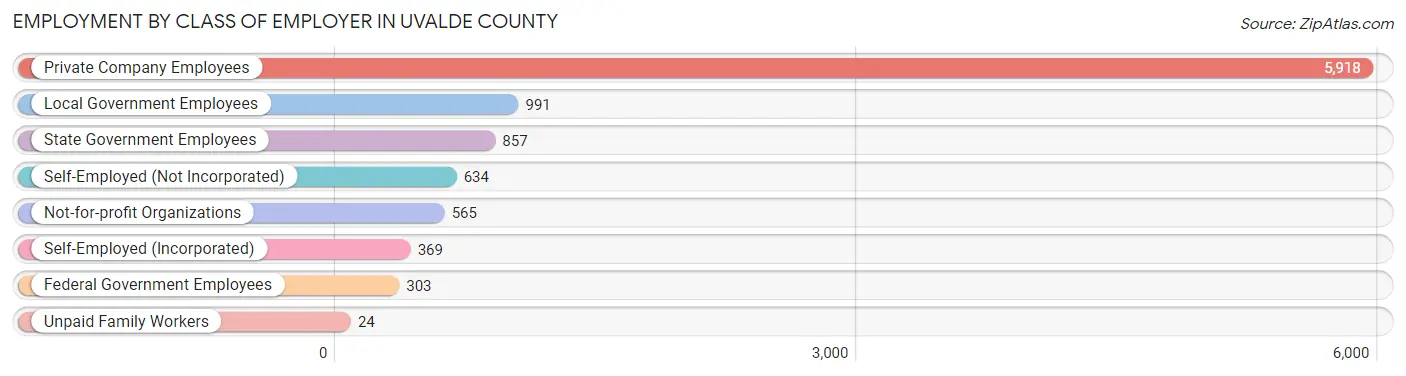
| Employer Class | # Employees | % Employees |
| Private Company Employees | 5,918 | 61.3% |
| Self-Employed (Incorporated) | 369 | 3.8% |
| Self-Employed (Not Incorporated) | 634 | 6.6% |
| Not-for-profit Organizations | 565 | 5.9% |
| Local Government Employees | 991 | 10.3% |
| State Government Employees | 857 | 8.9% |
| Federal Government Employees | 303 | 3.1% |
| Unpaid Family Workers | 24 | 0.3% |
| Total | 9,661 | 100.0% |
Employment Status by Age in Uvalde County
According to the labor force statistics for Uvalde County, out of the total population over 16 years of age (19,062), 53.8% or 10,255 individuals are in the labor force, with 3.2% or 328 of them unemployed. The age group with the highest labor force participation rate is 20 to 24 years, with 74.8% or 1,417 individuals in the labor force. Within the labor force, the 20 to 24 years age range has the highest percentage of unemployed individuals, with 13.1% or 186 of them being unemployed.
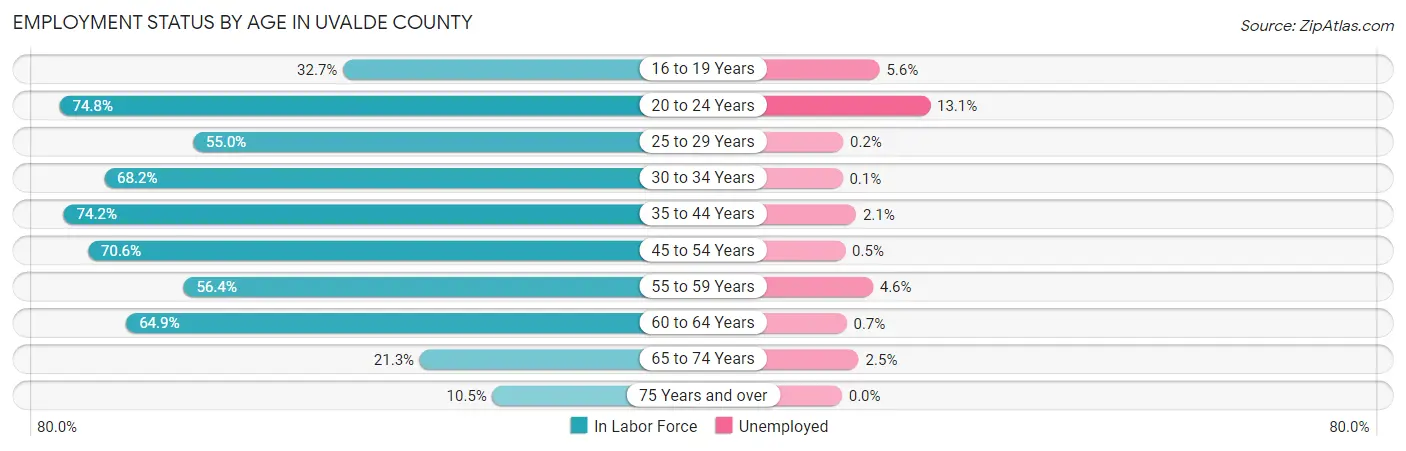
| Age Bracket | In Labor Force | Unemployed |
| 16 to 19 Years | 550 (32.7%) | 31 (5.6%) |
| 20 to 24 Years | 1,417 (74.8%) | 186 (13.1%) |
| 25 to 29 Years | 931 (55.0%) | 2 (0.2%) |
| 30 to 34 Years | 1,099 (68.2%) | 1 (0.1%) |
| 35 to 44 Years | 2,233 (74.2%) | 47 (2.1%) |
| 45 to 54 Years | 1,811 (70.6%) | 9 (0.5%) |
| 55 to 59 Years | 735 (56.4%) | 34 (4.6%) |
| 60 to 64 Years | 809 (64.9%) | 6 (0.7%) |
| 65 to 74 Years | 473 (21.3%) | 12 (2.5%) |
| 75 Years and over | 193 (10.5%) | 0 (0.0%) |
| Total | 10,255 (53.8%) | 328 (3.2%) |
Employment Status by Educational Attainment in Uvalde County
According to labor force statistics for Uvalde County, 66.7% of individuals (7,624) out of the total population between 25 and 64 years of age (11,430) are in the labor force, with 1.3% or 99 of them being unemployed. The group with the highest labor force participation rate are those with the educational attainment of bachelor's degree or higher, with 83.0% or 1,857 individuals in the labor force. Within the labor force, individuals with high school diploma education have the highest percentage of unemployment, with 2.4% or 45 of them being unemployed.
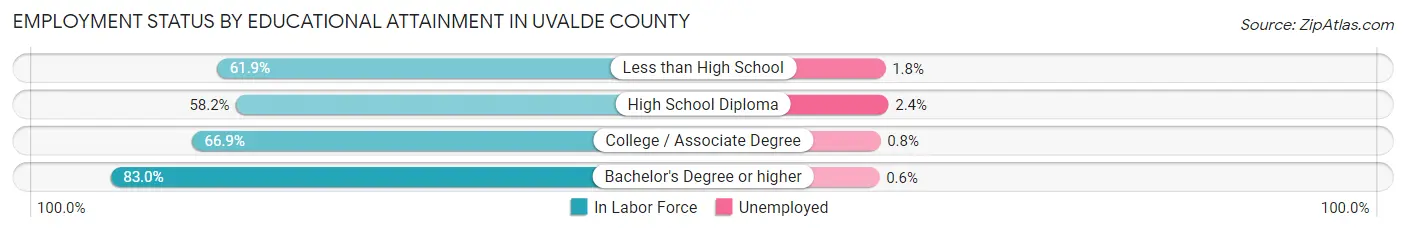
| Educational Attainment | In Labor Force | Unemployed |
| Less than High School | 1,330 (61.9%) | 39 (1.8%) |
| High School Diploma | 1,862 (58.2%) | 77 (2.4%) |
| College / Associate Degree | 2,572 (66.9%) | 31 (0.8%) |
| Bachelor's Degree or higher | 1,857 (83.0%) | 13 (0.6%) |
| Total | 7,624 (66.7%) | 149 (1.3%) |
Employment Occupations by Sex in Uvalde County
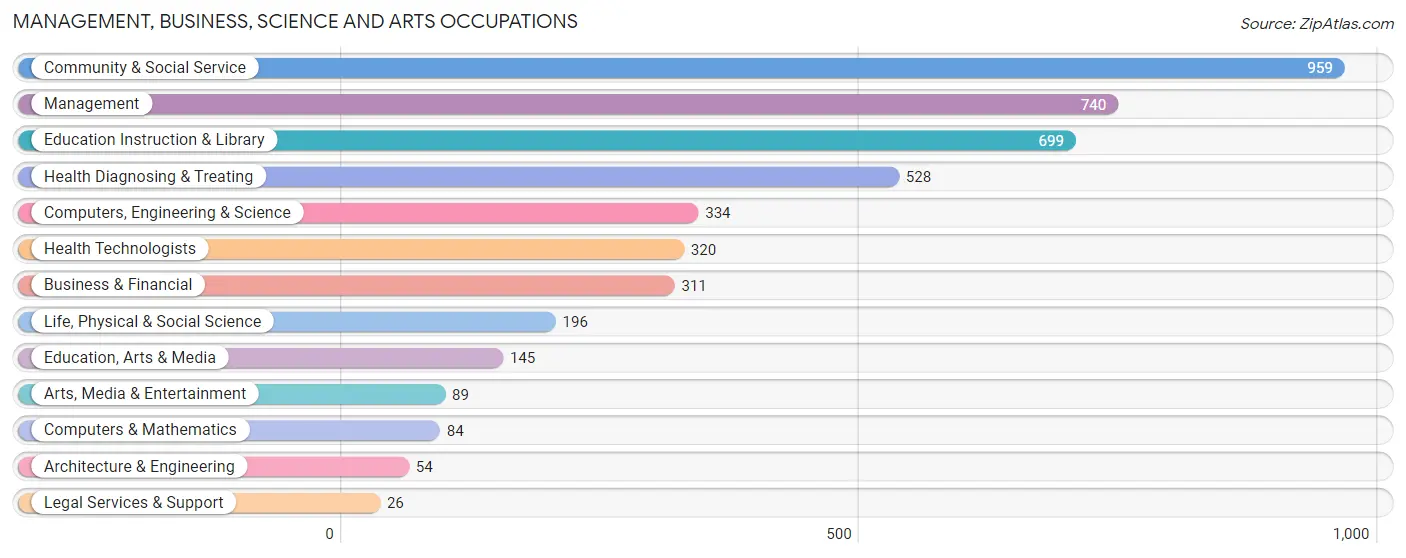
Management, Business, Science and Arts Occupations
The most common Management, Business, Science and Arts occupations in Uvalde County are Community & Social Service (959 | 9.7%), Management (740 | 7.5%), Education Instruction & Library (699 | 7.0%), Health Diagnosing & Treating (528 | 5.3%), and Computers, Engineering & Science (334 | 3.4%).
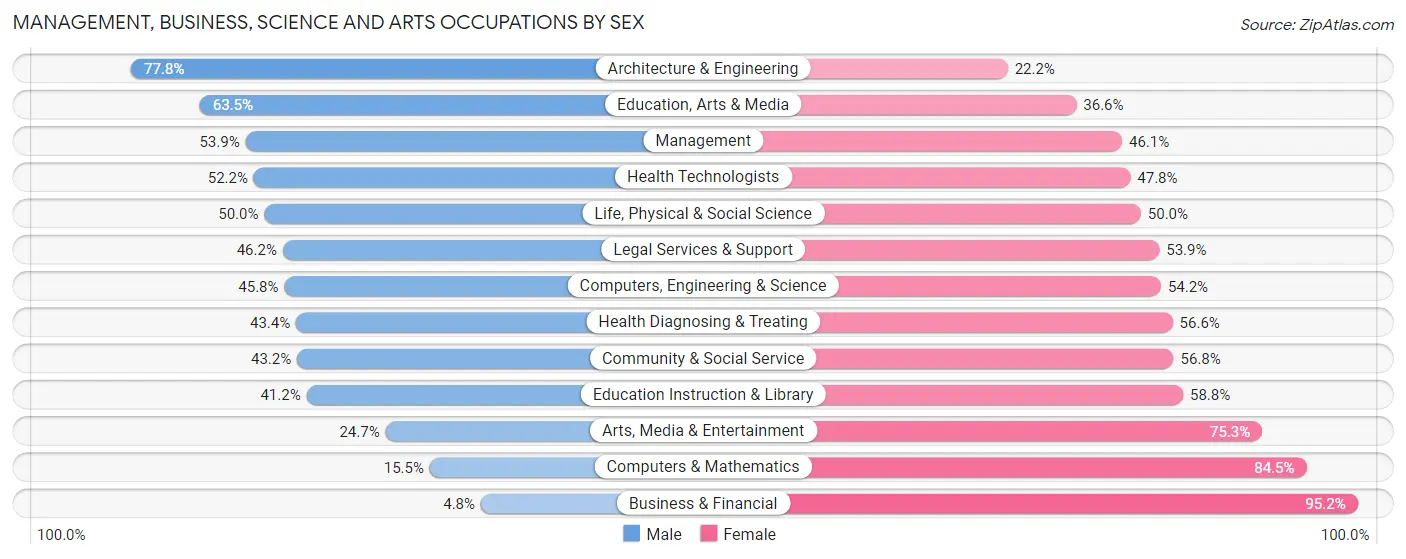
Management, Business, Science and Arts Occupations by Sex
Within the Management, Business, Science and Arts occupations in Uvalde County, the most male-oriented occupations are Architecture & Engineering (77.8%), Education, Arts & Media (63.4%), and Management (53.9%), while the most female-oriented occupations are Business & Financial (95.2%), Computers & Mathematics (84.5%), and Arts, Media & Entertainment (75.3%).
| Occupation | Male | Female |
| Management | 399 (53.9%) | 341 (46.1%) |
| Business & Financial | 15 (4.8%) | 296 (95.2%) |
| Computers, Engineering & Science | 153 (45.8%) | 181 (54.2%) |
| Computers & Mathematics | 13 (15.5%) | 71 (84.5%) |
| Architecture & Engineering | 42 (77.8%) | 12 (22.2%) |
| Life, Physical & Social Science | 98 (50.0%) | 98 (50.0%) |
| Community & Social Service | 414 (43.2%) | 545 (56.8%) |
| Education, Arts & Media | 92 (63.4%) | 53 (36.5%) |
| Legal Services & Support | 12 (46.2%) | 14 (53.8%) |
| Education Instruction & Library | 288 (41.2%) | 411 (58.8%) |
| Arts, Media & Entertainment | 22 (24.7%) | 67 (75.3%) |
| Health Diagnosing & Treating | 229 (43.4%) | 299 (56.6%) |
| Health Technologists | 167 (52.2%) | 153 (47.8%) |
| Total (Category) | 1,210 (42.1%) | 1,662 (57.9%) |
| Total (Overall) | 4,835 (48.7%) | 5,085 (51.3%) |
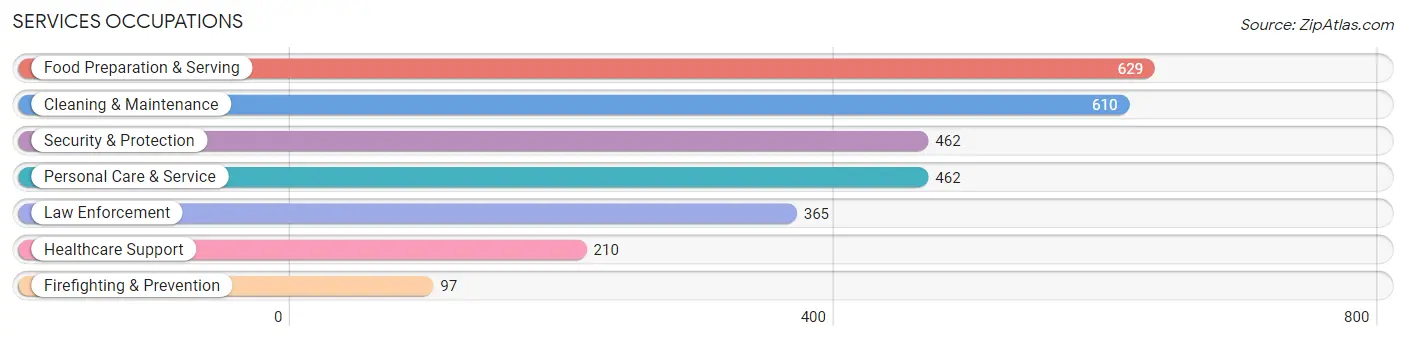
Services Occupations
The most common Services occupations in Uvalde County are Food Preparation & Serving (629 | 6.3%), Cleaning & Maintenance (610 | 6.1%), Security & Protection (462 | 4.7%), Personal Care & Service (462 | 4.7%), and Law Enforcement (365 | 3.7%).
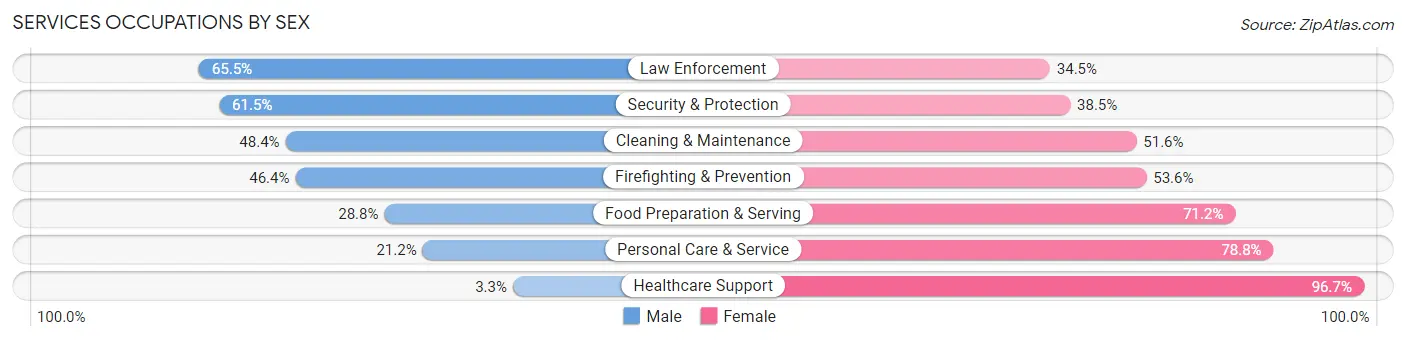
Services Occupations by Sex
Within the Services occupations in Uvalde County, the most male-oriented occupations are Law Enforcement (65.5%), Security & Protection (61.5%), and Cleaning & Maintenance (48.4%), while the most female-oriented occupations are Healthcare Support (96.7%), Personal Care & Service (78.8%), and Food Preparation & Serving (71.2%).
| Occupation | Male | Female |
| Healthcare Support | 7 (3.3%) | 203 (96.7%) |
| Security & Protection | 284 (61.5%) | 178 (38.5%) |
| Firefighting & Prevention | 45 (46.4%) | 52 (53.6%) |
| Law Enforcement | 239 (65.5%) | 126 (34.5%) |
| Food Preparation & Serving | 181 (28.8%) | 448 (71.2%) |
| Cleaning & Maintenance | 295 (48.4%) | 315 (51.6%) |
| Personal Care & Service | 98 (21.2%) | 364 (78.8%) |
| Total (Category) | 865 (36.4%) | 1,508 (63.5%) |
| Total (Overall) | 4,835 (48.7%) | 5,085 (51.3%) |
Sales and Office Occupations
The most common Sales and Office occupations in Uvalde County are Sales & Related (1,111 | 11.2%), and Office & Administration (961 | 9.7%).

Sales and Office Occupations by Sex

| Occupation | Male | Female |
| Sales & Related | 420 (37.8%) | 691 (62.2%) |
| Office & Administration | 131 (13.6%) | 830 (86.4%) |
| Total (Category) | 551 (26.6%) | 1,521 (73.4%) |
| Total (Overall) | 4,835 (48.7%) | 5,085 (51.3%) |
Natural Resources, Construction and Maintenance Occupations
The most common Natural Resources, Construction and Maintenance occupations in Uvalde County are Construction & Extraction (864 | 8.7%), Installation, Maintenance & Repair (605 | 6.1%), and Farming, Fishing & Forestry (214 | 2.2%).
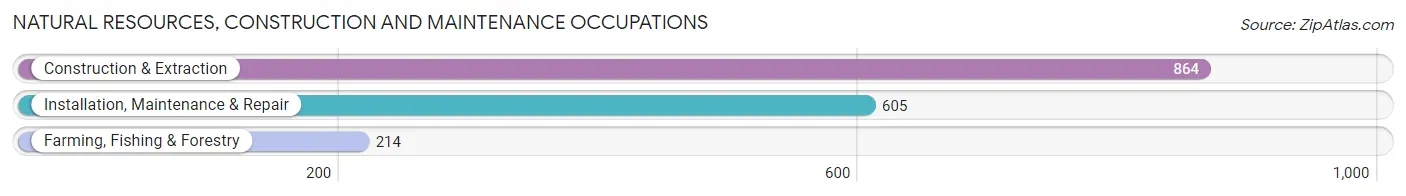
Natural Resources, Construction and Maintenance Occupations by Sex
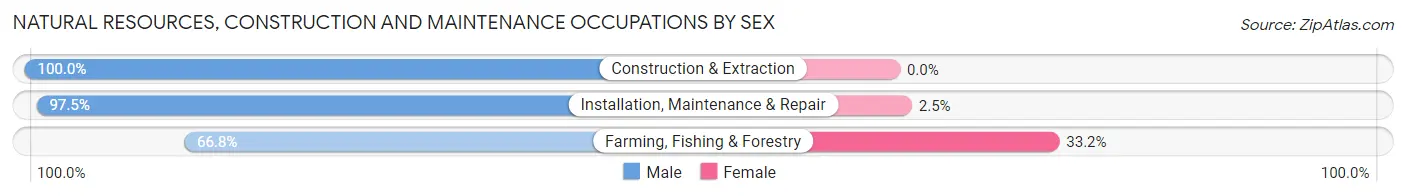
| Occupation | Male | Female |
| Farming, Fishing & Forestry | 143 (66.8%) | 71 (33.2%) |
| Construction & Extraction | 864 (100.0%) | 0 (0.0%) |
| Installation, Maintenance & Repair | 590 (97.5%) | 15 (2.5%) |
| Total (Category) | 1,597 (94.9%) | 86 (5.1%) |
| Total (Overall) | 4,835 (48.7%) | 5,085 (51.3%) |
Production, Transportation and Moving Occupations
The most common Production, Transportation and Moving occupations in Uvalde County are Production (367 | 3.7%), Transportation (354 | 3.6%), and Material Moving (199 | 2.0%).
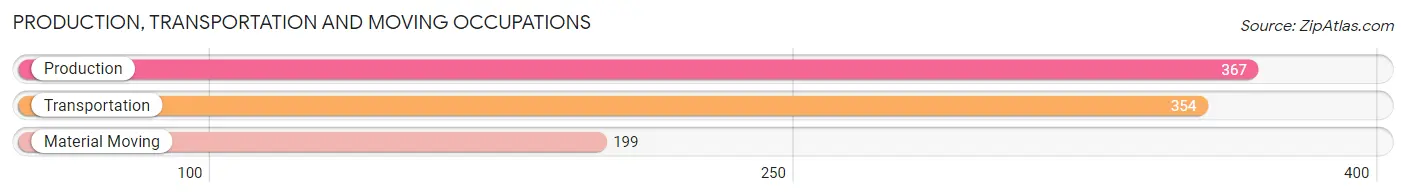
Production, Transportation and Moving Occupations by Sex
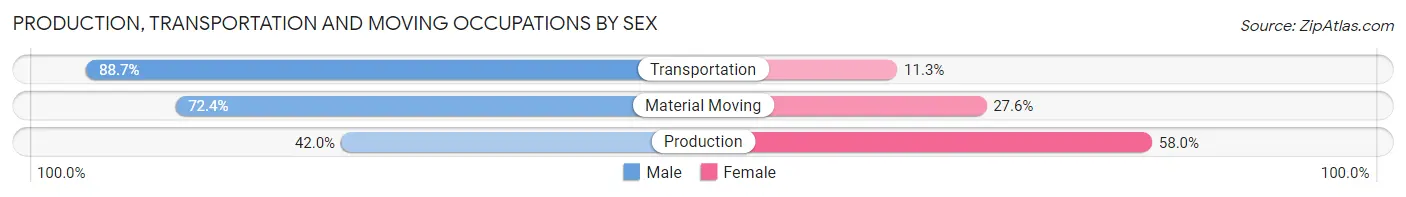
| Occupation | Male | Female |
| Production | 154 (42.0%) | 213 (58.0%) |
| Transportation | 314 (88.7%) | 40 (11.3%) |
| Material Moving | 144 (72.4%) | 55 (27.6%) |
| Total (Category) | 612 (66.5%) | 308 (33.5%) |
| Total (Overall) | 4,835 (48.7%) | 5,085 (51.3%) |
Employment Industries by Sex in Uvalde County
Employment Industries in Uvalde County
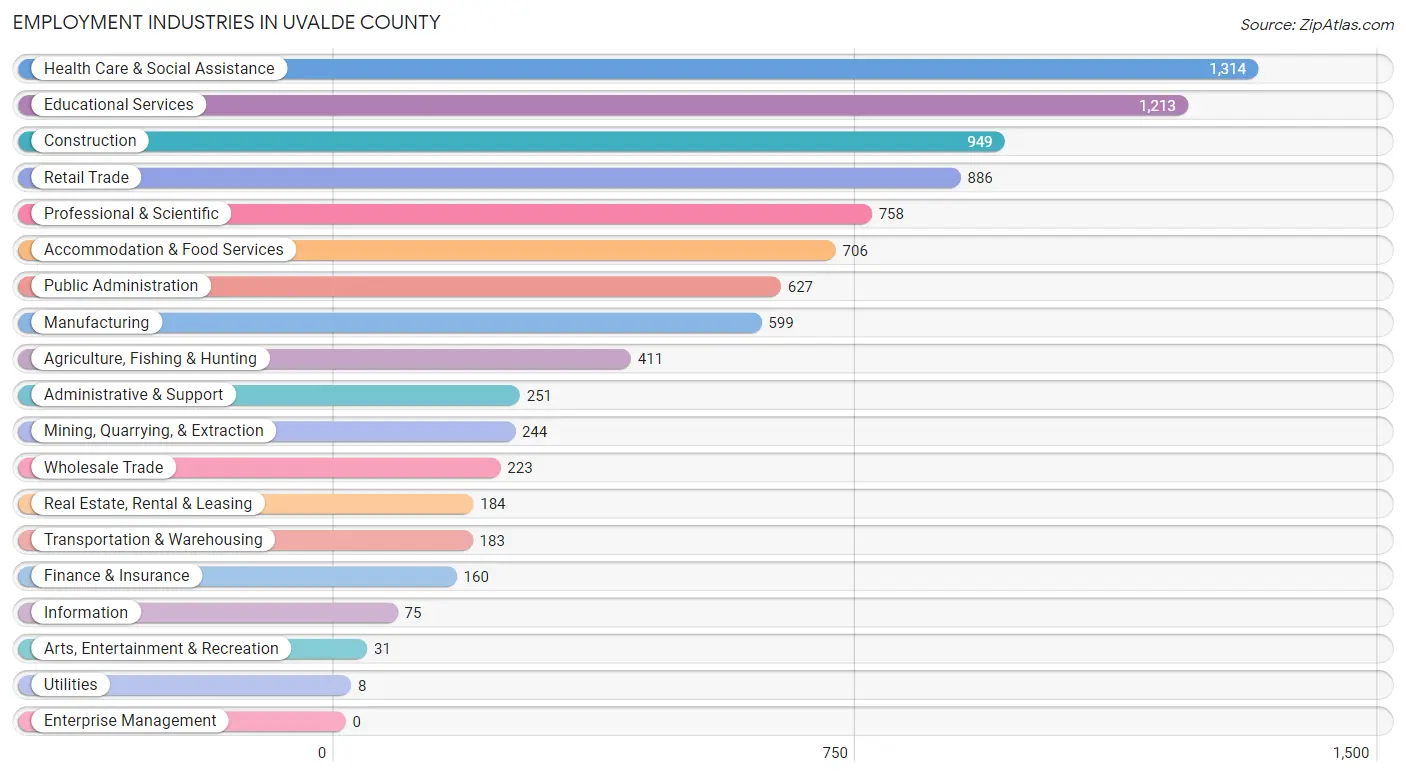
The major employment industries in Uvalde County include Health Care & Social Assistance (1,314 | 13.3%), Educational Services (1,213 | 12.2%), Construction (949 | 9.6%), Retail Trade (886 | 8.9%), and Professional & Scientific (758 | 7.6%).
Employment Industries by Sex in Uvalde County
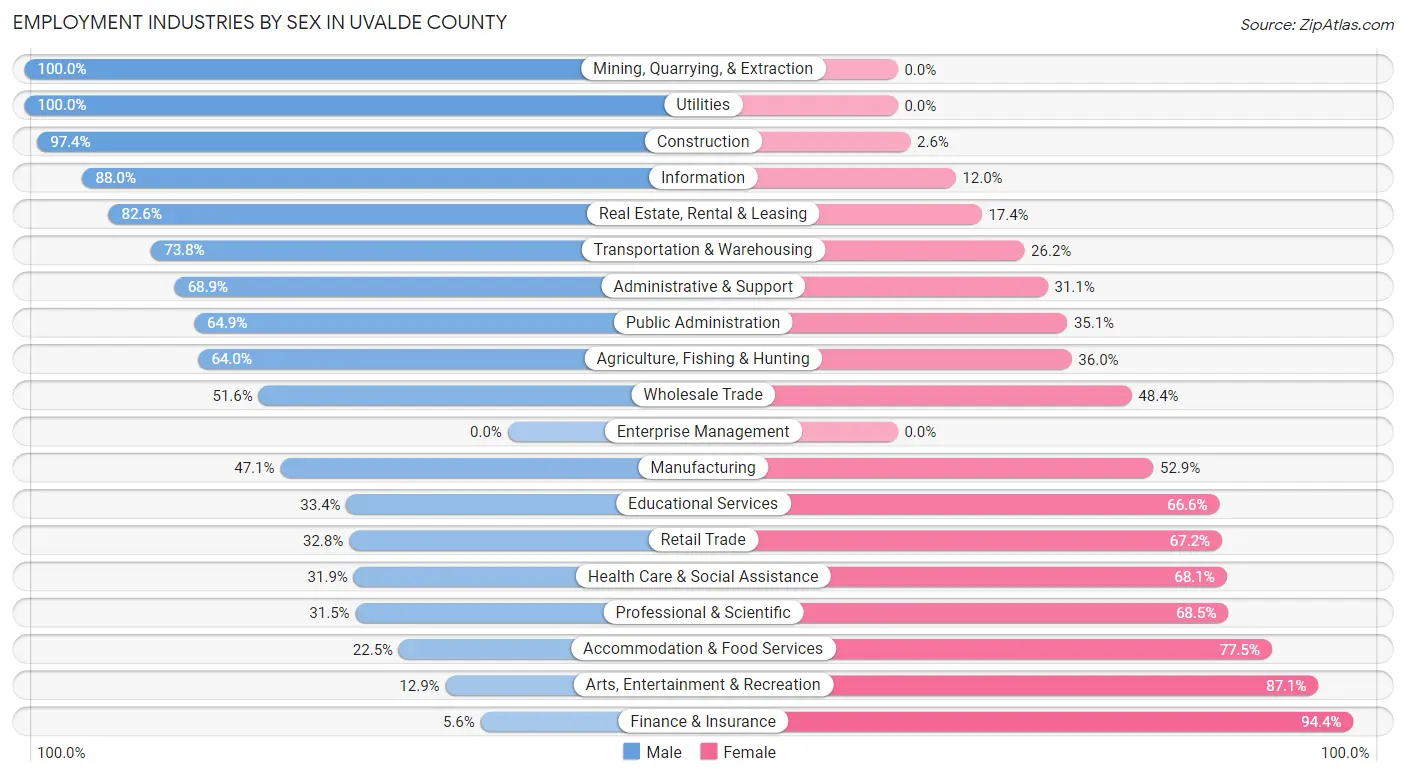
The Uvalde County industries that see more men than women are Mining, Quarrying, & Extraction (100.0%), Utilities (100.0%), and Construction (97.4%), whereas the industries that tend to have a higher number of women are Finance & Insurance (94.4%), Arts, Entertainment & Recreation (87.1%), and Accommodation & Food Services (77.5%).
| Industry | Male | Female |
| Agriculture, Fishing & Hunting | 263 (64.0%) | 148 (36.0%) |
| Mining, Quarrying, & Extraction | 244 (100.0%) | 0 (0.0%) |
| Construction | 924 (97.4%) | 25 (2.6%) |
| Manufacturing | 282 (47.1%) | 317 (52.9%) |
| Wholesale Trade | 115 (51.6%) | 108 (48.4%) |
| Retail Trade | 291 (32.8%) | 595 (67.2%) |
| Transportation & Warehousing | 135 (73.8%) | 48 (26.2%) |
| Utilities | 8 (100.0%) | 0 (0.0%) |
| Information | 66 (88.0%) | 9 (12.0%) |
| Finance & Insurance | 9 (5.6%) | 151 (94.4%) |
| Real Estate, Rental & Leasing | 152 (82.6%) | 32 (17.4%) |
| Professional & Scientific | 239 (31.5%) | 519 (68.5%) |
| Enterprise Management | 0 (0.0%) | 0 (0.0%) |
| Administrative & Support | 173 (68.9%) | 78 (31.1%) |
| Educational Services | 405 (33.4%) | 808 (66.6%) |
| Health Care & Social Assistance | 419 (31.9%) | 895 (68.1%) |
| Arts, Entertainment & Recreation | 4 (12.9%) | 27 (87.1%) |
| Accommodation & Food Services | 159 (22.5%) | 547 (77.5%) |
| Public Administration | 407 (64.9%) | 220 (35.1%) |
| Total | 4,835 (48.7%) | 5,085 (51.3%) |
Education in Uvalde County
School Enrollment in Uvalde County
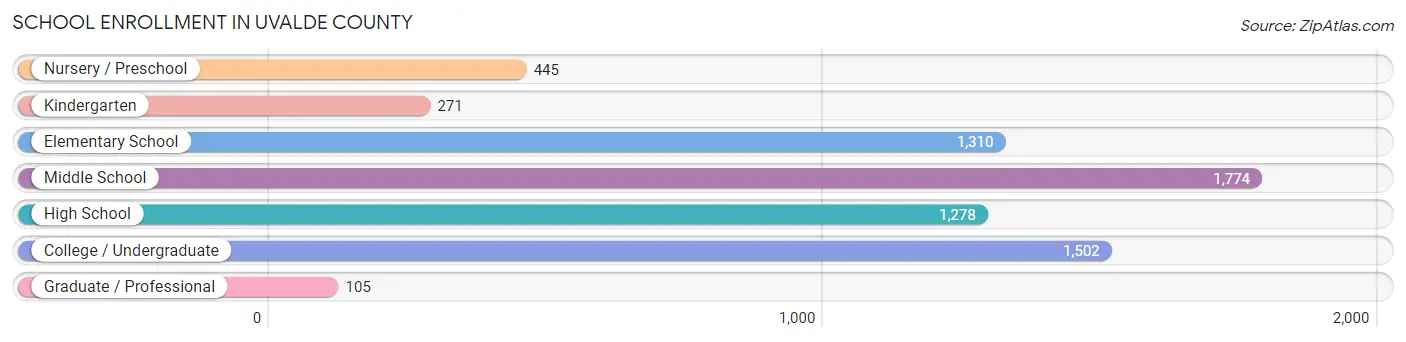
The most common levels of schooling among the 6,685 students in Uvalde County are middle school (1,774 | 26.5%), college / undergraduate (1,502 | 22.5%), and elementary school (1,310 | 19.6%).
| School Level | # Students | % Students |
| Nursery / Preschool | 445 | 6.7% |
| Kindergarten | 271 | 4.1% |
| Elementary School | 1,310 | 19.6% |
| Middle School | 1,774 | 26.5% |
| High School | 1,278 | 19.1% |
| College / Undergraduate | 1,502 | 22.5% |
| Graduate / Professional | 105 | 1.6% |
| Total | 6,685 | 100.0% |
School Enrollment by Age by Funding Source in Uvalde County
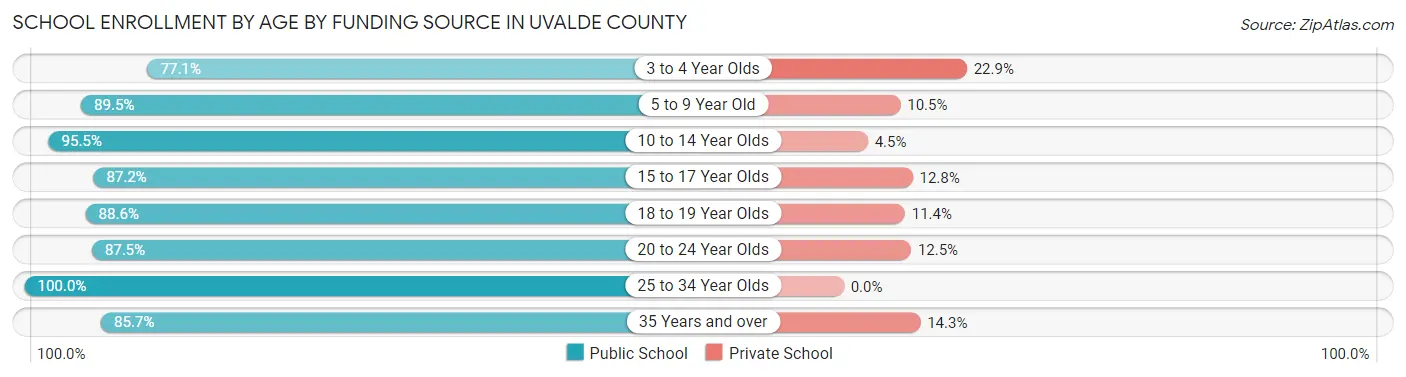
Out of a total of 6,685 students who are enrolled in schools in Uvalde County, 655 (9.8%) attend a private institution, while the remaining 6,030 (90.2%) are enrolled in public schools. The age group of 3 to 4 year olds has the highest likelihood of being enrolled in private schools, with 88 (22.9% in the age bracket) enrolled. Conversely, the age group of 25 to 34 year olds has the lowest likelihood of being enrolled in a private school, with 312 (100.0% in the age bracket) attending a public institution.
| Age Bracket | Public School | Private School |
| 3 to 4 Year Olds | 296 (77.1%) | 88 (22.9%) |
| 5 to 9 Year Old | 1,384 (89.5%) | 163 (10.5%) |
| 10 to 14 Year Olds | 1,832 (95.5%) | 86 (4.5%) |
| 15 to 17 Year Olds | 856 (87.2%) | 126 (12.8%) |
| 18 to 19 Year Olds | 584 (88.6%) | 75 (11.4%) |
| 20 to 24 Year Olds | 349 (87.5%) | 50 (12.5%) |
| 25 to 34 Year Olds | 312 (100.0%) | 0 (0.0%) |
| 35 Years and over | 415 (85.7%) | 69 (14.3%) |
| Total | 6,030 (90.2%) | 655 (9.8%) |
Educational Attainment by Field of Study in Uvalde County
Education (803 | 26.7%), business (502 | 16.7%), arts & humanities (433 | 14.4%), science & technology (267 | 8.9%), and bio, nature & agricultural (186 | 6.2%) are the most common fields of study among 3,008 individuals in Uvalde County who have obtained a bachelor's degree or higher.
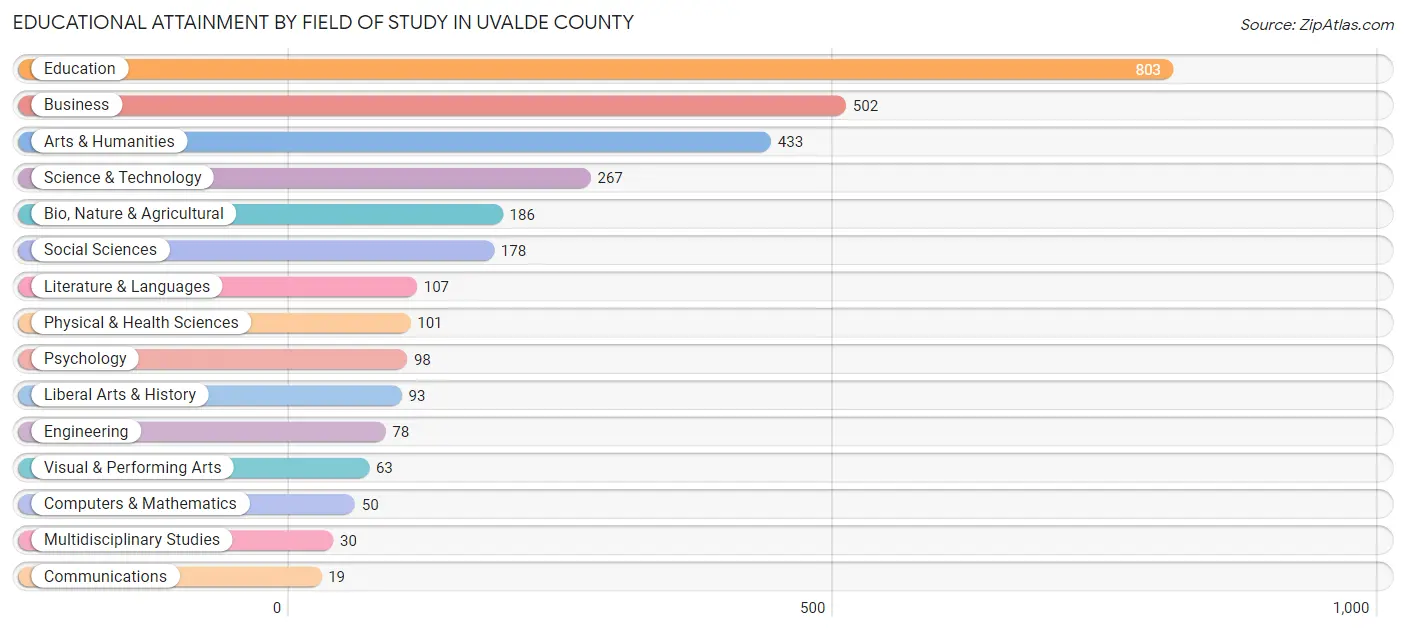
| Field of Study | # Graduates | % Graduates |
| Computers & Mathematics | 50 | 1.7% |
| Bio, Nature & Agricultural | 186 | 6.2% |
| Physical & Health Sciences | 101 | 3.4% |
| Psychology | 98 | 3.3% |
| Social Sciences | 178 | 5.9% |
| Engineering | 78 | 2.6% |
| Multidisciplinary Studies | 30 | 1.0% |
| Science & Technology | 267 | 8.9% |
| Business | 502 | 16.7% |
| Education | 803 | 26.7% |
| Literature & Languages | 107 | 3.6% |
| Liberal Arts & History | 93 | 3.1% |
| Visual & Performing Arts | 63 | 2.1% |
| Communications | 19 | 0.6% |
| Arts & Humanities | 433 | 14.4% |
| Total | 3,008 | 100.0% |
Transportation & Commute in Uvalde County
Vehicle Availability by Sex in Uvalde County
The most prevalent vehicle ownership categories in Uvalde County are males with 2 vehicles (2,366, accounting for 50.5%) and females with 2 vehicles (2,100, making up 47.9%).
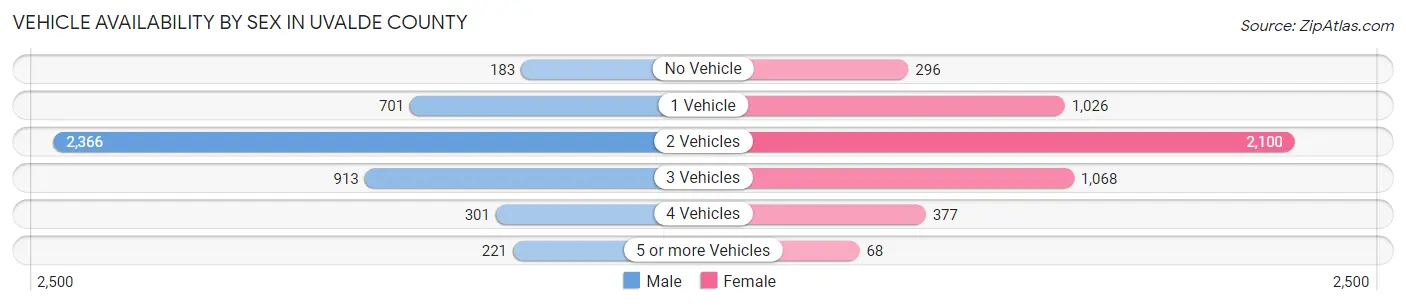
| Vehicles Available | Male | Female |
| No Vehicle | 183 (3.9%) | 296 (6.0%) |
| 1 Vehicle | 701 (15.0%) | 1,026 (20.8%) |
| 2 Vehicles | 2,366 (50.5%) | 2,100 (42.5%) |
| 3 Vehicles | 913 (19.5%) | 1,068 (21.6%) |
| 4 Vehicles | 301 (6.4%) | 377 (7.6%) |
| 5 or more Vehicles | 221 (4.7%) | 68 (1.4%) |
| Total | 4,685 (100.0%) | 4,935 (100.0%) |
Commute Time in Uvalde County
The most frequently occuring commute durations in Uvalde County are 5 to 9 minutes (2,726 commuters, 29.2%), 10 to 14 minutes (1,820 commuters, 19.5%), and 15 to 19 minutes (1,617 commuters, 17.3%).
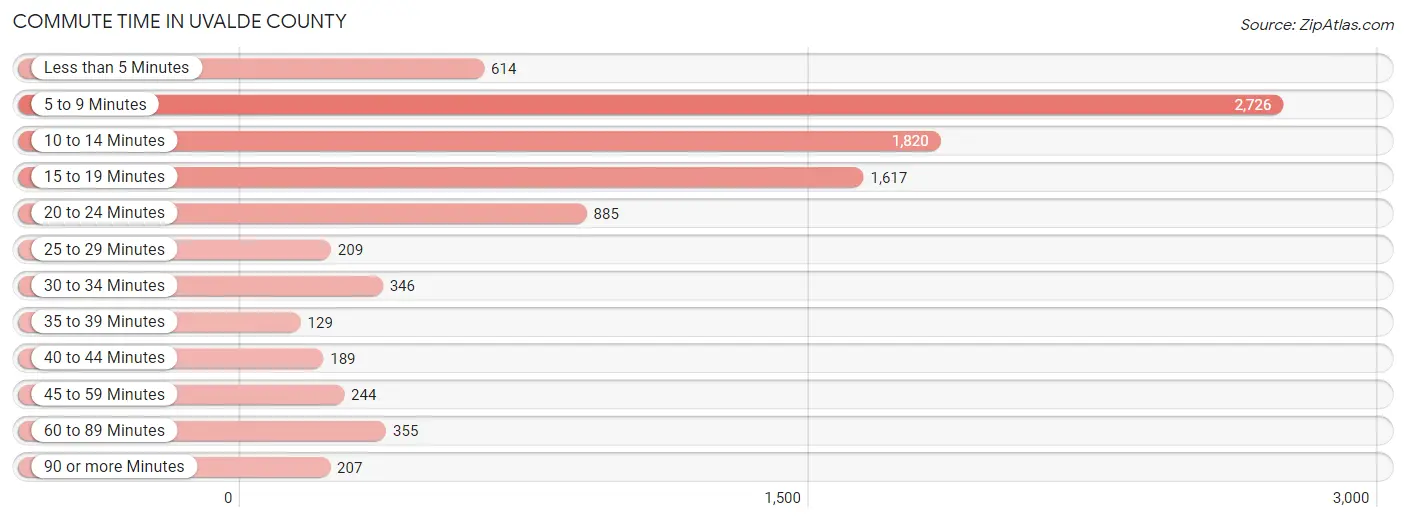
| Commute Time | # Commuters | % Commuters |
| Less than 5 Minutes | 614 | 6.6% |
| 5 to 9 Minutes | 2,726 | 29.2% |
| 10 to 14 Minutes | 1,820 | 19.5% |
| 15 to 19 Minutes | 1,617 | 17.3% |
| 20 to 24 Minutes | 885 | 9.5% |
| 25 to 29 Minutes | 209 | 2.2% |
| 30 to 34 Minutes | 346 | 3.7% |
| 35 to 39 Minutes | 129 | 1.4% |
| 40 to 44 Minutes | 189 | 2.0% |
| 45 to 59 Minutes | 244 | 2.6% |
| 60 to 89 Minutes | 355 | 3.8% |
| 90 or more Minutes | 207 | 2.2% |
Commute Time by Sex in Uvalde County
The most common commute times in Uvalde County are 5 to 9 minutes (1,299 commuters, 28.1%) for males and 5 to 9 minutes (1,427 commuters, 30.2%) for females.
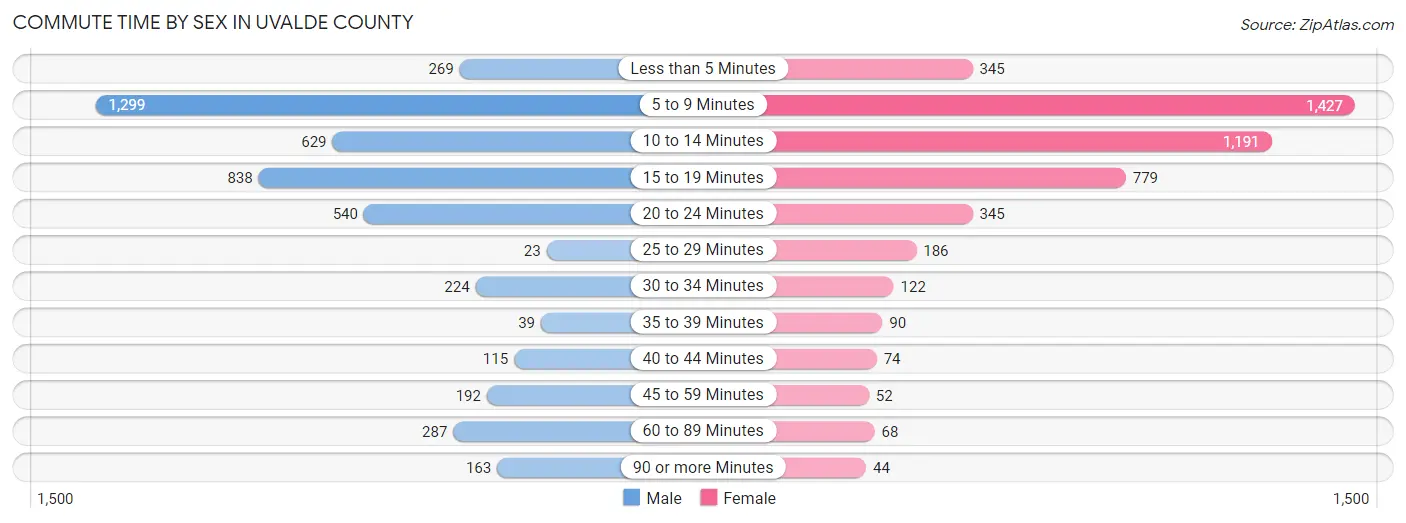
| Commute Time | Male | Female |
| Less than 5 Minutes | 269 (5.8%) | 345 (7.3%) |
| 5 to 9 Minutes | 1,299 (28.1%) | 1,427 (30.2%) |
| 10 to 14 Minutes | 629 (13.6%) | 1,191 (25.2%) |
| 15 to 19 Minutes | 838 (18.1%) | 779 (16.5%) |
| 20 to 24 Minutes | 540 (11.7%) | 345 (7.3%) |
| 25 to 29 Minutes | 23 (0.5%) | 186 (3.9%) |
| 30 to 34 Minutes | 224 (4.9%) | 122 (2.6%) |
| 35 to 39 Minutes | 39 (0.8%) | 90 (1.9%) |
| 40 to 44 Minutes | 115 (2.5%) | 74 (1.6%) |
| 45 to 59 Minutes | 192 (4.2%) | 52 (1.1%) |
| 60 to 89 Minutes | 287 (6.2%) | 68 (1.4%) |
| 90 or more Minutes | 163 (3.5%) | 44 (0.9%) |
Time of Departure to Work by Sex in Uvalde County
The most frequent times of departure to work in Uvalde County are 7:00 AM to 7:29 AM (956, 20.7%) for males and 7:30 AM to 7:59 AM (926, 19.6%) for females.
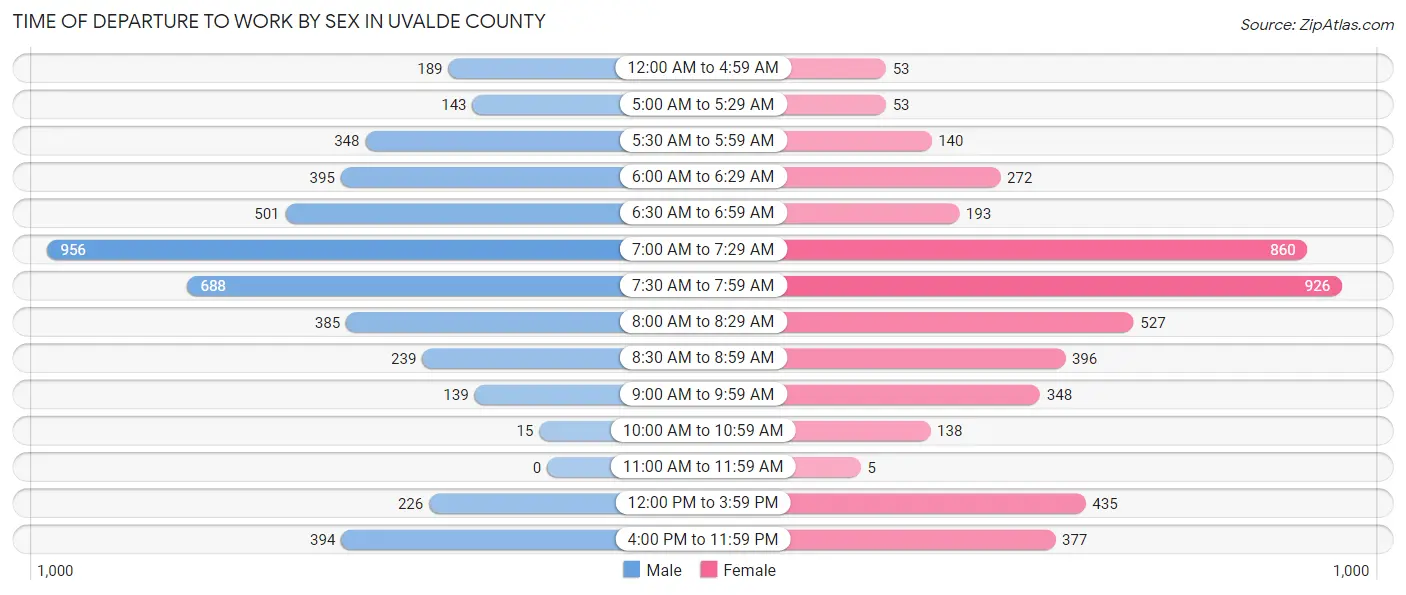
| Time of Departure | Male | Female |
| 12:00 AM to 4:59 AM | 189 (4.1%) | 53 (1.1%) |
| 5:00 AM to 5:29 AM | 143 (3.1%) | 53 (1.1%) |
| 5:30 AM to 5:59 AM | 348 (7.5%) | 140 (3.0%) |
| 6:00 AM to 6:29 AM | 395 (8.6%) | 272 (5.8%) |
| 6:30 AM to 6:59 AM | 501 (10.8%) | 193 (4.1%) |
| 7:00 AM to 7:29 AM | 956 (20.7%) | 860 (18.2%) |
| 7:30 AM to 7:59 AM | 688 (14.9%) | 926 (19.6%) |
| 8:00 AM to 8:29 AM | 385 (8.3%) | 527 (11.2%) |
| 8:30 AM to 8:59 AM | 239 (5.2%) | 396 (8.4%) |
| 9:00 AM to 9:59 AM | 139 (3.0%) | 348 (7.4%) |
| 10:00 AM to 10:59 AM | 15 (0.3%) | 138 (2.9%) |
| 11:00 AM to 11:59 AM | 0 (0.0%) | 5 (0.1%) |
| 12:00 PM to 3:59 PM | 226 (4.9%) | 435 (9.2%) |
| 4:00 PM to 11:59 PM | 394 (8.5%) | 377 (8.0%) |
| Total | 4,618 (100.0%) | 4,723 (100.0%) |
Housing Occupancy in Uvalde County
Occupancy by Ownership in Uvalde County
Of the total 8,420 dwellings in Uvalde County, owner-occupied units account for 5,750 (68.3%), while renter-occupied units make up 2,670 (31.7%).
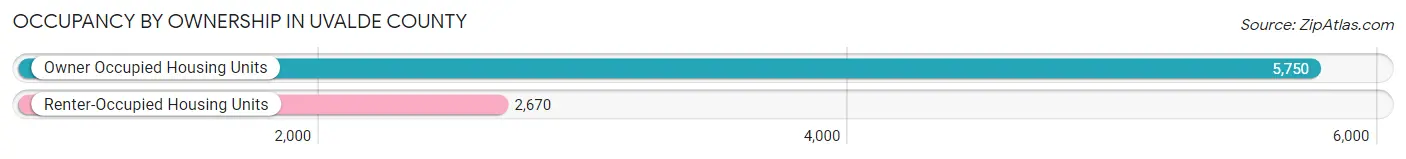
| Occupancy | # Housing Units | % Housing Units |
| Owner Occupied Housing Units | 5,750 | 68.3% |
| Renter-Occupied Housing Units | 2,670 | 31.7% |
| Total Occupied Housing Units | 8,420 | 100.0% |
Occupancy by Household Size in Uvalde County
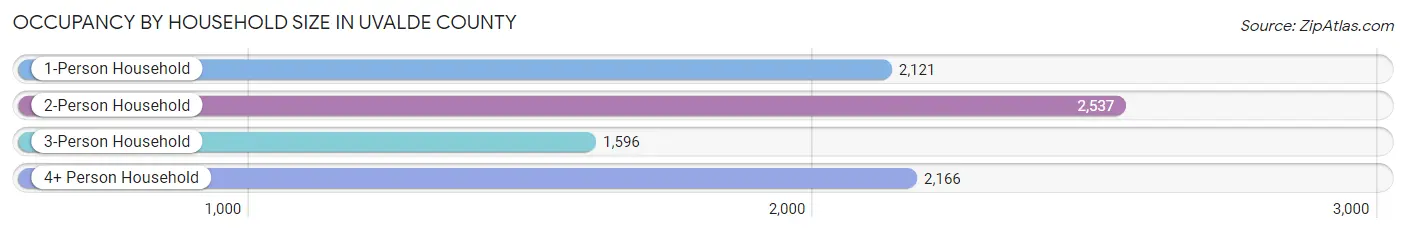
| Household Size | # Housing Units | % Housing Units |
| 1-Person Household | 2,121 | 25.2% |
| 2-Person Household | 2,537 | 30.1% |
| 3-Person Household | 1,596 | 19.0% |
| 4+ Person Household | 2,166 | 25.7% |
| Total Housing Units | 8,420 | 100.0% |
Occupancy by Ownership by Household Size in Uvalde County
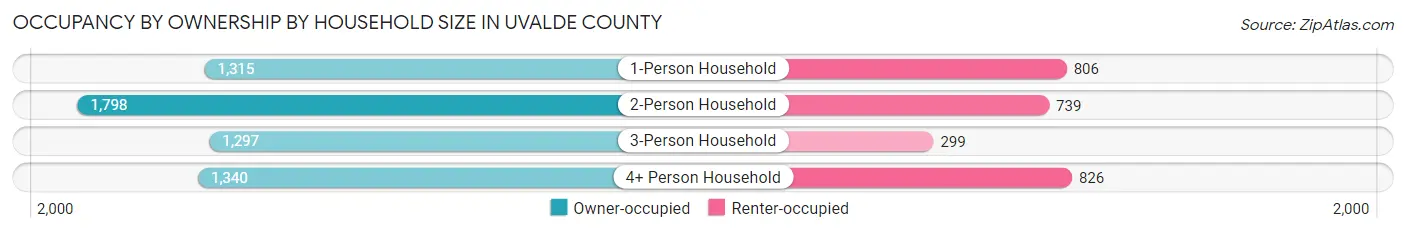
| Household Size | Owner-occupied | Renter-occupied |
| 1-Person Household | 1,315 (62.0%) | 806 (38.0%) |
| 2-Person Household | 1,798 (70.9%) | 739 (29.1%) |
| 3-Person Household | 1,297 (81.3%) | 299 (18.7%) |
| 4+ Person Household | 1,340 (61.9%) | 826 (38.1%) |
| Total Housing Units | 5,750 (68.3%) | 2,670 (31.7%) |
Occupancy by Educational Attainment in Uvalde County
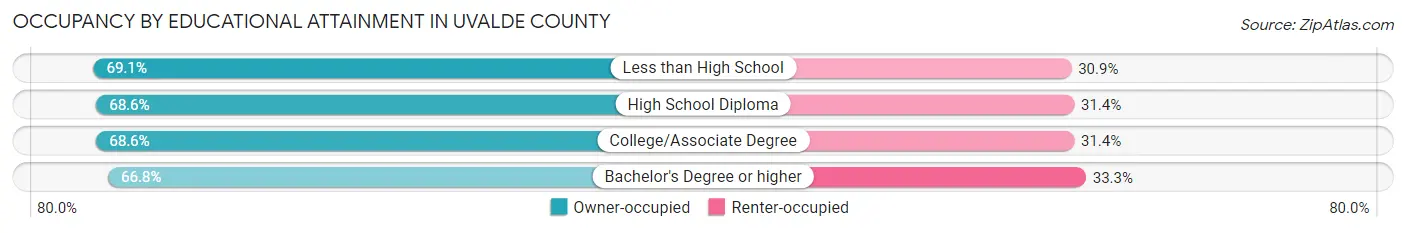
| Household Size | Owner-occupied | Renter-occupied |
| Less than High School | 1,272 (69.1%) | 570 (30.9%) |
| High School Diploma | 1,111 (68.6%) | 508 (31.4%) |
| College/Associate Degree | 2,090 (68.6%) | 956 (31.4%) |
| Bachelor's Degree or higher | 1,277 (66.7%) | 636 (33.3%) |
Occupancy by Age of Householder in Uvalde County
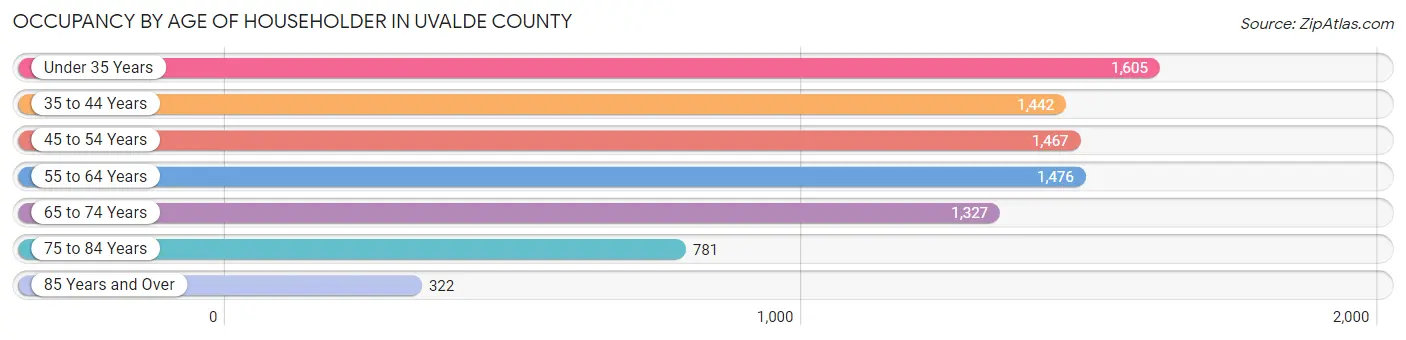
| Age Bracket | # Households | % Households |
| Under 35 Years | 1,605 | 19.1% |
| 35 to 44 Years | 1,442 | 17.1% |
| 45 to 54 Years | 1,467 | 17.4% |
| 55 to 64 Years | 1,476 | 17.5% |
| 65 to 74 Years | 1,327 | 15.8% |
| 75 to 84 Years | 781 | 9.3% |
| 85 Years and Over | 322 | 3.8% |
| Total | 8,420 | 100.0% |
Housing Finances in Uvalde County
Median Income by Occupancy in Uvalde County
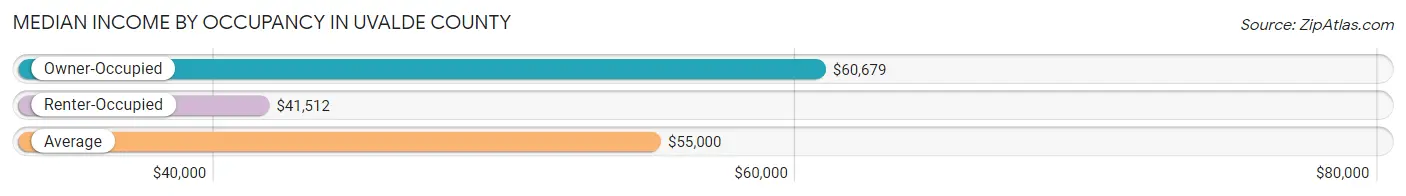
| Occupancy Type | # Households | Median Income |
| Owner-Occupied | 5,750 (68.3%) | $60,679 |
| Renter-Occupied | 2,670 (31.7%) | $41,512 |
| Average | 8,420 (100.0%) | $55,000 |
Occupancy by Householder Income Bracket in Uvalde County
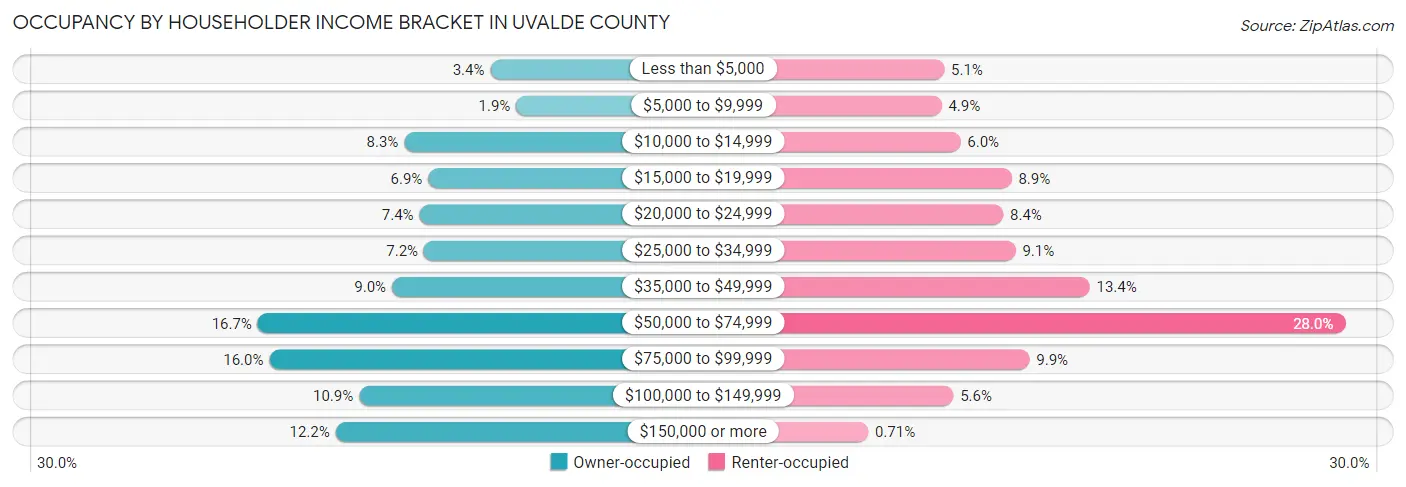
| Income Bracket | Owner-occupied | Renter-occupied |
| Less than $5,000 | 195 (3.4%) | 135 (5.1%) |
| $5,000 to $9,999 | 110 (1.9%) | 131 (4.9%) |
| $10,000 to $14,999 | 478 (8.3%) | 160 (6.0%) |
| $15,000 to $19,999 | 399 (6.9%) | 238 (8.9%) |
| $20,000 to $24,999 | 428 (7.4%) | 225 (8.4%) |
| $25,000 to $34,999 | 413 (7.2%) | 244 (9.1%) |
| $35,000 to $49,999 | 518 (9.0%) | 357 (13.4%) |
| $50,000 to $74,999 | 959 (16.7%) | 747 (28.0%) |
| $75,000 to $99,999 | 921 (16.0%) | 265 (9.9%) |
| $100,000 to $149,999 | 626 (10.9%) | 149 (5.6%) |
| $150,000 or more | 703 (12.2%) | 19 (0.7%) |
| Total | 5,750 (100.0%) | 2,670 (100.0%) |
Monthly Housing Cost Tiers in Uvalde County
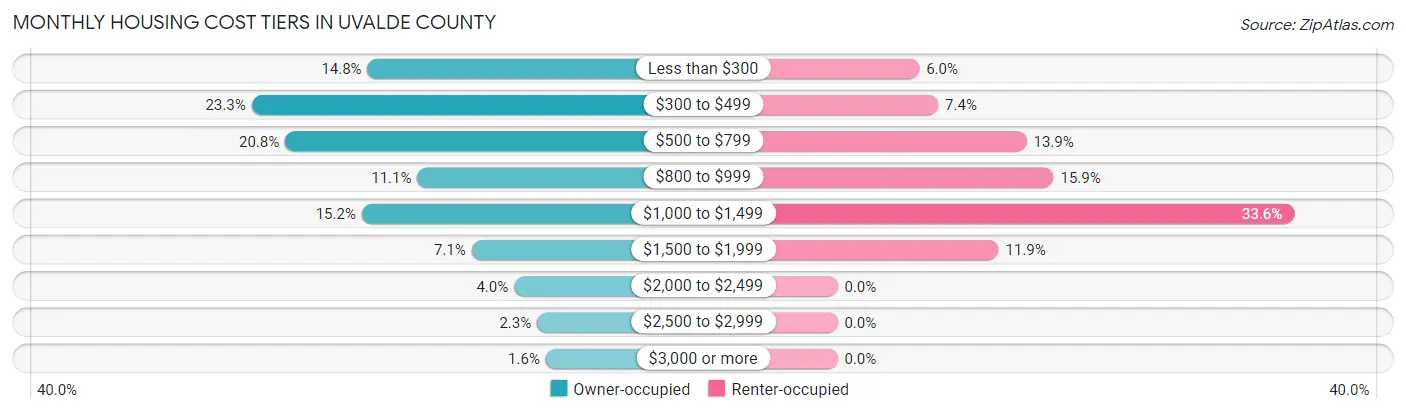
| Monthly Cost | Owner-occupied | Renter-occupied |
| Less than $300 | 848 (14.7%) | 161 (6.0%) |
| $300 to $499 | 1,339 (23.3%) | 198 (7.4%) |
| $500 to $799 | 1,197 (20.8%) | 372 (13.9%) |
| $800 to $999 | 637 (11.1%) | 425 (15.9%) |
| $1,000 to $1,499 | 872 (15.2%) | 898 (33.6%) |
| $1,500 to $1,999 | 407 (7.1%) | 317 (11.9%) |
| $2,000 to $2,499 | 227 (4.0%) | 0 (0.0%) |
| $2,500 to $2,999 | 130 (2.3%) | 0 (0.0%) |
| $3,000 or more | 93 (1.6%) | 0 (0.0%) |
| Total | 5,750 (100.0%) | 2,670 (100.0%) |
Physical Housing Characteristics in Uvalde County
Housing Structures in Uvalde County
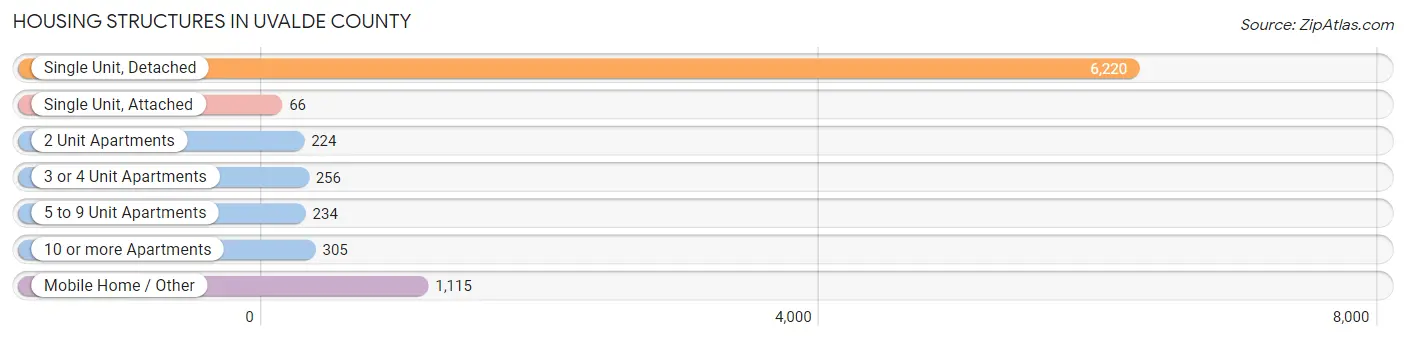
| Structure Type | # Housing Units | % Housing Units |
| Single Unit, Detached | 6,220 | 73.9% |
| Single Unit, Attached | 66 | 0.8% |
| 2 Unit Apartments | 224 | 2.7% |
| 3 or 4 Unit Apartments | 256 | 3.0% |
| 5 to 9 Unit Apartments | 234 | 2.8% |
| 10 or more Apartments | 305 | 3.6% |
| Mobile Home / Other | 1,115 | 13.2% |
| Total | 8,420 | 100.0% |
Housing Structures by Occupancy in Uvalde County
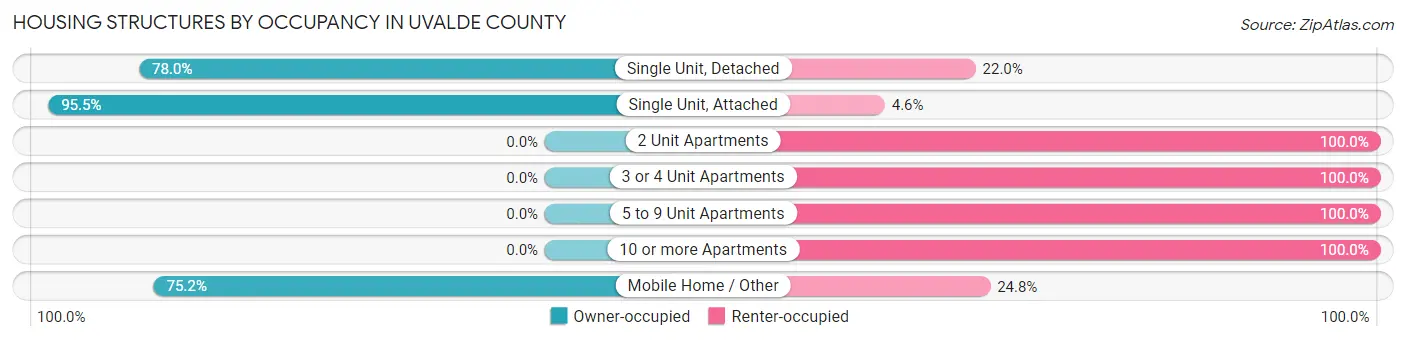
| Structure Type | Owner-occupied | Renter-occupied |
| Single Unit, Detached | 4,849 (78.0%) | 1,371 (22.0%) |
| Single Unit, Attached | 63 (95.5%) | 3 (4.5%) |
| 2 Unit Apartments | 0 (0.0%) | 224 (100.0%) |
| 3 or 4 Unit Apartments | 0 (0.0%) | 256 (100.0%) |
| 5 to 9 Unit Apartments | 0 (0.0%) | 234 (100.0%) |
| 10 or more Apartments | 0 (0.0%) | 305 (100.0%) |
| Mobile Home / Other | 838 (75.2%) | 277 (24.8%) |
| Total | 5,750 (68.3%) | 2,670 (31.7%) |
Housing Structures by Number of Rooms in Uvalde County
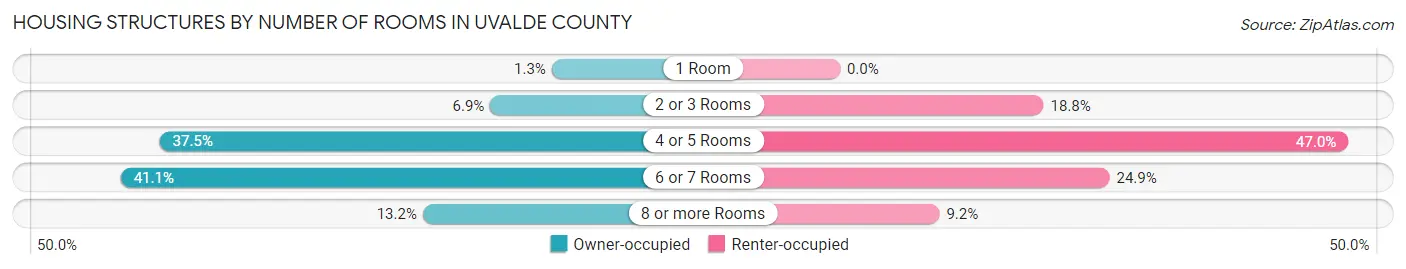
| Number of Rooms | Owner-occupied | Renter-occupied |
| 1 Room | 72 (1.3%) | 0 (0.0%) |
| 2 or 3 Rooms | 399 (6.9%) | 503 (18.8%) |
| 4 or 5 Rooms | 2,157 (37.5%) | 1,255 (47.0%) |
| 6 or 7 Rooms | 2,364 (41.1%) | 666 (24.9%) |
| 8 or more Rooms | 758 (13.2%) | 246 (9.2%) |
| Total | 5,750 (100.0%) | 2,670 (100.0%) |
Housing Structure by Heating Type in Uvalde County
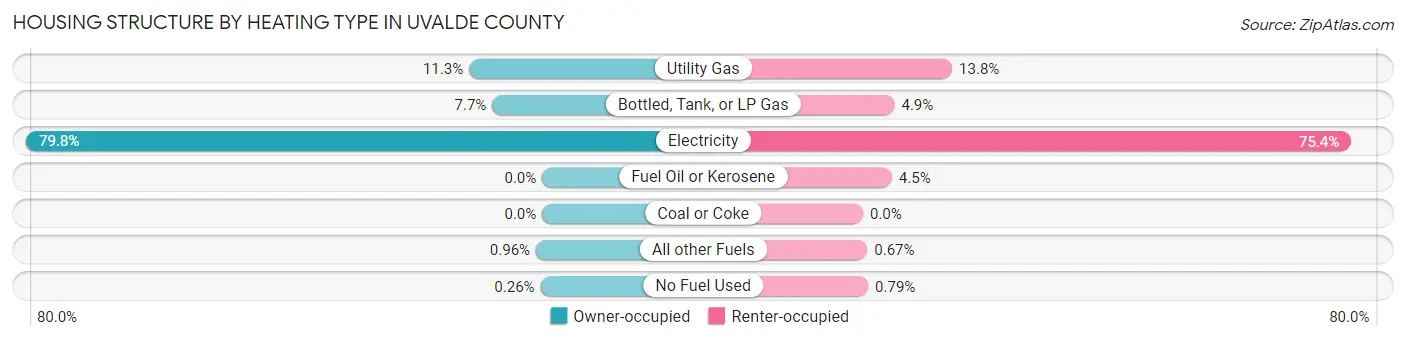
| Heating Type | Owner-occupied | Renter-occupied |
| Utility Gas | 650 (11.3%) | 368 (13.8%) |
| Bottled, Tank, or LP Gas | 444 (7.7%) | 130 (4.9%) |
| Electricity | 4,586 (79.8%) | 2,014 (75.4%) |
| Fuel Oil or Kerosene | 0 (0.0%) | 119 (4.5%) |
| Coal or Coke | 0 (0.0%) | 0 (0.0%) |
| All other Fuels | 55 (1.0%) | 18 (0.7%) |
| No Fuel Used | 15 (0.3%) | 21 (0.8%) |
| Total | 5,750 (100.0%) | 2,670 (100.0%) |
Household Vehicle Usage in Uvalde County
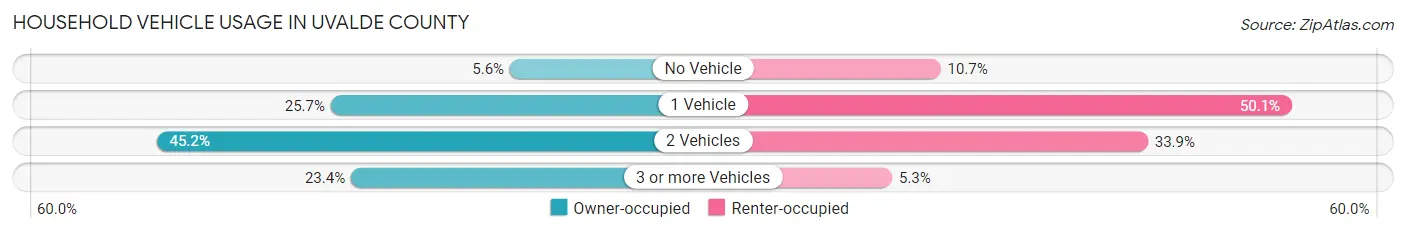
| Vehicles per Household | Owner-occupied | Renter-occupied |
| No Vehicle | 324 (5.6%) | 286 (10.7%) |
| 1 Vehicle | 1,478 (25.7%) | 1,337 (50.1%) |
| 2 Vehicles | 2,600 (45.2%) | 906 (33.9%) |
| 3 or more Vehicles | 1,348 (23.4%) | 141 (5.3%) |
| Total | 5,750 (100.0%) | 2,670 (100.0%) |
Real Estate & Mortgages in Uvalde County
Real Estate and Mortgage Overview in Uvalde County
| Characteristic | Without Mortgage | With Mortgage |
| Housing Units | 3,884 | 1,866 |
| Median Property Value | $91,900 | $170,800 |
| Median Household Income | $40,435 | $396 |
| Monthly Housing Costs | $464 | $93 |
| Real Estate Taxes | $1,174 | $118 |
Property Value by Mortgage Status in Uvalde County
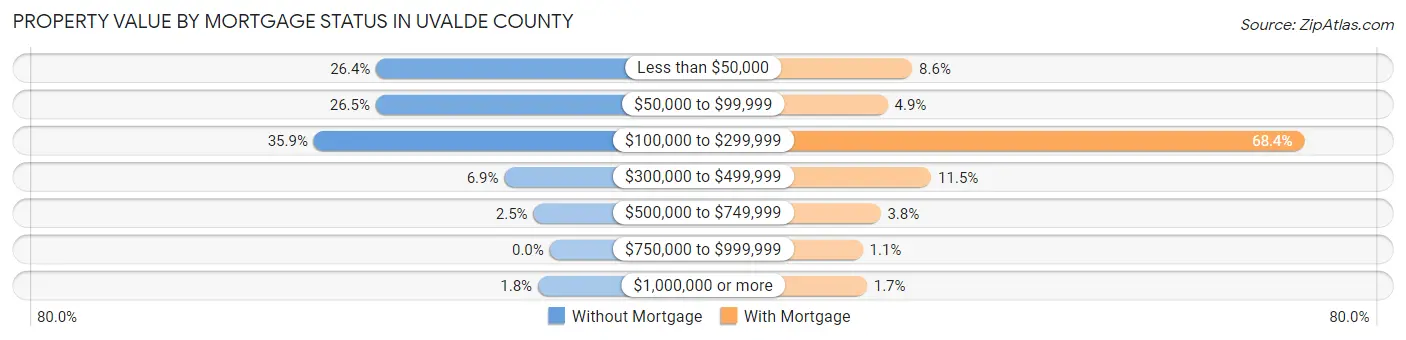
| Property Value | Without Mortgage | With Mortgage |
| Less than $50,000 | 1,026 (26.4%) | 161 (8.6%) |
| $50,000 to $99,999 | 1,029 (26.5%) | 91 (4.9%) |
| $100,000 to $299,999 | 1,396 (35.9%) | 1,276 (68.4%) |
| $300,000 to $499,999 | 268 (6.9%) | 215 (11.5%) |
| $500,000 to $749,999 | 96 (2.5%) | 71 (3.8%) |
| $750,000 to $999,999 | 0 (0.0%) | 20 (1.1%) |
| $1,000,000 or more | 69 (1.8%) | 32 (1.7%) |
| Total | 3,884 (100.0%) | 1,866 (100.0%) |
Household Income by Mortgage Status in Uvalde County
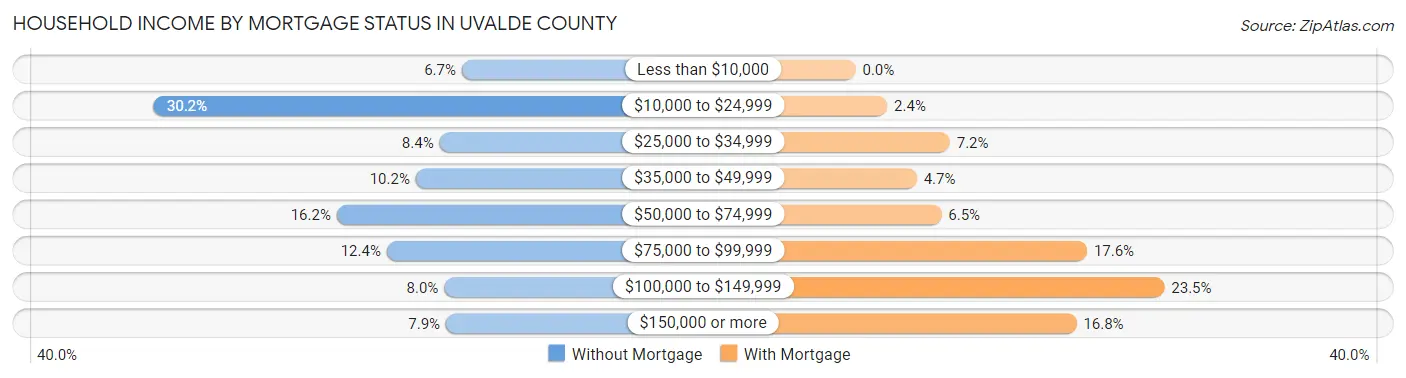
| Household Income | Without Mortgage | With Mortgage |
| Less than $10,000 | 260 (6.7%) | 0 (0.0%) |
| $10,000 to $24,999 | 1,171 (30.1%) | 45 (2.4%) |
| $25,000 to $34,999 | 326 (8.4%) | 134 (7.2%) |
| $35,000 to $49,999 | 396 (10.2%) | 87 (4.7%) |
| $50,000 to $74,999 | 630 (16.2%) | 122 (6.5%) |
| $75,000 to $99,999 | 482 (12.4%) | 329 (17.6%) |
| $100,000 to $149,999 | 312 (8.0%) | 439 (23.5%) |
| $150,000 or more | 307 (7.9%) | 314 (16.8%) |
| Total | 3,884 (100.0%) | 1,866 (100.0%) |
Property Value to Household Income Ratio in Uvalde County
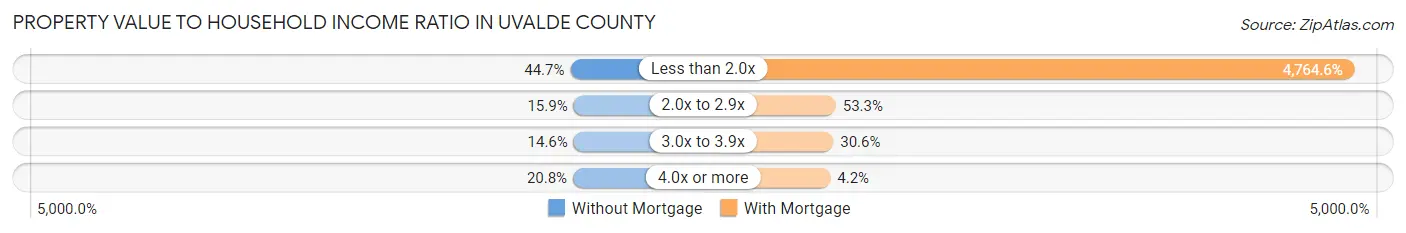
| Value-to-Income Ratio | Without Mortgage | With Mortgage |
| Less than 2.0x | 1,735 (44.7%) | 88,907 (4,764.6%) |
| 2.0x to 2.9x | 619 (15.9%) | 994 (53.3%) |
| 3.0x to 3.9x | 567 (14.6%) | 570 (30.5%) |
| 4.0x or more | 807 (20.8%) | 78 (4.2%) |
| Total | 3,884 (100.0%) | 1,866 (100.0%) |
Real Estate Taxes by Mortgage Status in Uvalde County
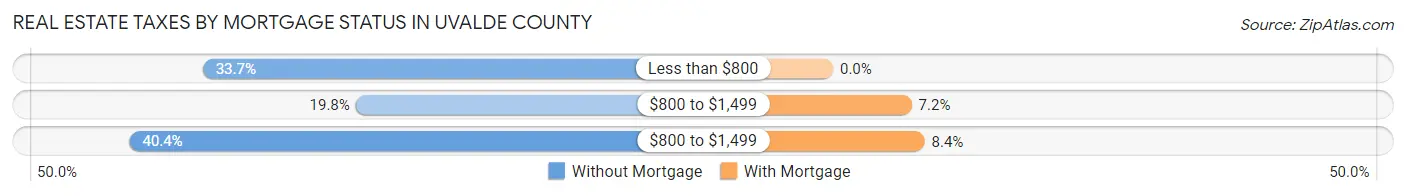
| Property Taxes | Without Mortgage | With Mortgage |
| Less than $800 | 1,310 (33.7%) | 0 (0.0%) |
| $800 to $1,499 | 768 (19.8%) | 134 (7.2%) |
| $800 to $1,499 | 1,570 (40.4%) | 156 (8.4%) |
| Total | 3,884 (100.0%) | 1,866 (100.0%) |
Health & Disability in Uvalde County
Health Insurance Coverage by Age in Uvalde County
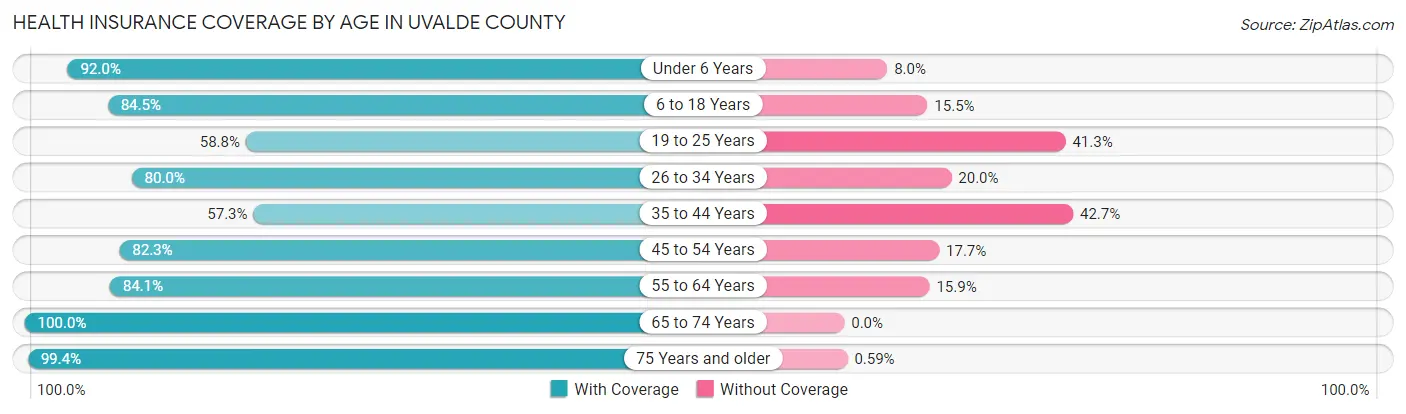
| Age Bracket | With Coverage | Without Coverage |
| Under 6 Years | 1,886 (92.0%) | 164 (8.0%) |
| 6 to 18 Years | 4,144 (84.5%) | 760 (15.5%) |
| 19 to 25 Years | 1,555 (58.8%) | 1,092 (41.2%) |
| 26 to 34 Years | 2,346 (80.0%) | 585 (20.0%) |
| 35 to 44 Years | 1,657 (57.3%) | 1,233 (42.7%) |
| 45 to 54 Years | 2,072 (82.3%) | 445 (17.7%) |
| 55 to 64 Years | 2,123 (84.1%) | 401 (15.9%) |
| 65 to 74 Years | 2,145 (100.0%) | 0 (0.0%) |
| 75 Years and older | 1,682 (99.4%) | 10 (0.6%) |
| Total | 19,610 (80.7%) | 4,690 (19.3%) |
Health Insurance Coverage by Citizenship Status in Uvalde County
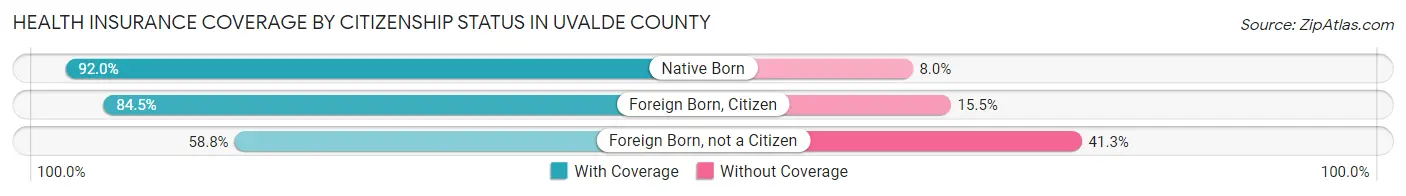
| Citizenship Status | With Coverage | Without Coverage |
| Native Born | 1,886 (92.0%) | 164 (8.0%) |
| Foreign Born, Citizen | 4,144 (84.5%) | 760 (15.5%) |
| Foreign Born, not a Citizen | 1,555 (58.8%) | 1,092 (41.2%) |
Health Insurance Coverage by Household Income in Uvalde County
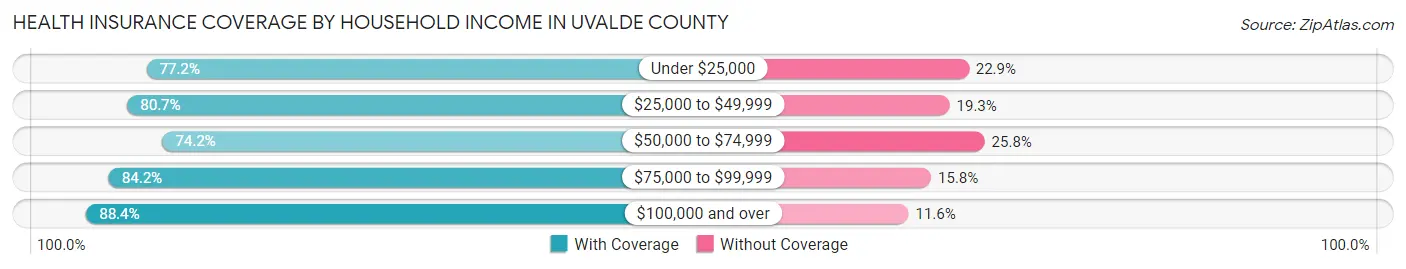
| Household Income | With Coverage | Without Coverage |
| Under $25,000 | 4,198 (77.1%) | 1,243 (22.9%) |
| $25,000 to $49,999 | 3,638 (80.7%) | 868 (19.3%) |
| $50,000 to $74,999 | 3,977 (74.2%) | 1,385 (25.8%) |
| $75,000 to $99,999 | 3,140 (84.2%) | 589 (15.8%) |
| $100,000 and over | 4,486 (88.4%) | 587 (11.6%) |
Public vs Private Health Insurance Coverage by Age in Uvalde County
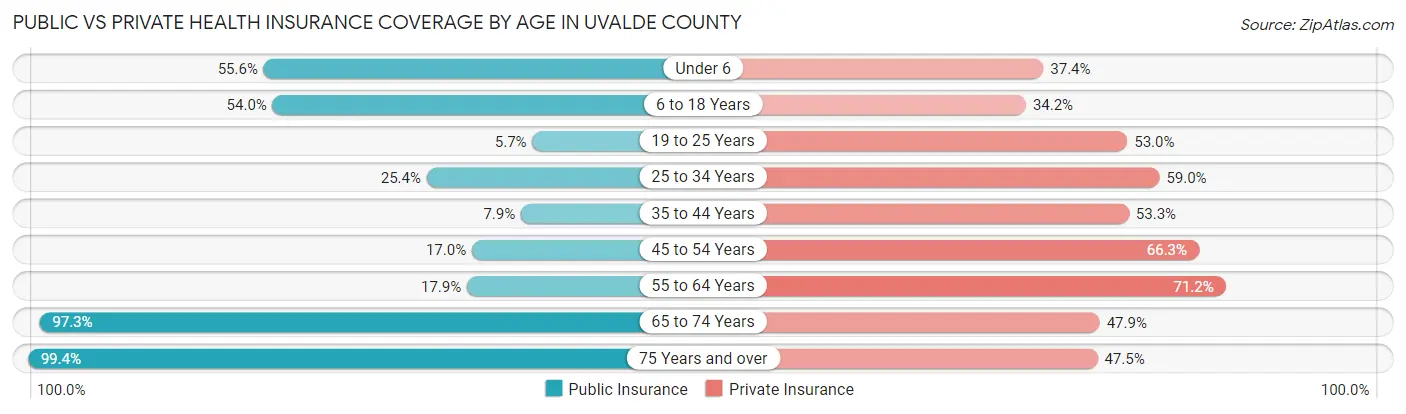
| Age Bracket | Public Insurance | Private Insurance |
| Under 6 | 1,140 (55.6%) | 767 (37.4%) |
| 6 to 18 Years | 2,646 (54.0%) | 1,676 (34.2%) |
| 19 to 25 Years | 152 (5.7%) | 1,403 (53.0%) |
| 25 to 34 Years | 743 (25.4%) | 1,728 (59.0%) |
| 35 to 44 Years | 227 (7.9%) | 1,540 (53.3%) |
| 45 to 54 Years | 427 (17.0%) | 1,668 (66.3%) |
| 55 to 64 Years | 451 (17.9%) | 1,798 (71.2%) |
| 65 to 74 Years | 2,086 (97.3%) | 1,027 (47.9%) |
| 75 Years and over | 1,682 (99.4%) | 803 (47.5%) |
| Total | 9,554 (39.3%) | 12,410 (51.1%) |
Disability Status by Sex by Age in Uvalde County
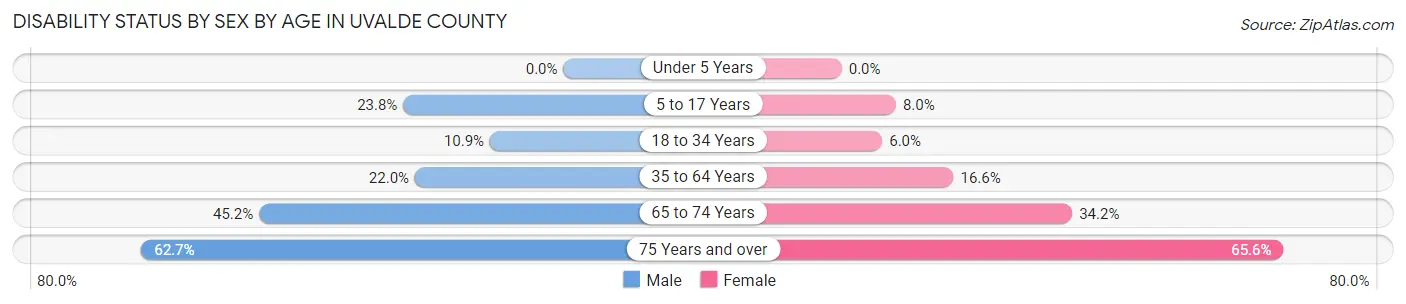
| Age Bracket | Male | Female |
| Under 5 Years | 0 (0.0%) | 0 (0.0%) |
| 5 to 17 Years | 625 (23.8%) | 169 (8.0%) |
| 18 to 34 Years | 330 (10.9%) | 182 (6.0%) |
| 35 to 64 Years | 834 (22.0%) | 688 (16.6%) |
| 65 to 74 Years | 445 (45.2%) | 397 (34.2%) |
| 75 Years and over | 460 (62.7%) | 628 (65.5%) |
Disability Class by Sex by Age in Uvalde County
Disability Class: Hearing Difficulty
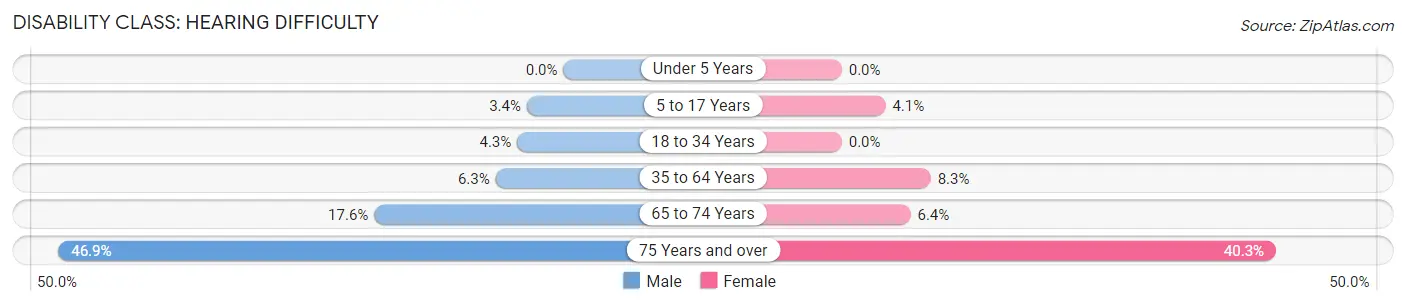
| Age Bracket | Male | Female |
| Under 5 Years | 0 (0.0%) | 0 (0.0%) |
| 5 to 17 Years | 89 (3.4%) | 85 (4.1%) |
| 18 to 34 Years | 130 (4.3%) | 0 (0.0%) |
| 35 to 64 Years | 238 (6.3%) | 342 (8.3%) |
| 65 to 74 Years | 173 (17.6%) | 74 (6.4%) |
| 75 Years and over | 344 (46.9%) | 386 (40.3%) |
Disability Class: Vision Difficulty
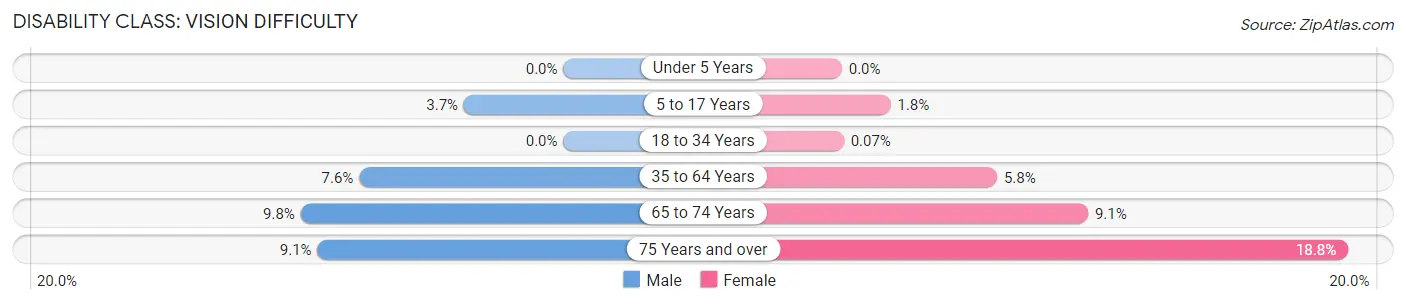
| Age Bracket | Male | Female |
| Under 5 Years | 0 (0.0%) | 0 (0.0%) |
| 5 to 17 Years | 97 (3.7%) | 38 (1.8%) |
| 18 to 34 Years | 0 (0.0%) | 2 (0.1%) |
| 35 to 64 Years | 287 (7.6%) | 239 (5.8%) |
| 65 to 74 Years | 96 (9.8%) | 106 (9.1%) |
| 75 Years and over | 67 (9.1%) | 180 (18.8%) |
Disability Class: Cognitive Difficulty
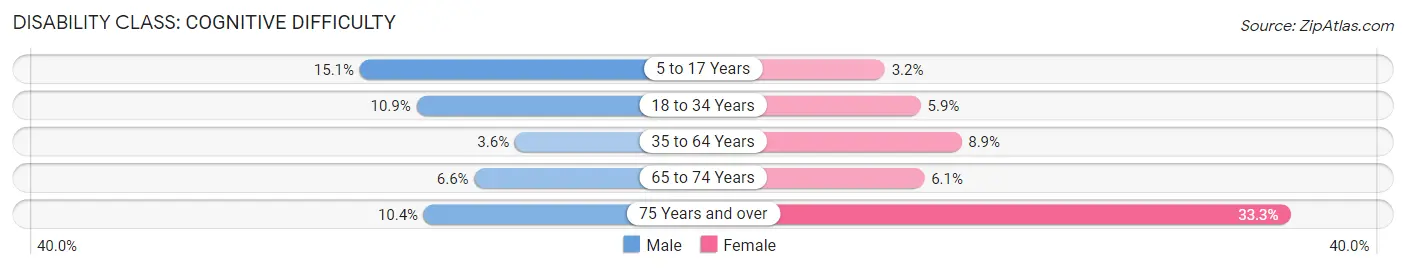
| Age Bracket | Male | Female |
| 5 to 17 Years | 397 (15.1%) | 67 (3.2%) |
| 18 to 34 Years | 330 (10.9%) | 177 (5.9%) |
| 35 to 64 Years | 136 (3.6%) | 368 (8.9%) |
| 65 to 74 Years | 65 (6.6%) | 71 (6.1%) |
| 75 Years and over | 76 (10.3%) | 319 (33.3%) |
Disability Class: Ambulatory Difficulty
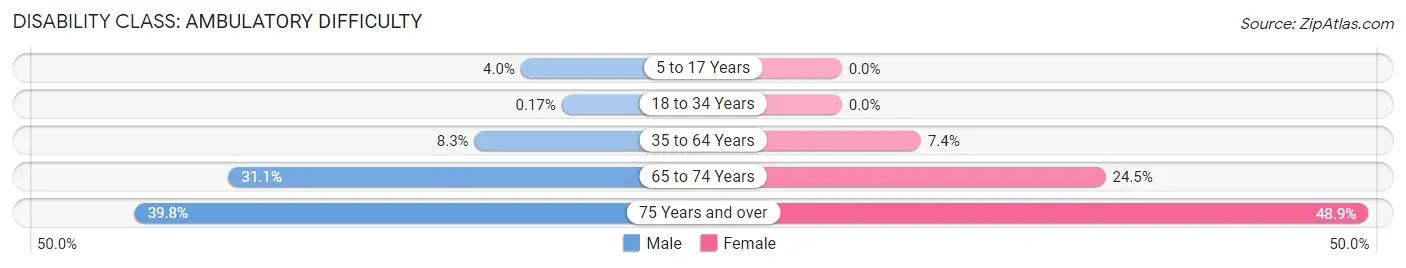
| Age Bracket | Male | Female |
| 5 to 17 Years | 104 (4.0%) | 0 (0.0%) |
| 18 to 34 Years | 5 (0.2%) | 0 (0.0%) |
| 35 to 64 Years | 312 (8.3%) | 305 (7.3%) |
| 65 to 74 Years | 306 (31.1%) | 284 (24.5%) |
| 75 Years and over | 292 (39.8%) | 468 (48.8%) |
Disability Class: Self-Care Difficulty
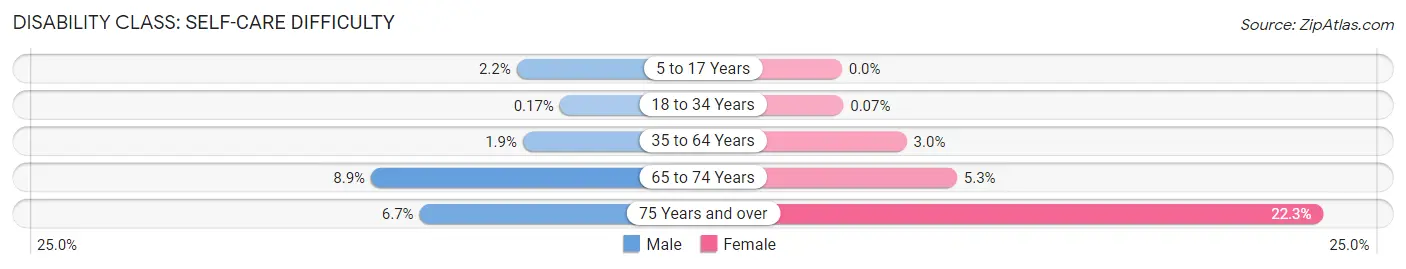
| Age Bracket | Male | Female |
| 5 to 17 Years | 57 (2.2%) | 0 (0.0%) |
| 18 to 34 Years | 5 (0.2%) | 2 (0.1%) |
| 35 to 64 Years | 71 (1.9%) | 125 (3.0%) |
| 65 to 74 Years | 88 (8.9%) | 62 (5.3%) |
| 75 Years and over | 49 (6.7%) | 214 (22.3%) |
Technology Access in Uvalde County
Computing Device Access in Uvalde County
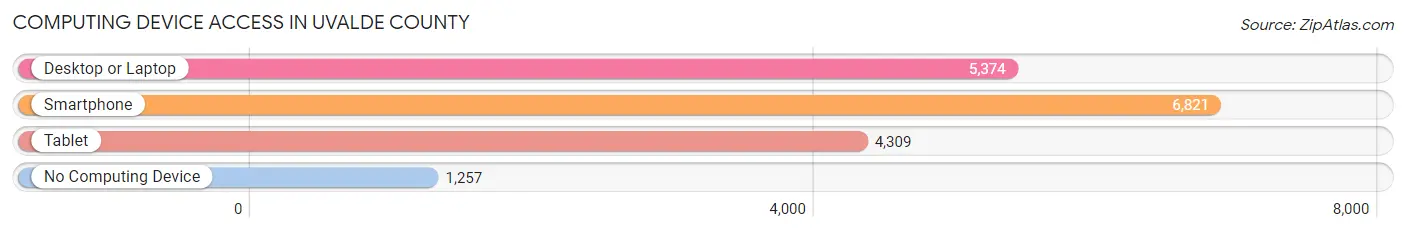
| Device Type | # Households | % Households |
| Desktop or Laptop | 5,374 | 63.8% |
| Smartphone | 6,821 | 81.0% |
| Tablet | 4,309 | 51.2% |
| No Computing Device | 1,257 | 14.9% |
| Total | 8,420 | 100.0% |
Internet Access in Uvalde County
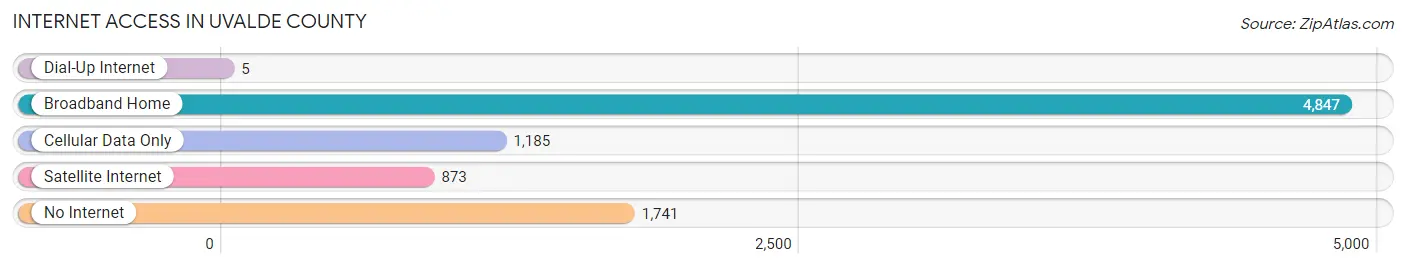
| Internet Type | # Households | % Households |
| Dial-Up Internet | 5 | 0.1% |
| Broadband Home | 4,847 | 57.6% |
| Cellular Data Only | 1,185 | 14.1% |
| Satellite Internet | 873 | 10.4% |
| No Internet | 1,741 | 20.7% |
| Total | 8,420 | 100.0% |
Uvalde County Summary
Uvalde County is located in the south-central region of Texas, and is part of the Edwards Plateau. It is bordered by Medina, Real, Zavala, and Frio counties. The county seat is Uvalde, and the county has a total area of 1,541 square miles. The population of Uvalde County was 26,405 in the year 2000, with a population density of 17 people per square mile.
Geography
Uvalde County is located in the Edwards Plateau, which is a region of rolling hills and limestone outcroppings. The county is mostly covered in grasslands, with some areas of wooded hills. The Nueces River runs through the county, and there are several creeks and streams that feed into it. The highest point in the county is the summit of Baldy Peak, which is 2,890 feet above sea level.
The climate of Uvalde County is generally mild, with hot summers and mild winters. The average annual temperature is 68 degrees Fahrenheit, and the average annual precipitation is 24 inches.
Economy
The economy of Uvalde County is largely based on agriculture and ranching. The county is home to several large ranches, and the main crops grown in the area are cotton, corn, wheat, and sorghum. The county also has a thriving oil and gas industry, and there are several oil and gas wells in the area.
The county is also home to several manufacturing companies, including a paper mill, a furniture factory, and a plastics plant. The county also has a large tourism industry, with several popular attractions, such as the Uvalde County Historical Museum and the Uvalde County Fairgrounds.
Demographics
The population of Uvalde County was 26,405 in the year 2000, with a population density of 17 people per square mile. The racial makeup of the county was 79.3% White, 0.7% African American, 0.4% Native American, 0.2% Asian, 0.1% Pacific Islander, 17.7% from other races, and 1.6% from two or more races. Hispanic or Latino of any race were 81.2% of the population.
The median income for a household in the county was $25,945, and the median income for a family was $30,945. The per capita income for the county was $13,845. About 22.2% of families and 25.7% of the population were below the poverty line, including 33.2% of those under age 18 and 20.2% of those age 65 or over.
Conclusion
Uvalde County is located in the south-central region of Texas, and is part of the Edwards Plateau. It is bordered by Medina, Real, Zavala, and Frio counties. The county has a total area of 1,541 square miles, and the population of Uvalde County was 26,405 in the year 2000. The economy of Uvalde County is largely based on agriculture and ranching, and the county also has a thriving oil and gas industry. The racial makeup of the county was 79.3% White, 0.7% African American, 0.4% Native American, 0.2% Asian, 0.1% Pacific Islander, 17.7% from other races, and 1.6% from two or more races. The median income for a household in the county was $25,945, and the median income for a family was $30,945.
Common Questions
What is Per Capita Income in Uvalde County?
Per Capita income in Uvalde County is $26,141.
What is the Median Family Income in Uvalde County?
Median Family Income in Uvalde County is $61,135.
What is the Median Household income in Uvalde County?
Median Household Income in Uvalde County is $55,000.
What is Income or Wage Gap in Uvalde County?
Income or Wage Gap in Uvalde County is 42.8%.
Women in Uvalde County earn 57.2 cents for every dollar earned by a man.
What is Family Income Deficit in Uvalde County?
Family Income Deficit in Uvalde County is $10,246.
Families that are below poverty line in Uvalde County earn $10,246 less on average than the poverty threshold level.
What is Inequality or Gini Index in Uvalde County?
Inequality or Gini Index in Uvalde County is 0.50.
What is the Total Population of Uvalde County?
Total Population of Uvalde County is 24,833.
What is the Total Male Population of Uvalde County?
Total Male Population of Uvalde County is 12,409.
What is the Total Female Population of Uvalde County?
Total Female Population of Uvalde County is 12,424.
What is the Ratio of Males per 100 Females in Uvalde County?
There are 99.88 Males per 100 Females in Uvalde County.
What is the Ratio of Females per 100 Males in Uvalde County?
There are 100.12 Females per 100 Males in Uvalde County.
What is the Median Population Age in Uvalde County?
Median Population Age in Uvalde County is 34.2 Years.
What is the Average Family Size in Uvalde County
Average Family Size in Uvalde County is 3.5 People.
What is the Average Household Size in Uvalde County
Average Household Size in Uvalde County is 2.9 People.
How Large is the Labor Force in Uvalde County?
There are 10,255 People in the Labor Forcein in Uvalde County.
What is the Percentage of People in the Labor Force in Uvalde County?
53.8% of People are in the Labor Force in Uvalde County.
What is the Unemployment Rate in Uvalde County?
Unemployment Rate in Uvalde County is 3.2%.