Tyler County, TX Map & Demographics
Tyler County Map
Tyler County Overview
$29,594
PER CAPITA INCOME
$61,651
AVG FAMILY INCOME
$50,898
AVG HOUSEHOLD INCOME
47.1%
WAGE / INCOME GAP [ % ]
52.9¢/ $1
WAGE / INCOME GAP [ $ ]
$11,358
FAMILY INCOME DEFICIT
0.52
INEQUALITY / GINI INDEX
19,962
TOTAL POPULATION
10,828
MALE POPULATION
9,134
FEMALE POPULATION
118.55
MALES / 100 FEMALES
84.36
FEMALES / 100 MALES
42.6
MEDIAN AGE
3.2
AVG FAMILY SIZE
2.6
AVG HOUSEHOLD SIZE
7,237
LABOR FORCE [ PEOPLE ]
43.4%
PERCENT IN LABOR FORCE
12.6%
UNEMPLOYMENT RATE
Income in Tyler County
Income Overview in Tyler County
Per Capita Income in Tyler County is $29,594, while median incomes of families and households are $61,651 and $50,898 respectively.
| Characteristic | Number | Measure |
| Per Capita Income | 19,962 | $29,594 |
| Median Family Income | 4,640 | $61,651 |
| Mean Family Income | 4,640 | $96,520 |
| Median Household Income | 6,811 | $50,898 |
| Mean Household Income | 6,811 | $80,667 |
| Income Deficit | 4,640 | $11,358 |
| Wage / Income Gap (%) | 19,962 | 47.07% |
| Wage / Income Gap ($) | 19,962 | 52.93¢ per $1 |
| Gini / Inequality Index | 19,962 | 0.52 |
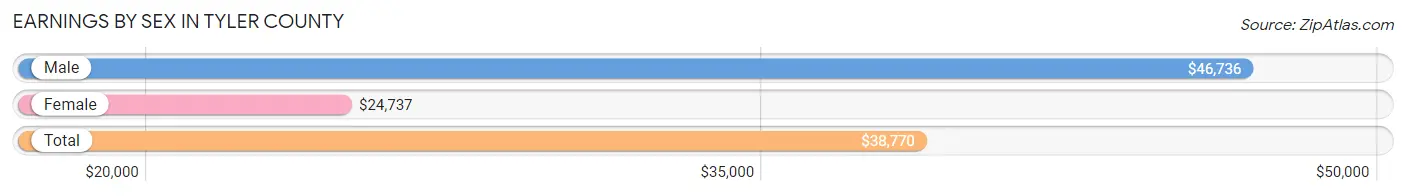
Earnings by Sex in Tyler County
Average Earnings in Tyler County are $38,770, $46,736 for men and $24,737 for women, a difference of 47.1%.
| Sex | Number | Average Earnings |
| Male | 3,865 (54.2%) | $46,736 |
| Female | 3,261 (45.8%) | $24,737 |
| Total | 7,126 (100.0%) | $38,770 |
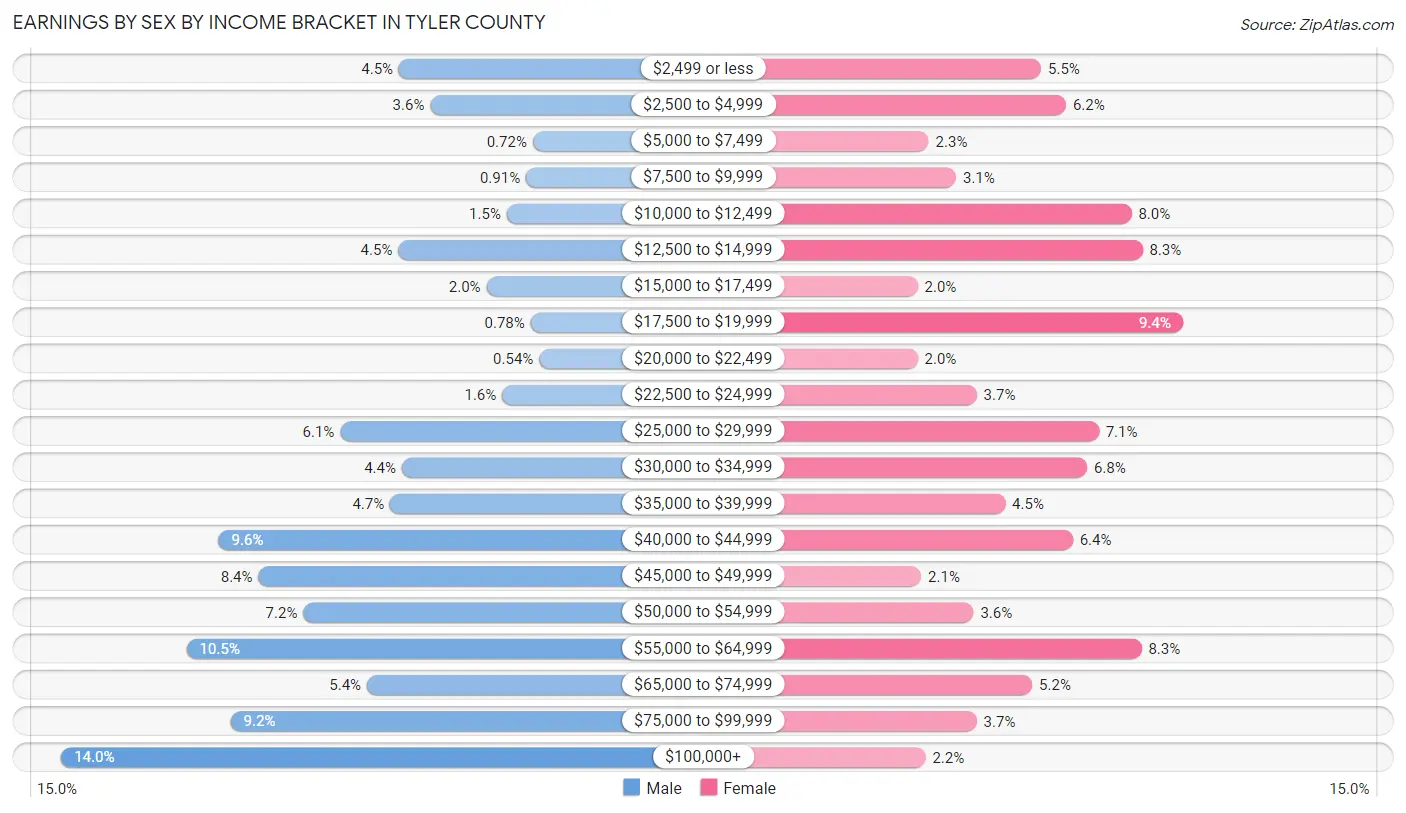
Earnings by Sex by Income Bracket in Tyler County
The most common earnings brackets in Tyler County are $100,000+ for men (540 | 14.0%) and $17,500 to $19,999 for women (308 | 9.4%).
| Income | Male | Female |
| $2,499 or less | 173 (4.5%) | 178 (5.5%) |
| $2,500 to $4,999 | 139 (3.6%) | 201 (6.2%) |
| $5,000 to $7,499 | 28 (0.7%) | 75 (2.3%) |
| $7,500 to $9,999 | 35 (0.9%) | 100 (3.1%) |
| $10,000 to $12,499 | 56 (1.5%) | 261 (8.0%) |
| $12,500 to $14,999 | 174 (4.5%) | 271 (8.3%) |
| $15,000 to $17,499 | 78 (2.0%) | 65 (2.0%) |
| $17,500 to $19,999 | 30 (0.8%) | 308 (9.4%) |
| $20,000 to $22,499 | 21 (0.5%) | 65 (2.0%) |
| $22,500 to $24,999 | 61 (1.6%) | 119 (3.6%) |
| $25,000 to $29,999 | 237 (6.1%) | 231 (7.1%) |
| $30,000 to $34,999 | 170 (4.4%) | 220 (6.8%) |
| $35,000 to $39,999 | 183 (4.7%) | 145 (4.4%) |
| $40,000 to $44,999 | 369 (9.6%) | 207 (6.4%) |
| $45,000 to $49,999 | 326 (8.4%) | 68 (2.1%) |
| $50,000 to $54,999 | 277 (7.2%) | 116 (3.6%) |
| $55,000 to $64,999 | 404 (10.4%) | 270 (8.3%) |
| $65,000 to $74,999 | 208 (5.4%) | 170 (5.2%) |
| $75,000 to $99,999 | 356 (9.2%) | 119 (3.6%) |
| $100,000+ | 540 (14.0%) | 72 (2.2%) |
| Total | 3,865 (100.0%) | 3,261 (100.0%) |
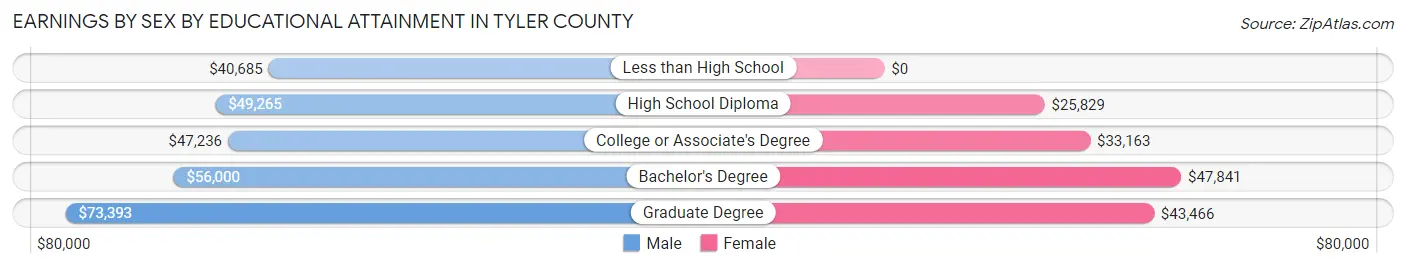
Earnings by Sex by Educational Attainment in Tyler County
Average earnings in Tyler County are $48,460 for men and $31,479 for women, a difference of 35.0%. Men with an educational attainment of graduate degree enjoy the highest average annual earnings of $73,393, while those with less than high school education earn the least with $40,685. Women with an educational attainment of bachelor's degree earn the most with the average annual earnings of $47,841, while those with high school diploma education have the smallest earnings of $25,829.
| Educational Attainment | Male Income | Female Income |
| Less than High School | $40,685 | $0 |
| High School Diploma | $49,265 | $25,829 |
| College or Associate's Degree | $47,236 | $33,163 |
| Bachelor's Degree | $56,000 | $47,841 |
| Graduate Degree | $73,393 | $43,466 |
| Total | $48,460 | $31,479 |
Family Income in Tyler County
Family Income Brackets in Tyler County
According to the Tyler County family income data, there are 965 families falling into the $100,000 to $149,999 income range, which is the most common income bracket and makes up 20.8% of all families. Conversely, the $10,000 to $14,999 income bracket is the least frequent group with only 172 families (3.7%) belonging to this category.
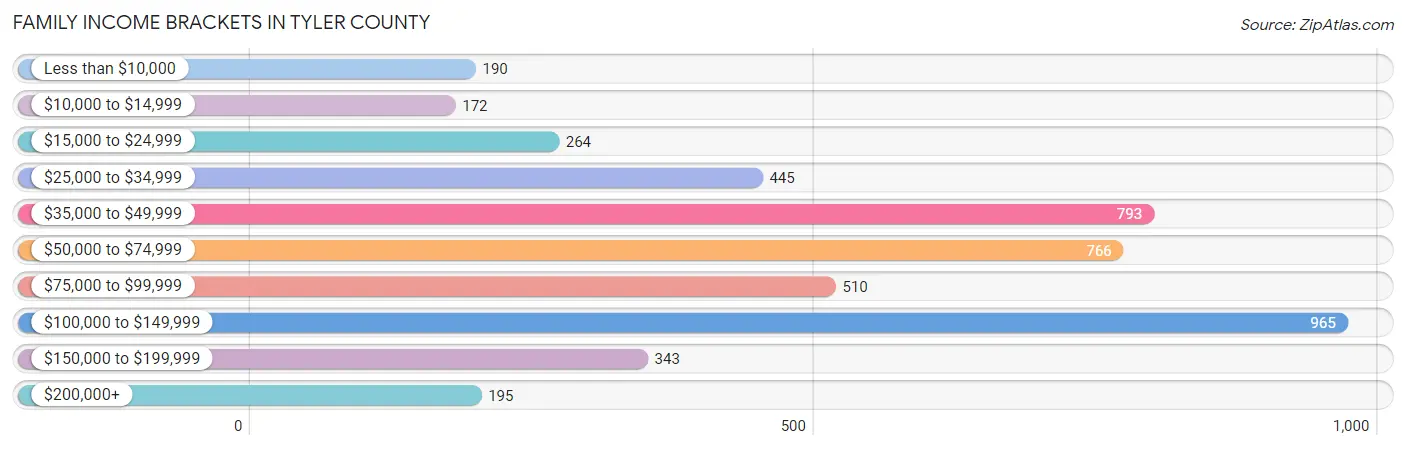
| Income Bracket | # Families | % Families |
| Less than $10,000 | 190 | 4.1% |
| $10,000 to $14,999 | 172 | 3.7% |
| $15,000 to $24,999 | 264 | 5.7% |
| $25,000 to $34,999 | 445 | 9.6% |
| $35,000 to $49,999 | 793 | 17.1% |
| $50,000 to $74,999 | 766 | 16.5% |
| $75,000 to $99,999 | 510 | 11.0% |
| $100,000 to $149,999 | 965 | 20.8% |
| $150,000 to $199,999 | 343 | 7.4% |
| $200,000+ | 195 | 4.2% |
Family Income by Famaliy Size in Tyler County
4-person families (450 | 9.7%) account for the highest median family income in Tyler County with $89,700 per family, while 2-person families (2,297 | 49.5%) have the highest median income of $26,108 per family member.
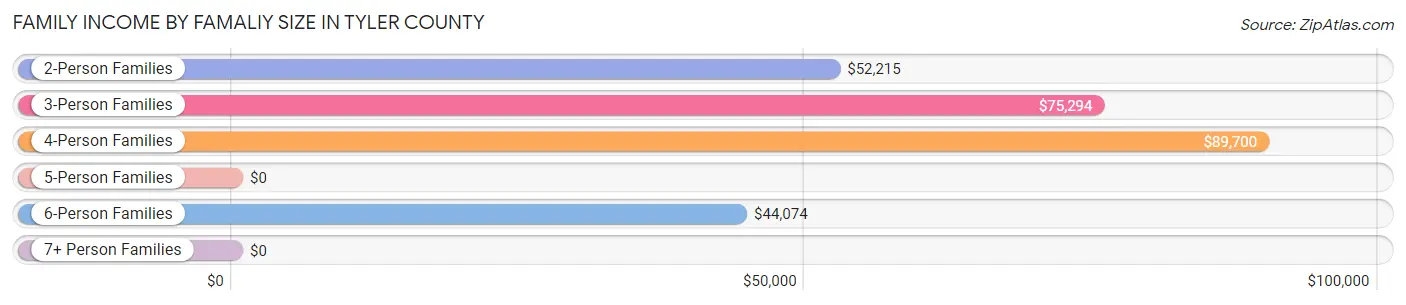
| Income Bracket | # Families | Median Income |
| 2-Person Families | 2,297 (49.5%) | $52,215 |
| 3-Person Families | 1,314 (28.3%) | $75,294 |
| 4-Person Families | 450 (9.7%) | $89,700 |
| 5-Person Families | 307 (6.6%) | $0 |
| 6-Person Families | 186 (4.0%) | $44,074 |
| 7+ Person Families | 86 (1.8%) | $0 |
| Total | 4,640 (100.0%) | $61,651 |
Family Income by Number of Earners in Tyler County
The median family income in Tyler County is $61,651, with families comprising 3+ earners (200) having the highest median family income of $133,125, while families with no earners (1,391) have the lowest median family income of $37,022, accounting for 4.3% and 30.0% of families, respectively.
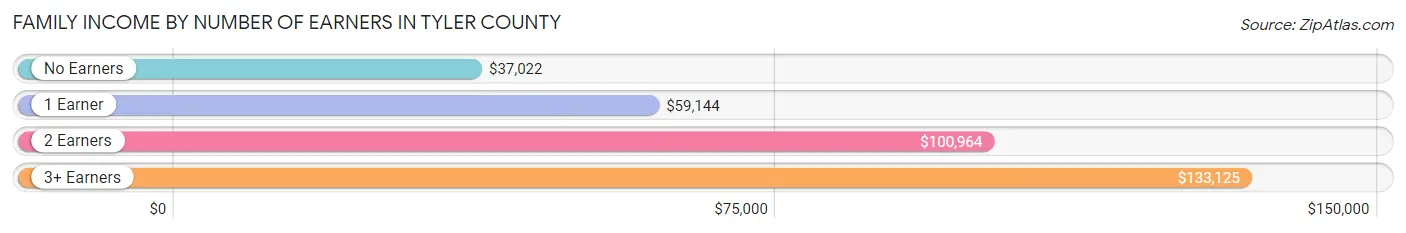
| Number of Earners | # Families | Median Income |
| No Earners | 1,391 (30.0%) | $37,022 |
| 1 Earner | 1,713 (36.9%) | $59,144 |
| 2 Earners | 1,336 (28.8%) | $100,964 |
| 3+ Earners | 200 (4.3%) | $133,125 |
| Total | 4,640 (100.0%) | $61,651 |
Household Income in Tyler County
Household Income Brackets in Tyler County
With 1,090 households falling in the category, the $50,000 to $74,999 income range is the most frequent in Tyler County, accounting for 16.0% of all households. In contrast, only 204 households (3.0%) fall into the $200,000+ income bracket, making it the least populous group.
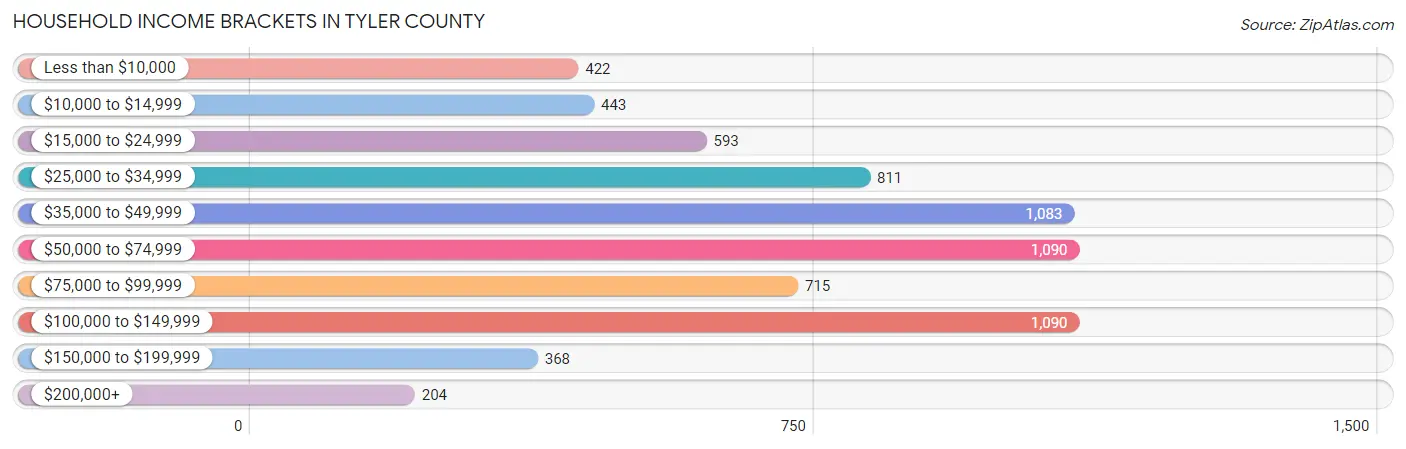
| Income Bracket | # Households | % Households |
| Less than $10,000 | 422 | 6.2% |
| $10,000 to $14,999 | 443 | 6.5% |
| $15,000 to $24,999 | 593 | 8.7% |
| $25,000 to $34,999 | 811 | 11.9% |
| $35,000 to $49,999 | 1,083 | 15.9% |
| $50,000 to $74,999 | 1,090 | 16.0% |
| $75,000 to $99,999 | 715 | 10.5% |
| $100,000 to $149,999 | 1,090 | 16.0% |
| $150,000 to $199,999 | 368 | 5.4% |
| $200,000+ | 204 | 3.0% |
Household Income by Householder Age in Tyler County
The median household income in Tyler County is $50,898, with the highest median household income of $71,881 found in the 45 to 64 years age bracket for the primary householder. A total of 2,572 households (37.8%) fall into this category. Meanwhile, the 15 to 24 years age bracket for the primary householder has the lowest median household income of $32,368, with 130 households (1.9%) in this group.
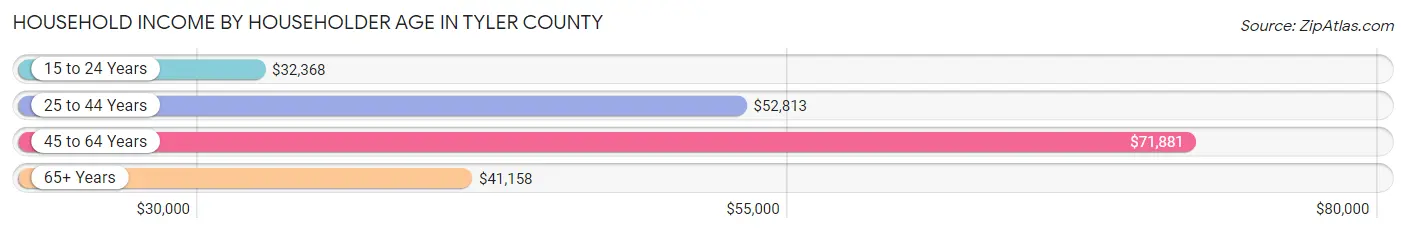
| Income Bracket | # Households | Median Income |
| 15 to 24 Years | 130 (1.9%) | $32,368 |
| 25 to 44 Years | 1,687 (24.8%) | $52,813 |
| 45 to 64 Years | 2,572 (37.8%) | $71,881 |
| 65+ Years | 2,422 (35.6%) | $41,158 |
| Total | 6,811 (100.0%) | $50,898 |
Poverty in Tyler County
Income Below Poverty by Sex and Age in Tyler County
With 16.1% poverty level for males and 19.8% for females among the residents of Tyler County, 6 to 11 year old males and 6 to 11 year old females are the most vulnerable to poverty, with 264 males (35.5%) and 395 females (51.4%) in their respective age groups living below the poverty level.
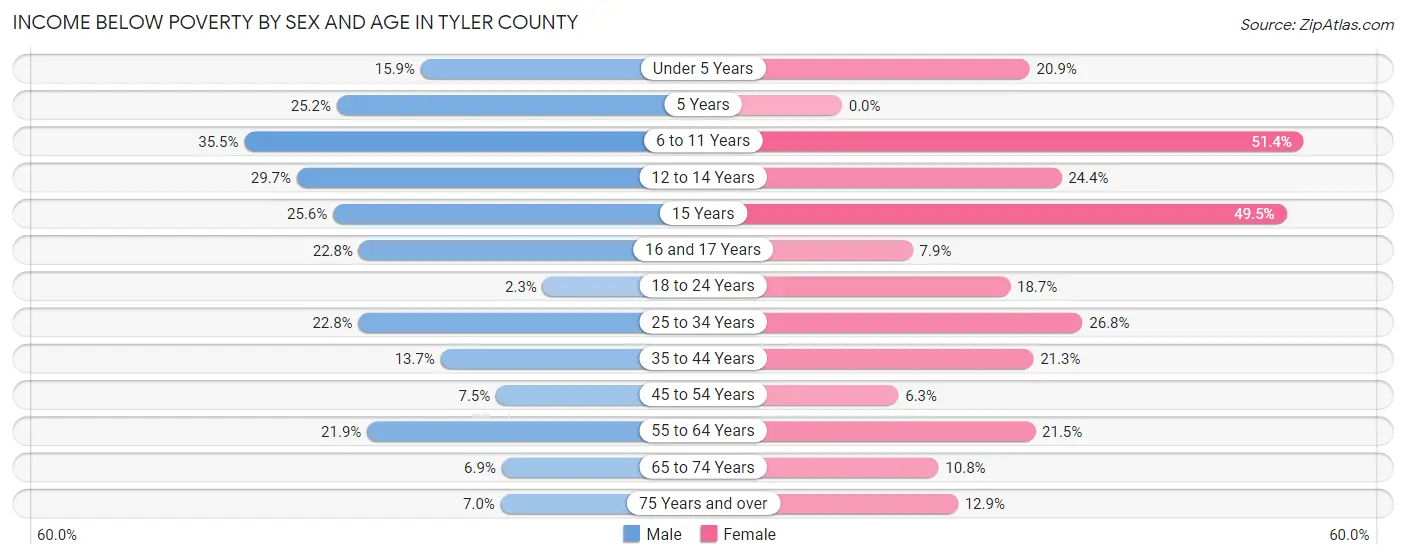
| Age Bracket | Male | Female |
| Under 5 Years | 63 (15.9%) | 73 (20.9%) |
| 5 Years | 27 (25.2%) | 0 (0.0%) |
| 6 to 11 Years | 264 (35.5%) | 395 (51.4%) |
| 12 to 14 Years | 103 (29.7%) | 66 (24.4%) |
| 15 Years | 20 (25.6%) | 51 (49.5%) |
| 16 and 17 Years | 59 (22.8%) | 21 (7.9%) |
| 18 to 24 Years | 14 (2.3%) | 134 (18.7%) |
| 25 to 34 Years | 230 (22.8%) | 210 (26.8%) |
| 35 to 44 Years | 119 (13.7%) | 203 (21.3%) |
| 45 to 54 Years | 74 (7.5%) | 76 (6.3%) |
| 55 to 64 Years | 300 (21.8%) | 285 (21.5%) |
| 65 to 74 Years | 79 (6.9%) | 132 (10.8%) |
| 75 Years and over | 59 (7.0%) | 127 (12.9%) |
| Total | 1,411 (16.1%) | 1,773 (19.8%) |
Income Above Poverty by Sex and Age in Tyler County
According to the poverty statistics in Tyler County, males aged 18 to 24 years and females aged 5 years are the age groups that are most secure financially, with 97.7% of males and 100.0% of females in these age groups living above the poverty line.
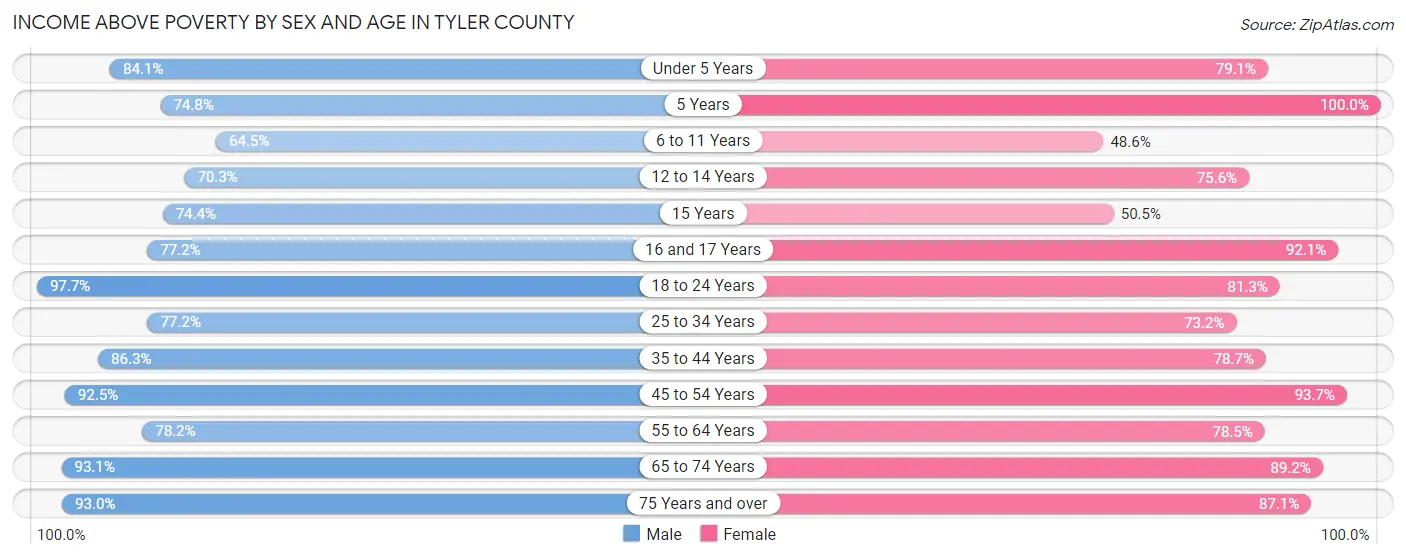
| Age Bracket | Male | Female |
| Under 5 Years | 334 (84.1%) | 276 (79.1%) |
| 5 Years | 80 (74.8%) | 9 (100.0%) |
| 6 to 11 Years | 479 (64.5%) | 373 (48.6%) |
| 12 to 14 Years | 244 (70.3%) | 204 (75.6%) |
| 15 Years | 58 (74.4%) | 52 (50.5%) |
| 16 and 17 Years | 200 (77.2%) | 245 (92.1%) |
| 18 to 24 Years | 595 (97.7%) | 581 (81.3%) |
| 25 to 34 Years | 778 (77.2%) | 574 (73.2%) |
| 35 to 44 Years | 752 (86.3%) | 749 (78.7%) |
| 45 to 54 Years | 914 (92.5%) | 1,133 (93.7%) |
| 55 to 64 Years | 1,073 (78.1%) | 1,039 (78.5%) |
| 65 to 74 Years | 1,073 (93.1%) | 1,095 (89.2%) |
| 75 Years and over | 786 (93.0%) | 857 (87.1%) |
| Total | 7,366 (83.9%) | 7,187 (80.2%) |
Income Below Poverty Among Married-Couple Families in Tyler County
The poverty statistics for married-couple families in Tyler County show that 6.9% or 245 of the total 3,561 families live below the poverty line. Families with 3 or 4 children have the highest poverty rate of 29.4%, comprising of 96 families. On the other hand, families with 5 or more children have the lowest poverty rate of 0.0%, which includes 0 families.
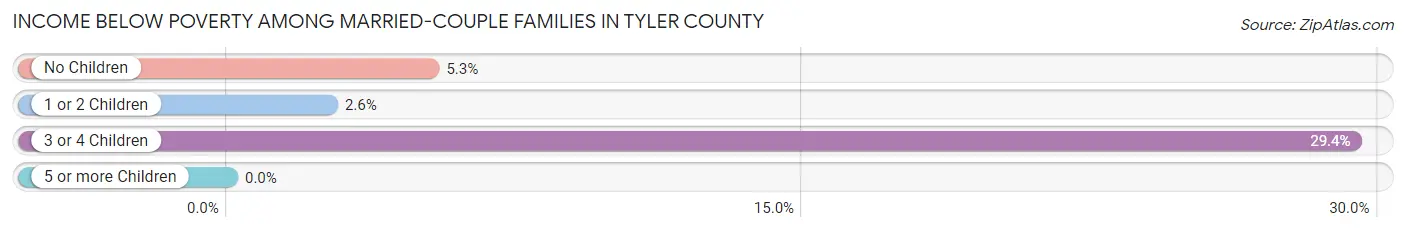
| Children | Above Poverty | Below Poverty |
| No Children | 2,323 (94.7%) | 129 (5.3%) |
| 1 or 2 Children | 746 (97.4%) | 20 (2.6%) |
| 3 or 4 Children | 231 (70.6%) | 96 (29.4%) |
| 5 or more Children | 16 (100.0%) | 0 (0.0%) |
| Total | 3,316 (93.1%) | 245 (6.9%) |
Income Below Poverty Among Single-Parent Households in Tyler County
According to the poverty data in Tyler County, 38.1% or 146 single-father households and 24.6% or 171 single-mother households are living below the poverty line. Among single-father households, those with 1 or 2 children have the highest poverty rate, with 125 households (61.6%) experiencing poverty. Likewise, among single-mother households, those with 3 or 4 children have the highest poverty rate, with 46 households (55.4%) falling below the poverty line.
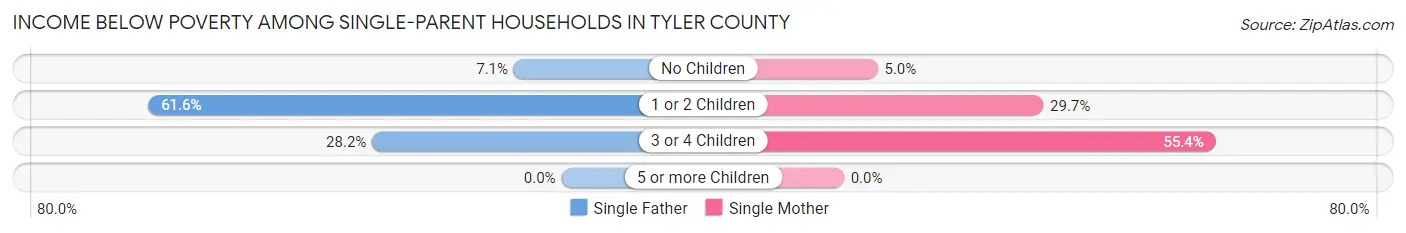
| Children | Single Father | Single Mother |
| No Children | 10 (7.1%) | 10 (5.0%) |
| 1 or 2 Children | 125 (61.6%) | 115 (29.7%) |
| 3 or 4 Children | 11 (28.2%) | 46 (55.4%) |
| 5 or more Children | 0 (0.0%) | 0 (0.0%) |
| Total | 146 (38.1%) | 171 (24.6%) |
Income Below Poverty Among Married-Couple vs Single-Parent Households in Tyler County
The poverty data for Tyler County shows that 245 of the married-couple family households (6.9%) and 317 of the single-parent households (29.4%) are living below the poverty level. Within the married-couple family households, those with 3 or 4 children have the highest poverty rate, with 96 households (29.4%) falling below the poverty line. Among the single-parent households, those with 3 or 4 children have the highest poverty rate, with 57 household (46.7%) living below poverty.
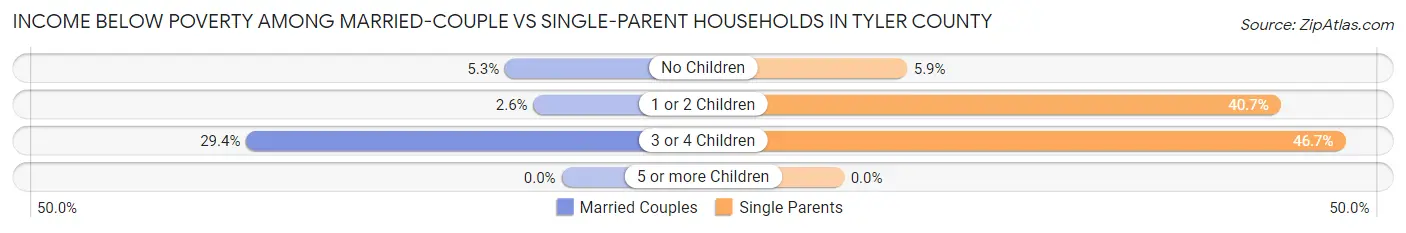
| Children | Married-Couple Families | Single-Parent Households |
| No Children | 129 (5.3%) | 20 (5.9%) |
| 1 or 2 Children | 20 (2.6%) | 240 (40.7%) |
| 3 or 4 Children | 96 (29.4%) | 57 (46.7%) |
| 5 or more Children | 0 (0.0%) | 0 (0.0%) |
| Total | 245 (6.9%) | 317 (29.4%) |
Race in Tyler County
The most populous races in Tyler County are White / Caucasian (16,314 | 81.7%), Black / African American (2,107 | 10.6%), and Hispanic or Latino (1,430 | 7.2%).
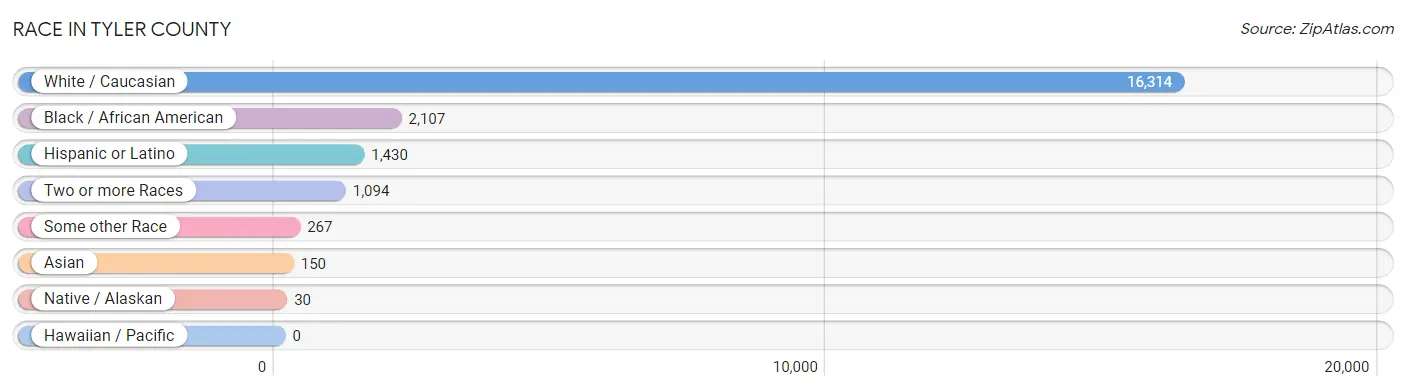
| Race | # Population | % Population |
| Asian | 150 | 0.7% |
| Black / African American | 2,107 | 10.6% |
| Hawaiian / Pacific | 0 | 0.0% |
| Hispanic or Latino | 1,430 | 7.2% |
| Native / Alaskan | 30 | 0.2% |
| White / Caucasian | 16,314 | 81.7% |
| Two or more Races | 1,094 | 5.5% |
| Some other Race | 267 | 1.3% |
| Total | 19,962 | 100.0% |
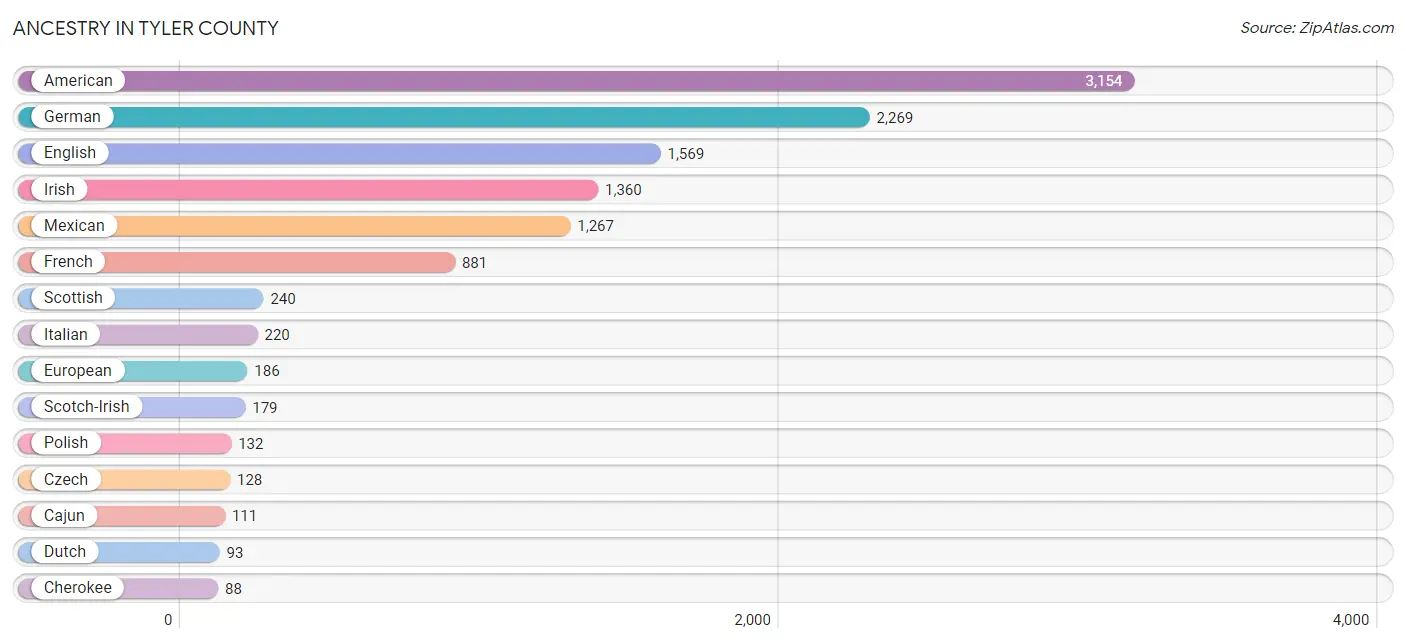
Ancestry in Tyler County
The most populous ancestries reported in Tyler County are American (3,154 | 15.8%), German (2,269 | 11.4%), English (1,569 | 7.9%), Irish (1,360 | 6.8%), and Mexican (1,267 | 6.4%), together accounting for 48.2% of all Tyler County residents.
| Ancestry | # Population | % Population |
| African | 13 | 0.1% |
| American | 3,154 | 15.8% |
| Apache | 12 | 0.1% |
| Arab | 30 | 0.2% |
| Belgian | 8 | 0.0% |
| Bhutanese | 43 | 0.2% |
| Brazilian | 15 | 0.1% |
| Burmese | 10 | 0.1% |
| Cajun | 111 | 0.6% |
| Canadian | 10 | 0.1% |
| Central American | 48 | 0.2% |
| Cherokee | 88 | 0.4% |
| Chickasaw | 8 | 0.0% |
| Chippewa | 1 | 0.0% |
| Choctaw | 30 | 0.2% |
| Comanche | 3 | 0.0% |
| Cuban | 7 | 0.0% |
| Czech | 128 | 0.6% |
| Czechoslovakian | 7 | 0.0% |
| Danish | 13 | 0.1% |
| Dutch | 93 | 0.5% |
| Eastern European | 28 | 0.1% |
| Ecuadorian | 1 | 0.0% |
| Egyptian | 10 | 0.1% |
| English | 1,569 | 7.9% |
| European | 186 | 0.9% |
| Finnish | 1 | 0.0% |
| French | 881 | 4.4% |
| French Canadian | 51 | 0.3% |
| German | 2,269 | 11.4% |
| Honduran | 10 | 0.1% |
| Hungarian | 32 | 0.2% |
| Indian (Asian) | 8 | 0.0% |
| Iranian | 26 | 0.1% |
| Irish | 1,360 | 6.8% |
| Italian | 220 | 1.1% |
| Jamaican | 15 | 0.1% |
| Korean | 71 | 0.4% |
| Lebanese | 20 | 0.1% |
| Lumbee | 28 | 0.1% |
| Mexican | 1,267 | 6.4% |
| Mexican American Indian | 12 | 0.1% |
| Nicaraguan | 7 | 0.0% |
| Norwegian | 32 | 0.2% |
| Polish | 132 | 0.7% |
| Portuguese | 7 | 0.0% |
| Puerto Rican | 34 | 0.2% |
| Russian | 11 | 0.1% |
| Salvadoran | 31 | 0.2% |
| Scandinavian | 15 | 0.1% |
| Scotch-Irish | 179 | 0.9% |
| Scottish | 240 | 1.2% |
| South American | 1 | 0.0% |
| Spaniard | 43 | 0.2% |
| Spanish | 22 | 0.1% |
| Sri Lankan | 54 | 0.3% |
| Subsaharan African | 13 | 0.1% |
| Swedish | 37 | 0.2% |
| Thai | 16 | 0.1% |
| Welsh | 83 | 0.4% | View All 60 Rows |
Immigrants in Tyler County
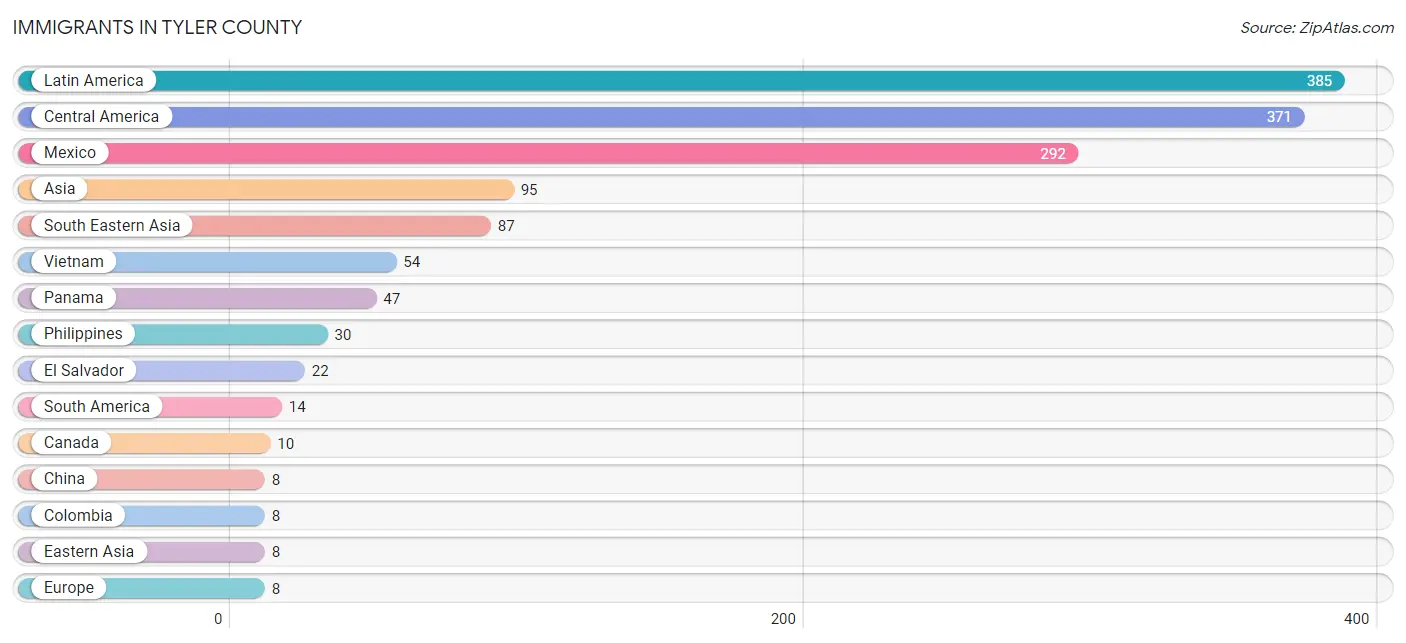
The most numerous immigrant groups reported in Tyler County came from Latin America (385 | 1.9%), Central America (371 | 1.9%), Mexico (292 | 1.5%), Asia (95 | 0.5%), and South Eastern Asia (87 | 0.4%), together accounting for 6.2% of all Tyler County residents.
| Immigration Origin | # Population | % Population |
| Asia | 95 | 0.5% |
| Australia | 2 | 0.0% |
| Belgium | 3 | 0.0% |
| Brazil | 6 | 0.0% |
| Canada | 10 | 0.1% |
| Central America | 371 | 1.9% |
| China | 8 | 0.0% |
| Colombia | 8 | 0.0% |
| Eastern Asia | 8 | 0.0% |
| El Salvador | 22 | 0.1% |
| England | 3 | 0.0% |
| Europe | 8 | 0.0% |
| Germany | 2 | 0.0% |
| Honduras | 3 | 0.0% |
| Latin America | 385 | 1.9% |
| Mexico | 292 | 1.5% |
| Nicaragua | 7 | 0.0% |
| Northern Europe | 3 | 0.0% |
| Oceania | 2 | 0.0% |
| Panama | 47 | 0.2% |
| Philippines | 30 | 0.2% |
| Singapore | 3 | 0.0% |
| South America | 14 | 0.1% |
| South Eastern Asia | 87 | 0.4% |
| Vietnam | 54 | 0.3% |
| Western Europe | 5 | 0.0% | View All 26 Rows |
Sex and Age in Tyler County
Sex and Age in Tyler County
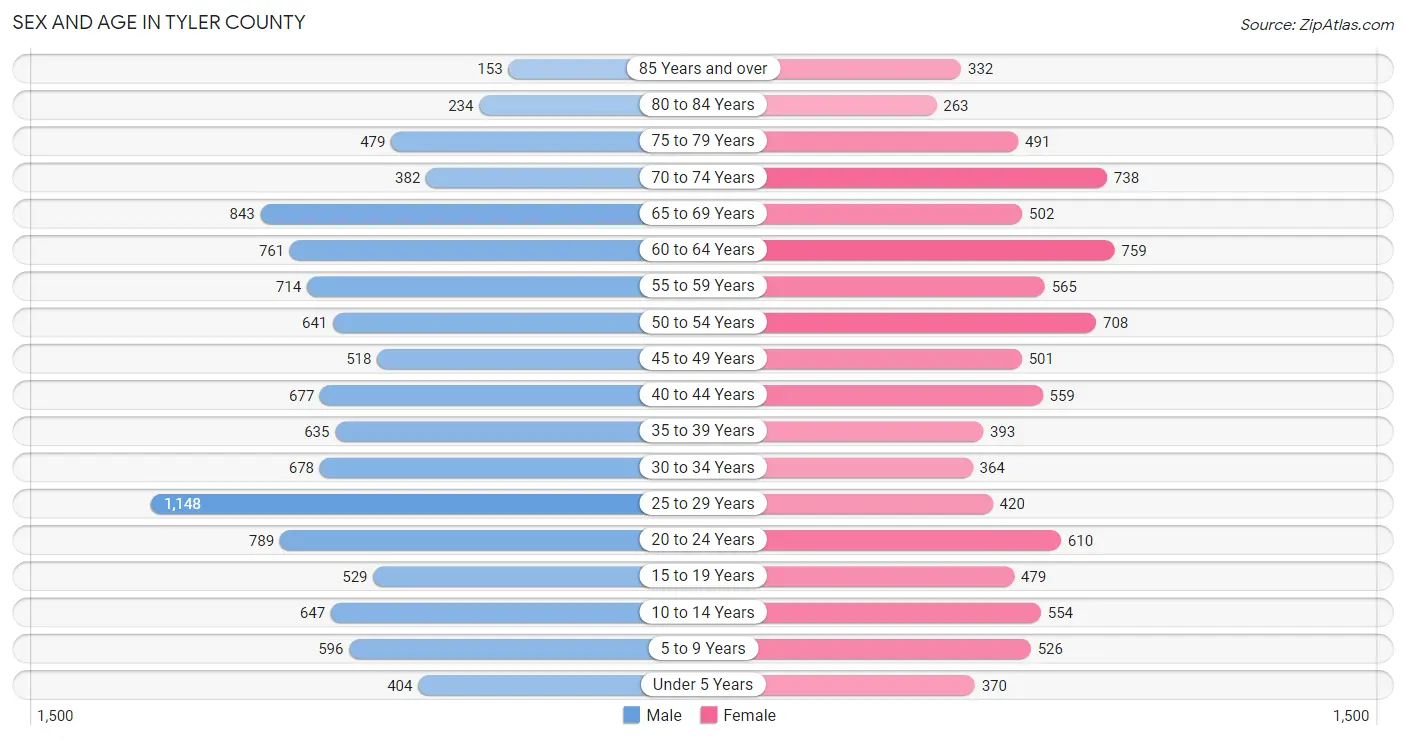
The most populous age groups in Tyler County are 25 to 29 Years (1,148 | 10.6%) for men and 60 to 64 Years (759 | 8.3%) for women.
| Age Bracket | Male | Female |
| Under 5 Years | 404 (3.7%) | 370 (4.1%) |
| 5 to 9 Years | 596 (5.5%) | 526 (5.8%) |
| 10 to 14 Years | 647 (6.0%) | 554 (6.1%) |
| 15 to 19 Years | 529 (4.9%) | 479 (5.2%) |
| 20 to 24 Years | 789 (7.3%) | 610 (6.7%) |
| 25 to 29 Years | 1,148 (10.6%) | 420 (4.6%) |
| 30 to 34 Years | 678 (6.3%) | 364 (4.0%) |
| 35 to 39 Years | 635 (5.9%) | 393 (4.3%) |
| 40 to 44 Years | 677 (6.2%) | 559 (6.1%) |
| 45 to 49 Years | 518 (4.8%) | 501 (5.5%) |
| 50 to 54 Years | 641 (5.9%) | 708 (7.7%) |
| 55 to 59 Years | 714 (6.6%) | 565 (6.2%) |
| 60 to 64 Years | 761 (7.0%) | 759 (8.3%) |
| 65 to 69 Years | 843 (7.8%) | 502 (5.5%) |
| 70 to 74 Years | 382 (3.5%) | 738 (8.1%) |
| 75 to 79 Years | 479 (4.4%) | 491 (5.4%) |
| 80 to 84 Years | 234 (2.2%) | 263 (2.9%) |
| 85 Years and over | 153 (1.4%) | 332 (3.6%) |
| Total | 10,828 (100.0%) | 9,134 (100.0%) |
Families and Households in Tyler County
Median Family Size in Tyler County
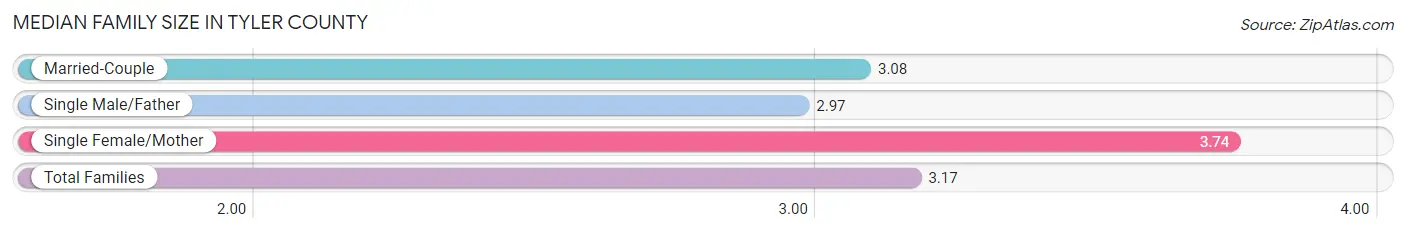
The median family size in Tyler County is 3.17 persons per family, with single female/mother families (696 | 15.0%) accounting for the largest median family size of 3.74 persons per family. On the other hand, single male/father families (383 | 8.3%) represent the smallest median family size with 2.97 persons per family.
| Family Type | # Families | Family Size |
| Married-Couple | 3,561 (76.7%) | 3.08 |
| Single Male/Father | 383 (8.3%) | 2.97 |
| Single Female/Mother | 696 (15.0%) | 3.74 |
| Total Families | 4,640 (100.0%) | 3.17 |
Median Household Size in Tyler County
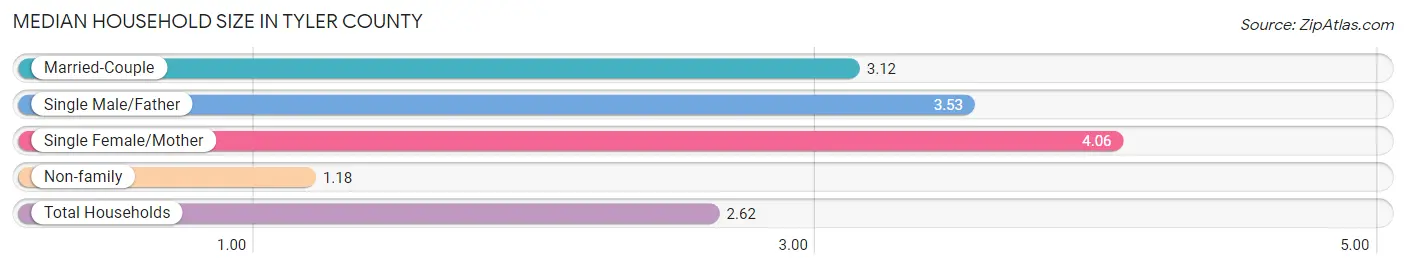
The median household size in Tyler County is 2.62 persons per household, with single female/mother households (696 | 10.2%) accounting for the largest median household size of 4.06 persons per household. non-family households (2,171 | 31.9%) represent the smallest median household size with 1.18 persons per household.
| Household Type | # Households | Household Size |
| Married-Couple | 3,561 (52.3%) | 3.12 |
| Single Male/Father | 383 (5.6%) | 3.53 |
| Single Female/Mother | 696 (10.2%) | 4.06 |
| Non-family | 2,171 (31.9%) | 1.18 |
| Total Households | 6,811 (100.0%) | 2.62 |
Household Size by Marriage Status in Tyler County
Out of a total of 6,811 households in Tyler County, 4,640 (68.1%) are family households, while 2,171 (31.9%) are nonfamily households. The most numerous type of family households are 2-person households, comprising 2,182, and the most common type of nonfamily households are 1-person households, comprising 1,842.
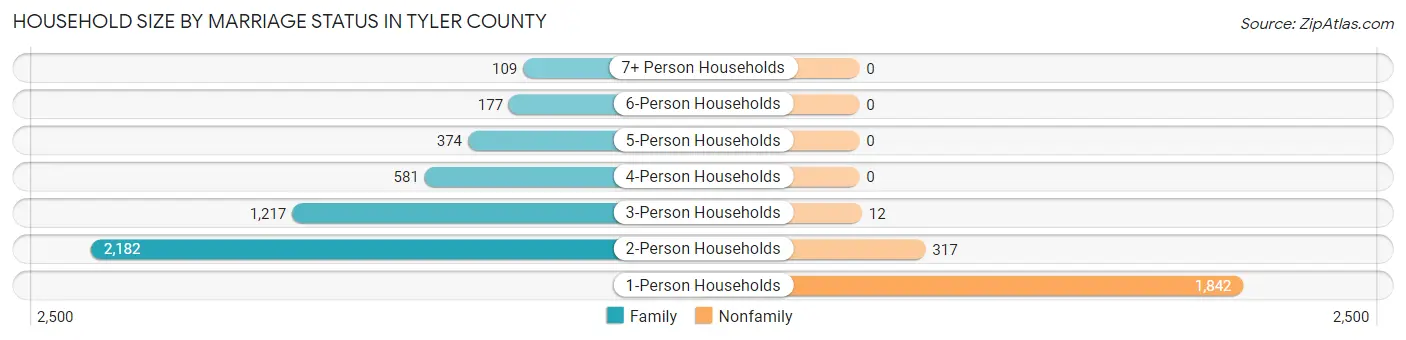
| Household Size | Family Households | Nonfamily Households |
| 1-Person Households | - | 1,842 (27.0%) |
| 2-Person Households | 2,182 (32.0%) | 317 (4.6%) |
| 3-Person Households | 1,217 (17.9%) | 12 (0.2%) |
| 4-Person Households | 581 (8.5%) | 0 (0.0%) |
| 5-Person Households | 374 (5.5%) | 0 (0.0%) |
| 6-Person Households | 177 (2.6%) | 0 (0.0%) |
| 7+ Person Households | 109 (1.6%) | 0 (0.0%) |
| Total | 4,640 (68.1%) | 2,171 (31.9%) |
Female Fertility in Tyler County
Fertility by Age in Tyler County
Average fertility rate in Tyler County is 71.0 births per 1,000 women. Women in the age bracket of 15 to 19 years have the highest fertility rate with 134.0 births per 1,000 women. Women in the age bracket of 20 to 34 years acount for 56.7% of all women with births.
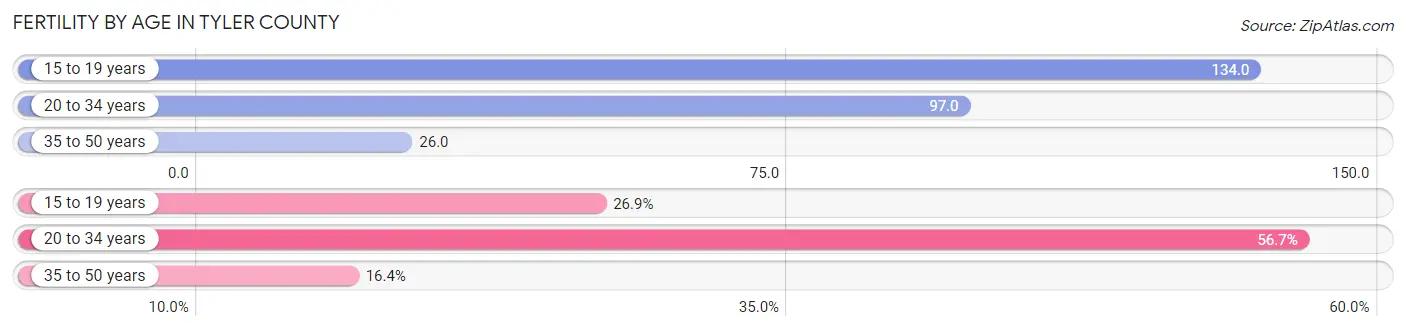
| Age Bracket | Women with Births | Births / 1,000 Women |
| 15 to 19 years | 64 (26.9%) | 134.0 |
| 20 to 34 years | 135 (56.7%) | 97.0 |
| 35 to 50 years | 39 (16.4%) | 26.0 |
| Total | 238 (100.0%) | 71.0 |
Fertility by Age by Marriage Status in Tyler County
67.2% of women with births (238) in Tyler County are married. The highest percentage of unmarried women with births falls into 15 to 19 years age bracket with 100.0% of them unmarried at the time of birth, while the lowest percentage of unmarried women with births belong to 20 to 34 years age bracket with 2.2% of them unmarried.
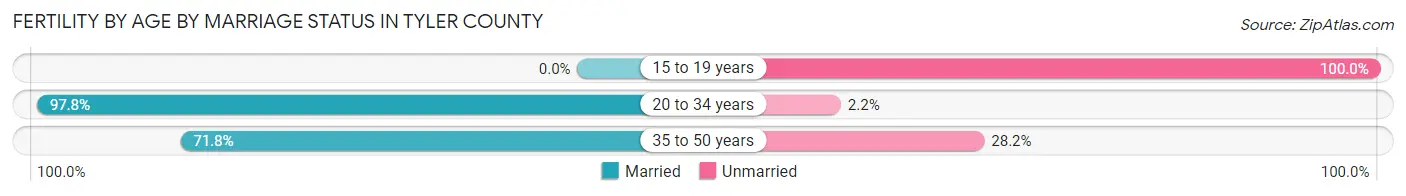
| Age Bracket | Married | Unmarried |
| 15 to 19 years | 0 (0.0%) | 64 (100.0%) |
| 20 to 34 years | 132 (97.8%) | 3 (2.2%) |
| 35 to 50 years | 28 (71.8%) | 11 (28.2%) |
| Total | 160 (67.2%) | 78 (32.8%) |
Fertility by Education in Tyler County
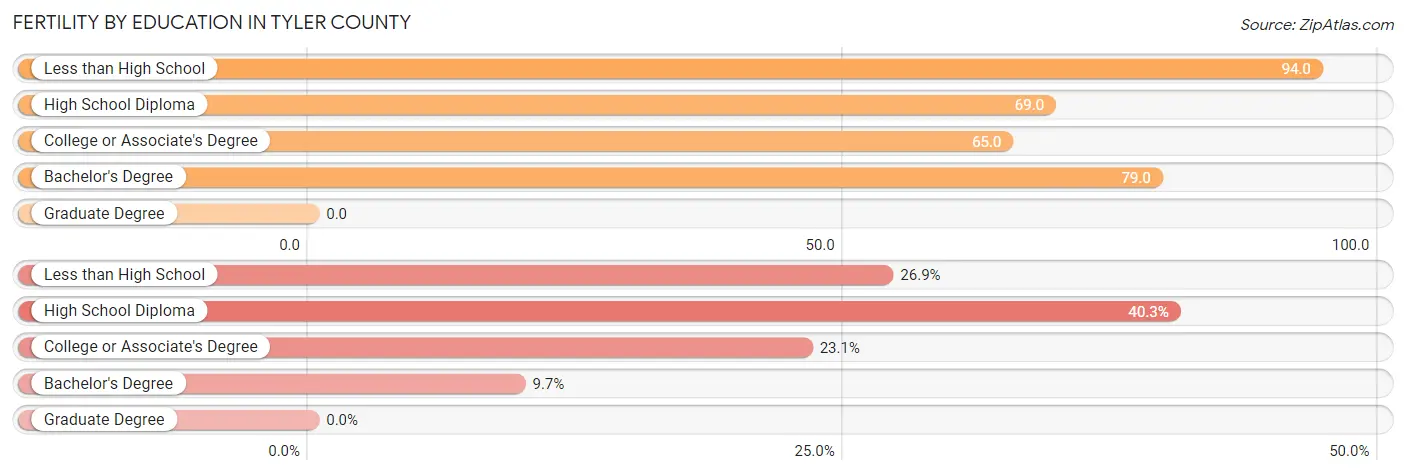
| Educational Attainment | Women with Births | Births / 1,000 Women |
| Less than High School | 64 (26.9%) | 94.0 |
| High School Diploma | 96 (40.3%) | 69.0 |
| College or Associate's Degree | 55 (23.1%) | 65.0 |
| Bachelor's Degree | 23 (9.7%) | 79.0 |
| Graduate Degree | 0 (0.0%) | 0.0 |
| Total | 238 (100.0%) | 71.0 |
Fertility by Education by Marriage Status in Tyler County
32.8% of women with births in Tyler County are unmarried. Women with the educational attainment of college or associate's degree are most likely to be married with 100.0% of them married at childbirth, while women with the educational attainment of less than high school are least likely to be married with 100.0% of them unmarried at childbirth.
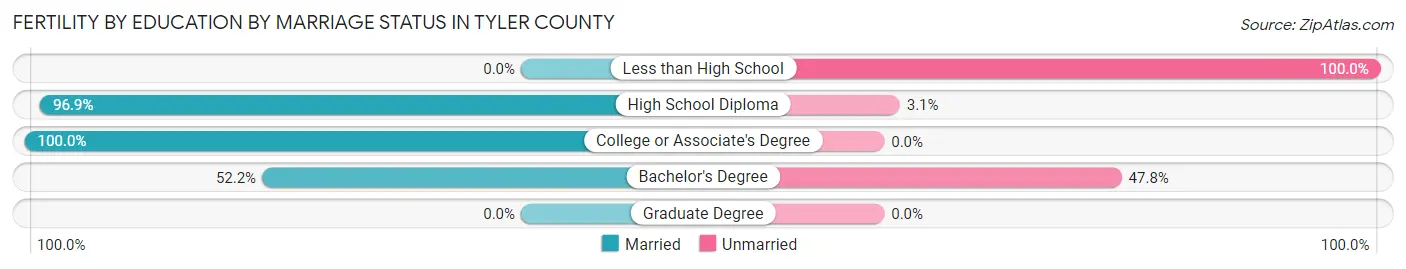
| Educational Attainment | Married | Unmarried |
| Less than High School | 0 (0.0%) | 64 (100.0%) |
| High School Diploma | 93 (96.9%) | 3 (3.1%) |
| College or Associate's Degree | 55 (100.0%) | 0 (0.0%) |
| Bachelor's Degree | 12 (52.2%) | 11 (47.8%) |
| Graduate Degree | 0 (0.0%) | 0 (0.0%) |
| Total | 160 (67.2%) | 78 (32.8%) |
Employment Characteristics in Tyler County
Employment by Class of Employer in Tyler County
Among the 6,255 employed individuals in Tyler County, private company employees (4,025 | 64.3%), self-employed (not incorporated) (500 | 8.0%), and local government employees (500 | 8.0%) make up the most common classes of employment.
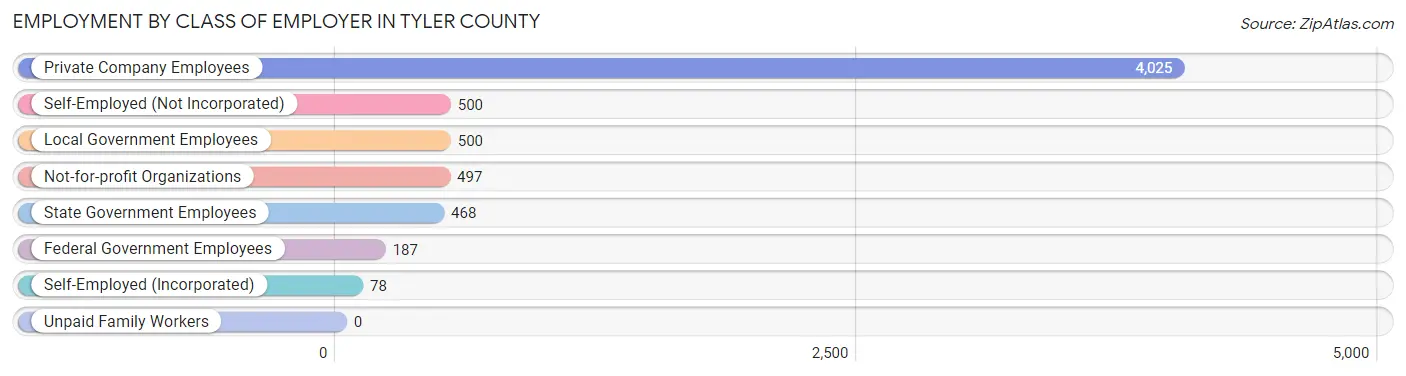
| Employer Class | # Employees | % Employees |
| Private Company Employees | 4,025 | 64.3% |
| Self-Employed (Incorporated) | 78 | 1.3% |
| Self-Employed (Not Incorporated) | 500 | 8.0% |
| Not-for-profit Organizations | 497 | 8.0% |
| Local Government Employees | 500 | 8.0% |
| State Government Employees | 468 | 7.5% |
| Federal Government Employees | 187 | 3.0% |
| Unpaid Family Workers | 0 | 0.0% |
| Total | 6,255 | 100.0% |
Employment Status by Age in Tyler County
According to the labor force statistics for Tyler County, out of the total population over 16 years of age (16,674), 43.4% or 7,237 individuals are in the labor force, with 12.6% or 912 of them unemployed. The age group with the highest labor force participation rate is 45 to 54 years, with 73.0% or 1,729 individuals in the labor force. Within the labor force, the 16 to 19 years age range has the highest percentage of unemployed individuals, with 23.3% or 61 of them being unemployed.
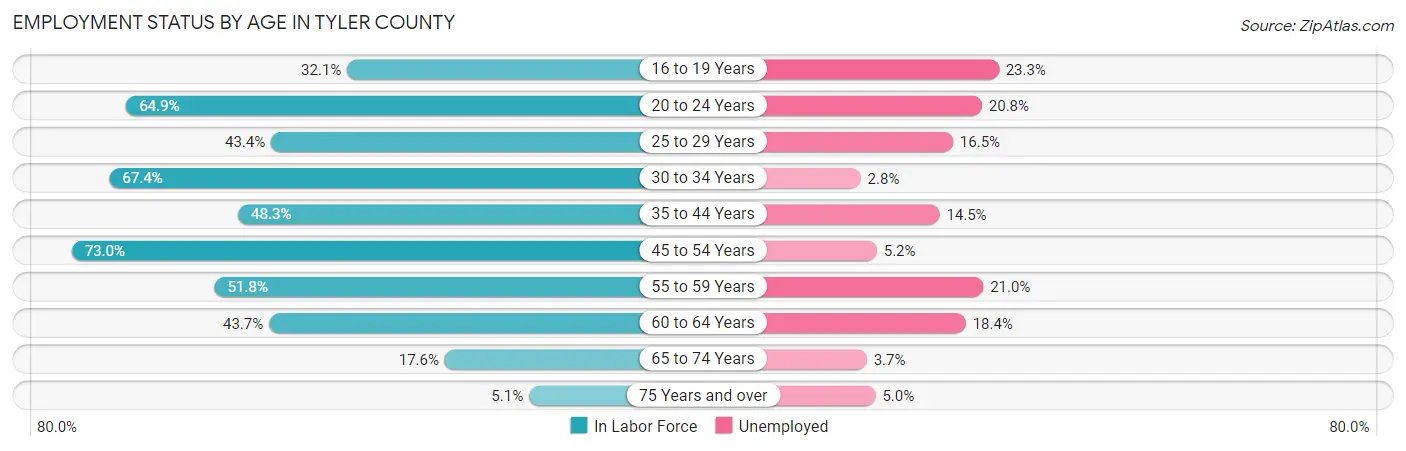
| Age Bracket | In Labor Force | Unemployed |
| 16 to 19 Years | 262 (32.1%) | 61 (23.3%) |
| 20 to 24 Years | 908 (64.9%) | 189 (20.8%) |
| 25 to 29 Years | 681 (43.4%) | 112 (16.5%) |
| 30 to 34 Years | 702 (67.4%) | 20 (2.8%) |
| 35 to 44 Years | 1,094 (48.3%) | 159 (14.5%) |
| 45 to 54 Years | 1,729 (73.0%) | 90 (5.2%) |
| 55 to 59 Years | 663 (51.8%) | 139 (21.0%) |
| 60 to 64 Years | 664 (43.7%) | 122 (18.4%) |
| 65 to 74 Years | 434 (17.6%) | 16 (3.7%) |
| 75 Years and over | 100 (5.1%) | 5 (5.0%) |
| Total | 7,237 (43.4%) | 912 (12.6%) |
Employment Status by Educational Attainment in Tyler County
According to labor force statistics for Tyler County, 55.1% of individuals (5,533) out of the total population between 25 and 64 years of age (10,041) are in the labor force, with 11.6% or 642 of them being unemployed. The group with the highest labor force participation rate are those with the educational attainment of bachelor's degree or higher, with 77.7% or 995 individuals in the labor force. Within the labor force, individuals with less than high school education have the highest percentage of unemployment, with 24.5% or 158 of them being unemployed.
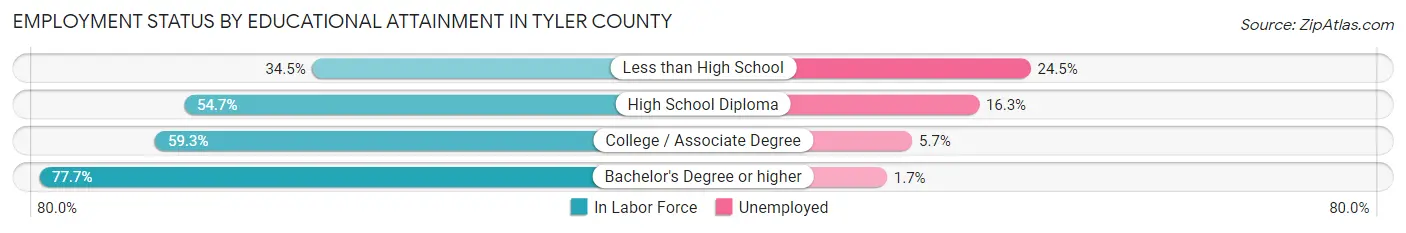
| Educational Attainment | In Labor Force | Unemployed |
| Less than High School | 645 (34.5%) | 458 (24.5%) |
| High School Diploma | 2,305 (54.7%) | 687 (16.3%) |
| College / Associate Degree | 1,586 (59.3%) | 152 (5.7%) |
| Bachelor's Degree or higher | 995 (77.7%) | 22 (1.7%) |
| Total | 5,533 (55.1%) | 1,165 (11.6%) |
Employment Occupations by Sex in Tyler County
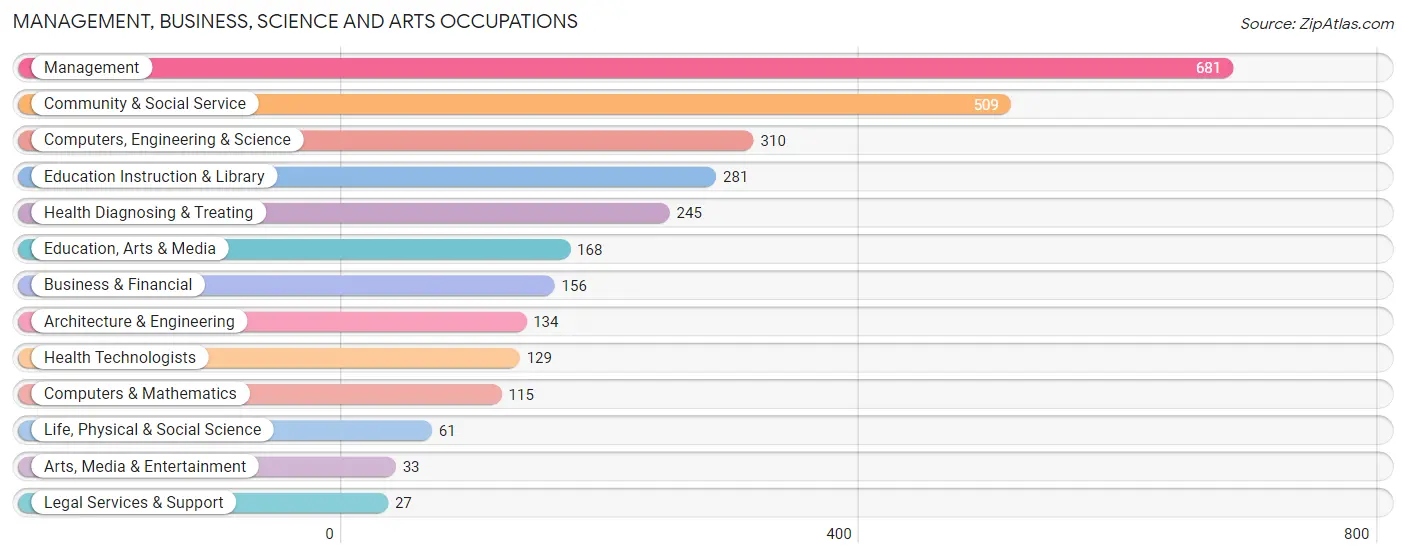
Management, Business, Science and Arts Occupations
The most common Management, Business, Science and Arts occupations in Tyler County are Management (681 | 10.8%), Community & Social Service (509 | 8.1%), Computers, Engineering & Science (310 | 4.9%), Education Instruction & Library (281 | 4.4%), and Health Diagnosing & Treating (245 | 3.9%).
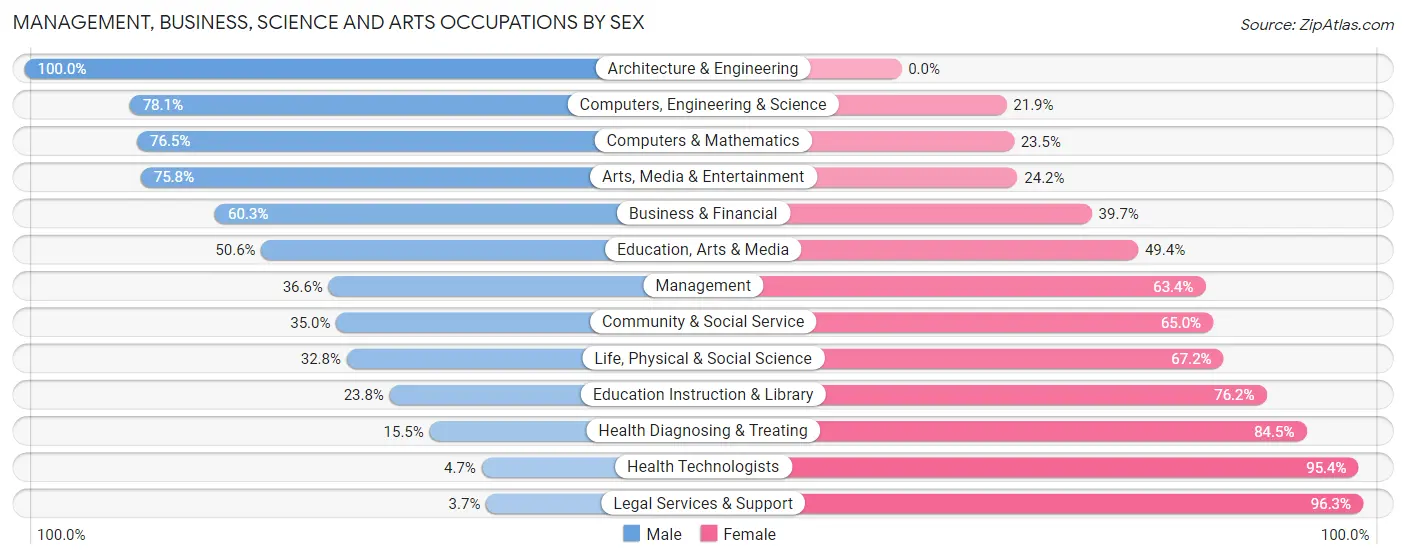
Management, Business, Science and Arts Occupations by Sex
Within the Management, Business, Science and Arts occupations in Tyler County, the most male-oriented occupations are Architecture & Engineering (100.0%), Computers, Engineering & Science (78.1%), and Computers & Mathematics (76.5%), while the most female-oriented occupations are Legal Services & Support (96.3%), Health Technologists (95.4%), and Health Diagnosing & Treating (84.5%).
| Occupation | Male | Female |
| Management | 249 (36.6%) | 432 (63.4%) |
| Business & Financial | 94 (60.3%) | 62 (39.7%) |
| Computers, Engineering & Science | 242 (78.1%) | 68 (21.9%) |
| Computers & Mathematics | 88 (76.5%) | 27 (23.5%) |
| Architecture & Engineering | 134 (100.0%) | 0 (0.0%) |
| Life, Physical & Social Science | 20 (32.8%) | 41 (67.2%) |
| Community & Social Service | 178 (35.0%) | 331 (65.0%) |
| Education, Arts & Media | 85 (50.6%) | 83 (49.4%) |
| Legal Services & Support | 1 (3.7%) | 26 (96.3%) |
| Education Instruction & Library | 67 (23.8%) | 214 (76.2%) |
| Arts, Media & Entertainment | 25 (75.8%) | 8 (24.2%) |
| Health Diagnosing & Treating | 38 (15.5%) | 207 (84.5%) |
| Health Technologists | 6 (4.6%) | 123 (95.4%) |
| Total (Category) | 801 (42.1%) | 1,100 (57.9%) |
| Total (Overall) | 3,431 (54.2%) | 2,893 (45.8%) |
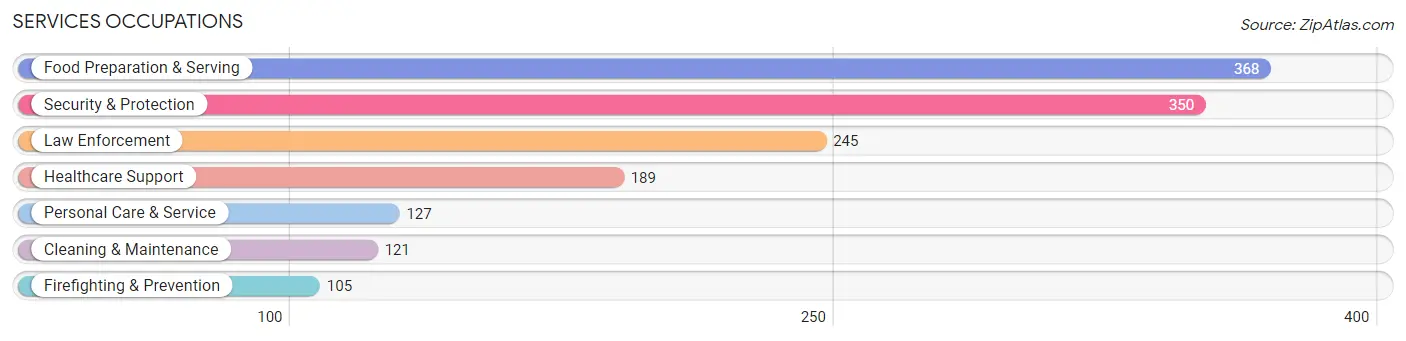
Services Occupations
The most common Services occupations in Tyler County are Food Preparation & Serving (368 | 5.8%), Security & Protection (350 | 5.5%), Law Enforcement (245 | 3.9%), Healthcare Support (189 | 3.0%), and Personal Care & Service (127 | 2.0%).
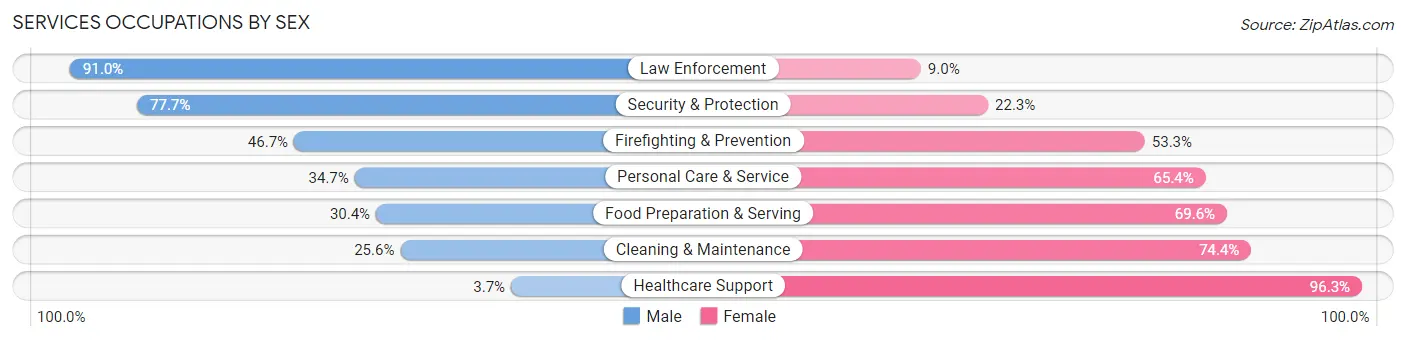
Services Occupations by Sex
Within the Services occupations in Tyler County, the most male-oriented occupations are Law Enforcement (91.0%), Security & Protection (77.7%), and Firefighting & Prevention (46.7%), while the most female-oriented occupations are Healthcare Support (96.3%), Cleaning & Maintenance (74.4%), and Food Preparation & Serving (69.6%).
| Occupation | Male | Female |
| Healthcare Support | 7 (3.7%) | 182 (96.3%) |
| Security & Protection | 272 (77.7%) | 78 (22.3%) |
| Firefighting & Prevention | 49 (46.7%) | 56 (53.3%) |
| Law Enforcement | 223 (91.0%) | 22 (9.0%) |
| Food Preparation & Serving | 112 (30.4%) | 256 (69.6%) |
| Cleaning & Maintenance | 31 (25.6%) | 90 (74.4%) |
| Personal Care & Service | 44 (34.6%) | 83 (65.3%) |
| Total (Category) | 466 (40.4%) | 689 (59.7%) |
| Total (Overall) | 3,431 (54.2%) | 2,893 (45.8%) |
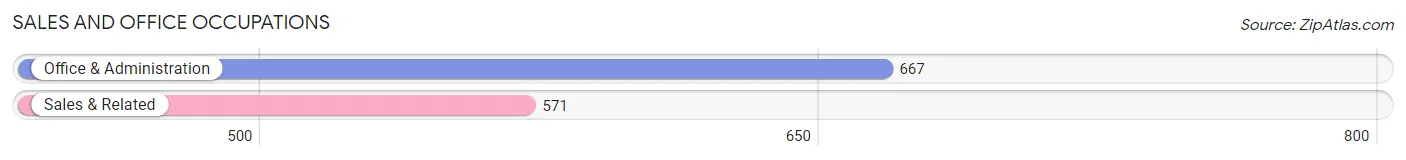
Sales and Office Occupations
The most common Sales and Office occupations in Tyler County are Office & Administration (667 | 10.5%), and Sales & Related (571 | 9.0%).
Sales and Office Occupations by Sex
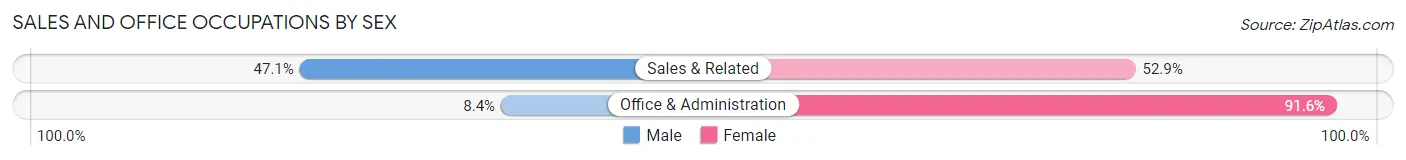
| Occupation | Male | Female |
| Sales & Related | 269 (47.1%) | 302 (52.9%) |
| Office & Administration | 56 (8.4%) | 611 (91.6%) |
| Total (Category) | 325 (26.3%) | 913 (73.8%) |
| Total (Overall) | 3,431 (54.2%) | 2,893 (45.8%) |
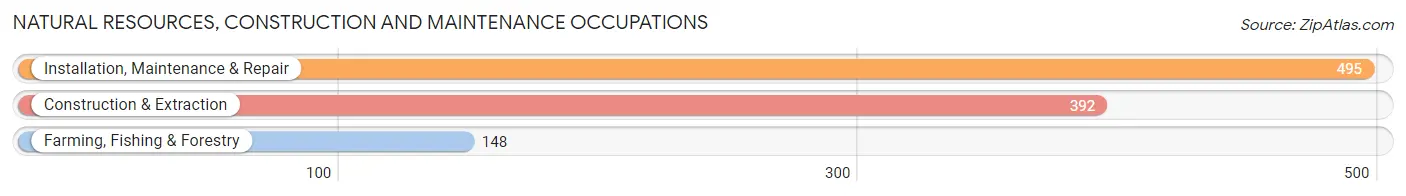
Natural Resources, Construction and Maintenance Occupations
The most common Natural Resources, Construction and Maintenance occupations in Tyler County are Installation, Maintenance & Repair (495 | 7.8%), Construction & Extraction (392 | 6.2%), and Farming, Fishing & Forestry (148 | 2.3%).
Natural Resources, Construction and Maintenance Occupations by Sex
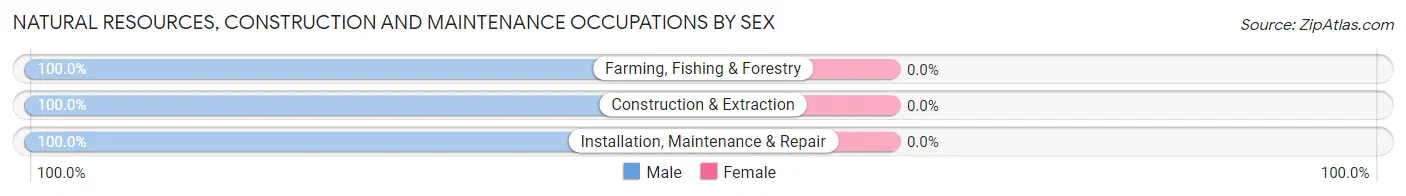
| Occupation | Male | Female |
| Farming, Fishing & Forestry | 148 (100.0%) | 0 (0.0%) |
| Construction & Extraction | 392 (100.0%) | 0 (0.0%) |
| Installation, Maintenance & Repair | 495 (100.0%) | 0 (0.0%) |
| Total (Category) | 1,035 (100.0%) | 0 (0.0%) |
| Total (Overall) | 3,431 (54.2%) | 2,893 (45.8%) |
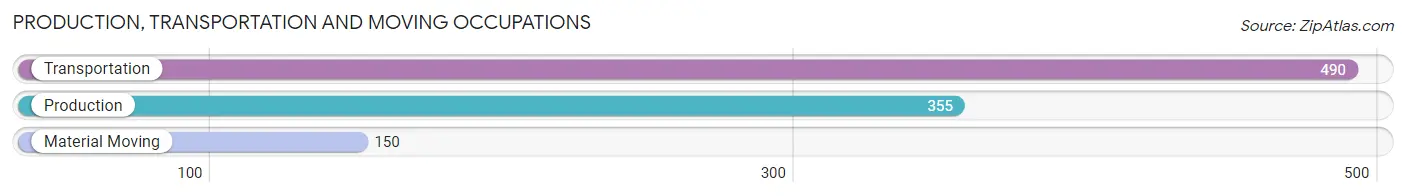
Production, Transportation and Moving Occupations
The most common Production, Transportation and Moving occupations in Tyler County are Transportation (490 | 7.7%), Production (355 | 5.6%), and Material Moving (150 | 2.4%).
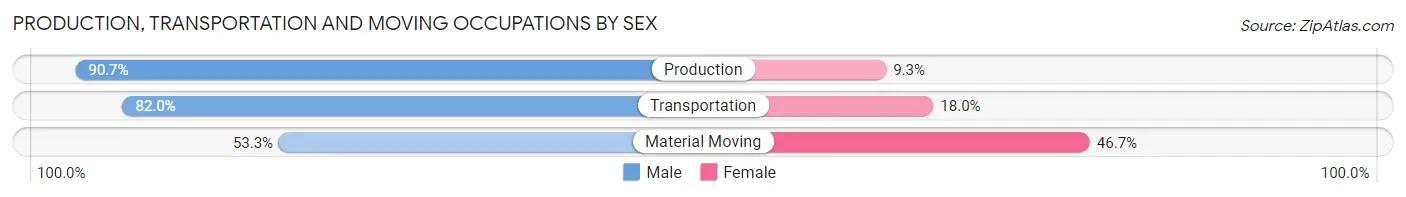
Production, Transportation and Moving Occupations by Sex
| Occupation | Male | Female |
| Production | 322 (90.7%) | 33 (9.3%) |
| Transportation | 402 (82.0%) | 88 (18.0%) |
| Material Moving | 80 (53.3%) | 70 (46.7%) |
| Total (Category) | 804 (80.8%) | 191 (19.2%) |
| Total (Overall) | 3,431 (54.2%) | 2,893 (45.8%) |
Employment Industries by Sex in Tyler County
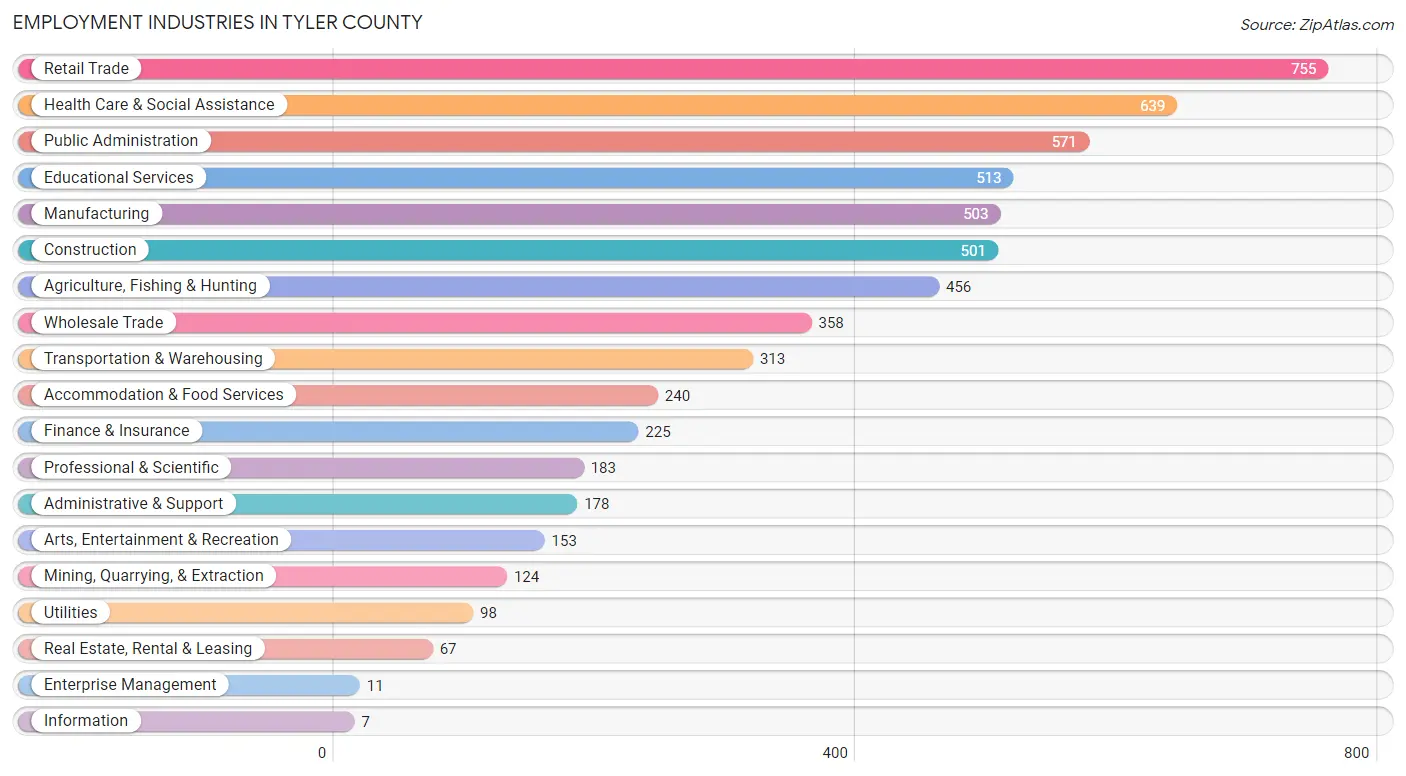
Employment Industries in Tyler County
The major employment industries in Tyler County include Retail Trade (755 | 11.9%), Health Care & Social Assistance (639 | 10.1%), Public Administration (571 | 9.0%), Educational Services (513 | 8.1%), and Manufacturing (503 | 8.0%).
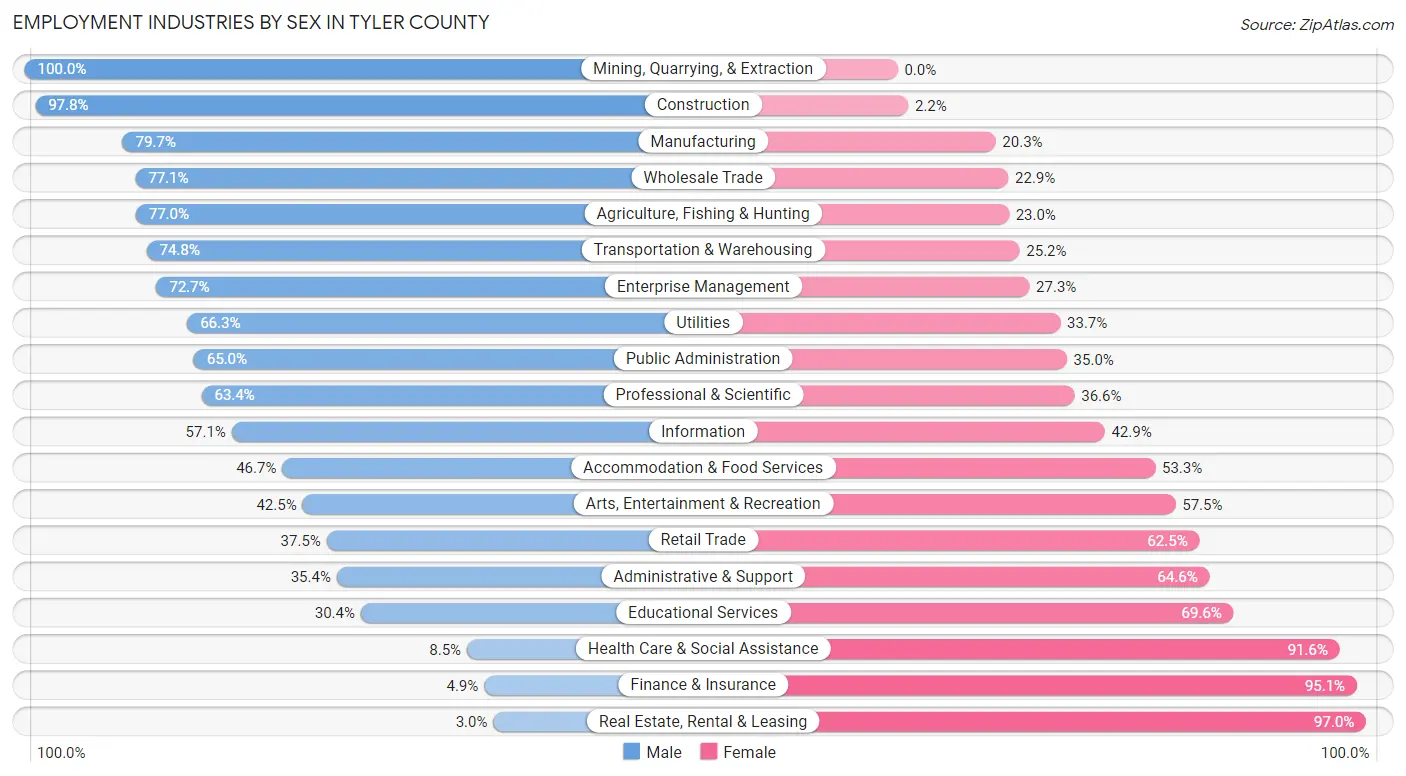
Employment Industries by Sex in Tyler County
The Tyler County industries that see more men than women are Mining, Quarrying, & Extraction (100.0%), Construction (97.8%), and Manufacturing (79.7%), whereas the industries that tend to have a higher number of women are Real Estate, Rental & Leasing (97.0%), Finance & Insurance (95.1%), and Health Care & Social Assistance (91.5%).
| Industry | Male | Female |
| Agriculture, Fishing & Hunting | 351 (77.0%) | 105 (23.0%) |
| Mining, Quarrying, & Extraction | 124 (100.0%) | 0 (0.0%) |
| Construction | 490 (97.8%) | 11 (2.2%) |
| Manufacturing | 401 (79.7%) | 102 (20.3%) |
| Wholesale Trade | 276 (77.1%) | 82 (22.9%) |
| Retail Trade | 283 (37.5%) | 472 (62.5%) |
| Transportation & Warehousing | 234 (74.8%) | 79 (25.2%) |
| Utilities | 65 (66.3%) | 33 (33.7%) |
| Information | 4 (57.1%) | 3 (42.9%) |
| Finance & Insurance | 11 (4.9%) | 214 (95.1%) |
| Real Estate, Rental & Leasing | 2 (3.0%) | 65 (97.0%) |
| Professional & Scientific | 116 (63.4%) | 67 (36.6%) |
| Enterprise Management | 8 (72.7%) | 3 (27.3%) |
| Administrative & Support | 63 (35.4%) | 115 (64.6%) |
| Educational Services | 156 (30.4%) | 357 (69.6%) |
| Health Care & Social Assistance | 54 (8.5%) | 585 (91.5%) |
| Arts, Entertainment & Recreation | 65 (42.5%) | 88 (57.5%) |
| Accommodation & Food Services | 112 (46.7%) | 128 (53.3%) |
| Public Administration | 371 (65.0%) | 200 (35.0%) |
| Total | 3,431 (54.2%) | 2,893 (45.8%) |
Education in Tyler County
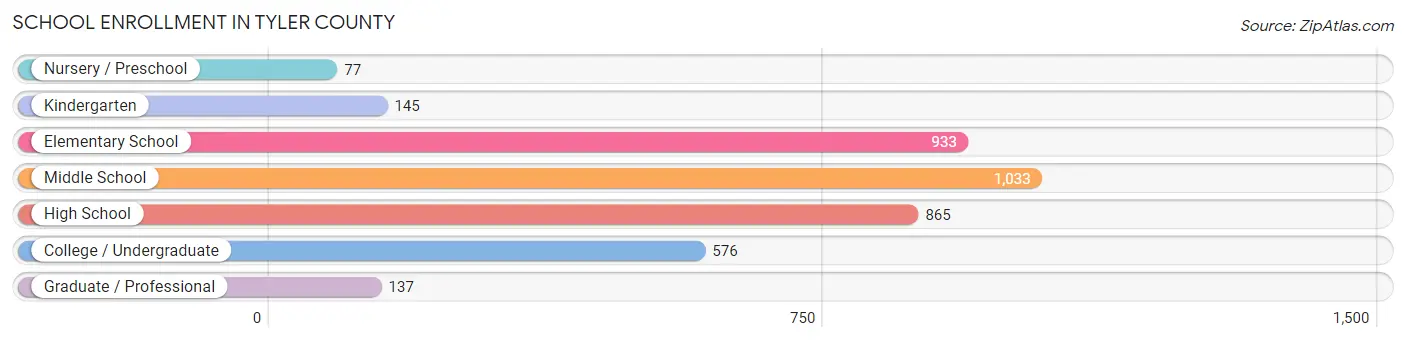
School Enrollment in Tyler County
The most common levels of schooling among the 3,766 students in Tyler County are middle school (1,033 | 27.4%), elementary school (933 | 24.8%), and high school (865 | 23.0%).
| School Level | # Students | % Students |
| Nursery / Preschool | 77 | 2.0% |
| Kindergarten | 145 | 3.8% |
| Elementary School | 933 | 24.8% |
| Middle School | 1,033 | 27.4% |
| High School | 865 | 23.0% |
| College / Undergraduate | 576 | 15.3% |
| Graduate / Professional | 137 | 3.6% |
| Total | 3,766 | 100.0% |
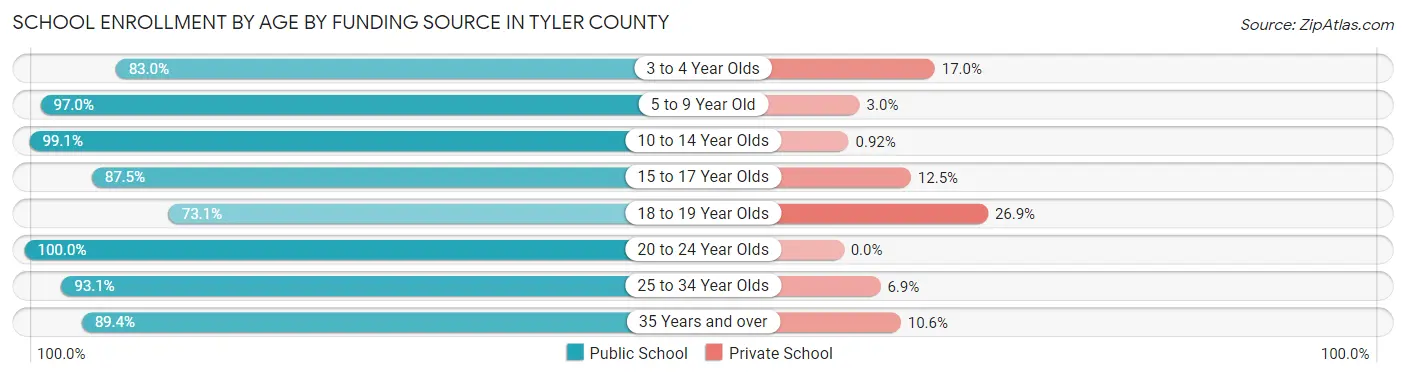
School Enrollment by Age by Funding Source in Tyler County
Out of a total of 3,766 students who are enrolled in schools in Tyler County, 222 (5.9%) attend a private institution, while the remaining 3,544 (94.1%) are enrolled in public schools. The age group of 18 to 19 year olds has the highest likelihood of being enrolled in private schools, with 54 (26.9% in the age bracket) enrolled. Conversely, the age group of 20 to 24 year olds has the lowest likelihood of being enrolled in a private school, with 216 (100.0% in the age bracket) attending a public institution.
| Age Bracket | Public School | Private School |
| 3 to 4 Year Olds | 44 (83.0%) | 9 (17.0%) |
| 5 to 9 Year Old | 1,008 (97.0%) | 31 (3.0%) |
| 10 to 14 Year Olds | 1,189 (99.1%) | 11 (0.9%) |
| 15 to 17 Year Olds | 566 (87.5%) | 81 (12.5%) |
| 18 to 19 Year Olds | 147 (73.1%) | 54 (26.9%) |
| 20 to 24 Year Olds | 216 (100.0%) | 0 (0.0%) |
| 25 to 34 Year Olds | 163 (93.1%) | 12 (6.9%) |
| 35 Years and over | 210 (89.4%) | 25 (10.6%) |
| Total | 3,544 (94.1%) | 222 (5.9%) |
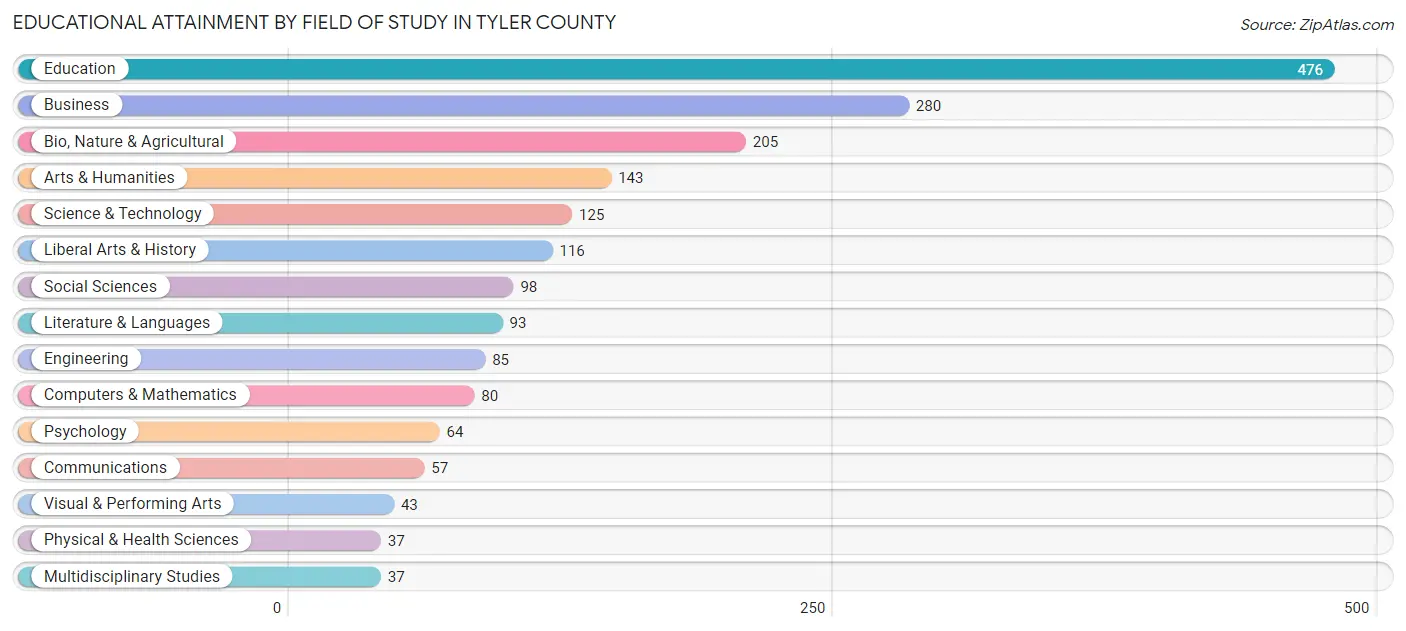
Educational Attainment by Field of Study in Tyler County
Education (476 | 24.5%), business (280 | 14.4%), bio, nature & agricultural (205 | 10.6%), arts & humanities (143 | 7.4%), and science & technology (125 | 6.5%) are the most common fields of study among 1,939 individuals in Tyler County who have obtained a bachelor's degree or higher.
| Field of Study | # Graduates | % Graduates |
| Computers & Mathematics | 80 | 4.1% |
| Bio, Nature & Agricultural | 205 | 10.6% |
| Physical & Health Sciences | 37 | 1.9% |
| Psychology | 64 | 3.3% |
| Social Sciences | 98 | 5.1% |
| Engineering | 85 | 4.4% |
| Multidisciplinary Studies | 37 | 1.9% |
| Science & Technology | 125 | 6.5% |
| Business | 280 | 14.4% |
| Education | 476 | 24.5% |
| Literature & Languages | 93 | 4.8% |
| Liberal Arts & History | 116 | 6.0% |
| Visual & Performing Arts | 43 | 2.2% |
| Communications | 57 | 2.9% |
| Arts & Humanities | 143 | 7.4% |
| Total | 1,939 | 100.0% |
Transportation & Commute in Tyler County
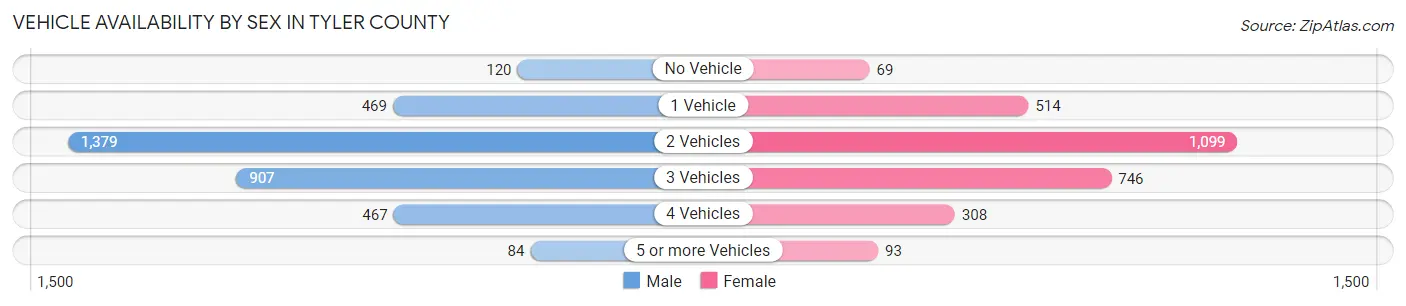
Vehicle Availability by Sex in Tyler County
The most prevalent vehicle ownership categories in Tyler County are males with 2 vehicles (1,379, accounting for 40.3%) and females with 2 vehicles (1,099, making up 48.7%).
| Vehicles Available | Male | Female |
| No Vehicle | 120 (3.5%) | 69 (2.4%) |
| 1 Vehicle | 469 (13.7%) | 514 (18.2%) |
| 2 Vehicles | 1,379 (40.3%) | 1,099 (38.9%) |
| 3 Vehicles | 907 (26.5%) | 746 (26.4%) |
| 4 Vehicles | 467 (13.6%) | 308 (10.9%) |
| 5 or more Vehicles | 84 (2.5%) | 93 (3.3%) |
| Total | 3,426 (100.0%) | 2,829 (100.0%) |
Commute Time in Tyler County
The most frequently occuring commute durations in Tyler County are 5 to 9 minutes (1,187 commuters, 19.7%), 60 to 89 minutes (939 commuters, 15.6%), and 30 to 34 minutes (644 commuters, 10.7%).
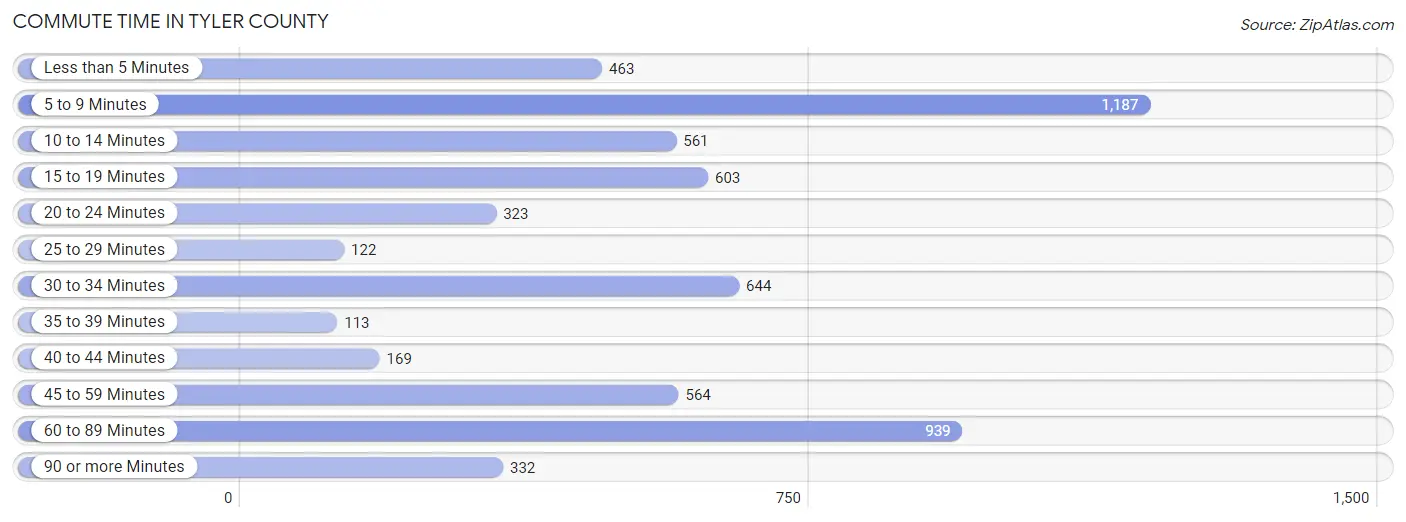
| Commute Time | # Commuters | % Commuters |
| Less than 5 Minutes | 463 | 7.7% |
| 5 to 9 Minutes | 1,187 | 19.7% |
| 10 to 14 Minutes | 561 | 9.3% |
| 15 to 19 Minutes | 603 | 10.0% |
| 20 to 24 Minutes | 323 | 5.4% |
| 25 to 29 Minutes | 122 | 2.0% |
| 30 to 34 Minutes | 644 | 10.7% |
| 35 to 39 Minutes | 113 | 1.9% |
| 40 to 44 Minutes | 169 | 2.8% |
| 45 to 59 Minutes | 564 | 9.4% |
| 60 to 89 Minutes | 939 | 15.6% |
| 90 or more Minutes | 332 | 5.5% |
Commute Time by Sex in Tyler County
The most common commute times in Tyler County are 60 to 89 minutes (676 commuters, 20.6%) for males and 5 to 9 minutes (591 commuters, 21.6%) for females.
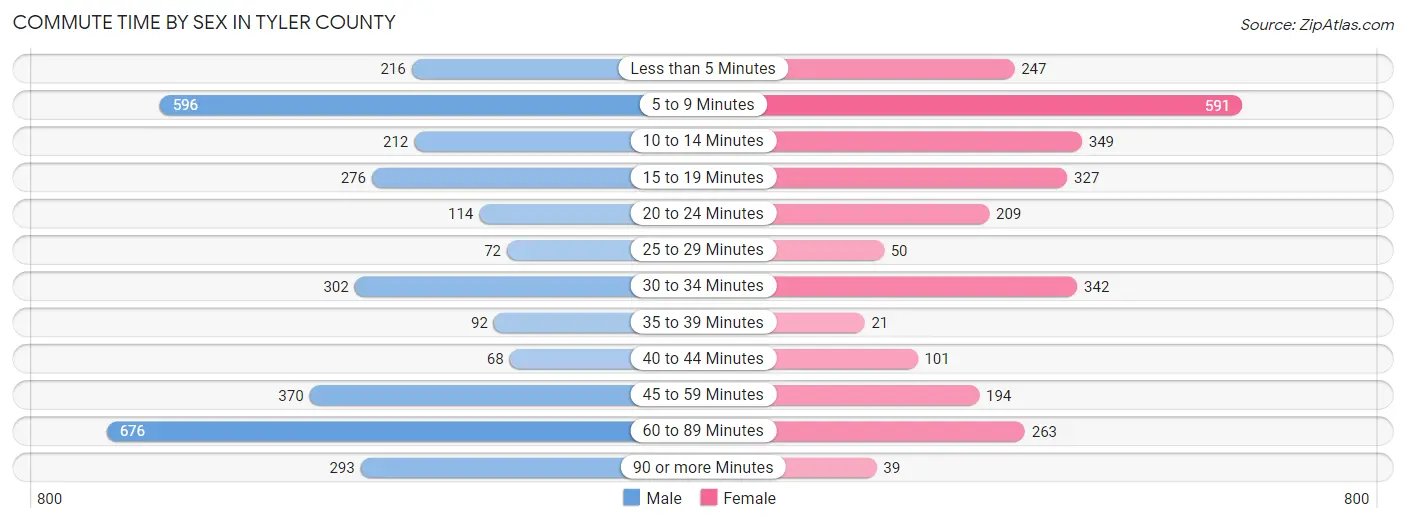
| Commute Time | Male | Female |
| Less than 5 Minutes | 216 (6.6%) | 247 (9.0%) |
| 5 to 9 Minutes | 596 (18.1%) | 591 (21.6%) |
| 10 to 14 Minutes | 212 (6.5%) | 349 (12.8%) |
| 15 to 19 Minutes | 276 (8.4%) | 327 (12.0%) |
| 20 to 24 Minutes | 114 (3.5%) | 209 (7.6%) |
| 25 to 29 Minutes | 72 (2.2%) | 50 (1.8%) |
| 30 to 34 Minutes | 302 (9.2%) | 342 (12.5%) |
| 35 to 39 Minutes | 92 (2.8%) | 21 (0.8%) |
| 40 to 44 Minutes | 68 (2.1%) | 101 (3.7%) |
| 45 to 59 Minutes | 370 (11.3%) | 194 (7.1%) |
| 60 to 89 Minutes | 676 (20.6%) | 263 (9.6%) |
| 90 or more Minutes | 293 (8.9%) | 39 (1.4%) |
Time of Departure to Work by Sex in Tyler County
The most frequent times of departure to work in Tyler County are 12:00 AM to 4:59 AM (762, 23.2%) for males and 7:00 AM to 7:29 AM (455, 16.7%) for females.
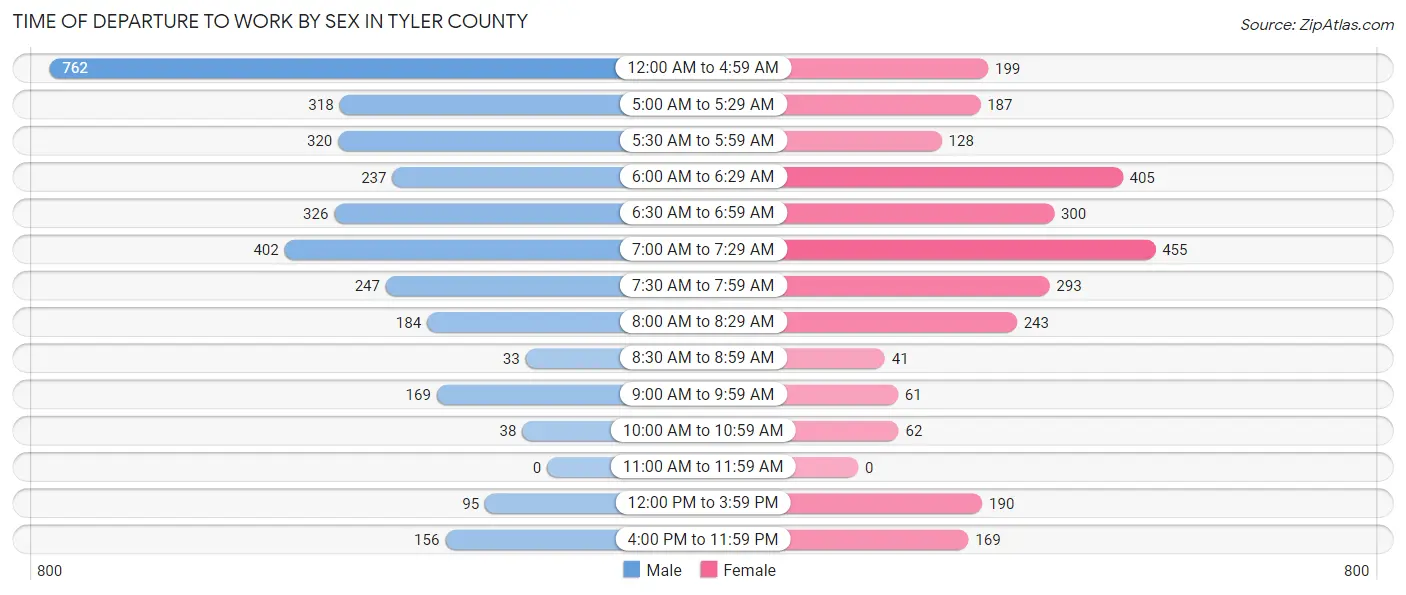
| Time of Departure | Male | Female |
| 12:00 AM to 4:59 AM | 762 (23.2%) | 199 (7.3%) |
| 5:00 AM to 5:29 AM | 318 (9.7%) | 187 (6.8%) |
| 5:30 AM to 5:59 AM | 320 (9.7%) | 128 (4.7%) |
| 6:00 AM to 6:29 AM | 237 (7.2%) | 405 (14.8%) |
| 6:30 AM to 6:59 AM | 326 (9.9%) | 300 (11.0%) |
| 7:00 AM to 7:29 AM | 402 (12.2%) | 455 (16.7%) |
| 7:30 AM to 7:59 AM | 247 (7.5%) | 293 (10.7%) |
| 8:00 AM to 8:29 AM | 184 (5.6%) | 243 (8.9%) |
| 8:30 AM to 8:59 AM | 33 (1.0%) | 41 (1.5%) |
| 9:00 AM to 9:59 AM | 169 (5.1%) | 61 (2.2%) |
| 10:00 AM to 10:59 AM | 38 (1.2%) | 62 (2.3%) |
| 11:00 AM to 11:59 AM | 0 (0.0%) | 0 (0.0%) |
| 12:00 PM to 3:59 PM | 95 (2.9%) | 190 (7.0%) |
| 4:00 PM to 11:59 PM | 156 (4.8%) | 169 (6.2%) |
| Total | 3,287 (100.0%) | 2,733 (100.0%) |
Housing Occupancy in Tyler County
Occupancy by Ownership in Tyler County
Of the total 6,811 dwellings in Tyler County, owner-occupied units account for 5,493 (80.6%), while renter-occupied units make up 1,318 (19.4%).
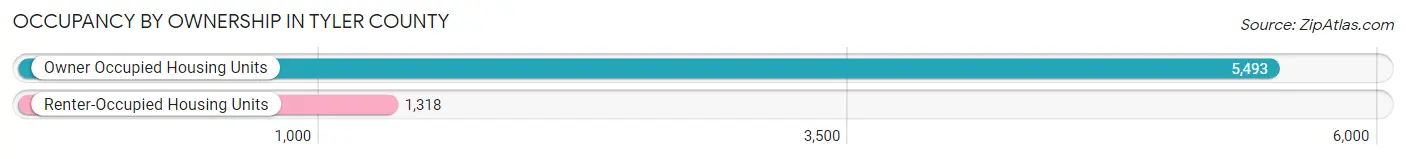
| Occupancy | # Housing Units | % Housing Units |
| Owner Occupied Housing Units | 5,493 | 80.6% |
| Renter-Occupied Housing Units | 1,318 | 19.4% |
| Total Occupied Housing Units | 6,811 | 100.0% |
Occupancy by Household Size in Tyler County
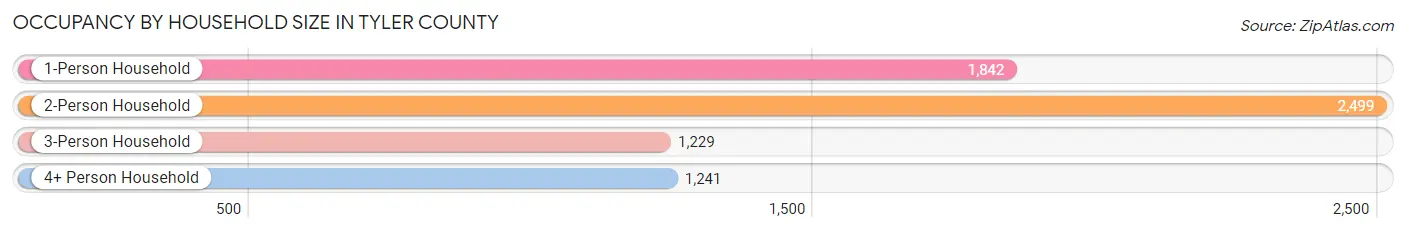
| Household Size | # Housing Units | % Housing Units |
| 1-Person Household | 1,842 | 27.0% |
| 2-Person Household | 2,499 | 36.7% |
| 3-Person Household | 1,229 | 18.0% |
| 4+ Person Household | 1,241 | 18.2% |
| Total Housing Units | 6,811 | 100.0% |
Occupancy by Ownership by Household Size in Tyler County
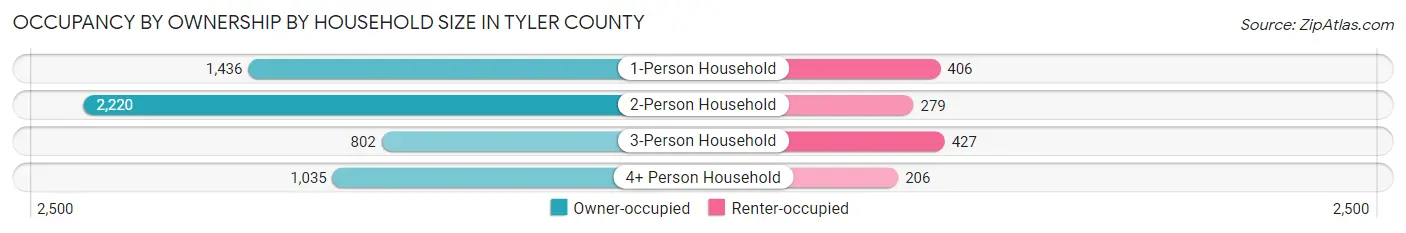
| Household Size | Owner-occupied | Renter-occupied |
| 1-Person Household | 1,436 (78.0%) | 406 (22.0%) |
| 2-Person Household | 2,220 (88.8%) | 279 (11.2%) |
| 3-Person Household | 802 (65.3%) | 427 (34.7%) |
| 4+ Person Household | 1,035 (83.4%) | 206 (16.6%) |
| Total Housing Units | 5,493 (80.6%) | 1,318 (19.4%) |
Occupancy by Educational Attainment in Tyler County
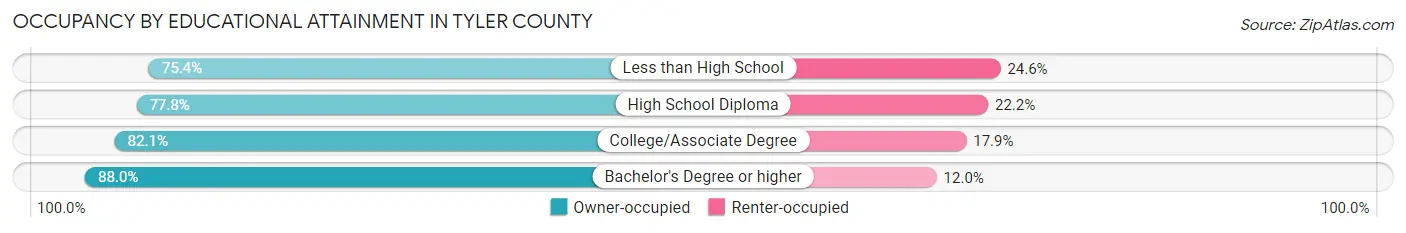
| Household Size | Owner-occupied | Renter-occupied |
| Less than High School | 688 (75.4%) | 225 (24.6%) |
| High School Diploma | 1,982 (77.8%) | 565 (22.2%) |
| College/Associate Degree | 1,766 (82.1%) | 384 (17.9%) |
| Bachelor's Degree or higher | 1,057 (88.0%) | 144 (12.0%) |
Occupancy by Age of Householder in Tyler County
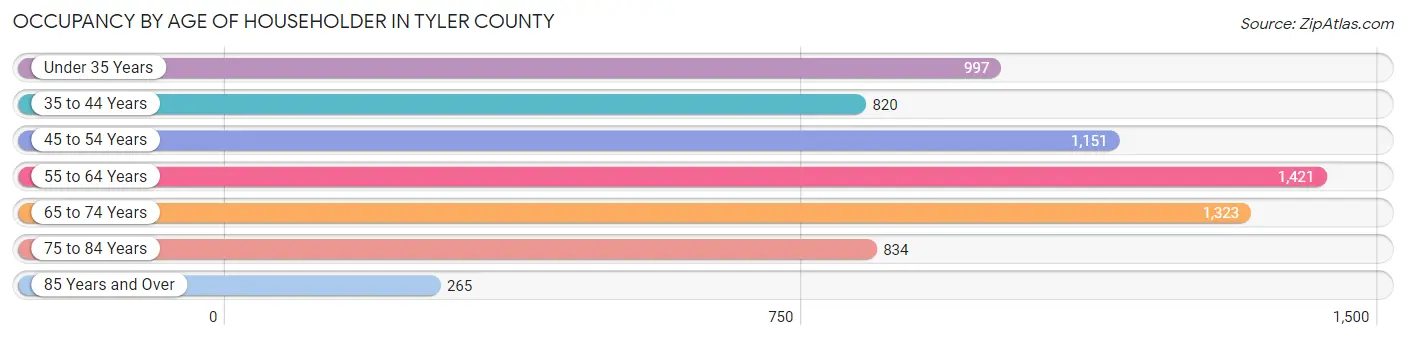
| Age Bracket | # Households | % Households |
| Under 35 Years | 997 | 14.6% |
| 35 to 44 Years | 820 | 12.0% |
| 45 to 54 Years | 1,151 | 16.9% |
| 55 to 64 Years | 1,421 | 20.9% |
| 65 to 74 Years | 1,323 | 19.4% |
| 75 to 84 Years | 834 | 12.2% |
| 85 Years and Over | 265 | 3.9% |
| Total | 6,811 | 100.0% |
Housing Finances in Tyler County
Median Income by Occupancy in Tyler County
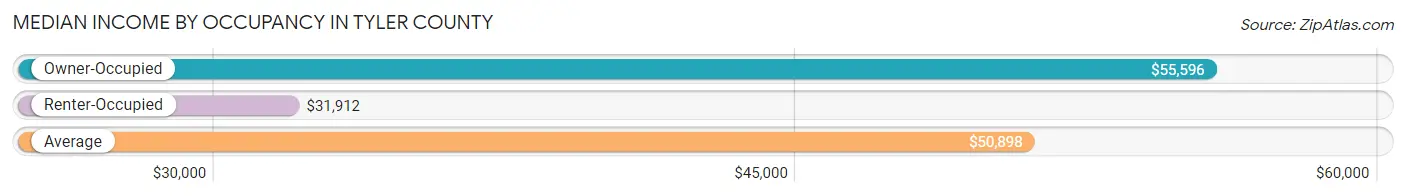
| Occupancy Type | # Households | Median Income |
| Owner-Occupied | 5,493 (80.6%) | $55,596 |
| Renter-Occupied | 1,318 (19.4%) | $31,912 |
| Average | 6,811 (100.0%) | $50,898 |
Occupancy by Householder Income Bracket in Tyler County
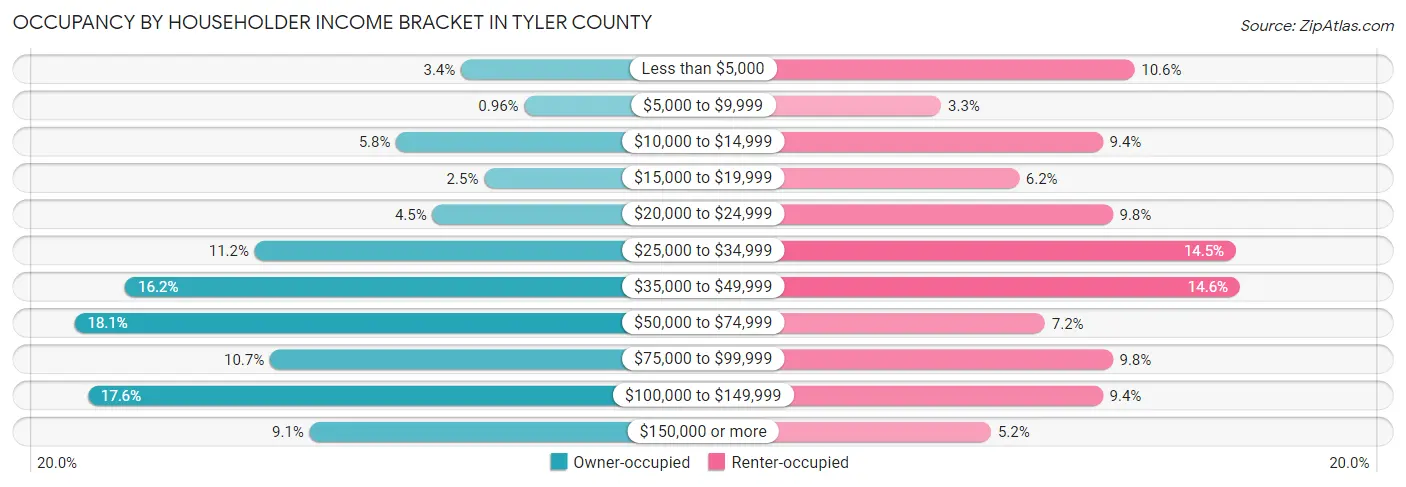
| Income Bracket | Owner-occupied | Renter-occupied |
| Less than $5,000 | 185 (3.4%) | 140 (10.6%) |
| $5,000 to $9,999 | 53 (1.0%) | 43 (3.3%) |
| $10,000 to $14,999 | 321 (5.8%) | 124 (9.4%) |
| $15,000 to $19,999 | 137 (2.5%) | 82 (6.2%) |
| $20,000 to $24,999 | 245 (4.5%) | 129 (9.8%) |
| $25,000 to $34,999 | 617 (11.2%) | 191 (14.5%) |
| $35,000 to $49,999 | 888 (16.2%) | 193 (14.6%) |
| $50,000 to $74,999 | 994 (18.1%) | 95 (7.2%) |
| $75,000 to $99,999 | 585 (10.6%) | 129 (9.8%) |
| $100,000 to $149,999 | 966 (17.6%) | 124 (9.4%) |
| $150,000 or more | 502 (9.1%) | 68 (5.2%) |
| Total | 5,493 (100.0%) | 1,318 (100.0%) |
Monthly Housing Cost Tiers in Tyler County
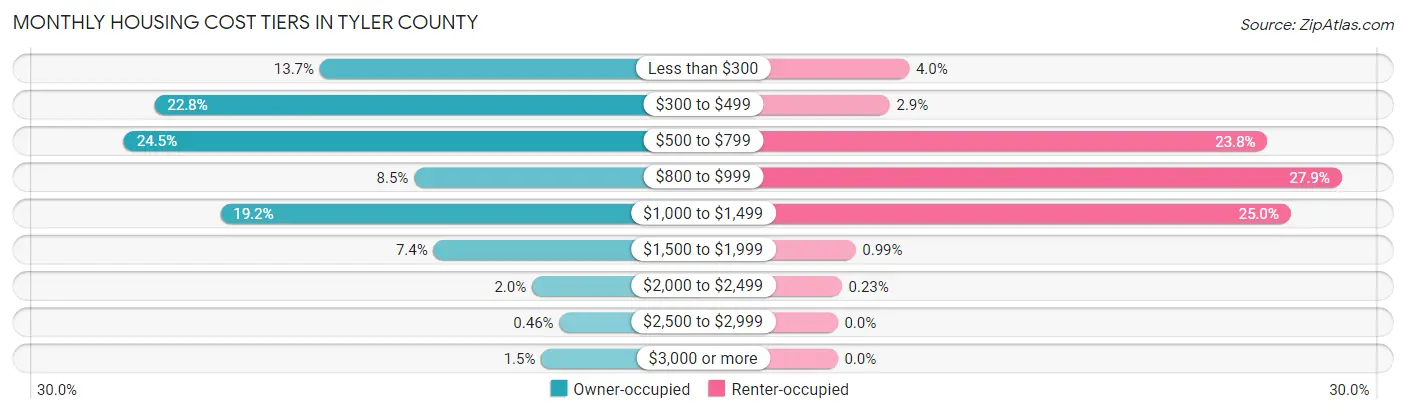
| Monthly Cost | Owner-occupied | Renter-occupied |
| Less than $300 | 752 (13.7%) | 52 (4.0%) |
| $300 to $499 | 1,254 (22.8%) | 38 (2.9%) |
| $500 to $799 | 1,347 (24.5%) | 313 (23.7%) |
| $800 to $999 | 466 (8.5%) | 367 (27.9%) |
| $1,000 to $1,499 | 1,054 (19.2%) | 330 (25.0%) |
| $1,500 to $1,999 | 407 (7.4%) | 13 (1.0%) |
| $2,000 to $2,499 | 108 (2.0%) | 3 (0.2%) |
| $2,500 to $2,999 | 25 (0.5%) | 0 (0.0%) |
| $3,000 or more | 80 (1.5%) | 0 (0.0%) |
| Total | 5,493 (100.0%) | 1,318 (100.0%) |
Physical Housing Characteristics in Tyler County
Housing Structures in Tyler County
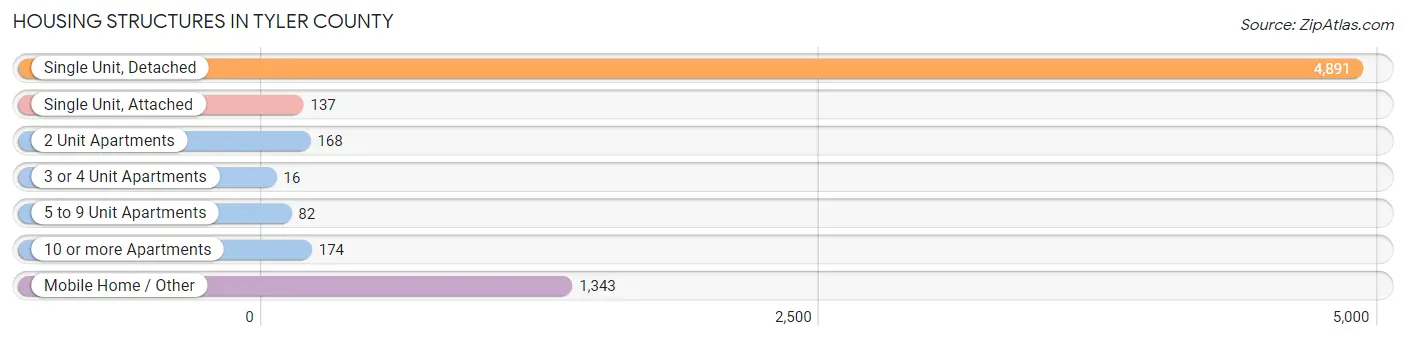
| Structure Type | # Housing Units | % Housing Units |
| Single Unit, Detached | 4,891 | 71.8% |
| Single Unit, Attached | 137 | 2.0% |
| 2 Unit Apartments | 168 | 2.5% |
| 3 or 4 Unit Apartments | 16 | 0.2% |
| 5 to 9 Unit Apartments | 82 | 1.2% |
| 10 or more Apartments | 174 | 2.5% |
| Mobile Home / Other | 1,343 | 19.7% |
| Total | 6,811 | 100.0% |
Housing Structures by Occupancy in Tyler County
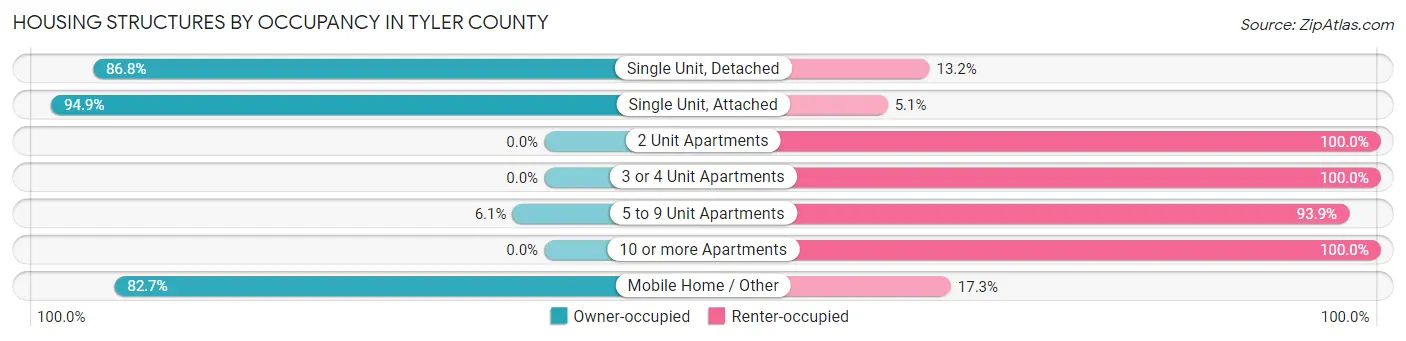
| Structure Type | Owner-occupied | Renter-occupied |
| Single Unit, Detached | 4,247 (86.8%) | 644 (13.2%) |
| Single Unit, Attached | 130 (94.9%) | 7 (5.1%) |
| 2 Unit Apartments | 0 (0.0%) | 168 (100.0%) |
| 3 or 4 Unit Apartments | 0 (0.0%) | 16 (100.0%) |
| 5 to 9 Unit Apartments | 5 (6.1%) | 77 (93.9%) |
| 10 or more Apartments | 0 (0.0%) | 174 (100.0%) |
| Mobile Home / Other | 1,111 (82.7%) | 232 (17.3%) |
| Total | 5,493 (80.6%) | 1,318 (19.4%) |
Housing Structures by Number of Rooms in Tyler County
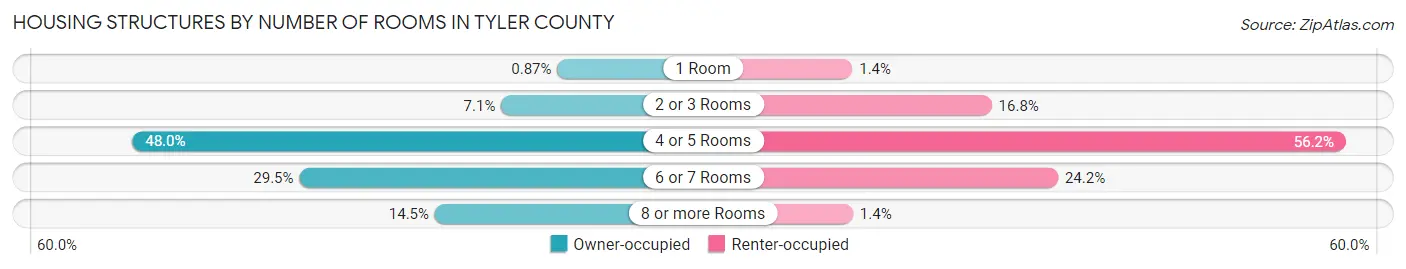
| Number of Rooms | Owner-occupied | Renter-occupied |
| 1 Room | 48 (0.9%) | 18 (1.4%) |
| 2 or 3 Rooms | 390 (7.1%) | 222 (16.8%) |
| 4 or 5 Rooms | 2,639 (48.0%) | 740 (56.1%) |
| 6 or 7 Rooms | 1,621 (29.5%) | 319 (24.2%) |
| 8 or more Rooms | 795 (14.5%) | 19 (1.4%) |
| Total | 5,493 (100.0%) | 1,318 (100.0%) |
Housing Structure by Heating Type in Tyler County
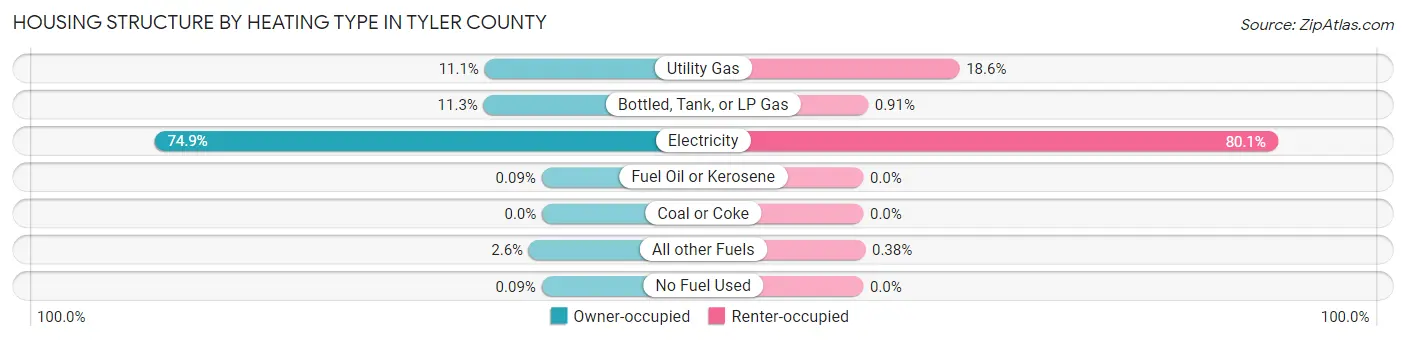
| Heating Type | Owner-occupied | Renter-occupied |
| Utility Gas | 609 (11.1%) | 245 (18.6%) |
| Bottled, Tank, or LP Gas | 620 (11.3%) | 12 (0.9%) |
| Electricity | 4,114 (74.9%) | 1,056 (80.1%) |
| Fuel Oil or Kerosene | 5 (0.1%) | 0 (0.0%) |
| Coal or Coke | 0 (0.0%) | 0 (0.0%) |
| All other Fuels | 140 (2.5%) | 5 (0.4%) |
| No Fuel Used | 5 (0.1%) | 0 (0.0%) |
| Total | 5,493 (100.0%) | 1,318 (100.0%) |
Household Vehicle Usage in Tyler County
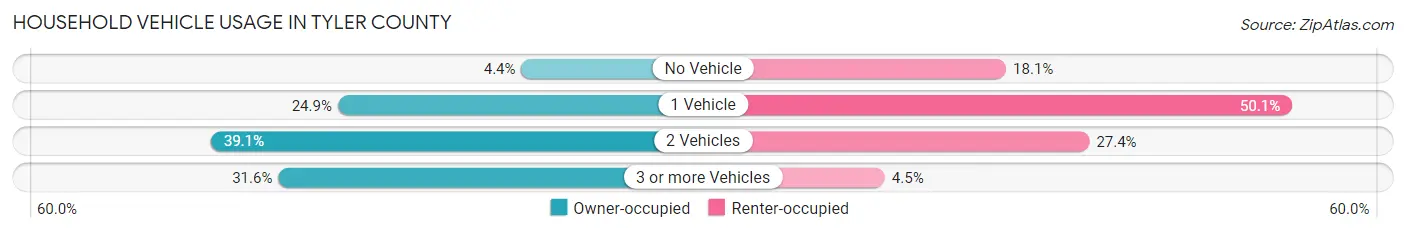
| Vehicles per Household | Owner-occupied | Renter-occupied |
| No Vehicle | 239 (4.3%) | 238 (18.1%) |
| 1 Vehicle | 1,369 (24.9%) | 660 (50.1%) |
| 2 Vehicles | 2,150 (39.1%) | 361 (27.4%) |
| 3 or more Vehicles | 1,735 (31.6%) | 59 (4.5%) |
| Total | 5,493 (100.0%) | 1,318 (100.0%) |
Real Estate & Mortgages in Tyler County
Real Estate and Mortgage Overview in Tyler County
| Characteristic | Without Mortgage | With Mortgage |
| Housing Units | 3,447 | 2,046 |
| Median Property Value | $116,300 | $136,500 |
| Median Household Income | $46,196 | $290 |
| Monthly Housing Costs | $445 | $39 |
| Real Estate Taxes | $1,051 | $133 |
Property Value by Mortgage Status in Tyler County
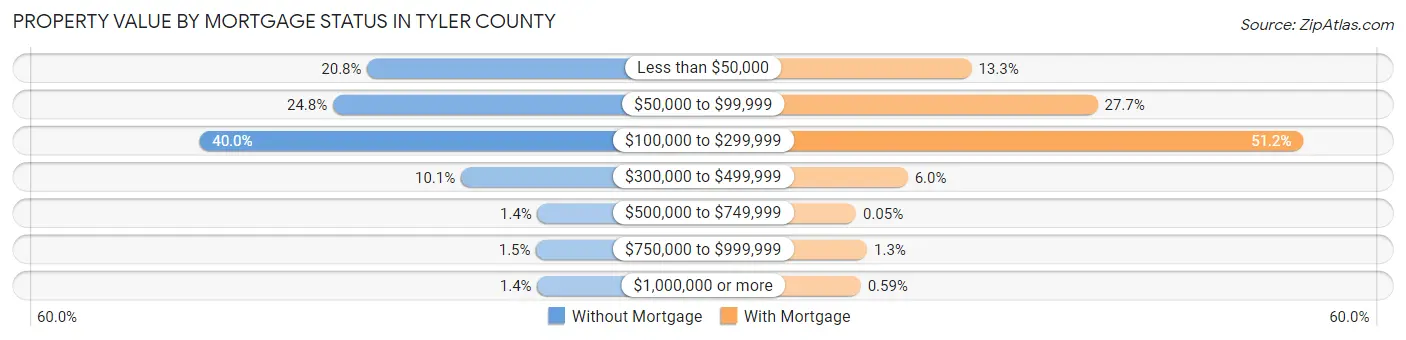
| Property Value | Without Mortgage | With Mortgage |
| Less than $50,000 | 718 (20.8%) | 271 (13.3%) |
| $50,000 to $99,999 | 853 (24.7%) | 566 (27.7%) |
| $100,000 to $299,999 | 1,380 (40.0%) | 1,047 (51.2%) |
| $300,000 to $499,999 | 349 (10.1%) | 122 (6.0%) |
| $500,000 to $749,999 | 47 (1.4%) | 1 (0.1%) |
| $750,000 to $999,999 | 52 (1.5%) | 27 (1.3%) |
| $1,000,000 or more | 48 (1.4%) | 12 (0.6%) |
| Total | 3,447 (100.0%) | 2,046 (100.0%) |
Household Income by Mortgage Status in Tyler County
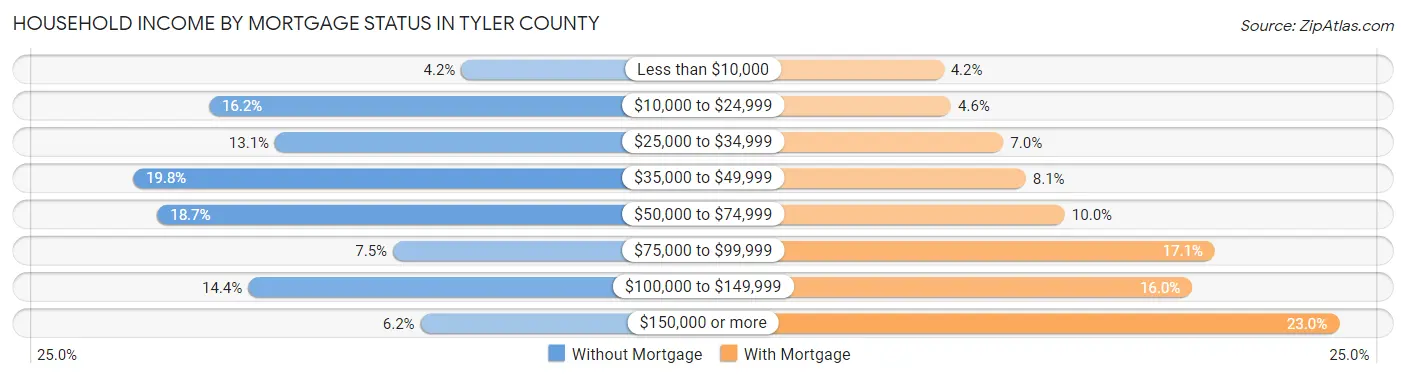
| Household Income | Without Mortgage | With Mortgage |
| Less than $10,000 | 145 (4.2%) | 86 (4.2%) |
| $10,000 to $24,999 | 559 (16.2%) | 93 (4.5%) |
| $25,000 to $34,999 | 451 (13.1%) | 144 (7.0%) |
| $35,000 to $49,999 | 684 (19.8%) | 166 (8.1%) |
| $50,000 to $74,999 | 644 (18.7%) | 204 (10.0%) |
| $75,000 to $99,999 | 257 (7.5%) | 350 (17.1%) |
| $100,000 to $149,999 | 495 (14.4%) | 328 (16.0%) |
| $150,000 or more | 212 (6.1%) | 471 (23.0%) |
| Total | 3,447 (100.0%) | 2,046 (100.0%) |
Property Value to Household Income Ratio in Tyler County
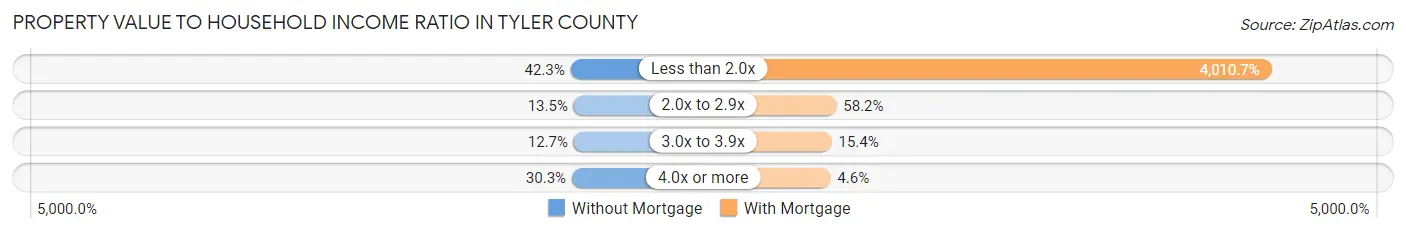
| Value-to-Income Ratio | Without Mortgage | With Mortgage |
| Less than 2.0x | 1,458 (42.3%) | 82,059 (4,010.7%) |
| 2.0x to 2.9x | 464 (13.5%) | 1,191 (58.2%) |
| 3.0x to 3.9x | 439 (12.7%) | 314 (15.3%) |
| 4.0x or more | 1,045 (30.3%) | 93 (4.5%) |
| Total | 3,447 (100.0%) | 2,046 (100.0%) |
Real Estate Taxes by Mortgage Status in Tyler County
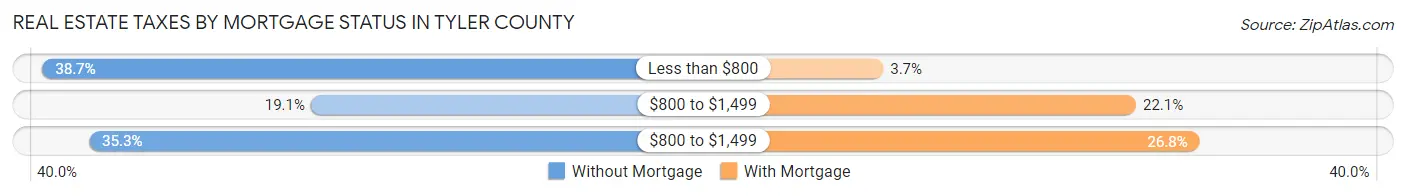
| Property Taxes | Without Mortgage | With Mortgage |
| Less than $800 | 1,334 (38.7%) | 75 (3.7%) |
| $800 to $1,499 | 658 (19.1%) | 453 (22.1%) |
| $800 to $1,499 | 1,216 (35.3%) | 548 (26.8%) |
| Total | 3,447 (100.0%) | 2,046 (100.0%) |
Health & Disability in Tyler County
Health Insurance Coverage by Age in Tyler County
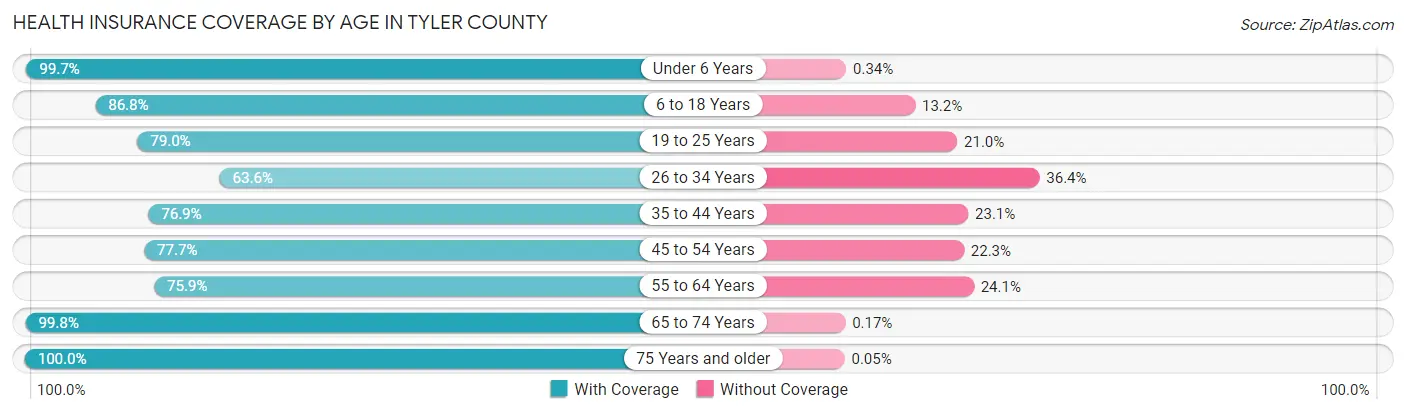
| Age Bracket | With Coverage | Without Coverage |
| Under 6 Years | 887 (99.7%) | 3 (0.3%) |
| 6 to 18 Years | 2,658 (86.8%) | 404 (13.2%) |
| 19 to 25 Years | 1,081 (79.0%) | 288 (21.0%) |
| 26 to 34 Years | 1,009 (63.6%) | 577 (36.4%) |
| 35 to 44 Years | 1,402 (76.9%) | 421 (23.1%) |
| 45 to 54 Years | 1,707 (77.7%) | 490 (22.3%) |
| 55 to 64 Years | 2,046 (75.9%) | 651 (24.1%) |
| 65 to 74 Years | 2,375 (99.8%) | 4 (0.2%) |
| 75 Years and older | 1,828 (100.0%) | 1 (0.1%) |
| Total | 14,993 (84.1%) | 2,839 (15.9%) |
Health Insurance Coverage by Citizenship Status in Tyler County
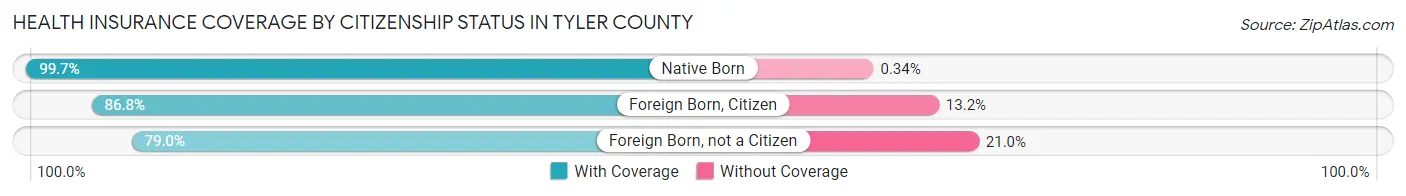
| Citizenship Status | With Coverage | Without Coverage |
| Native Born | 887 (99.7%) | 3 (0.3%) |
| Foreign Born, Citizen | 2,658 (86.8%) | 404 (13.2%) |
| Foreign Born, not a Citizen | 1,081 (79.0%) | 288 (21.0%) |
Health Insurance Coverage by Household Income in Tyler County
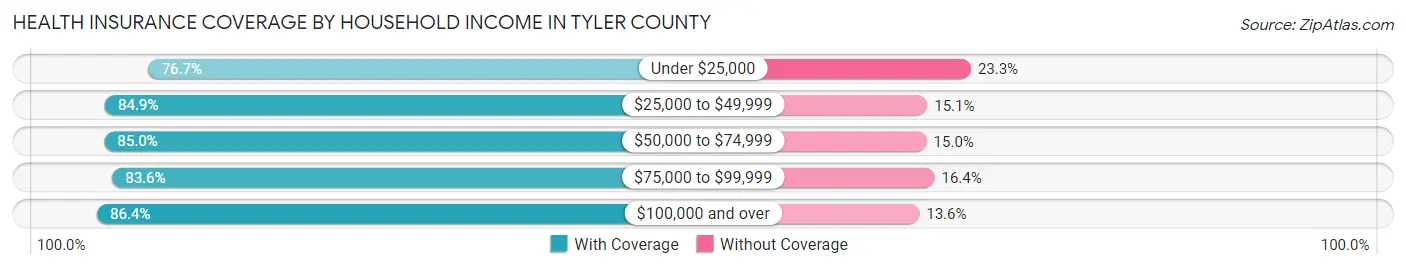
| Household Income | With Coverage | Without Coverage |
| Under $25,000 | 1,933 (76.7%) | 586 (23.3%) |
| $25,000 to $49,999 | 4,067 (84.9%) | 723 (15.1%) |
| $50,000 to $74,999 | 2,541 (85.0%) | 447 (15.0%) |
| $75,000 to $99,999 | 1,723 (83.6%) | 339 (16.4%) |
| $100,000 and over | 4,729 (86.4%) | 744 (13.6%) |
Public vs Private Health Insurance Coverage by Age in Tyler County
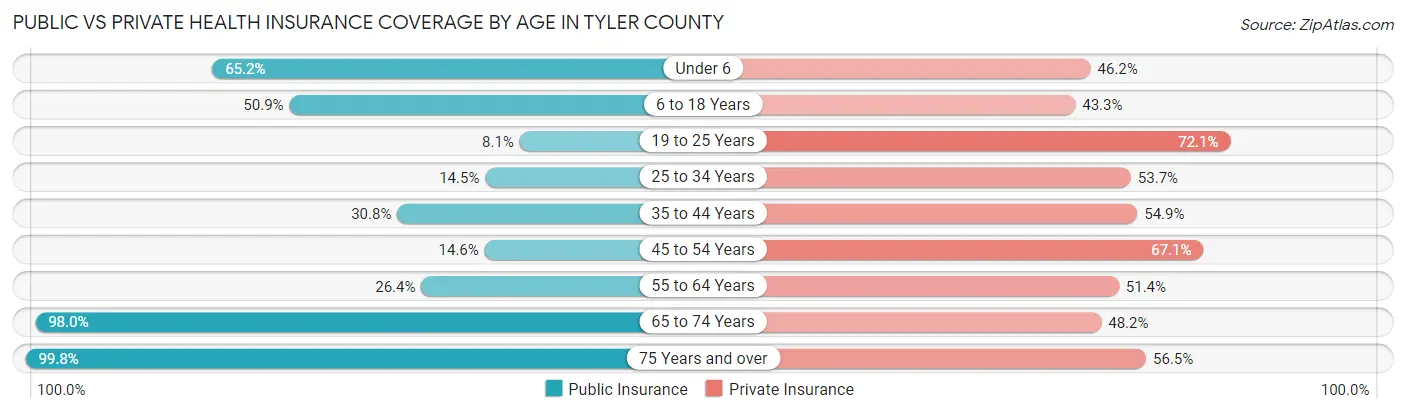
| Age Bracket | Public Insurance | Private Insurance |
| Under 6 | 580 (65.2%) | 411 (46.2%) |
| 6 to 18 Years | 1,557 (50.8%) | 1,327 (43.3%) |
| 19 to 25 Years | 111 (8.1%) | 987 (72.1%) |
| 25 to 34 Years | 230 (14.5%) | 851 (53.7%) |
| 35 to 44 Years | 562 (30.8%) | 1,000 (54.8%) |
| 45 to 54 Years | 321 (14.6%) | 1,474 (67.1%) |
| 55 to 64 Years | 711 (26.4%) | 1,387 (51.4%) |
| 65 to 74 Years | 2,332 (98.0%) | 1,146 (48.2%) |
| 75 Years and over | 1,826 (99.8%) | 1,033 (56.5%) |
| Total | 8,230 (46.2%) | 9,616 (53.9%) |
Disability Status by Sex by Age in Tyler County
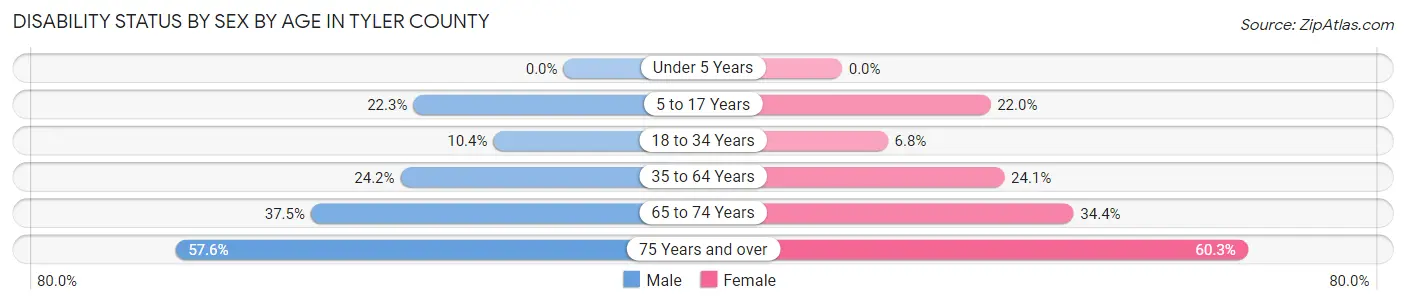
| Age Bracket | Male | Female |
| Under 5 Years | 0 (0.0%) | 0 (0.0%) |
| 5 to 17 Years | 351 (22.3%) | 318 (22.0%) |
| 18 to 34 Years | 168 (10.4%) | 102 (6.8%) |
| 35 to 64 Years | 782 (24.2%) | 840 (24.1%) |
| 65 to 74 Years | 432 (37.5%) | 422 (34.4%) |
| 75 Years and over | 487 (57.6%) | 593 (60.3%) |
Disability Class by Sex by Age in Tyler County
Disability Class: Hearing Difficulty
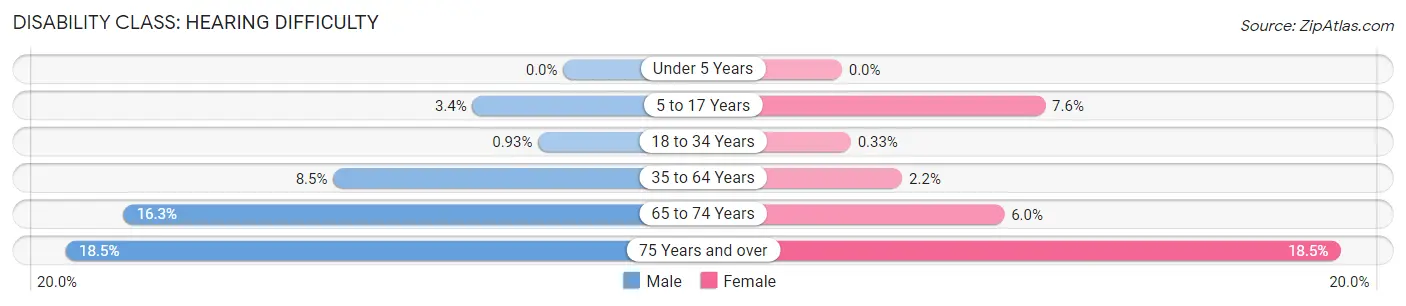
| Age Bracket | Male | Female |
| Under 5 Years | 0 (0.0%) | 0 (0.0%) |
| 5 to 17 Years | 53 (3.4%) | 109 (7.5%) |
| 18 to 34 Years | 15 (0.9%) | 5 (0.3%) |
| 35 to 64 Years | 276 (8.5%) | 78 (2.2%) |
| 65 to 74 Years | 188 (16.3%) | 74 (6.0%) |
| 75 Years and over | 156 (18.5%) | 182 (18.5%) |
Disability Class: Vision Difficulty
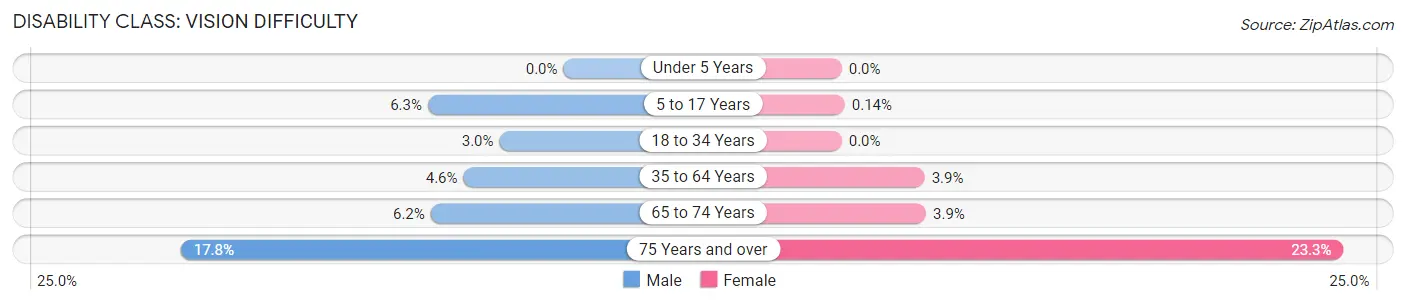
| Age Bracket | Male | Female |
| Under 5 Years | 0 (0.0%) | 0 (0.0%) |
| 5 to 17 Years | 99 (6.3%) | 2 (0.1%) |
| 18 to 34 Years | 48 (3.0%) | 0 (0.0%) |
| 35 to 64 Years | 150 (4.6%) | 134 (3.8%) |
| 65 to 74 Years | 71 (6.2%) | 48 (3.9%) |
| 75 Years and over | 150 (17.7%) | 229 (23.3%) |
Disability Class: Cognitive Difficulty
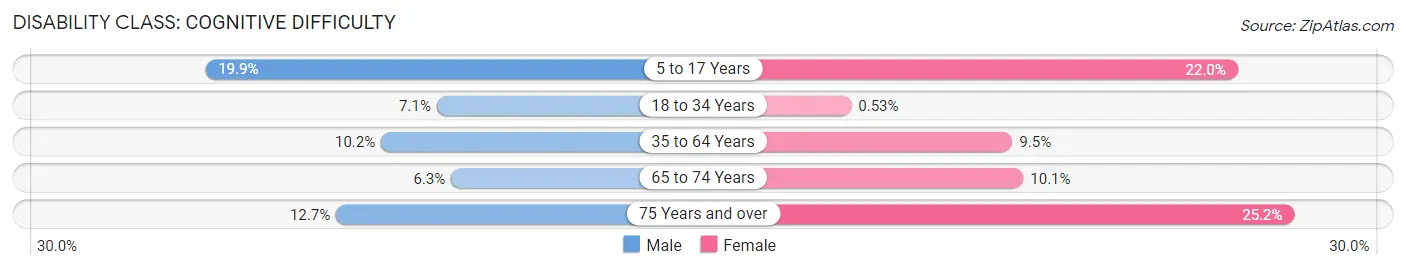
| Age Bracket | Male | Female |
| 5 to 17 Years | 314 (19.9%) | 318 (22.0%) |
| 18 to 34 Years | 114 (7.0%) | 8 (0.5%) |
| 35 to 64 Years | 328 (10.2%) | 331 (9.5%) |
| 65 to 74 Years | 72 (6.2%) | 124 (10.1%) |
| 75 Years and over | 107 (12.7%) | 248 (25.2%) |
Disability Class: Ambulatory Difficulty
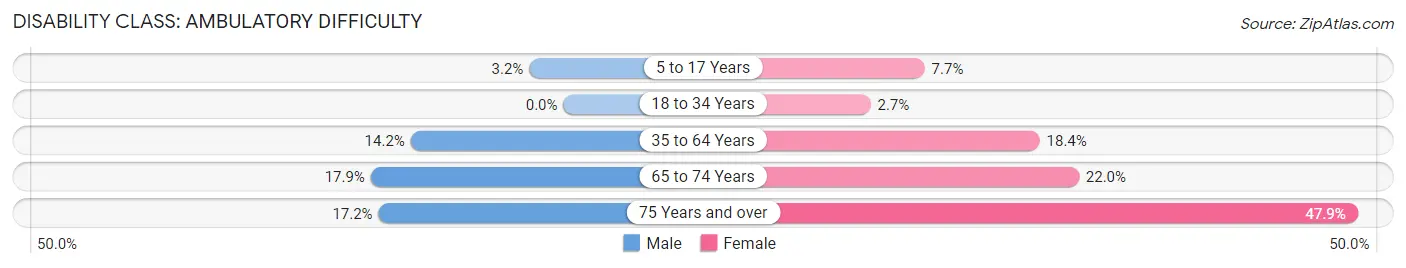
| Age Bracket | Male | Female |
| 5 to 17 Years | 50 (3.2%) | 111 (7.7%) |
| 18 to 34 Years | 0 (0.0%) | 40 (2.7%) |
| 35 to 64 Years | 458 (14.2%) | 640 (18.4%) |
| 65 to 74 Years | 206 (17.9%) | 270 (22.0%) |
| 75 Years and over | 145 (17.2%) | 471 (47.9%) |
Disability Class: Self-Care Difficulty
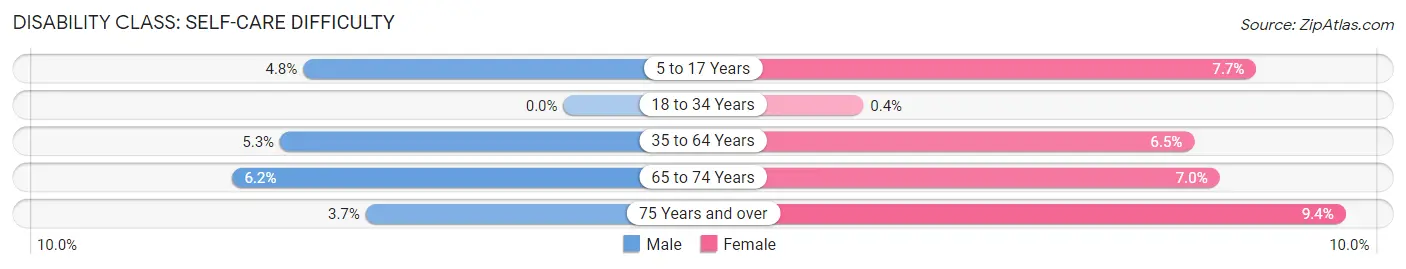
| Age Bracket | Male | Female |
| 5 to 17 Years | 76 (4.8%) | 111 (7.7%) |
| 18 to 34 Years | 0 (0.0%) | 6 (0.4%) |
| 35 to 64 Years | 170 (5.3%) | 228 (6.5%) |
| 65 to 74 Years | 71 (6.2%) | 86 (7.0%) |
| 75 Years and over | 31 (3.7%) | 92 (9.3%) |
Technology Access in Tyler County
Computing Device Access in Tyler County
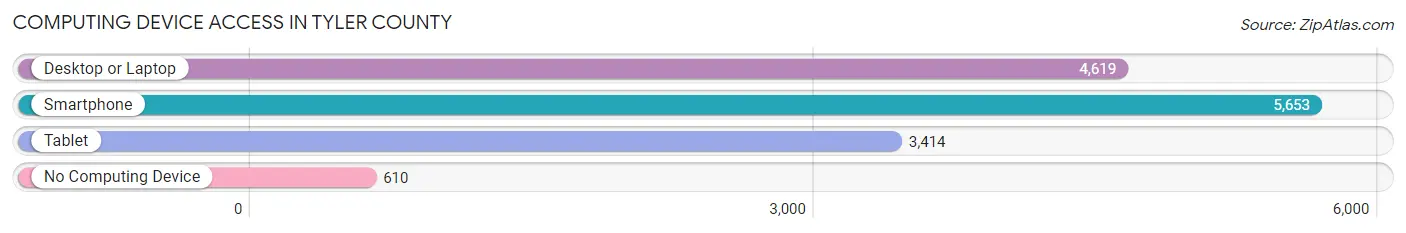
| Device Type | # Households | % Households |
| Desktop or Laptop | 4,619 | 67.8% |
| Smartphone | 5,653 | 83.0% |
| Tablet | 3,414 | 50.1% |
| No Computing Device | 610 | 9.0% |
| Total | 6,811 | 100.0% |
Internet Access in Tyler County
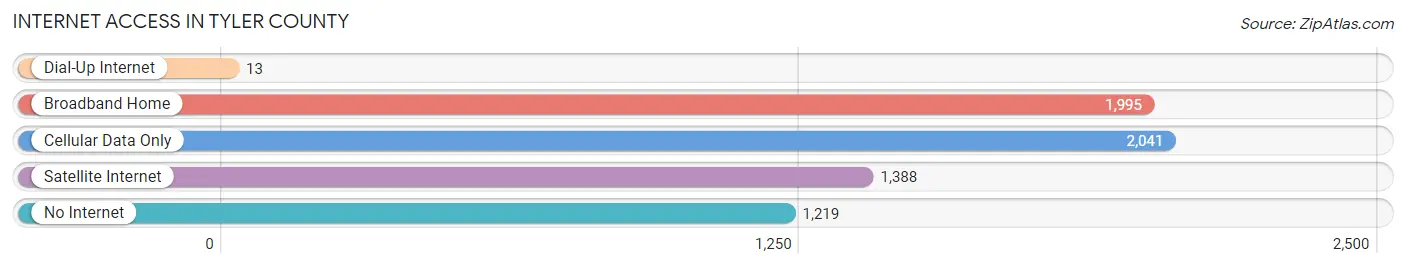
| Internet Type | # Households | % Households |
| Dial-Up Internet | 13 | 0.2% |
| Broadband Home | 1,995 | 29.3% |
| Cellular Data Only | 2,041 | 30.0% |
| Satellite Internet | 1,388 | 20.4% |
| No Internet | 1,219 | 17.9% |
| Total | 6,811 | 100.0% |
Tyler County Summary
Tyler County is located in the eastern part of Texas, in the United States. It is part of the Beaumont-Port Arthur Metropolitan Statistical Area and is bordered by Hardin County to the north, Jasper County to the east, Newton County to the south, and Liberty County to the west. The county seat is Woodville, and the largest city is Warren.
History
Tyler County was established in 1846 and named for John Tyler, the tenth President of the United States. The county was originally part of Liberty County, but was later divided into its own county. The first settlers in the area were mostly from the southern states, and the county was largely agricultural.
In the late 19th century, the lumber industry began to take off in Tyler County, and the area became known for its sawmills and timber production. The county also became a center for oil production in the early 20th century, and the economy shifted to focus on oil and gas.
Geography
Tyler County is located in the eastern part of Texas, and covers an area of 845 square miles. The terrain is mostly flat, with some rolling hills in the northern part of the county. The county is drained by the Neches River, which flows through the county from north to south.
The climate of Tyler County is humid subtropical, with hot summers and mild winters. The average annual temperature is 68°F, and the average annual precipitation is 45 inches.
Economy
The economy of Tyler County is largely based on oil and gas production, as well as timber and lumber production. The county is also home to several manufacturing companies, including a paper mill and a chemical plant.
The unemployment rate in Tyler County is 4.2%, which is lower than the national average. The median household income is $45,845, which is slightly higher than the national average.
Demographics
As of the 2010 census, the population of Tyler County was 21,766. The population is mostly white (78.3%), with a small African American population (14.2%) and a small Hispanic population (5.3%).
The median age in Tyler County is 41.3, and the median household income is $45,845. The poverty rate is 17.2%, which is higher than the national average.
Conclusion
Tyler County is located in the eastern part of Texas, and is part of the Beaumont-Port Arthur Metropolitan Statistical Area. The county was established in 1846 and is named for John Tyler, the tenth President of the United States. The economy of Tyler County is largely based on oil and gas production, as well as timber and lumber production. The population of Tyler County is 21,766, and the median household income is $45,845.
Common Questions
What is Per Capita Income in Tyler County?
Per Capita income in Tyler County is $29,594.
What is the Median Family Income in Tyler County?
Median Family Income in Tyler County is $61,651.
What is the Median Household income in Tyler County?
Median Household Income in Tyler County is $50,898.
What is Income or Wage Gap in Tyler County?
Income or Wage Gap in Tyler County is 47.1%.
Women in Tyler County earn 52.9 cents for every dollar earned by a man.
What is Family Income Deficit in Tyler County?
Family Income Deficit in Tyler County is $11,358.
Families that are below poverty line in Tyler County earn $11,358 less on average than the poverty threshold level.
What is Inequality or Gini Index in Tyler County?
Inequality or Gini Index in Tyler County is 0.52.
What is the Total Population of Tyler County?
Total Population of Tyler County is 19,962.
What is the Total Male Population of Tyler County?
Total Male Population of Tyler County is 10,828.
What is the Total Female Population of Tyler County?
Total Female Population of Tyler County is 9,134.
What is the Ratio of Males per 100 Females in Tyler County?
There are 118.55 Males per 100 Females in Tyler County.
What is the Ratio of Females per 100 Males in Tyler County?
There are 84.36 Females per 100 Males in Tyler County.
What is the Median Population Age in Tyler County?
Median Population Age in Tyler County is 42.6 Years.
What is the Average Family Size in Tyler County
Average Family Size in Tyler County is 3.2 People.
What is the Average Household Size in Tyler County
Average Household Size in Tyler County is 2.6 People.
How Large is the Labor Force in Tyler County?
There are 7,237 People in the Labor Forcein in Tyler County.
What is the Percentage of People in the Labor Force in Tyler County?
43.4% of People are in the Labor Force in Tyler County.
What is the Unemployment Rate in Tyler County?
Unemployment Rate in Tyler County is 12.6%.