Trinity County, TX Map & Demographics
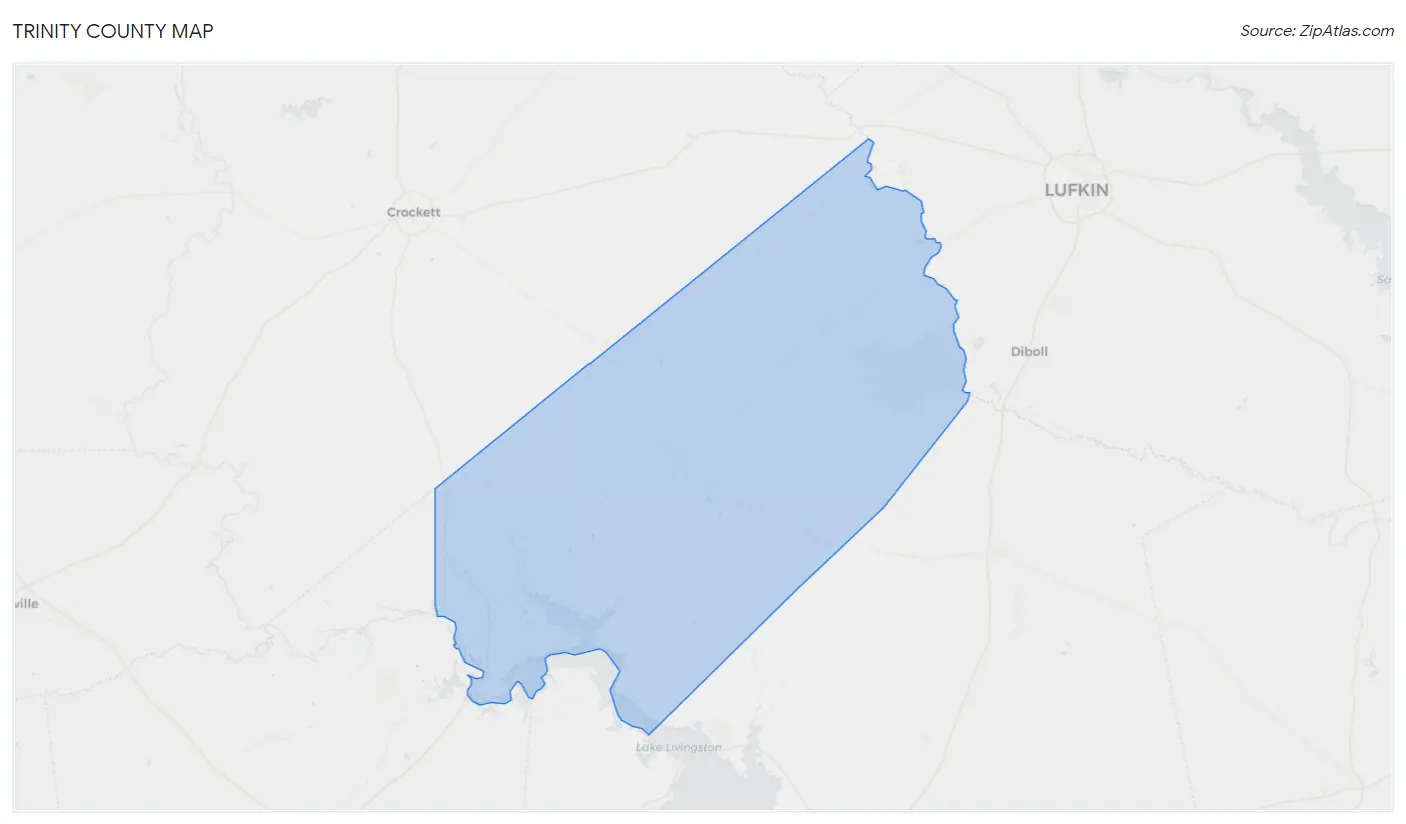
Trinity County Map
Trinity County Overview
$30,911
PER CAPITA INCOME
$66,215
AVG FAMILY INCOME
$51,165
AVG HOUSEHOLD INCOME
35.7%
WAGE / INCOME GAP [ % ]
64.3¢/ $1
WAGE / INCOME GAP [ $ ]
$12,641
FAMILY INCOME DEFICIT
0.46
INEQUALITY / GINI INDEX
13,735
TOTAL POPULATION
6,786
MALE POPULATION
6,949
FEMALE POPULATION
97.65
MALES / 100 FEMALES
102.40
FEMALES / 100 MALES
50.1
MEDIAN AGE
2.8
AVG FAMILY SIZE
2.3
AVG HOUSEHOLD SIZE
5,372
LABOR FORCE [ PEOPLE ]
47.2%
PERCENT IN LABOR FORCE
7.0%
UNEMPLOYMENT RATE
Trinity County Area Codes
Income in Trinity County
Income Overview in Trinity County
Per Capita Income in Trinity County is $30,911, while median incomes of families and households are $66,215 and $51,165 respectively.
| Characteristic | Number | Measure |
| Per Capita Income | 13,735 | $30,911 |
| Median Family Income | 3,954 | $66,215 |
| Mean Family Income | 3,954 | $84,466 |
| Median Household Income | 5,946 | $51,165 |
| Mean Household Income | 5,946 | $71,207 |
| Income Deficit | 3,954 | $12,641 |
| Wage / Income Gap (%) | 13,735 | 35.72% |
| Wage / Income Gap ($) | 13,735 | 64.28¢ per $1 |
| Gini / Inequality Index | 13,735 | 0.46 |
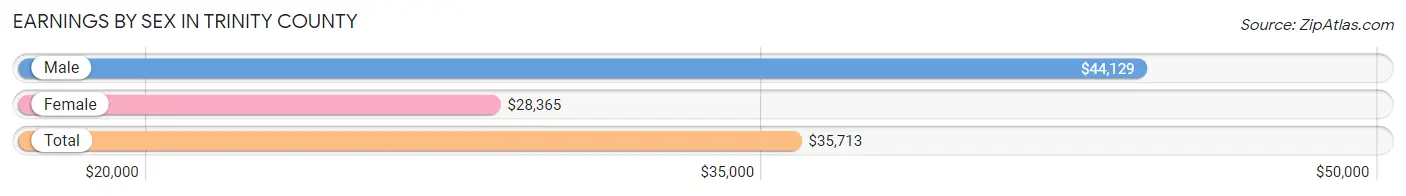
Earnings by Sex in Trinity County
Average Earnings in Trinity County are $35,713, $44,129 for men and $28,365 for women, a difference of 35.7%.
| Sex | Number | Average Earnings |
| Male | 3,093 (52.4%) | $44,129 |
| Female | 2,814 (47.6%) | $28,365 |
| Total | 5,907 (100.0%) | $35,713 |
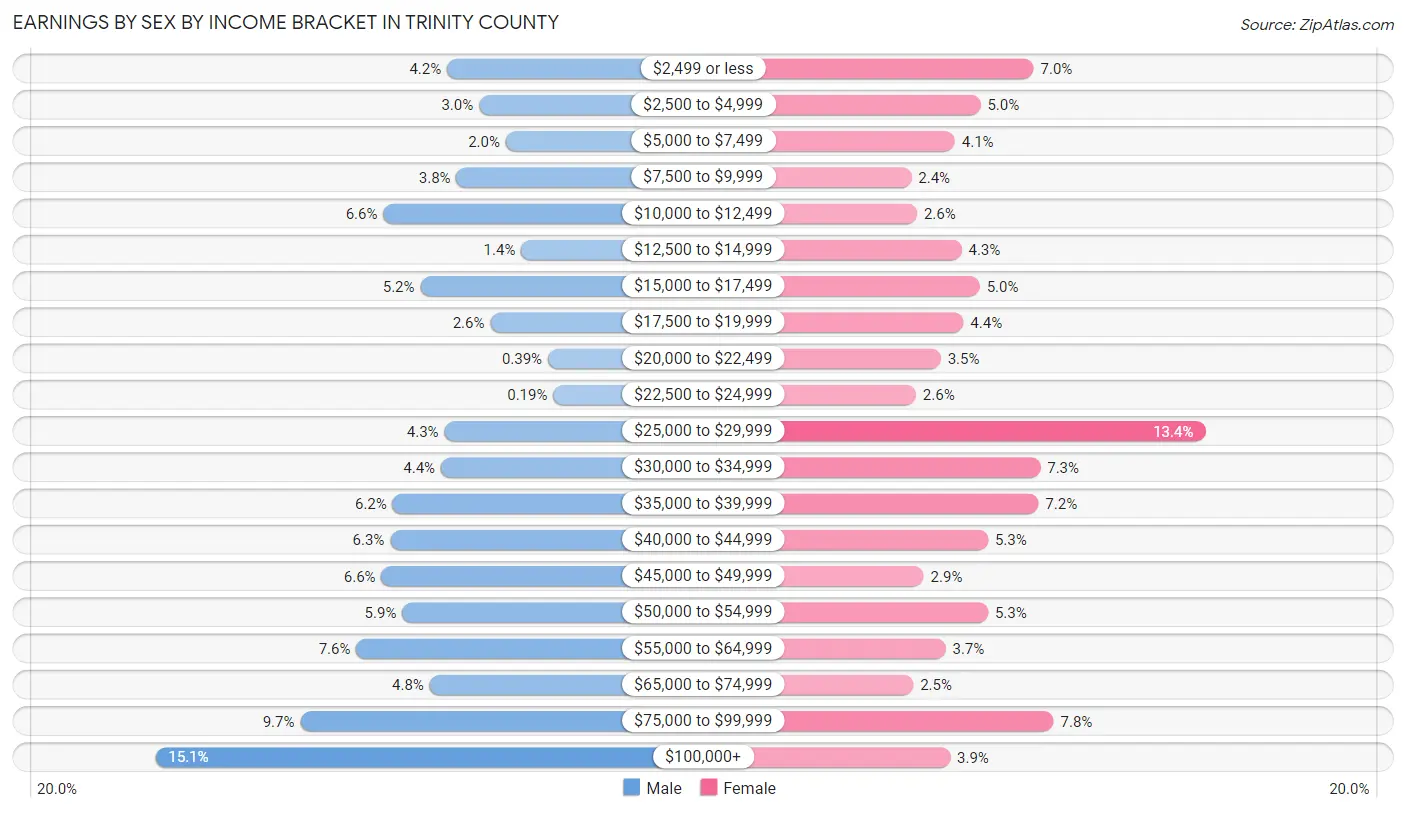
Earnings by Sex by Income Bracket in Trinity County
The most common earnings brackets in Trinity County are $100,000+ for men (467 | 15.1%) and $25,000 to $29,999 for women (378 | 13.4%).
| Income | Male | Female |
| $2,499 or less | 129 (4.2%) | 197 (7.0%) |
| $2,500 to $4,999 | 92 (3.0%) | 141 (5.0%) |
| $5,000 to $7,499 | 61 (2.0%) | 114 (4.1%) |
| $7,500 to $9,999 | 118 (3.8%) | 68 (2.4%) |
| $10,000 to $12,499 | 203 (6.6%) | 74 (2.6%) |
| $12,500 to $14,999 | 43 (1.4%) | 121 (4.3%) |
| $15,000 to $17,499 | 160 (5.2%) | 140 (5.0%) |
| $17,500 to $19,999 | 79 (2.5%) | 123 (4.4%) |
| $20,000 to $22,499 | 12 (0.4%) | 99 (3.5%) |
| $22,500 to $24,999 | 6 (0.2%) | 73 (2.6%) |
| $25,000 to $29,999 | 132 (4.3%) | 378 (13.4%) |
| $30,000 to $34,999 | 136 (4.4%) | 204 (7.2%) |
| $35,000 to $39,999 | 192 (6.2%) | 202 (7.2%) |
| $40,000 to $44,999 | 195 (6.3%) | 149 (5.3%) |
| $45,000 to $49,999 | 205 (6.6%) | 81 (2.9%) |
| $50,000 to $54,999 | 181 (5.9%) | 149 (5.3%) |
| $55,000 to $64,999 | 234 (7.6%) | 104 (3.7%) |
| $65,000 to $74,999 | 149 (4.8%) | 70 (2.5%) |
| $75,000 to $99,999 | 299 (9.7%) | 218 (7.7%) |
| $100,000+ | 467 (15.1%) | 109 (3.9%) |
| Total | 3,093 (100.0%) | 2,814 (100.0%) |
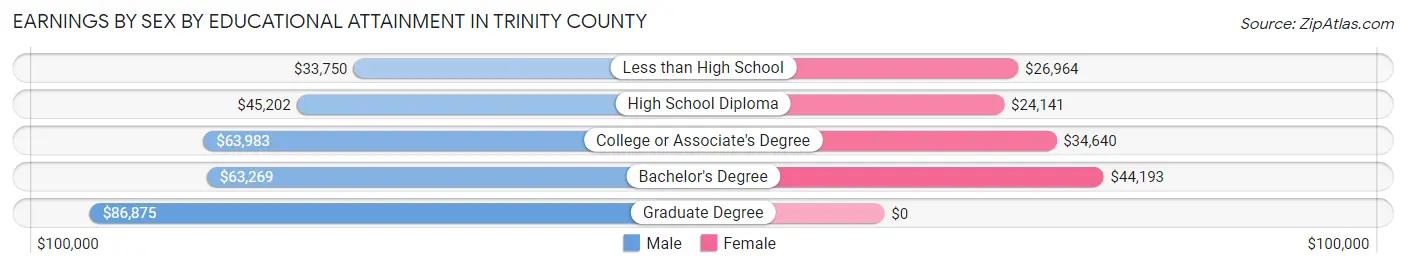
Earnings by Sex by Educational Attainment in Trinity County
Average earnings in Trinity County are $46,969 for men and $29,513 for women, a difference of 37.2%. Men with an educational attainment of graduate degree enjoy the highest average annual earnings of $86,875, while those with less than high school education earn the least with $33,750. Women with an educational attainment of bachelor's degree earn the most with the average annual earnings of $44,193, while those with high school diploma education have the smallest earnings of $24,141.
| Educational Attainment | Male Income | Female Income |
| Less than High School | $33,750 | $26,964 |
| High School Diploma | $45,202 | $24,141 |
| College or Associate's Degree | $63,983 | $34,640 |
| Bachelor's Degree | $63,269 | $44,193 |
| Graduate Degree | $86,875 | $0 |
| Total | $46,969 | $29,513 |
Family Income in Trinity County
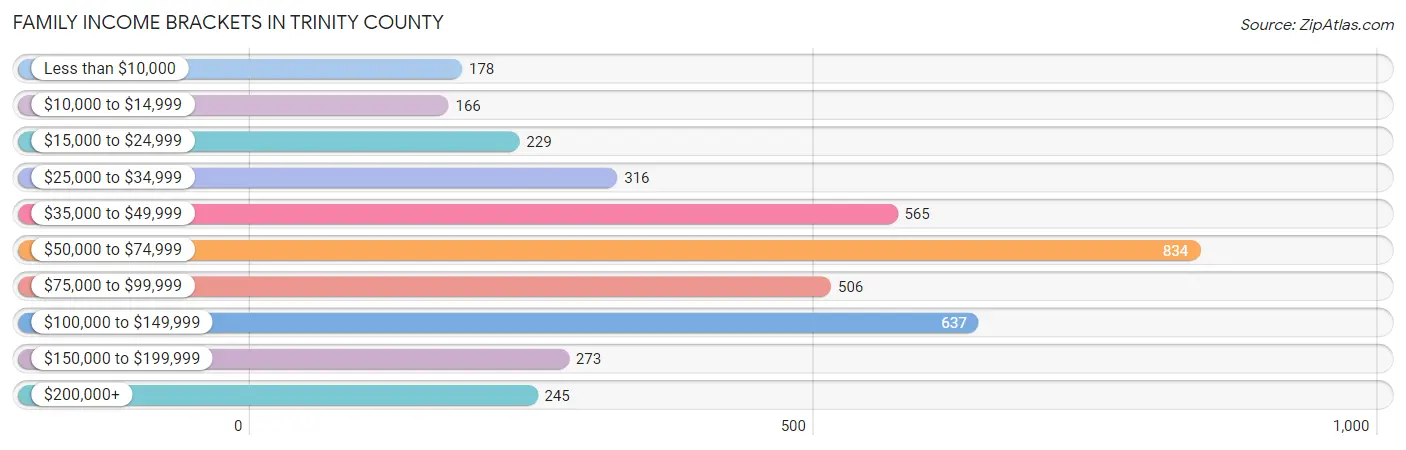
Family Income Brackets in Trinity County
According to the Trinity County family income data, there are 834 families falling into the $50,000 to $74,999 income range, which is the most common income bracket and makes up 21.1% of all families. Conversely, the $10,000 to $14,999 income bracket is the least frequent group with only 166 families (4.2%) belonging to this category.
| Income Bracket | # Families | % Families |
| Less than $10,000 | 178 | 4.5% |
| $10,000 to $14,999 | 166 | 4.2% |
| $15,000 to $24,999 | 229 | 5.8% |
| $25,000 to $34,999 | 316 | 8.0% |
| $35,000 to $49,999 | 565 | 14.3% |
| $50,000 to $74,999 | 834 | 21.1% |
| $75,000 to $99,999 | 506 | 12.8% |
| $100,000 to $149,999 | 637 | 16.1% |
| $150,000 to $199,999 | 273 | 6.9% |
| $200,000+ | 245 | 6.2% |
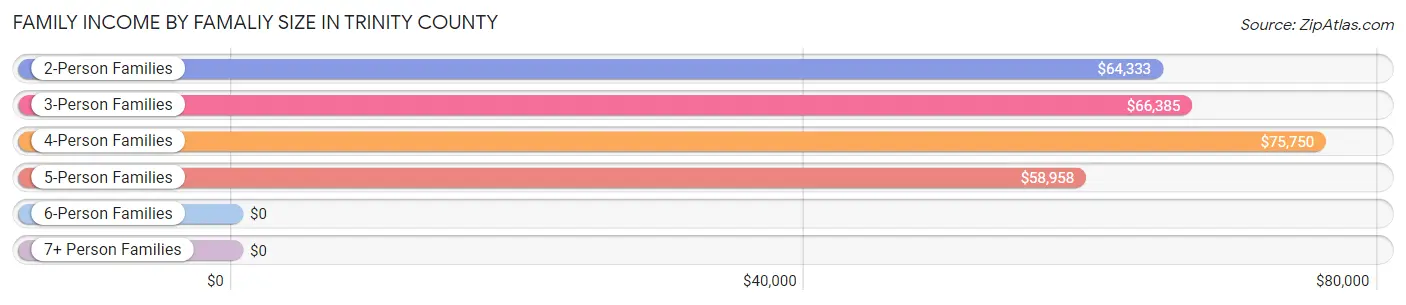
Family Income by Famaliy Size in Trinity County
4-person families (566 | 14.3%) account for the highest median family income in Trinity County with $75,750 per family, while 2-person families (2,244 | 56.8%) have the highest median income of $32,166 per family member.
| Income Bracket | # Families | Median Income |
| 2-Person Families | 2,244 (56.8%) | $64,333 |
| 3-Person Families | 907 (22.9%) | $66,385 |
| 4-Person Families | 566 (14.3%) | $75,750 |
| 5-Person Families | 152 (3.8%) | $58,958 |
| 6-Person Families | 55 (1.4%) | $0 |
| 7+ Person Families | 30 (0.8%) | $0 |
| Total | 3,954 (100.0%) | $66,215 |
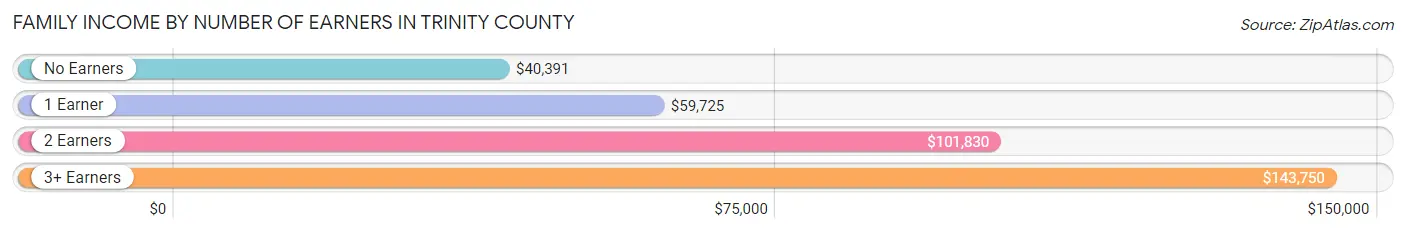
Family Income by Number of Earners in Trinity County
The median family income in Trinity County is $66,215, with families comprising 3+ earners (204) having the highest median family income of $143,750, while families with no earners (1,041) have the lowest median family income of $40,391, accounting for 5.2% and 26.3% of families, respectively.
| Number of Earners | # Families | Median Income |
| No Earners | 1,041 (26.3%) | $40,391 |
| 1 Earner | 1,529 (38.7%) | $59,725 |
| 2 Earners | 1,180 (29.8%) | $101,830 |
| 3+ Earners | 204 (5.2%) | $143,750 |
| Total | 3,954 (100.0%) | $66,215 |
Household Income in Trinity County
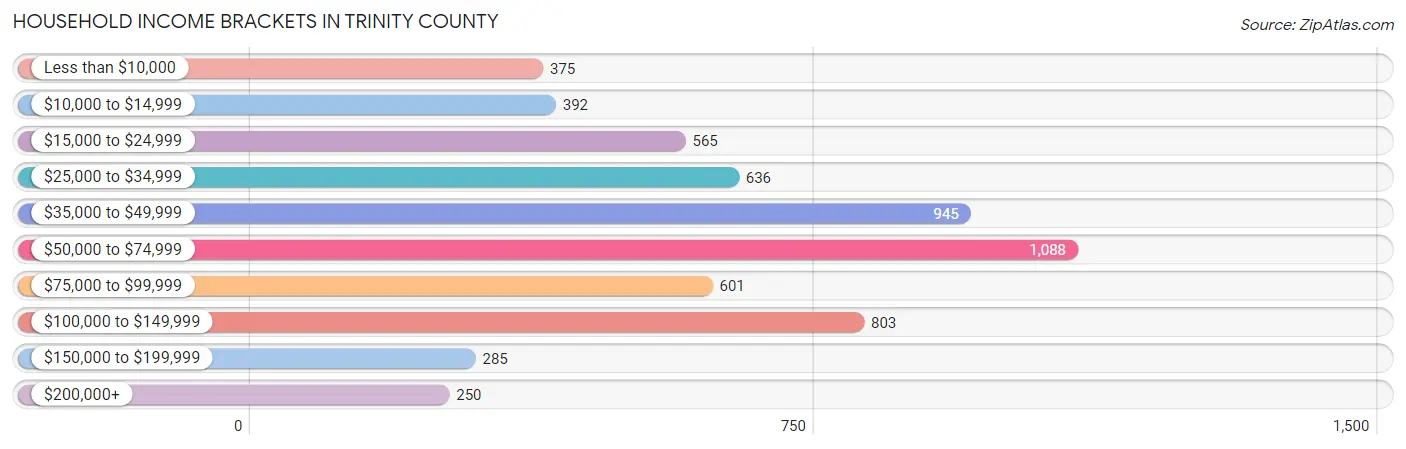
Household Income Brackets in Trinity County
With 1,088 households falling in the category, the $50,000 to $74,999 income range is the most frequent in Trinity County, accounting for 18.3% of all households. In contrast, only 250 households (4.2%) fall into the $200,000+ income bracket, making it the least populous group.
| Income Bracket | # Households | % Households |
| Less than $10,000 | 375 | 6.3% |
| $10,000 to $14,999 | 392 | 6.6% |
| $15,000 to $24,999 | 565 | 9.5% |
| $25,000 to $34,999 | 636 | 10.7% |
| $35,000 to $49,999 | 945 | 15.9% |
| $50,000 to $74,999 | 1,088 | 18.3% |
| $75,000 to $99,999 | 601 | 10.1% |
| $100,000 to $149,999 | 803 | 13.5% |
| $150,000 to $199,999 | 285 | 4.8% |
| $200,000+ | 250 | 4.2% |
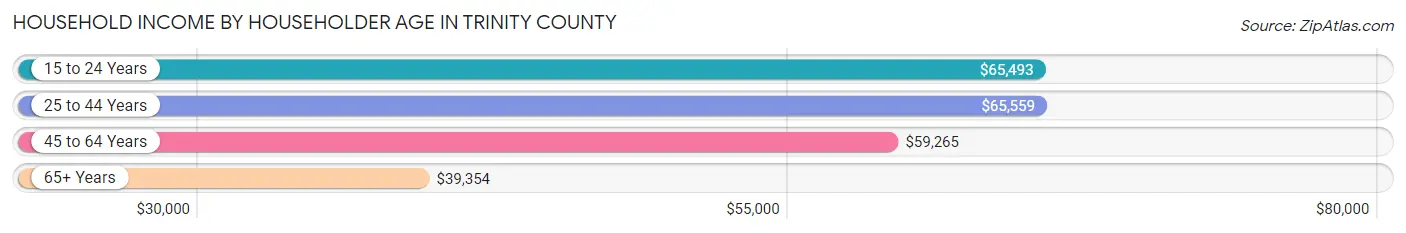
Household Income by Householder Age in Trinity County
The median household income in Trinity County is $51,165, with the highest median household income of $65,559 found in the 25 to 44 years age bracket for the primary householder. A total of 1,145 households (19.3%) fall into this category. Meanwhile, the 65+ years age bracket for the primary householder has the lowest median household income of $39,354, with 2,246 households (37.8%) in this group.
| Income Bracket | # Households | Median Income |
| 15 to 24 Years | 263 (4.4%) | $65,493 |
| 25 to 44 Years | 1,145 (19.3%) | $65,559 |
| 45 to 64 Years | 2,292 (38.6%) | $59,265 |
| 65+ Years | 2,246 (37.8%) | $39,354 |
| Total | 5,946 (100.0%) | $51,165 |
Poverty in Trinity County
Income Below Poverty by Sex and Age in Trinity County
With 13.5% poverty level for males and 14.9% for females among the residents of Trinity County, 16 and 17 year old males and 16 and 17 year old females are the most vulnerable to poverty, with 92 males (43.2%) and 62 females (44.3%) in their respective age groups living below the poverty level.
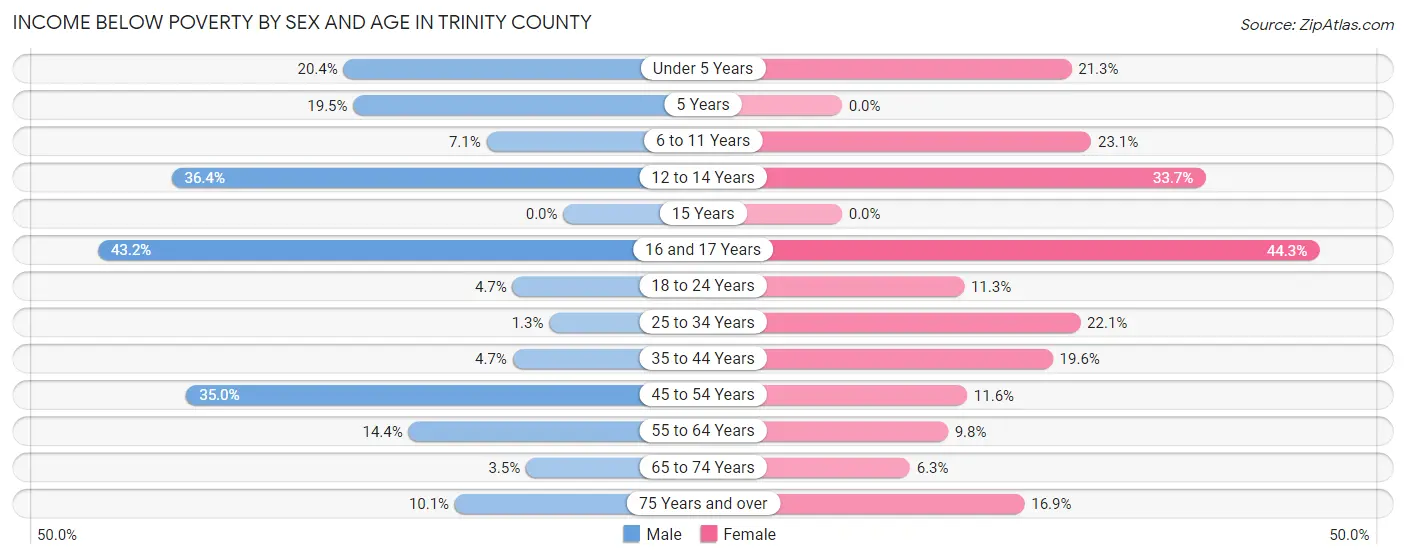
| Age Bracket | Male | Female |
| Under 5 Years | 61 (20.4%) | 72 (21.3%) |
| 5 Years | 23 (19.5%) | 0 (0.0%) |
| 6 to 11 Years | 30 (7.1%) | 68 (23.1%) |
| 12 to 14 Years | 96 (36.4%) | 87 (33.7%) |
| 15 Years | 0 (0.0%) | 0 (0.0%) |
| 16 and 17 Years | 92 (43.2%) | 62 (44.3%) |
| 18 to 24 Years | 24 (4.7%) | 61 (11.3%) |
| 25 to 34 Years | 7 (1.3%) | 138 (22.1%) |
| 35 to 44 Years | 30 (4.7%) | 126 (19.6%) |
| 45 to 54 Years | 282 (35.0%) | 90 (11.6%) |
| 55 to 64 Years | 154 (14.4%) | 118 (9.8%) |
| 65 to 74 Years | 35 (3.5%) | 64 (6.3%) |
| 75 Years and over | 73 (10.1%) | 132 (16.9%) |
| Total | 907 (13.5%) | 1,018 (14.9%) |
Income Above Poverty by Sex and Age in Trinity County
According to the poverty statistics in Trinity County, males aged 15 years and females aged 5 years are the age groups that are most secure financially, with 100.0% of males and 100.0% of females in these age groups living above the poverty line.
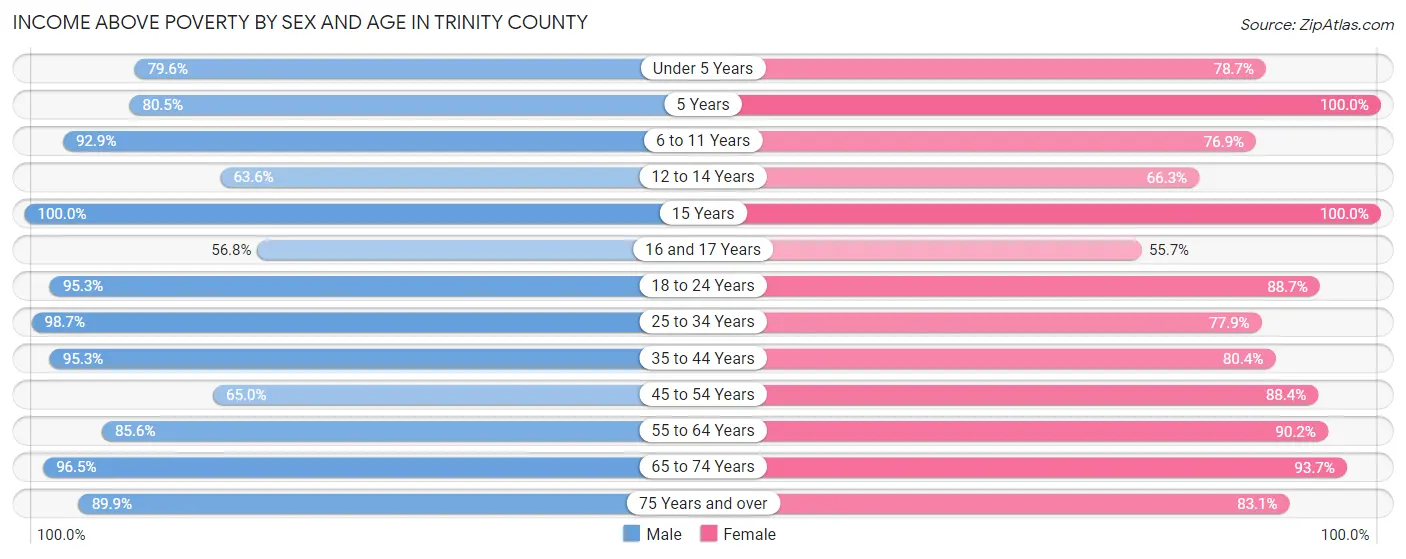
| Age Bracket | Male | Female |
| Under 5 Years | 238 (79.6%) | 266 (78.7%) |
| 5 Years | 95 (80.5%) | 125 (100.0%) |
| 6 to 11 Years | 391 (92.9%) | 226 (76.9%) |
| 12 to 14 Years | 168 (63.6%) | 171 (66.3%) |
| 15 Years | 89 (100.0%) | 86 (100.0%) |
| 16 and 17 Years | 121 (56.8%) | 78 (55.7%) |
| 18 to 24 Years | 486 (95.3%) | 477 (88.7%) |
| 25 to 34 Years | 530 (98.7%) | 486 (77.9%) |
| 35 to 44 Years | 608 (95.3%) | 518 (80.4%) |
| 45 to 54 Years | 524 (65.0%) | 685 (88.4%) |
| 55 to 64 Years | 918 (85.6%) | 1,082 (90.2%) |
| 65 to 74 Years | 977 (96.5%) | 950 (93.7%) |
| 75 Years and over | 653 (89.9%) | 647 (83.1%) |
| Total | 5,798 (86.5%) | 5,797 (85.1%) |
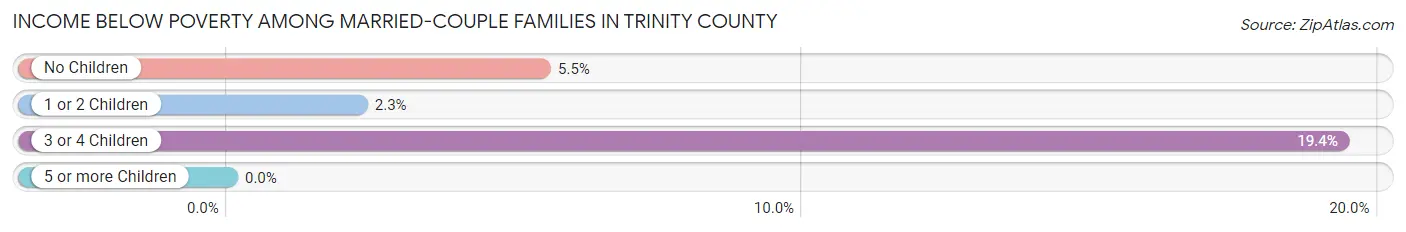
Income Below Poverty Among Married-Couple Families in Trinity County
The poverty statistics for married-couple families in Trinity County show that 5.4% or 162 of the total 2,970 families live below the poverty line. Families with 3 or 4 children have the highest poverty rate of 19.4%, comprising of 24 families. On the other hand, families with 5 or more children have the lowest poverty rate of 0.0%, which includes 0 families.
| Children | Above Poverty | Below Poverty |
| No Children | 2,202 (94.6%) | 127 (5.4%) |
| 1 or 2 Children | 476 (97.7%) | 11 (2.3%) |
| 3 or 4 Children | 100 (80.6%) | 24 (19.4%) |
| 5 or more Children | 30 (100.0%) | 0 (0.0%) |
| Total | 2,808 (94.6%) | 162 (5.4%) |
Income Below Poverty Among Single-Parent Households in Trinity County
According to the poverty data in Trinity County, 38.8% or 183 single-father households and 19.9% or 102 single-mother households are living below the poverty line. Among single-father households, those with 3 or 4 children have the highest poverty rate, with 30 households (68.2%) experiencing poverty. Likewise, among single-mother households, those with 3 or 4 children have the highest poverty rate, with 32 households (100.0%) falling below the poverty line.
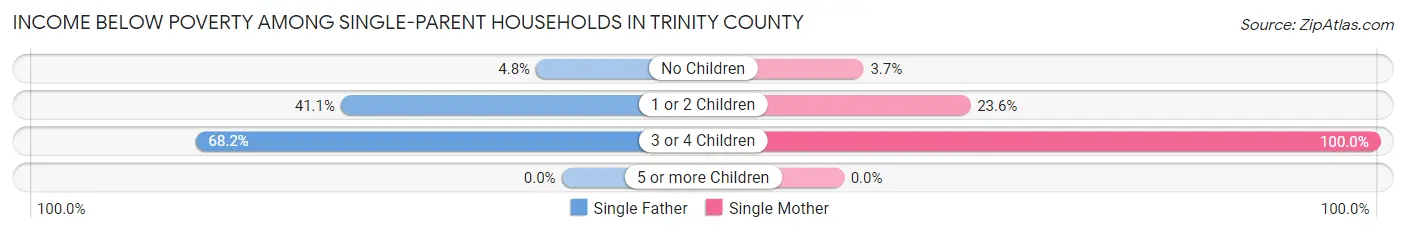
| Children | Single Father | Single Mother |
| No Children | 3 (4.8%) | 8 (3.7%) |
| 1 or 2 Children | 150 (41.1%) | 62 (23.6%) |
| 3 or 4 Children | 30 (68.2%) | 32 (100.0%) |
| 5 or more Children | 0 (0.0%) | 0 (0.0%) |
| Total | 183 (38.8%) | 102 (19.9%) |
Income Below Poverty Among Married-Couple vs Single-Parent Households in Trinity County
The poverty data for Trinity County shows that 162 of the married-couple family households (5.4%) and 285 of the single-parent households (29.0%) are living below the poverty level. Within the married-couple family households, those with 3 or 4 children have the highest poverty rate, with 24 households (19.4%) falling below the poverty line. Among the single-parent households, those with 3 or 4 children have the highest poverty rate, with 62 household (81.6%) living below poverty.
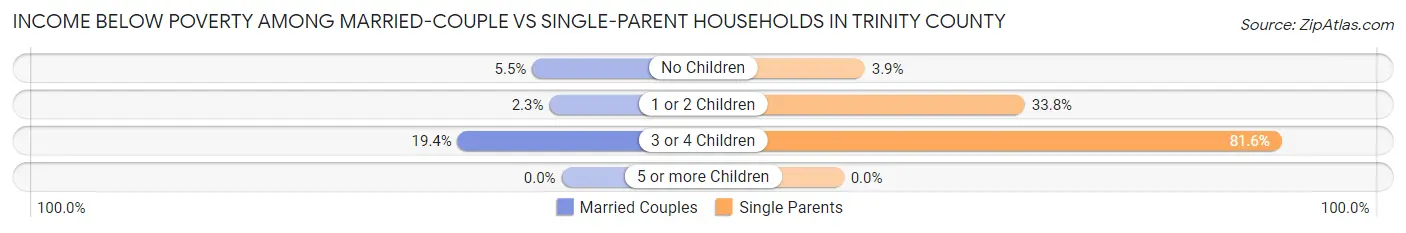
| Children | Married-Couple Families | Single-Parent Households |
| No Children | 127 (5.4%) | 11 (3.9%) |
| 1 or 2 Children | 11 (2.3%) | 212 (33.8%) |
| 3 or 4 Children | 24 (19.4%) | 62 (81.6%) |
| 5 or more Children | 0 (0.0%) | 0 (0.0%) |
| Total | 162 (5.4%) | 285 (29.0%) |
Race in Trinity County
The most populous races in Trinity County are White / Caucasian (11,174 | 81.4%), Hispanic or Latino (1,586 | 11.6%), and Black / African American (1,152 | 8.4%).
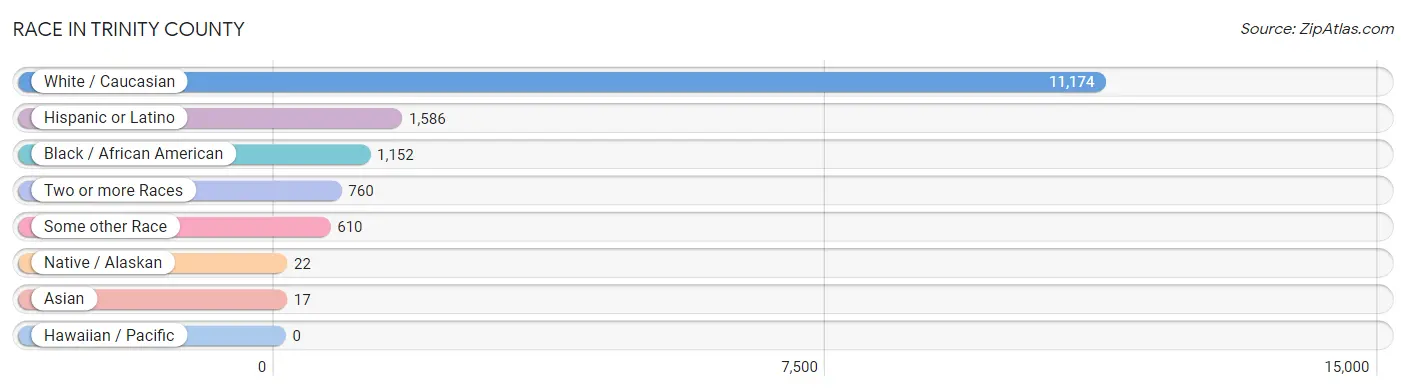
| Race | # Population | % Population |
| Asian | 17 | 0.1% |
| Black / African American | 1,152 | 8.4% |
| Hawaiian / Pacific | 0 | 0.0% |
| Hispanic or Latino | 1,586 | 11.6% |
| Native / Alaskan | 22 | 0.2% |
| White / Caucasian | 11,174 | 81.4% |
| Two or more Races | 760 | 5.5% |
| Some other Race | 610 | 4.4% |
| Total | 13,735 | 100.0% |
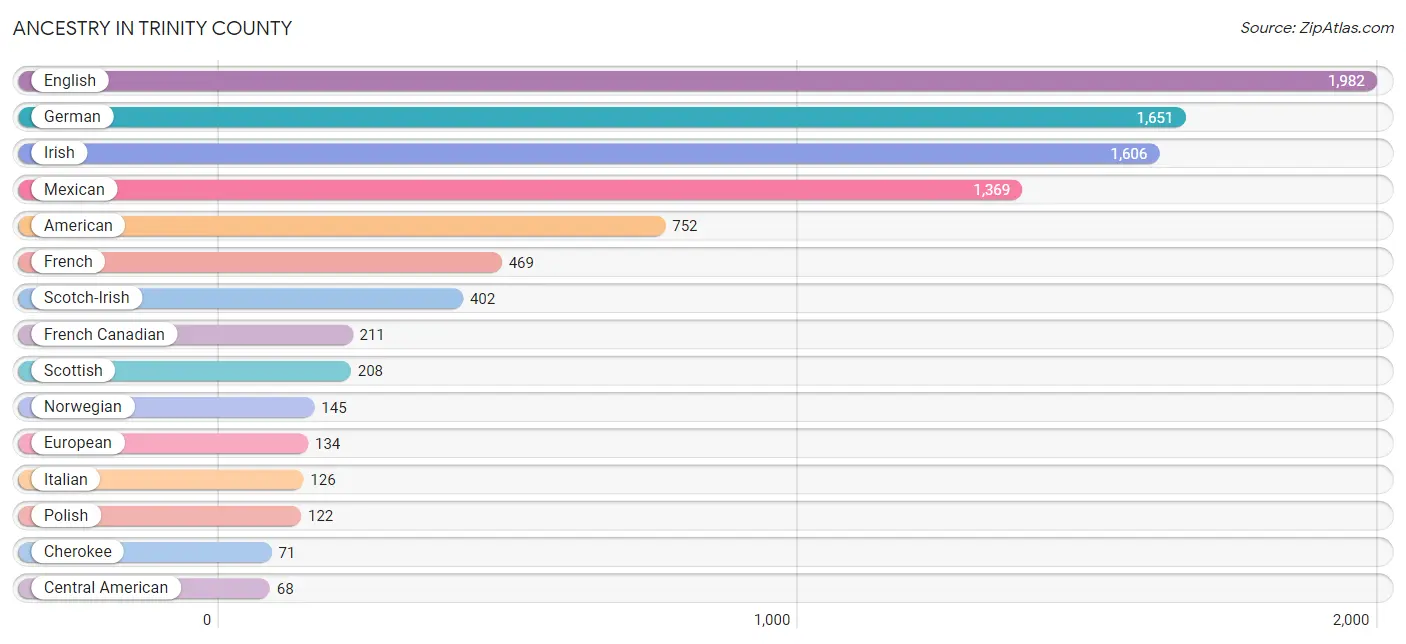
Ancestry in Trinity County
The most populous ancestries reported in Trinity County are English (1,982 | 14.4%), German (1,651 | 12.0%), Irish (1,606 | 11.7%), Mexican (1,369 | 10.0%), and American (752 | 5.5%), together accounting for 53.6% of all Trinity County residents.
| Ancestry | # Population | % Population |
| African | 1 | 0.0% |
| American | 752 | 5.5% |
| Arab | 28 | 0.2% |
| Belgian | 26 | 0.2% |
| British | 42 | 0.3% |
| Cajun | 8 | 0.1% |
| Central American | 68 | 0.5% |
| Cherokee | 71 | 0.5% |
| Chickasaw | 2 | 0.0% |
| Czech | 68 | 0.5% |
| Danish | 28 | 0.2% |
| Dutch | 68 | 0.5% |
| Eastern European | 6 | 0.0% |
| Ecuadorian | 34 | 0.3% |
| English | 1,982 | 14.4% |
| European | 134 | 1.0% |
| French | 469 | 3.4% |
| French Canadian | 211 | 1.5% |
| German | 1,651 | 12.0% |
| Greek | 45 | 0.3% |
| Guatemalan | 34 | 0.3% |
| Indian (Asian) | 16 | 0.1% |
| Irish | 1,606 | 11.7% |
| Italian | 126 | 0.9% |
| Lebanese | 20 | 0.2% |
| Lithuanian | 5 | 0.0% |
| Mexican | 1,369 | 10.0% |
| Northern European | 3 | 0.0% |
| Norwegian | 145 | 1.1% |
| Okinawan | 13 | 0.1% |
| Polish | 122 | 0.9% |
| Potawatomi | 29 | 0.2% |
| Puerto Rican | 68 | 0.5% |
| Salvadoran | 34 | 0.3% |
| Scandinavian | 23 | 0.2% |
| Scotch-Irish | 402 | 2.9% |
| Scottish | 208 | 1.5% |
| Slovak | 6 | 0.0% |
| South American | 34 | 0.3% |
| Spaniard | 9 | 0.1% |
| Spanish | 34 | 0.3% |
| Subsaharan African | 1 | 0.0% |
| Swedish | 62 | 0.4% |
| Swiss | 7 | 0.1% |
| Taiwanese | 9 | 0.1% |
| Welsh | 51 | 0.4% | View All 46 Rows |
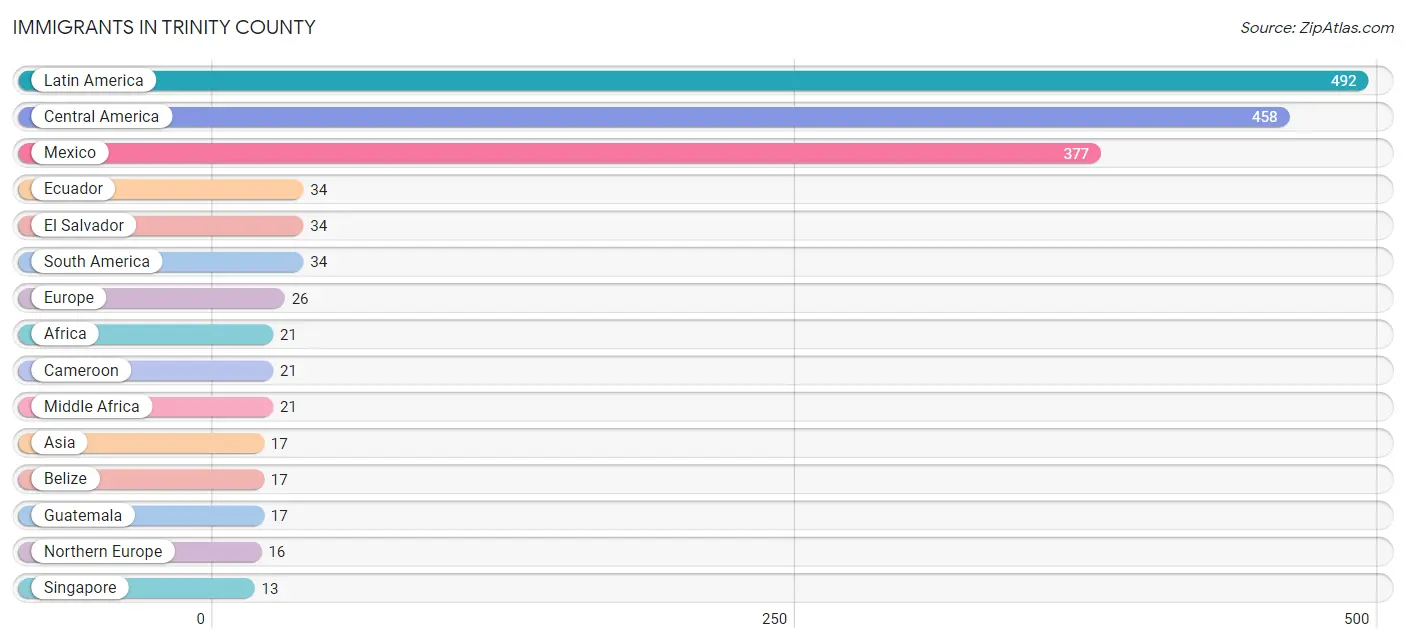
Immigrants in Trinity County
The most numerous immigrant groups reported in Trinity County came from Latin America (492 | 3.6%), Central America (458 | 3.3%), Mexico (377 | 2.7%), Ecuador (34 | 0.3%), and El Salvador (34 | 0.3%), together accounting for 10.2% of all Trinity County residents.
| Immigration Origin | # Population | % Population |
| Africa | 21 | 0.2% |
| Asia | 17 | 0.1% |
| Belize | 17 | 0.1% |
| Cameroon | 21 | 0.2% |
| Central America | 458 | 3.3% |
| Costa Rica | 8 | 0.1% |
| Ecuador | 34 | 0.3% |
| El Salvador | 34 | 0.3% |
| Europe | 26 | 0.2% |
| Guatemala | 17 | 0.1% |
| Honduras | 5 | 0.0% |
| Latin America | 492 | 3.6% |
| Mexico | 377 | 2.7% |
| Middle Africa | 21 | 0.2% |
| Netherlands | 10 | 0.1% |
| Northern Europe | 16 | 0.1% |
| Pakistan | 4 | 0.0% |
| Singapore | 13 | 0.1% |
| South America | 34 | 0.3% |
| South Central Asia | 4 | 0.0% |
| South Eastern Asia | 13 | 0.1% |
| Western Europe | 10 | 0.1% | View All 22 Rows |
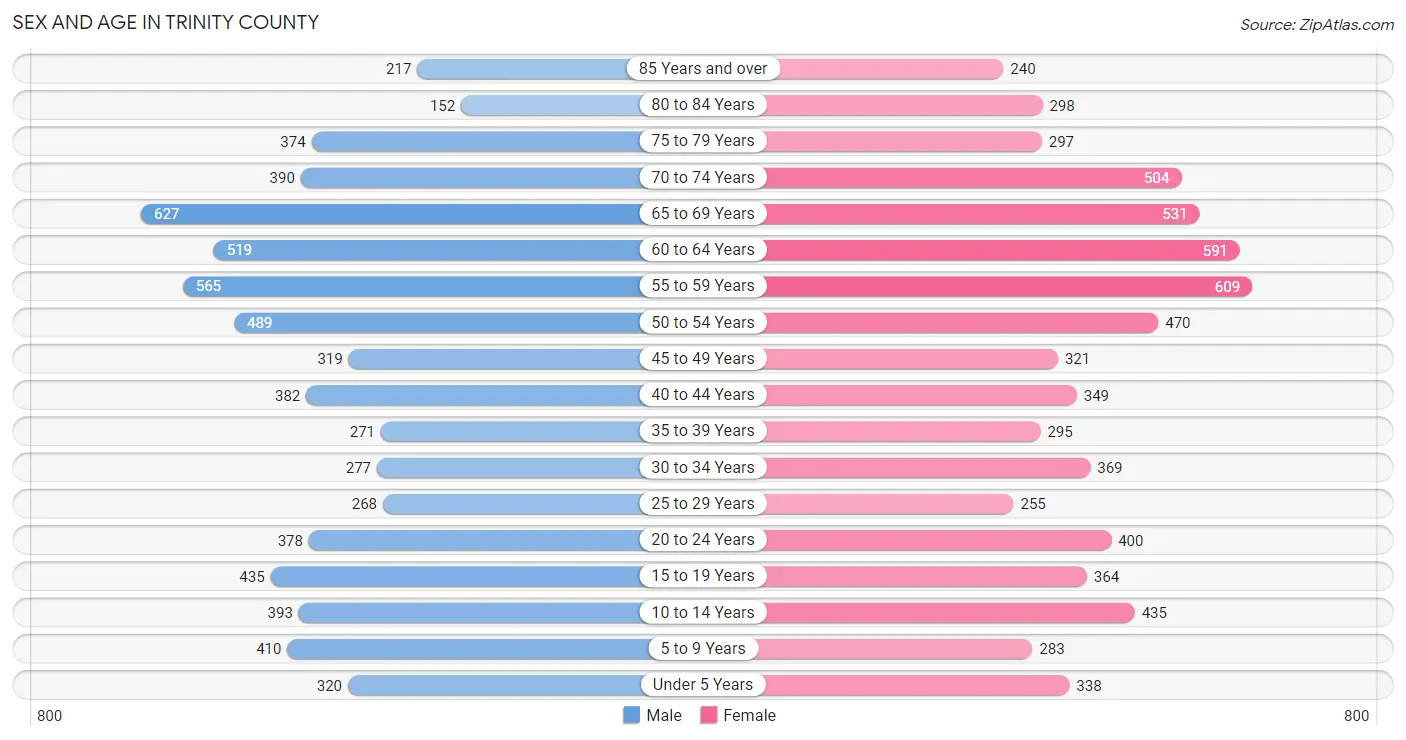
Sex and Age in Trinity County
Sex and Age in Trinity County
The most populous age groups in Trinity County are 65 to 69 Years (627 | 9.2%) for men and 55 to 59 Years (609 | 8.8%) for women.
| Age Bracket | Male | Female |
| Under 5 Years | 320 (4.7%) | 338 (4.9%) |
| 5 to 9 Years | 410 (6.0%) | 283 (4.1%) |
| 10 to 14 Years | 393 (5.8%) | 435 (6.3%) |
| 15 to 19 Years | 435 (6.4%) | 364 (5.2%) |
| 20 to 24 Years | 378 (5.6%) | 400 (5.8%) |
| 25 to 29 Years | 268 (4.0%) | 255 (3.7%) |
| 30 to 34 Years | 277 (4.1%) | 369 (5.3%) |
| 35 to 39 Years | 271 (4.0%) | 295 (4.3%) |
| 40 to 44 Years | 382 (5.6%) | 349 (5.0%) |
| 45 to 49 Years | 319 (4.7%) | 321 (4.6%) |
| 50 to 54 Years | 489 (7.2%) | 470 (6.8%) |
| 55 to 59 Years | 565 (8.3%) | 609 (8.8%) |
| 60 to 64 Years | 519 (7.6%) | 591 (8.5%) |
| 65 to 69 Years | 627 (9.2%) | 531 (7.6%) |
| 70 to 74 Years | 390 (5.8%) | 504 (7.2%) |
| 75 to 79 Years | 374 (5.5%) | 297 (4.3%) |
| 80 to 84 Years | 152 (2.2%) | 298 (4.3%) |
| 85 Years and over | 217 (3.2%) | 240 (3.5%) |
| Total | 6,786 (100.0%) | 6,949 (100.0%) |
Families and Households in Trinity County
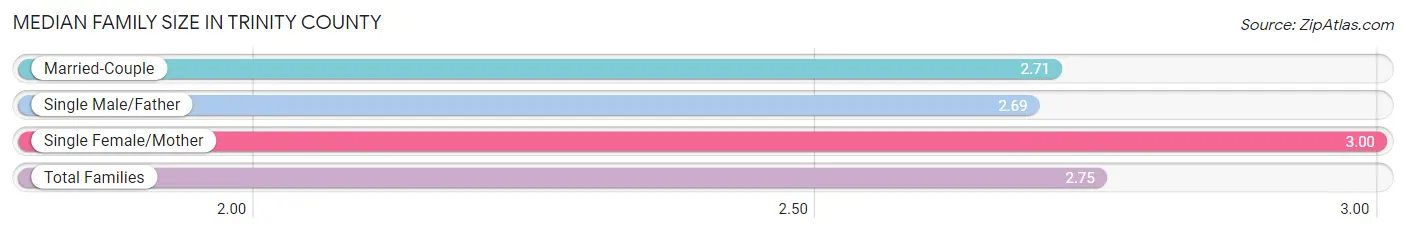
Median Family Size in Trinity County
The median family size in Trinity County is 2.75 persons per family, with single female/mother families (512 | 13.0%) accounting for the largest median family size of 3 persons per family. On the other hand, single male/father families (472 | 11.9%) represent the smallest median family size with 2.69 persons per family.
| Family Type | # Families | Family Size |
| Married-Couple | 2,970 (75.1%) | 2.71 |
| Single Male/Father | 472 (11.9%) | 2.69 |
| Single Female/Mother | 512 (13.0%) | 3.00 |
| Total Families | 3,954 (100.0%) | 2.75 |
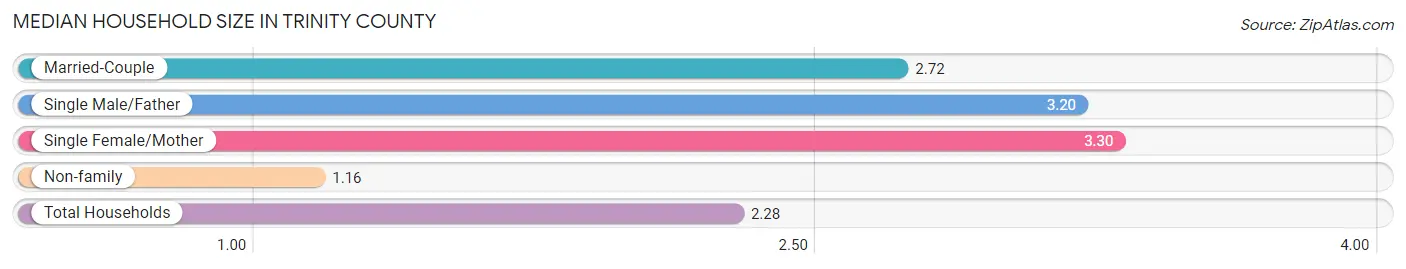
Median Household Size in Trinity County
The median household size in Trinity County is 2.28 persons per household, with single female/mother households (512 | 8.6%) accounting for the largest median household size of 3.3 persons per household. non-family households (1,992 | 33.5%) represent the smallest median household size with 1.16 persons per household.
| Household Type | # Households | Household Size |
| Married-Couple | 2,970 (49.9%) | 2.72 |
| Single Male/Father | 472 (7.9%) | 3.20 |
| Single Female/Mother | 512 (8.6%) | 3.30 |
| Non-family | 1,992 (33.5%) | 1.16 |
| Total Households | 5,946 (100.0%) | 2.28 |
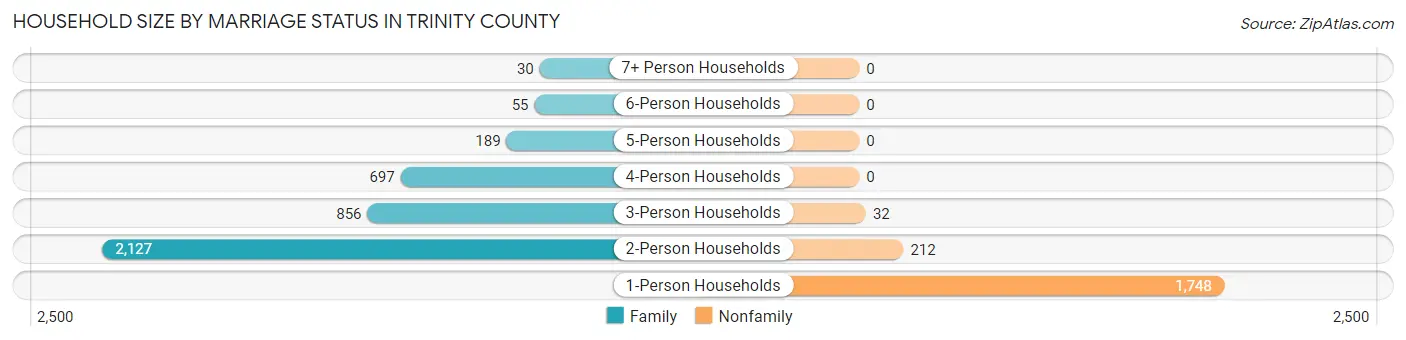
Household Size by Marriage Status in Trinity County
Out of a total of 5,946 households in Trinity County, 3,954 (66.5%) are family households, while 1,992 (33.5%) are nonfamily households. The most numerous type of family households are 2-person households, comprising 2,127, and the most common type of nonfamily households are 1-person households, comprising 1,748.
| Household Size | Family Households | Nonfamily Households |
| 1-Person Households | - | 1,748 (29.4%) |
| 2-Person Households | 2,127 (35.8%) | 212 (3.6%) |
| 3-Person Households | 856 (14.4%) | 32 (0.5%) |
| 4-Person Households | 697 (11.7%) | 0 (0.0%) |
| 5-Person Households | 189 (3.2%) | 0 (0.0%) |
| 6-Person Households | 55 (0.9%) | 0 (0.0%) |
| 7+ Person Households | 30 (0.5%) | 0 (0.0%) |
| Total | 3,954 (66.5%) | 1,992 (33.5%) |
Female Fertility in Trinity County
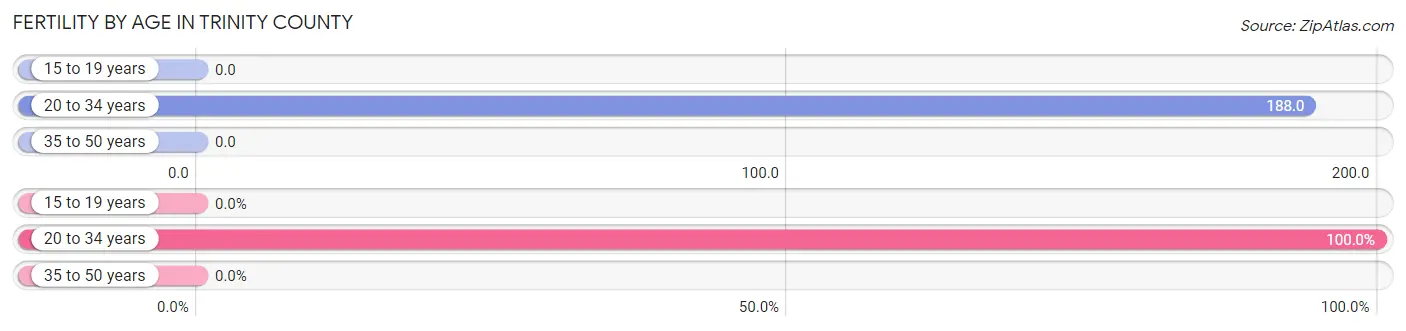
Fertility by Age in Trinity County
Average fertility rate in Trinity County is 79.0 births per 1,000 women. Women in the age bracket of 20 to 34 years have the highest fertility rate with 188.0 births per 1,000 women. Women in the age bracket of 20 to 34 years acount for 100.0% of all women with births.
| Age Bracket | Women with Births | Births / 1,000 Women |
| 15 to 19 years | 0 (0.0%) | 0.0 |
| 20 to 34 years | 193 (100.0%) | 188.0 |
| 35 to 50 years | 0 (0.0%) | 0.0 |
| Total | 193 (100.0%) | 79.0 |
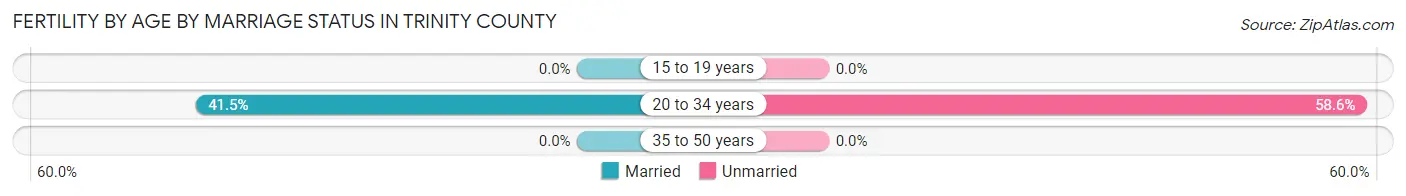
Fertility by Age by Marriage Status in Trinity County
41.5% of women with births (193) in Trinity County are married. The highest percentage of unmarried women with births falls into 20 to 34 years age bracket with 58.6% of them unmarried at the time of birth, while the lowest percentage of unmarried women with births belong to 20 to 34 years age bracket with 58.6% of them unmarried.
| Age Bracket | Married | Unmarried |
| 15 to 19 years | 0 (0.0%) | 0 (0.0%) |
| 20 to 34 years | 80 (41.4%) | 113 (58.6%) |
| 35 to 50 years | 0 (0.0%) | 0 (0.0%) |
| Total | 80 (41.4%) | 113 (58.6%) |
Fertility by Education in Trinity County
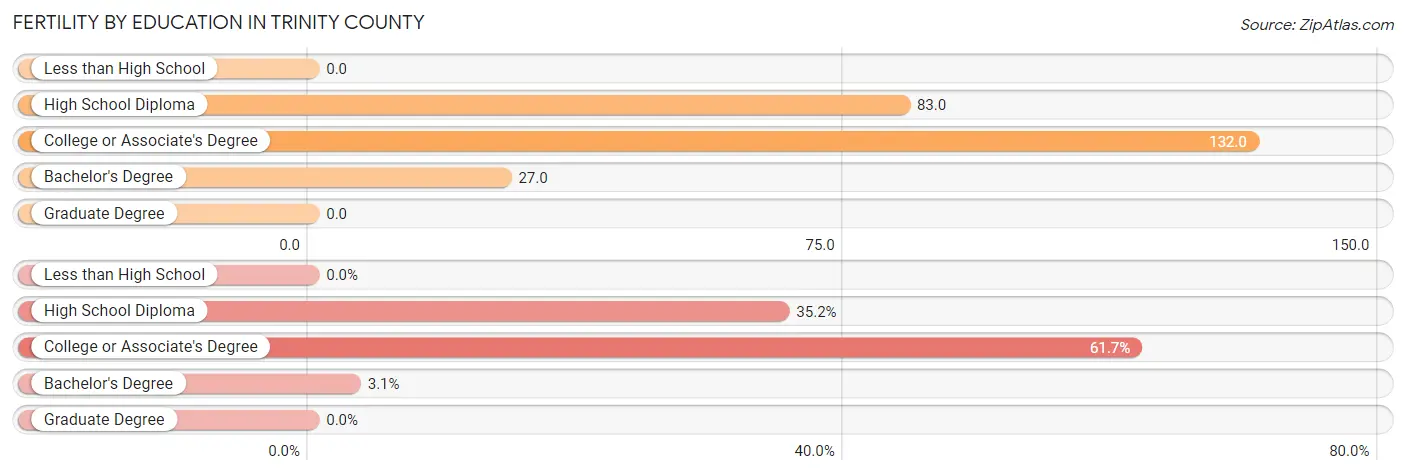
| Educational Attainment | Women with Births | Births / 1,000 Women |
| Less than High School | 0 (0.0%) | 0.0 |
| High School Diploma | 68 (35.2%) | 83.0 |
| College or Associate's Degree | 119 (61.7%) | 132.0 |
| Bachelor's Degree | 6 (3.1%) | 27.0 |
| Graduate Degree | 0 (0.0%) | 0.0 |
| Total | 193 (100.0%) | 79.0 |
Fertility by Education by Marriage Status in Trinity County
58.6% of women with births in Trinity County are unmarried. Women with the educational attainment of bachelor's degree are most likely to be married with 100.0% of them married at childbirth, while women with the educational attainment of college or associate's degree are least likely to be married with 60.5% of them unmarried at childbirth.
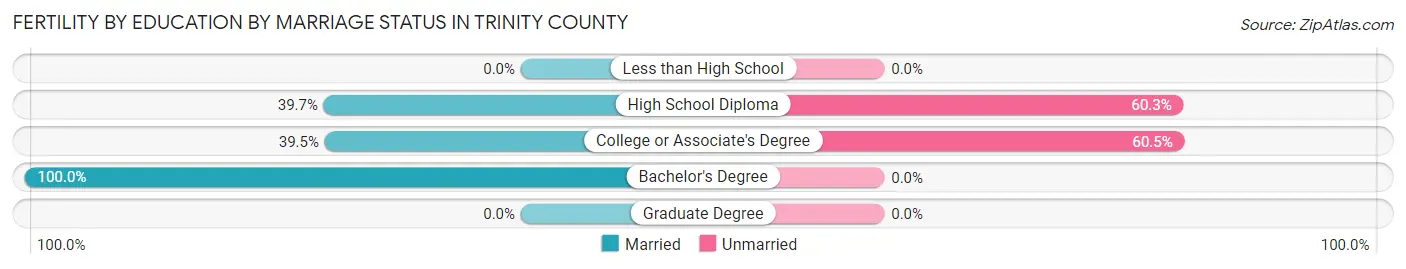
| Educational Attainment | Married | Unmarried |
| Less than High School | 0 (0.0%) | 0 (0.0%) |
| High School Diploma | 27 (39.7%) | 41 (60.3%) |
| College or Associate's Degree | 47 (39.5%) | 72 (60.5%) |
| Bachelor's Degree | 6 (100.0%) | 0 (0.0%) |
| Graduate Degree | 0 (0.0%) | 0 (0.0%) |
| Total | 80 (41.4%) | 113 (58.6%) |
Employment Characteristics in Trinity County
Employment by Class of Employer in Trinity County
Among the 4,849 employed individuals in Trinity County, private company employees (3,064 | 63.2%), state government employees (692 | 14.3%), and self-employed (not incorporated) (379 | 7.8%) make up the most common classes of employment.
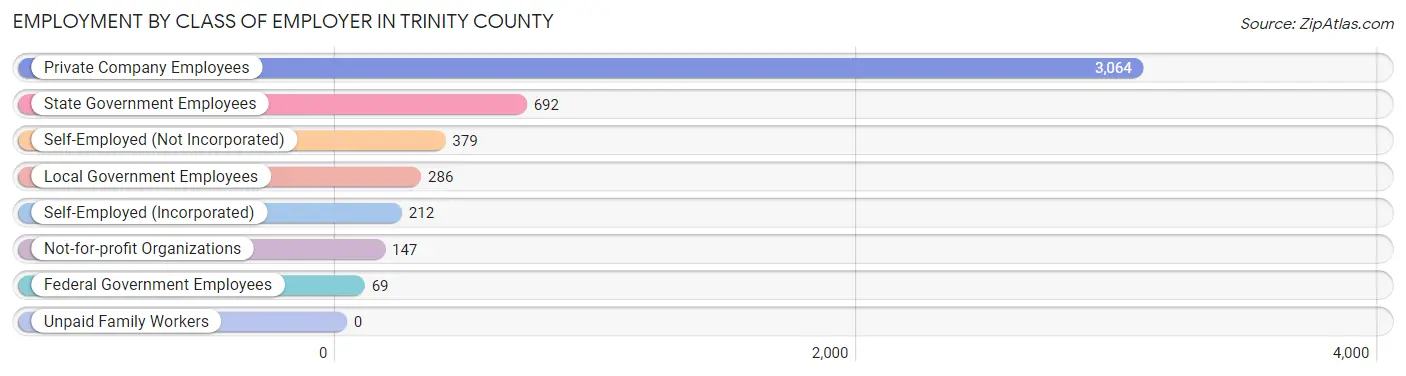
| Employer Class | # Employees | % Employees |
| Private Company Employees | 3,064 | 63.2% |
| Self-Employed (Incorporated) | 212 | 4.4% |
| Self-Employed (Not Incorporated) | 379 | 7.8% |
| Not-for-profit Organizations | 147 | 3.0% |
| Local Government Employees | 286 | 5.9% |
| State Government Employees | 692 | 14.3% |
| Federal Government Employees | 69 | 1.4% |
| Unpaid Family Workers | 0 | 0.0% |
| Total | 4,849 | 100.0% |
Employment Status by Age in Trinity County
According to the labor force statistics for Trinity County, out of the total population over 16 years of age (11,381), 47.2% or 5,372 individuals are in the labor force, with 7.0% or 376 of them unemployed. The age group with the highest labor force participation rate is 25 to 29 years, with 78.8% or 412 individuals in the labor force. Within the labor force, the 25 to 29 years age range has the highest percentage of unemployed individuals, with 21.1% or 87 of them being unemployed.
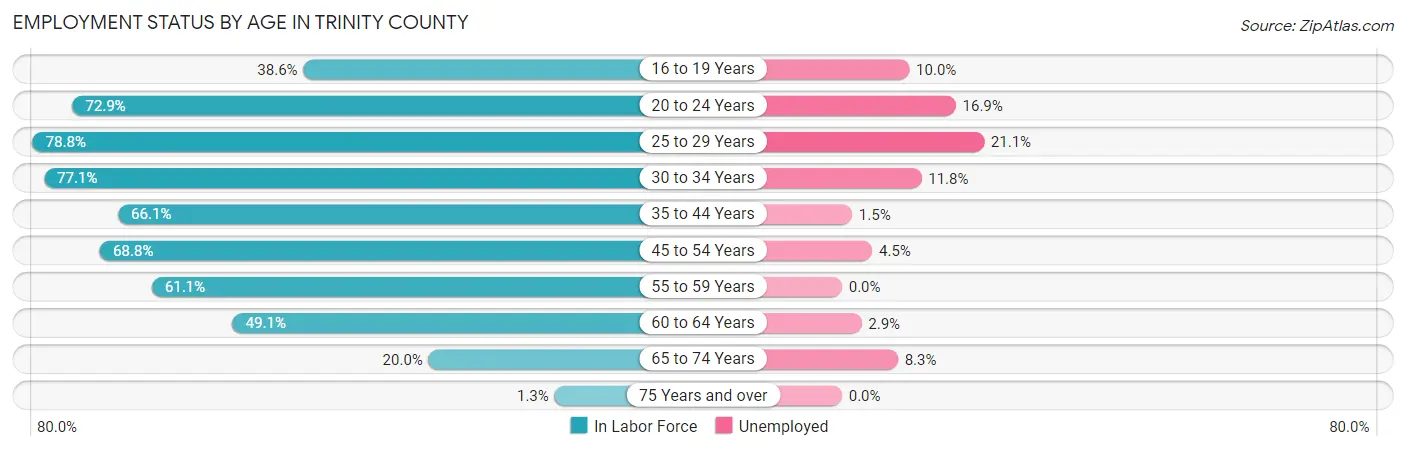
| Age Bracket | In Labor Force | Unemployed |
| 16 to 19 Years | 241 (38.6%) | 24 (10.0%) |
| 20 to 24 Years | 567 (72.9%) | 96 (16.9%) |
| 25 to 29 Years | 412 (78.8%) | 87 (21.1%) |
| 30 to 34 Years | 498 (77.1%) | 59 (11.8%) |
| 35 to 44 Years | 857 (66.1%) | 13 (1.5%) |
| 45 to 54 Years | 1,100 (68.8%) | 50 (4.5%) |
| 55 to 59 Years | 717 (61.1%) | 0 (0.0%) |
| 60 to 64 Years | 545 (49.1%) | 16 (2.9%) |
| 65 to 74 Years | 410 (20.0%) | 34 (8.3%) |
| 75 Years and over | 21 (1.3%) | 0 (0.0%) |
| Total | 5,372 (47.2%) | 376 (7.0%) |
Employment Status by Educational Attainment in Trinity County
According to labor force statistics for Trinity County, 65.0% of individuals (4,127) out of the total population between 25 and 64 years of age (6,349) are in the labor force, with 5.4% or 223 of them being unemployed. The group with the highest labor force participation rate are those with the educational attainment of bachelor's degree or higher, with 73.6% or 698 individuals in the labor force. Within the labor force, individuals with less than high school education have the highest percentage of unemployment, with 13.0% or 57 of them being unemployed.
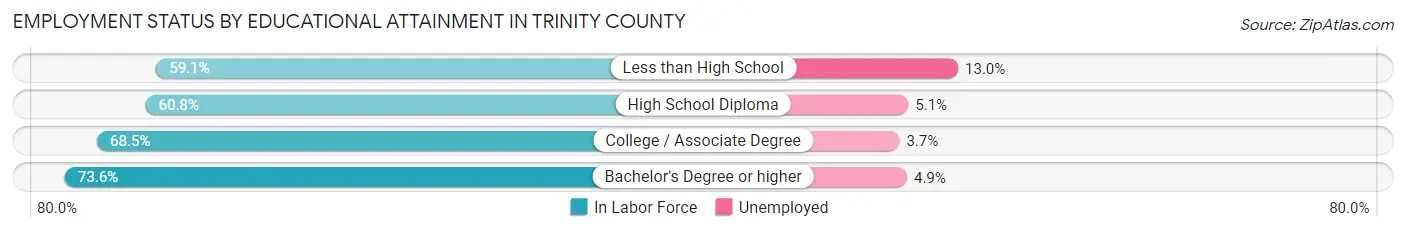
| Educational Attainment | In Labor Force | Unemployed |
| Less than High School | 438 (59.1%) | 96 (13.0%) |
| High School Diploma | 1,564 (60.8%) | 131 (5.1%) |
| College / Associate Degree | 1,430 (68.5%) | 77 (3.7%) |
| Bachelor's Degree or higher | 698 (73.6%) | 46 (4.9%) |
| Total | 4,127 (65.0%) | 343 (5.4%) |
Employment Occupations by Sex in Trinity County
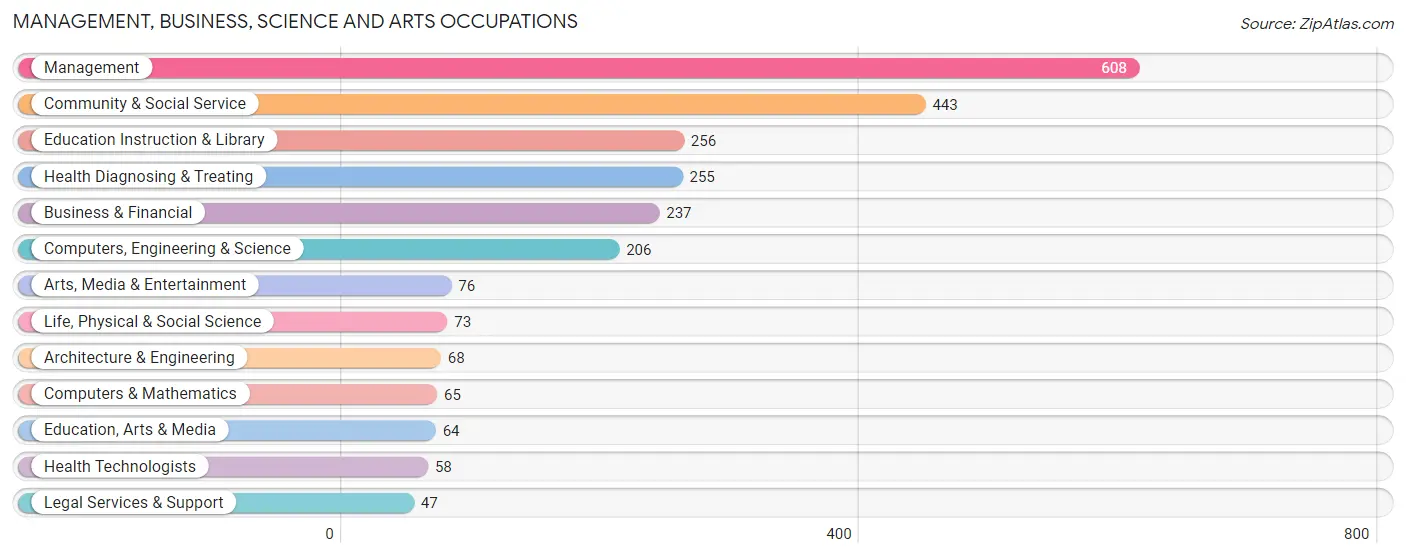
Management, Business, Science and Arts Occupations
The most common Management, Business, Science and Arts occupations in Trinity County are Management (608 | 12.2%), Community & Social Service (443 | 8.9%), Education Instruction & Library (256 | 5.1%), Health Diagnosing & Treating (255 | 5.1%), and Business & Financial (237 | 4.8%).
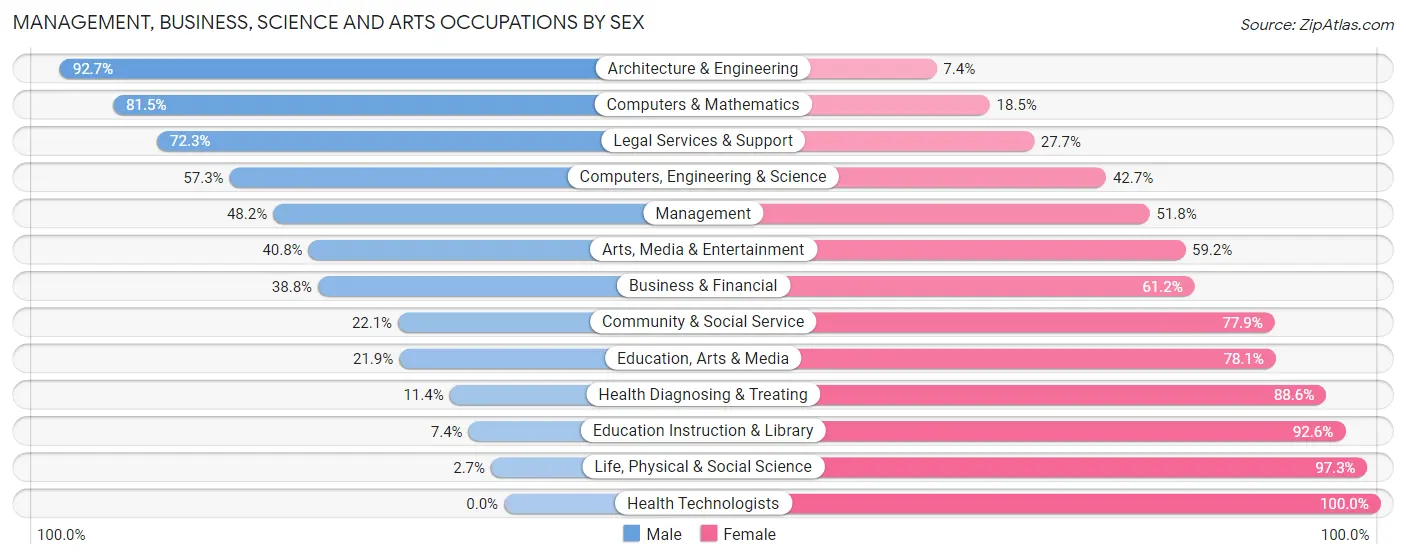
Management, Business, Science and Arts Occupations by Sex
Within the Management, Business, Science and Arts occupations in Trinity County, the most male-oriented occupations are Architecture & Engineering (92.6%), Computers & Mathematics (81.5%), and Legal Services & Support (72.3%), while the most female-oriented occupations are Health Technologists (100.0%), Life, Physical & Social Science (97.3%), and Education Instruction & Library (92.6%).
| Occupation | Male | Female |
| Management | 293 (48.2%) | 315 (51.8%) |
| Business & Financial | 92 (38.8%) | 145 (61.2%) |
| Computers, Engineering & Science | 118 (57.3%) | 88 (42.7%) |
| Computers & Mathematics | 53 (81.5%) | 12 (18.5%) |
| Architecture & Engineering | 63 (92.6%) | 5 (7.3%) |
| Life, Physical & Social Science | 2 (2.7%) | 71 (97.3%) |
| Community & Social Service | 98 (22.1%) | 345 (77.9%) |
| Education, Arts & Media | 14 (21.9%) | 50 (78.1%) |
| Legal Services & Support | 34 (72.3%) | 13 (27.7%) |
| Education Instruction & Library | 19 (7.4%) | 237 (92.6%) |
| Arts, Media & Entertainment | 31 (40.8%) | 45 (59.2%) |
| Health Diagnosing & Treating | 29 (11.4%) | 226 (88.6%) |
| Health Technologists | 0 (0.0%) | 58 (100.0%) |
| Total (Category) | 630 (36.0%) | 1,119 (64.0%) |
| Total (Overall) | 2,699 (54.1%) | 2,291 (45.9%) |
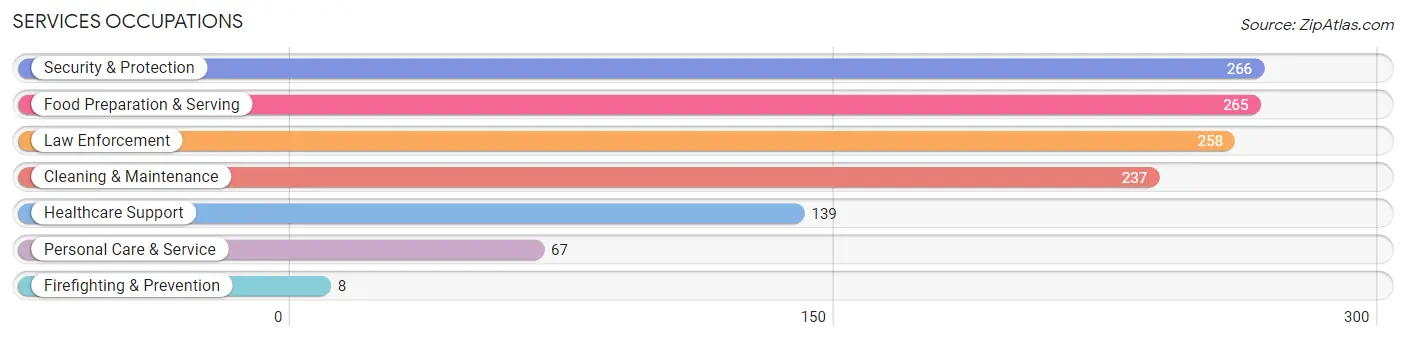
Services Occupations
The most common Services occupations in Trinity County are Security & Protection (266 | 5.3%), Food Preparation & Serving (265 | 5.3%), Law Enforcement (258 | 5.2%), Cleaning & Maintenance (237 | 4.8%), and Healthcare Support (139 | 2.8%).
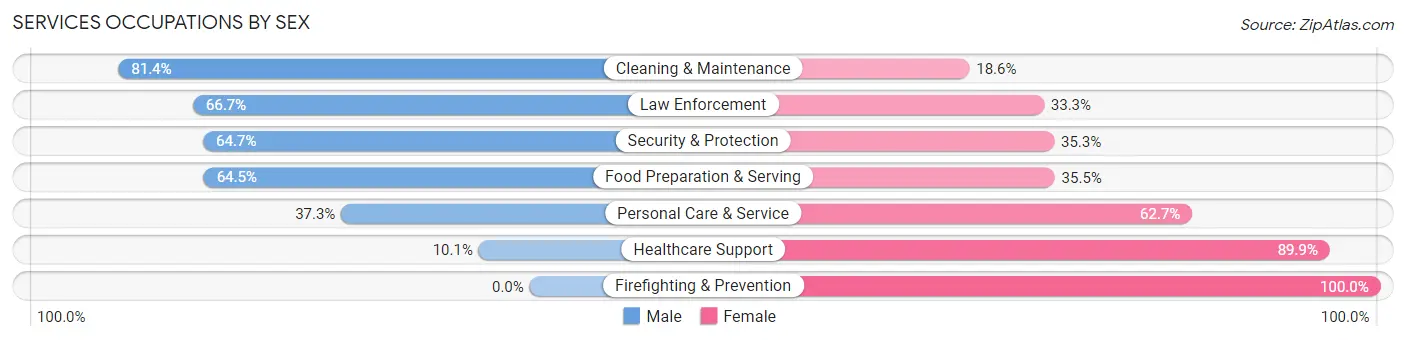
Services Occupations by Sex
Within the Services occupations in Trinity County, the most male-oriented occupations are Cleaning & Maintenance (81.4%), Law Enforcement (66.7%), and Security & Protection (64.7%), while the most female-oriented occupations are Firefighting & Prevention (100.0%), Healthcare Support (89.9%), and Personal Care & Service (62.7%).
| Occupation | Male | Female |
| Healthcare Support | 14 (10.1%) | 125 (89.9%) |
| Security & Protection | 172 (64.7%) | 94 (35.3%) |
| Firefighting & Prevention | 0 (0.0%) | 8 (100.0%) |
| Law Enforcement | 172 (66.7%) | 86 (33.3%) |
| Food Preparation & Serving | 171 (64.5%) | 94 (35.5%) |
| Cleaning & Maintenance | 193 (81.4%) | 44 (18.6%) |
| Personal Care & Service | 25 (37.3%) | 42 (62.7%) |
| Total (Category) | 575 (59.0%) | 399 (41.0%) |
| Total (Overall) | 2,699 (54.1%) | 2,291 (45.9%) |
Sales and Office Occupations
The most common Sales and Office occupations in Trinity County are Office & Administration (499 | 10.0%), and Sales & Related (437 | 8.8%).
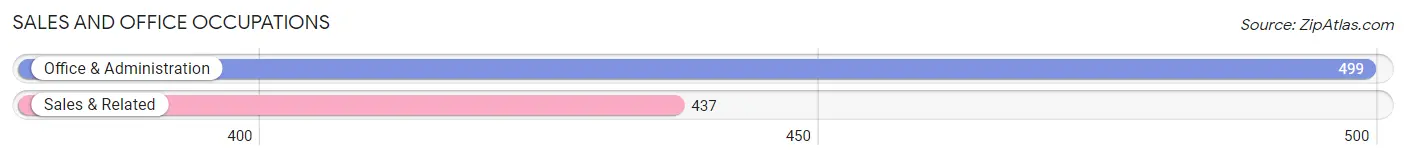
Sales and Office Occupations by Sex
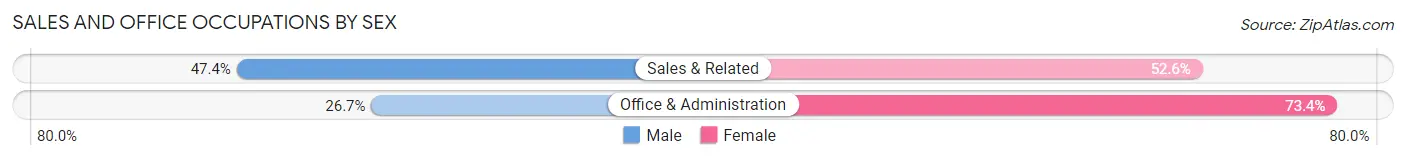
| Occupation | Male | Female |
| Sales & Related | 207 (47.4%) | 230 (52.6%) |
| Office & Administration | 133 (26.7%) | 366 (73.4%) |
| Total (Category) | 340 (36.3%) | 596 (63.7%) |
| Total (Overall) | 2,699 (54.1%) | 2,291 (45.9%) |
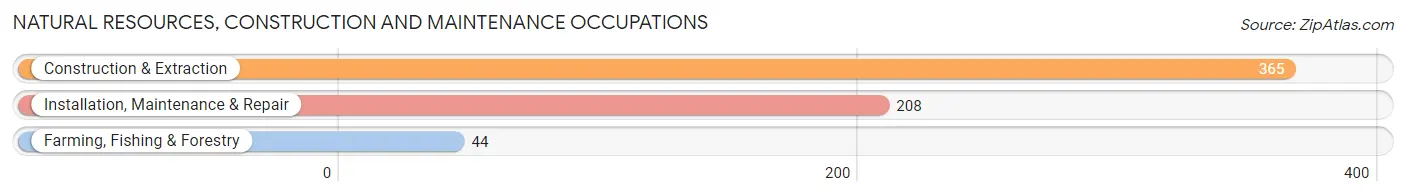
Natural Resources, Construction and Maintenance Occupations
The most common Natural Resources, Construction and Maintenance occupations in Trinity County are Construction & Extraction (365 | 7.3%), Installation, Maintenance & Repair (208 | 4.2%), and Farming, Fishing & Forestry (44 | 0.9%).
Natural Resources, Construction and Maintenance Occupations by Sex
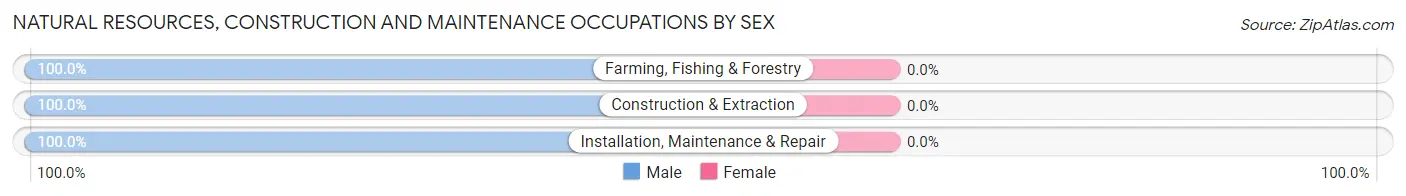
| Occupation | Male | Female |
| Farming, Fishing & Forestry | 44 (100.0%) | 0 (0.0%) |
| Construction & Extraction | 365 (100.0%) | 0 (0.0%) |
| Installation, Maintenance & Repair | 208 (100.0%) | 0 (0.0%) |
| Total (Category) | 617 (100.0%) | 0 (0.0%) |
| Total (Overall) | 2,699 (54.1%) | 2,291 (45.9%) |
Production, Transportation and Moving Occupations
The most common Production, Transportation and Moving occupations in Trinity County are Transportation (295 | 5.9%), Production (210 | 4.2%), and Material Moving (209 | 4.2%).
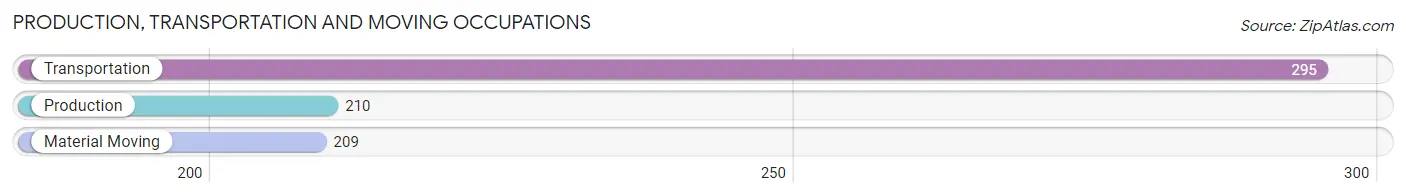
Production, Transportation and Moving Occupations by Sex
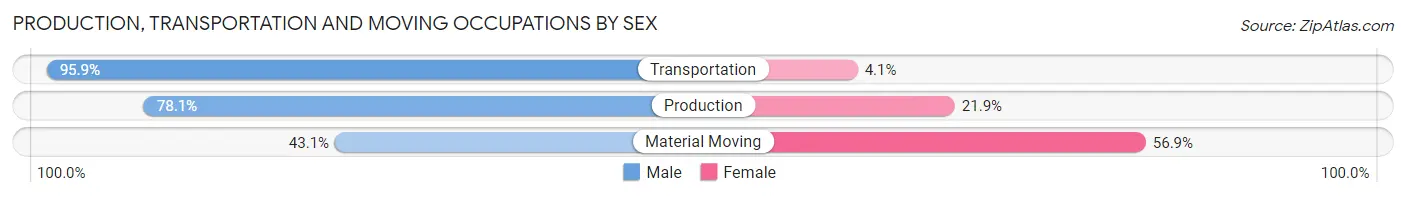
| Occupation | Male | Female |
| Production | 164 (78.1%) | 46 (21.9%) |
| Transportation | 283 (95.9%) | 12 (4.1%) |
| Material Moving | 90 (43.1%) | 119 (56.9%) |
| Total (Category) | 537 (75.2%) | 177 (24.8%) |
| Total (Overall) | 2,699 (54.1%) | 2,291 (45.9%) |
Employment Industries by Sex in Trinity County
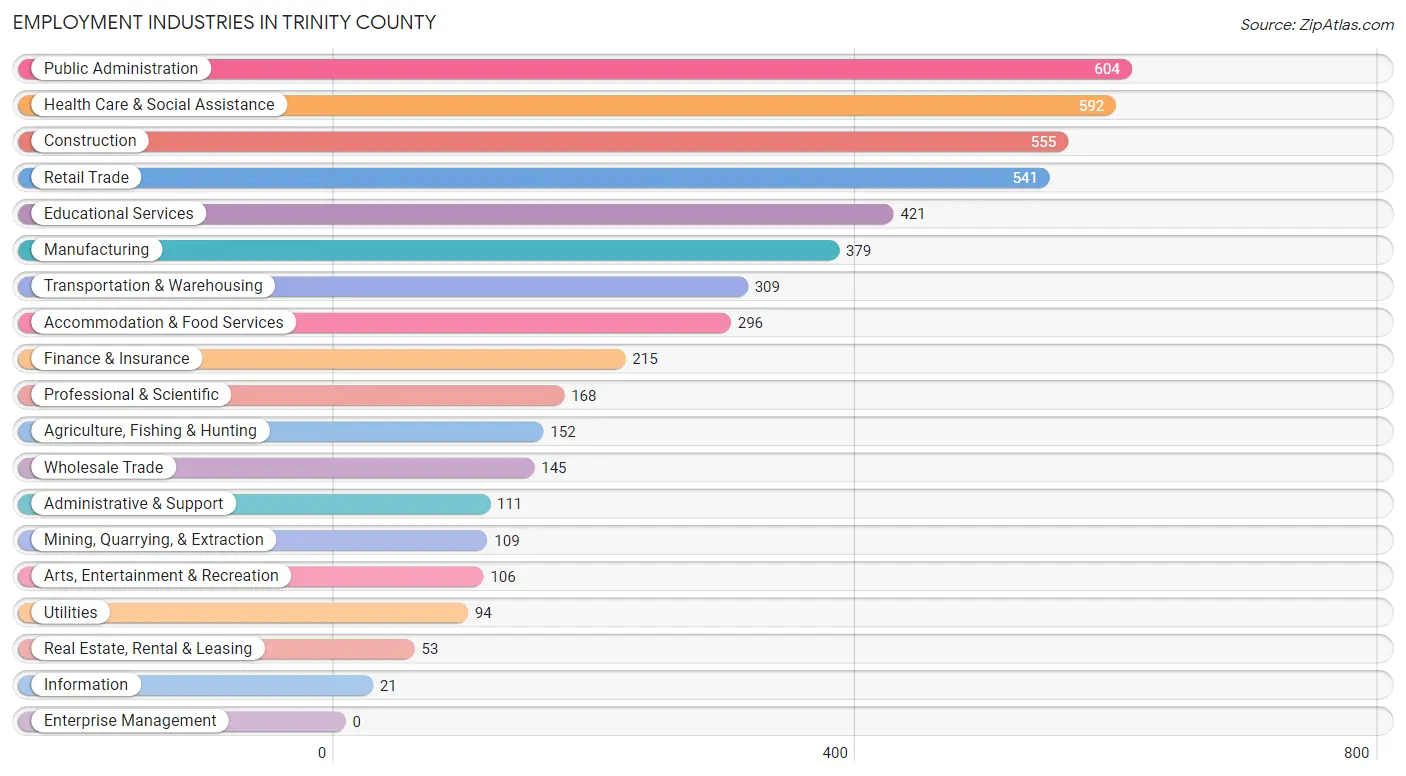
Employment Industries in Trinity County
The major employment industries in Trinity County include Public Administration (604 | 12.1%), Health Care & Social Assistance (592 | 11.9%), Construction (555 | 11.1%), Retail Trade (541 | 10.8%), and Educational Services (421 | 8.4%).
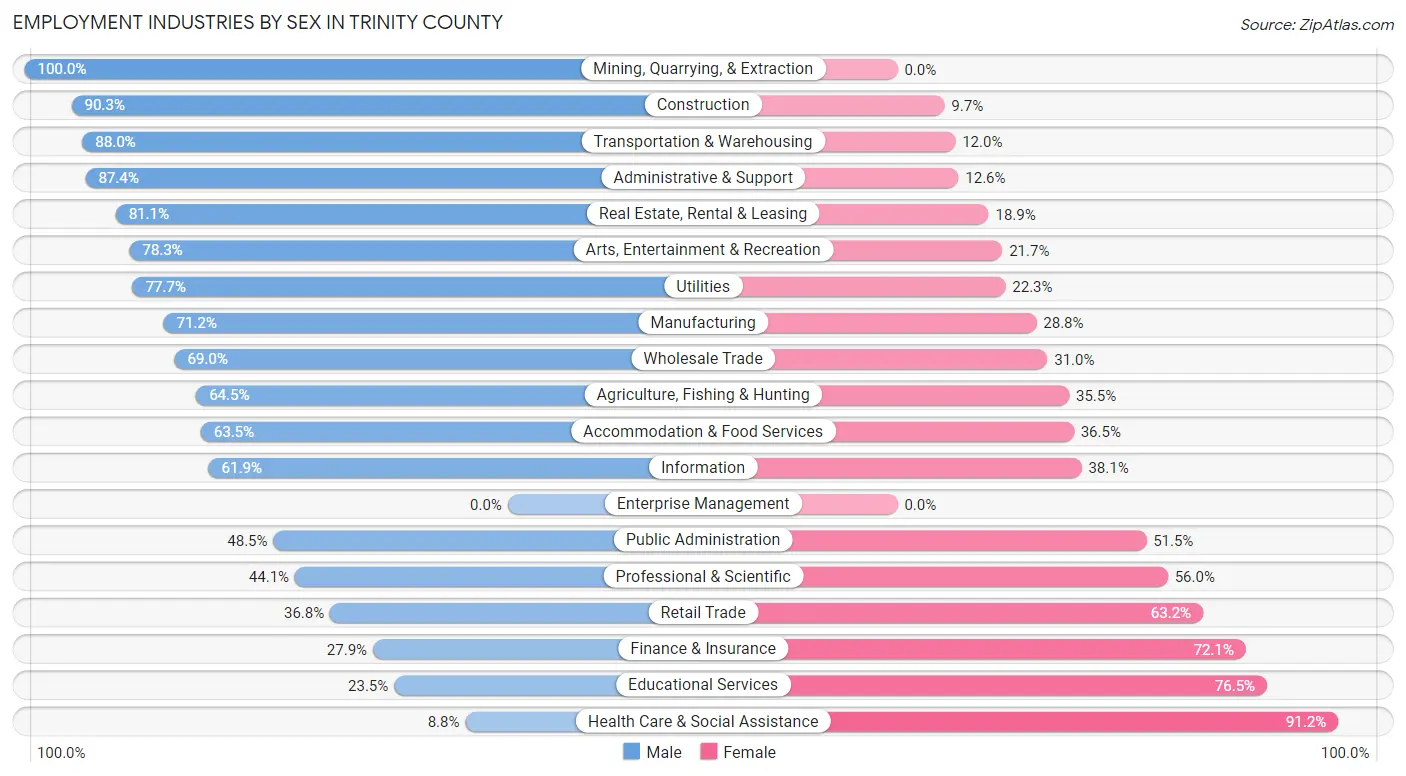
Employment Industries by Sex in Trinity County
The Trinity County industries that see more men than women are Mining, Quarrying, & Extraction (100.0%), Construction (90.3%), and Transportation & Warehousing (88.0%), whereas the industries that tend to have a higher number of women are Health Care & Social Assistance (91.2%), Educational Services (76.5%), and Finance & Insurance (72.1%).
| Industry | Male | Female |
| Agriculture, Fishing & Hunting | 98 (64.5%) | 54 (35.5%) |
| Mining, Quarrying, & Extraction | 109 (100.0%) | 0 (0.0%) |
| Construction | 501 (90.3%) | 54 (9.7%) |
| Manufacturing | 270 (71.2%) | 109 (28.8%) |
| Wholesale Trade | 100 (69.0%) | 45 (31.0%) |
| Retail Trade | 199 (36.8%) | 342 (63.2%) |
| Transportation & Warehousing | 272 (88.0%) | 37 (12.0%) |
| Utilities | 73 (77.7%) | 21 (22.3%) |
| Information | 13 (61.9%) | 8 (38.1%) |
| Finance & Insurance | 60 (27.9%) | 155 (72.1%) |
| Real Estate, Rental & Leasing | 43 (81.1%) | 10 (18.9%) |
| Professional & Scientific | 74 (44.1%) | 94 (55.9%) |
| Enterprise Management | 0 (0.0%) | 0 (0.0%) |
| Administrative & Support | 97 (87.4%) | 14 (12.6%) |
| Educational Services | 99 (23.5%) | 322 (76.5%) |
| Health Care & Social Assistance | 52 (8.8%) | 540 (91.2%) |
| Arts, Entertainment & Recreation | 83 (78.3%) | 23 (21.7%) |
| Accommodation & Food Services | 188 (63.5%) | 108 (36.5%) |
| Public Administration | 293 (48.5%) | 311 (51.5%) |
| Total | 2,699 (54.1%) | 2,291 (45.9%) |
Education in Trinity County
School Enrollment in Trinity County
The most common levels of schooling among the 2,564 students in Trinity County are middle school (746 | 29.1%), high school (632 | 24.6%), and elementary school (486 | 19.0%).
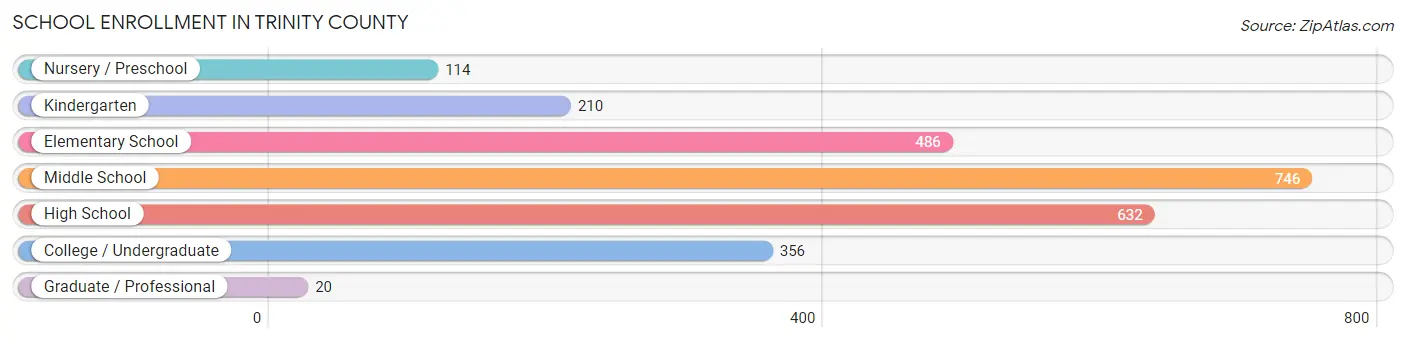
| School Level | # Students | % Students |
| Nursery / Preschool | 114 | 4.4% |
| Kindergarten | 210 | 8.2% |
| Elementary School | 486 | 19.0% |
| Middle School | 746 | 29.1% |
| High School | 632 | 24.6% |
| College / Undergraduate | 356 | 13.9% |
| Graduate / Professional | 20 | 0.8% |
| Total | 2,564 | 100.0% |
School Enrollment by Age by Funding Source in Trinity County
Out of a total of 2,564 students who are enrolled in schools in Trinity County, 328 (12.8%) attend a private institution, while the remaining 2,236 (87.2%) are enrolled in public schools. The age group of 3 to 4 year olds has the highest likelihood of being enrolled in private schools, with 47 (88.7% in the age bracket) enrolled. Conversely, the age group of 18 to 19 year olds has the lowest likelihood of being enrolled in a private school, with 215 (100.0% in the age bracket) attending a public institution.
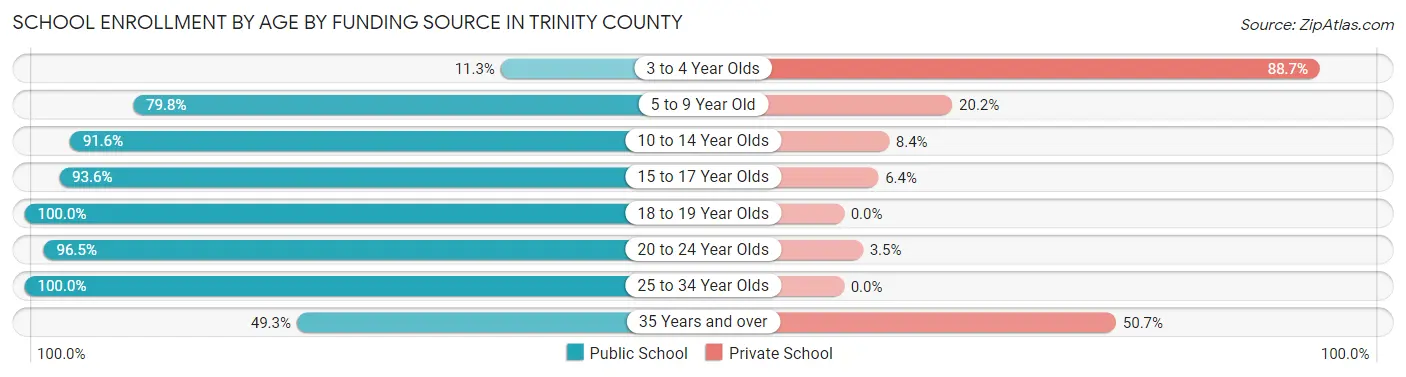
| Age Bracket | Public School | Private School |
| 3 to 4 Year Olds | 6 (11.3%) | 47 (88.7%) |
| 5 to 9 Year Old | 553 (79.8%) | 140 (20.2%) |
| 10 to 14 Year Olds | 740 (91.6%) | 68 (8.4%) |
| 15 to 17 Year Olds | 494 (93.6%) | 34 (6.4%) |
| 18 to 19 Year Olds | 215 (100.0%) | 0 (0.0%) |
| 20 to 24 Year Olds | 109 (96.5%) | 4 (3.5%) |
| 25 to 34 Year Olds | 83 (100.0%) | 0 (0.0%) |
| 35 Years and over | 35 (49.3%) | 36 (50.7%) |
| Total | 2,236 (87.2%) | 328 (12.8%) |
Educational Attainment by Field of Study in Trinity County
Business (338 | 21.6%), education (271 | 17.4%), engineering (170 | 10.9%), bio, nature & agricultural (142 | 9.1%), and social sciences (127 | 8.1%) are the most common fields of study among 1,561 individuals in Trinity County who have obtained a bachelor's degree or higher.
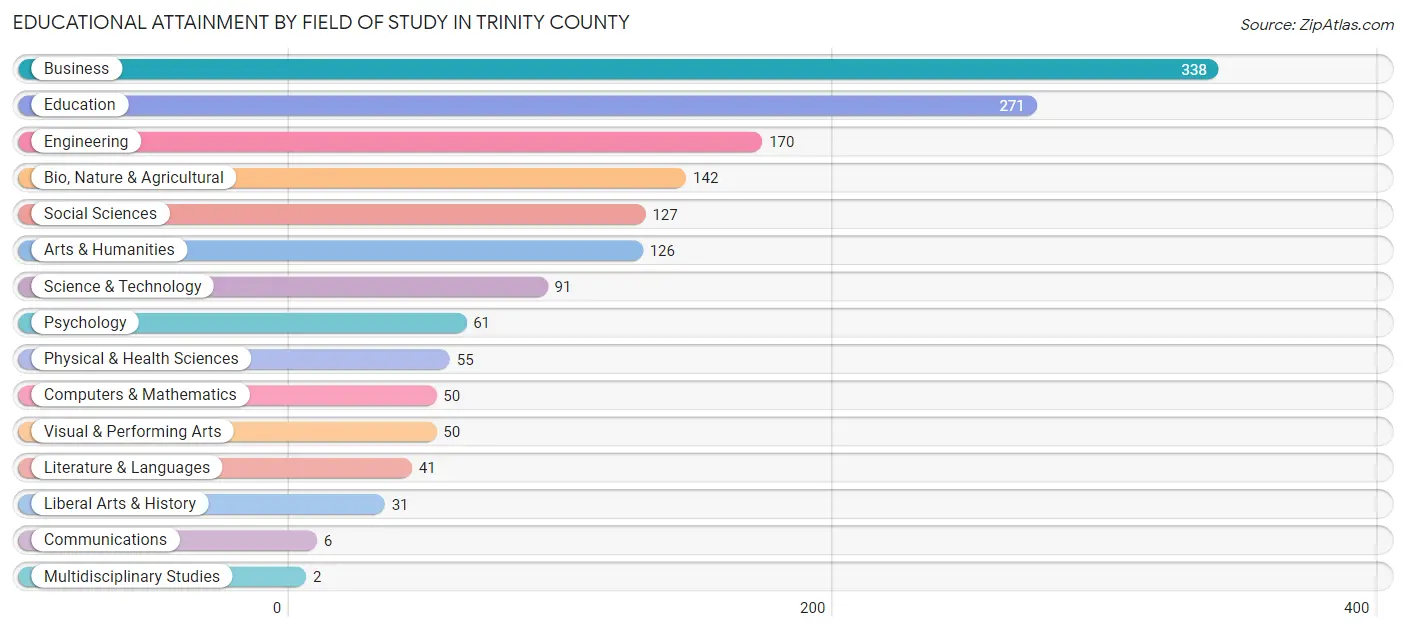
| Field of Study | # Graduates | % Graduates |
| Computers & Mathematics | 50 | 3.2% |
| Bio, Nature & Agricultural | 142 | 9.1% |
| Physical & Health Sciences | 55 | 3.5% |
| Psychology | 61 | 3.9% |
| Social Sciences | 127 | 8.1% |
| Engineering | 170 | 10.9% |
| Multidisciplinary Studies | 2 | 0.1% |
| Science & Technology | 91 | 5.8% |
| Business | 338 | 21.6% |
| Education | 271 | 17.4% |
| Literature & Languages | 41 | 2.6% |
| Liberal Arts & History | 31 | 2.0% |
| Visual & Performing Arts | 50 | 3.2% |
| Communications | 6 | 0.4% |
| Arts & Humanities | 126 | 8.1% |
| Total | 1,561 | 100.0% |
Transportation & Commute in Trinity County
Vehicle Availability by Sex in Trinity County
The most prevalent vehicle ownership categories in Trinity County are males with 2 vehicles (1,239, accounting for 47.4%) and females with 2 vehicles (1,089, making up 55.4%).
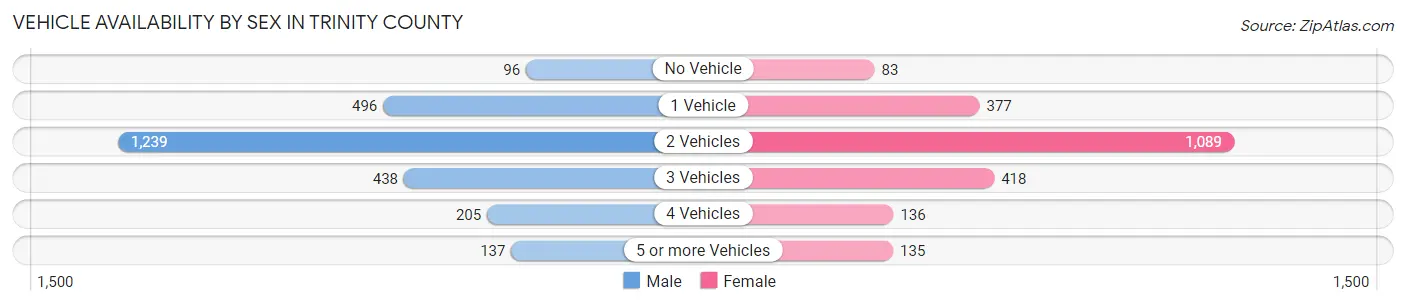
| Vehicles Available | Male | Female |
| No Vehicle | 96 (3.7%) | 83 (3.7%) |
| 1 Vehicle | 496 (19.0%) | 377 (16.9%) |
| 2 Vehicles | 1,239 (47.4%) | 1,089 (48.7%) |
| 3 Vehicles | 438 (16.8%) | 418 (18.7%) |
| 4 Vehicles | 205 (7.9%) | 136 (6.1%) |
| 5 or more Vehicles | 137 (5.2%) | 135 (6.0%) |
| Total | 2,611 (100.0%) | 2,238 (100.0%) |
Commute Time in Trinity County
The most frequently occuring commute durations in Trinity County are 30 to 34 minutes (1,131 commuters, 24.8%), 90 or more minutes (504 commuters, 11.1%), and 10 to 14 minutes (443 commuters, 9.7%).
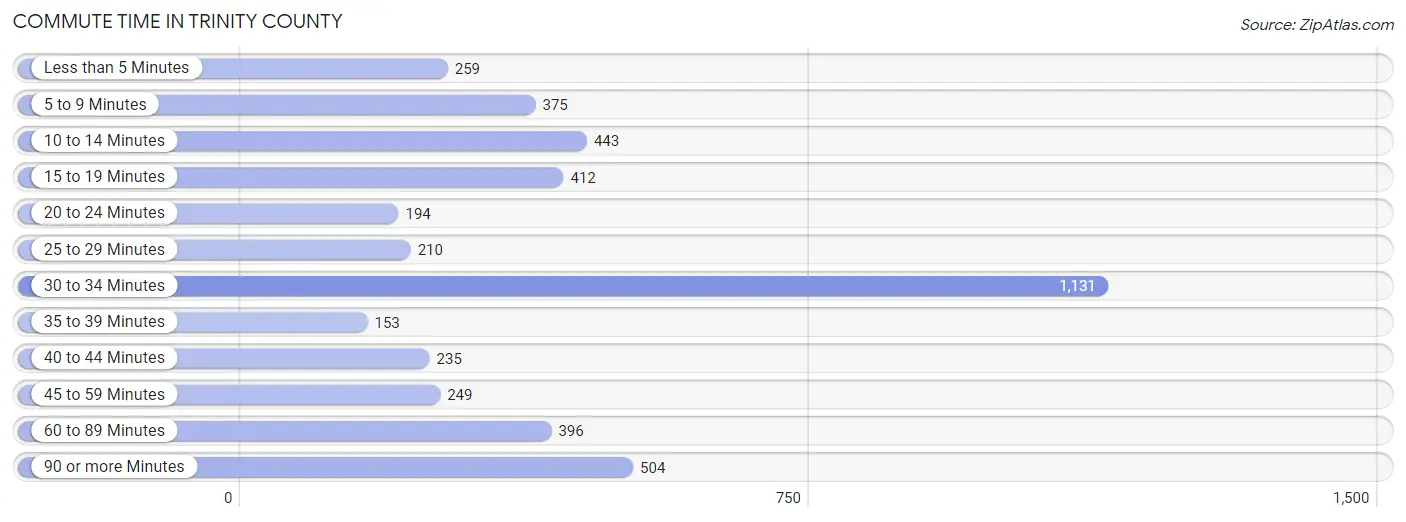
| Commute Time | # Commuters | % Commuters |
| Less than 5 Minutes | 259 | 5.7% |
| 5 to 9 Minutes | 375 | 8.2% |
| 10 to 14 Minutes | 443 | 9.7% |
| 15 to 19 Minutes | 412 | 9.0% |
| 20 to 24 Minutes | 194 | 4.3% |
| 25 to 29 Minutes | 210 | 4.6% |
| 30 to 34 Minutes | 1,131 | 24.8% |
| 35 to 39 Minutes | 153 | 3.4% |
| 40 to 44 Minutes | 235 | 5.1% |
| 45 to 59 Minutes | 249 | 5.5% |
| 60 to 89 Minutes | 396 | 8.7% |
| 90 or more Minutes | 504 | 11.1% |
Commute Time by Sex in Trinity County
The most common commute times in Trinity County are 30 to 34 minutes (549 commuters, 22.3%) for males and 30 to 34 minutes (582 commuters, 27.7%) for females.
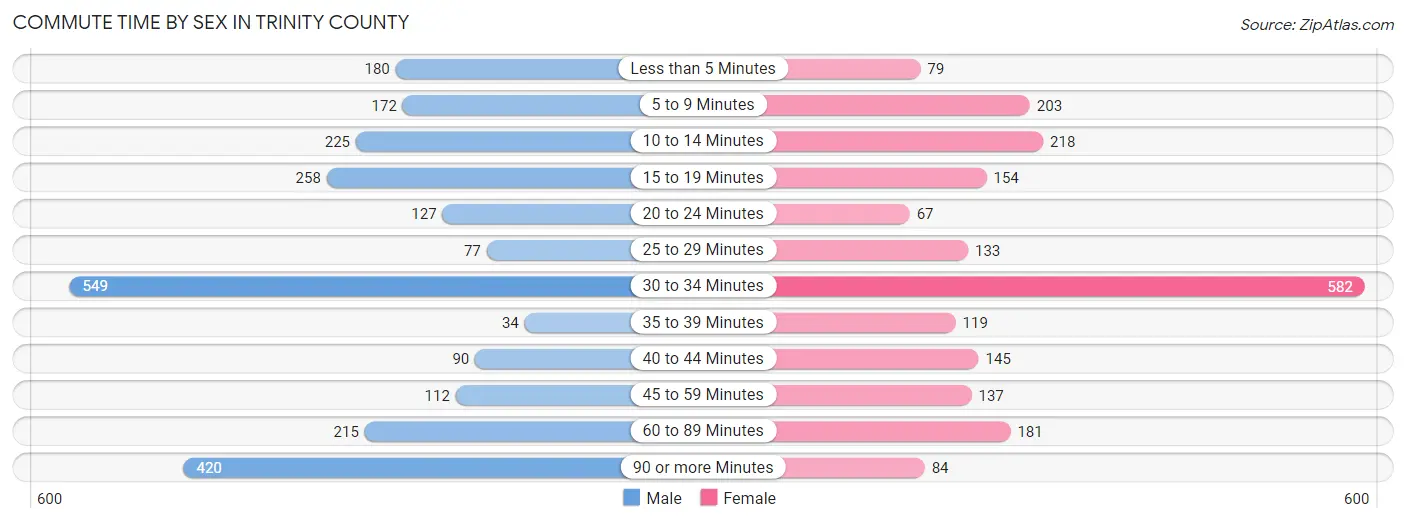
| Commute Time | Male | Female |
| Less than 5 Minutes | 180 (7.3%) | 79 (3.8%) |
| 5 to 9 Minutes | 172 (7.0%) | 203 (9.7%) |
| 10 to 14 Minutes | 225 (9.1%) | 218 (10.4%) |
| 15 to 19 Minutes | 258 (10.5%) | 154 (7.3%) |
| 20 to 24 Minutes | 127 (5.2%) | 67 (3.2%) |
| 25 to 29 Minutes | 77 (3.1%) | 133 (6.3%) |
| 30 to 34 Minutes | 549 (22.3%) | 582 (27.7%) |
| 35 to 39 Minutes | 34 (1.4%) | 119 (5.7%) |
| 40 to 44 Minutes | 90 (3.7%) | 145 (6.9%) |
| 45 to 59 Minutes | 112 (4.5%) | 137 (6.5%) |
| 60 to 89 Minutes | 215 (8.7%) | 181 (8.6%) |
| 90 or more Minutes | 420 (17.1%) | 84 (4.0%) |
Time of Departure to Work by Sex in Trinity County
The most frequent times of departure to work in Trinity County are 6:00 AM to 6:29 AM (545, 22.2%) for males and 7:00 AM to 7:29 AM (373, 17.7%) for females.
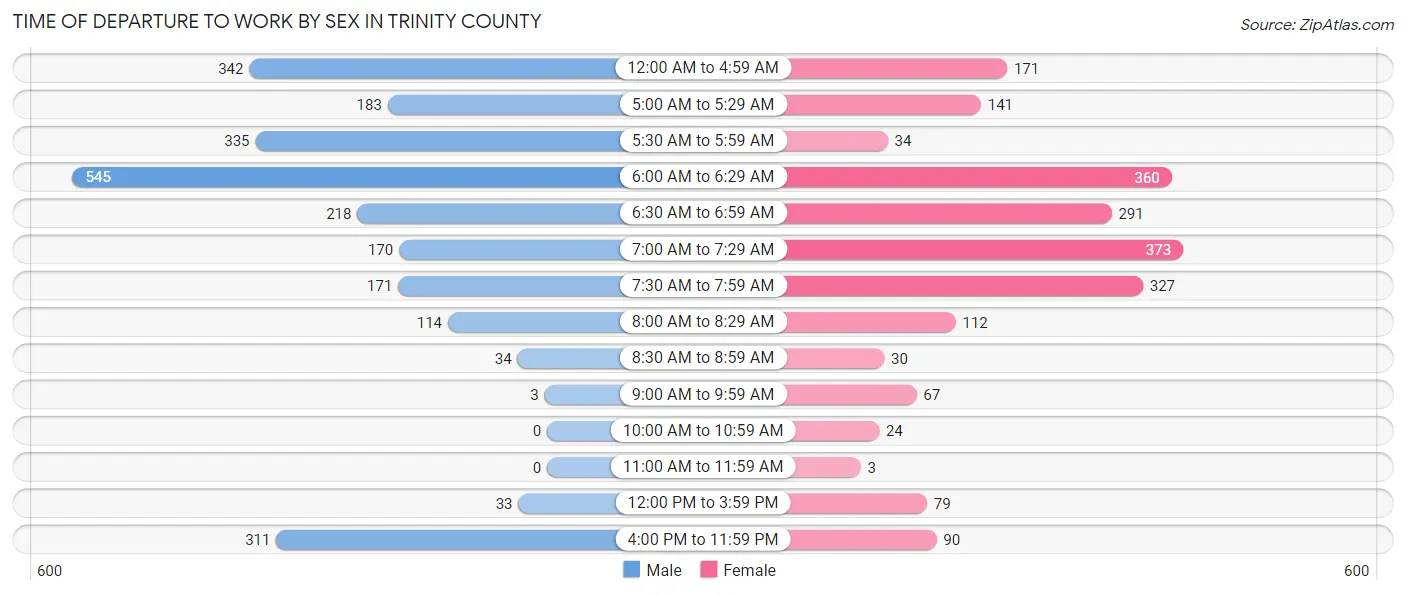
| Time of Departure | Male | Female |
| 12:00 AM to 4:59 AM | 342 (13.9%) | 171 (8.1%) |
| 5:00 AM to 5:29 AM | 183 (7.4%) | 141 (6.7%) |
| 5:30 AM to 5:59 AM | 335 (13.6%) | 34 (1.6%) |
| 6:00 AM to 6:29 AM | 545 (22.2%) | 360 (17.1%) |
| 6:30 AM to 6:59 AM | 218 (8.9%) | 291 (13.8%) |
| 7:00 AM to 7:29 AM | 170 (6.9%) | 373 (17.7%) |
| 7:30 AM to 7:59 AM | 171 (7.0%) | 327 (15.6%) |
| 8:00 AM to 8:29 AM | 114 (4.6%) | 112 (5.3%) |
| 8:30 AM to 8:59 AM | 34 (1.4%) | 30 (1.4%) |
| 9:00 AM to 9:59 AM | 3 (0.1%) | 67 (3.2%) |
| 10:00 AM to 10:59 AM | 0 (0.0%) | 24 (1.1%) |
| 11:00 AM to 11:59 AM | 0 (0.0%) | 3 (0.1%) |
| 12:00 PM to 3:59 PM | 33 (1.3%) | 79 (3.8%) |
| 4:00 PM to 11:59 PM | 311 (12.7%) | 90 (4.3%) |
| Total | 2,459 (100.0%) | 2,102 (100.0%) |
Housing Occupancy in Trinity County
Occupancy by Ownership in Trinity County
Of the total 5,946 dwellings in Trinity County, owner-occupied units account for 4,542 (76.4%), while renter-occupied units make up 1,404 (23.6%).
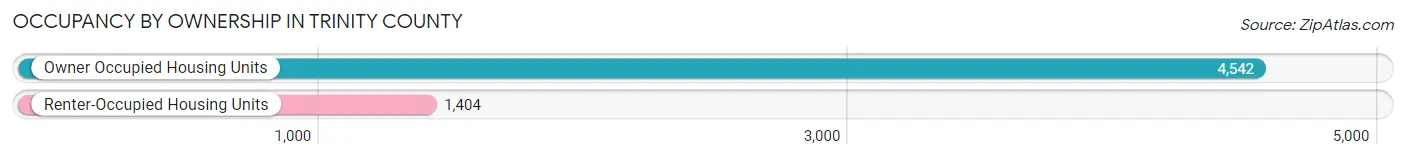
| Occupancy | # Housing Units | % Housing Units |
| Owner Occupied Housing Units | 4,542 | 76.4% |
| Renter-Occupied Housing Units | 1,404 | 23.6% |
| Total Occupied Housing Units | 5,946 | 100.0% |
Occupancy by Household Size in Trinity County
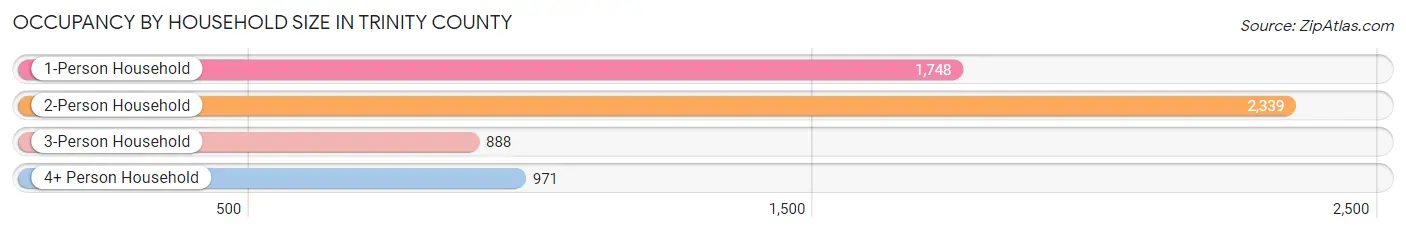
| Household Size | # Housing Units | % Housing Units |
| 1-Person Household | 1,748 | 29.4% |
| 2-Person Household | 2,339 | 39.3% |
| 3-Person Household | 888 | 14.9% |
| 4+ Person Household | 971 | 16.3% |
| Total Housing Units | 5,946 | 100.0% |
Occupancy by Ownership by Household Size in Trinity County
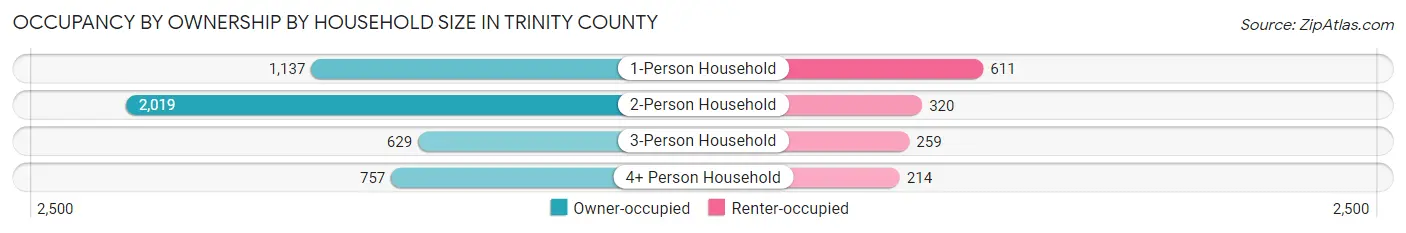
| Household Size | Owner-occupied | Renter-occupied |
| 1-Person Household | 1,137 (65.0%) | 611 (34.9%) |
| 2-Person Household | 2,019 (86.3%) | 320 (13.7%) |
| 3-Person Household | 629 (70.8%) | 259 (29.2%) |
| 4+ Person Household | 757 (78.0%) | 214 (22.0%) |
| Total Housing Units | 4,542 (76.4%) | 1,404 (23.6%) |
Occupancy by Educational Attainment in Trinity County
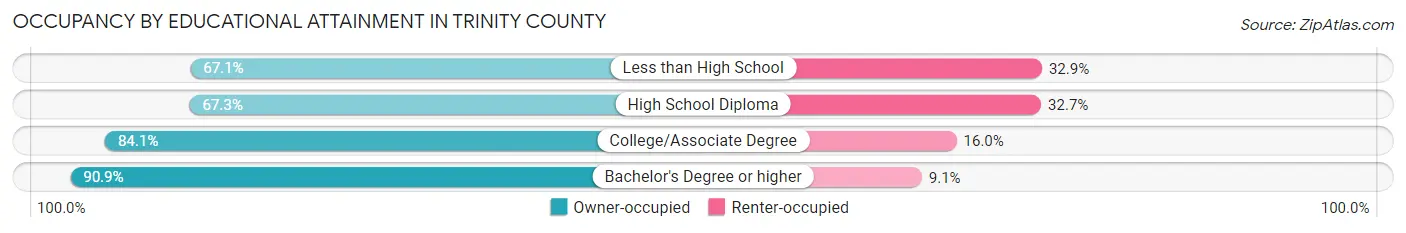
| Household Size | Owner-occupied | Renter-occupied |
| Less than High School | 490 (67.1%) | 240 (32.9%) |
| High School Diploma | 1,578 (67.3%) | 767 (32.7%) |
| College/Associate Degree | 1,671 (84.1%) | 317 (16.0%) |
| Bachelor's Degree or higher | 803 (90.9%) | 80 (9.1%) |
Occupancy by Age of Householder in Trinity County
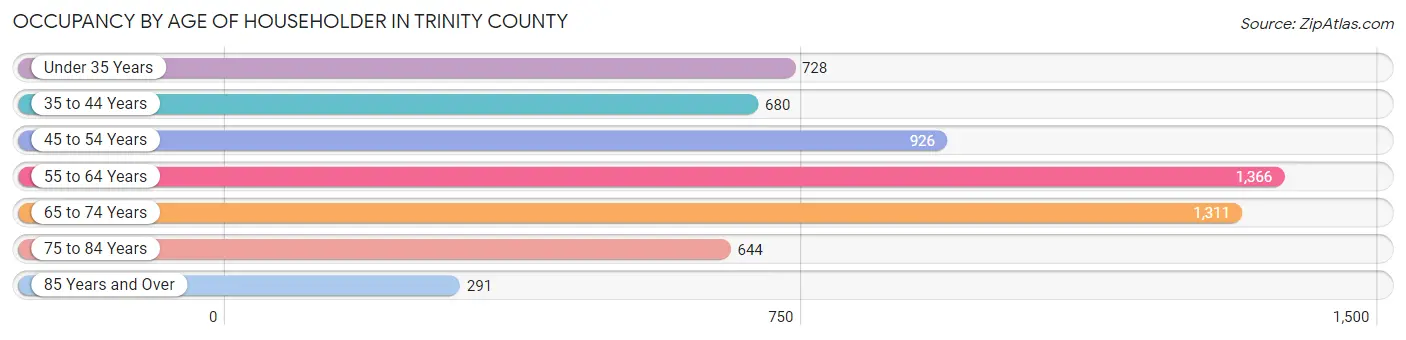
| Age Bracket | # Households | % Households |
| Under 35 Years | 728 | 12.2% |
| 35 to 44 Years | 680 | 11.4% |
| 45 to 54 Years | 926 | 15.6% |
| 55 to 64 Years | 1,366 | 23.0% |
| 65 to 74 Years | 1,311 | 22.1% |
| 75 to 84 Years | 644 | 10.8% |
| 85 Years and Over | 291 | 4.9% |
| Total | 5,946 | 100.0% |
Housing Finances in Trinity County
Median Income by Occupancy in Trinity County
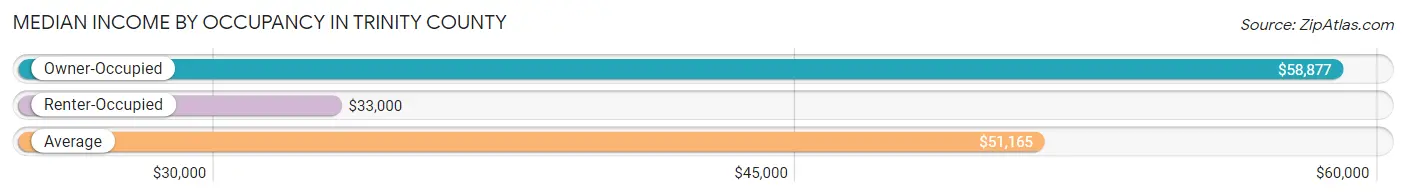
| Occupancy Type | # Households | Median Income |
| Owner-Occupied | 4,542 (76.4%) | $58,877 |
| Renter-Occupied | 1,404 (23.6%) | $33,000 |
| Average | 5,946 (100.0%) | $51,165 |
Occupancy by Householder Income Bracket in Trinity County
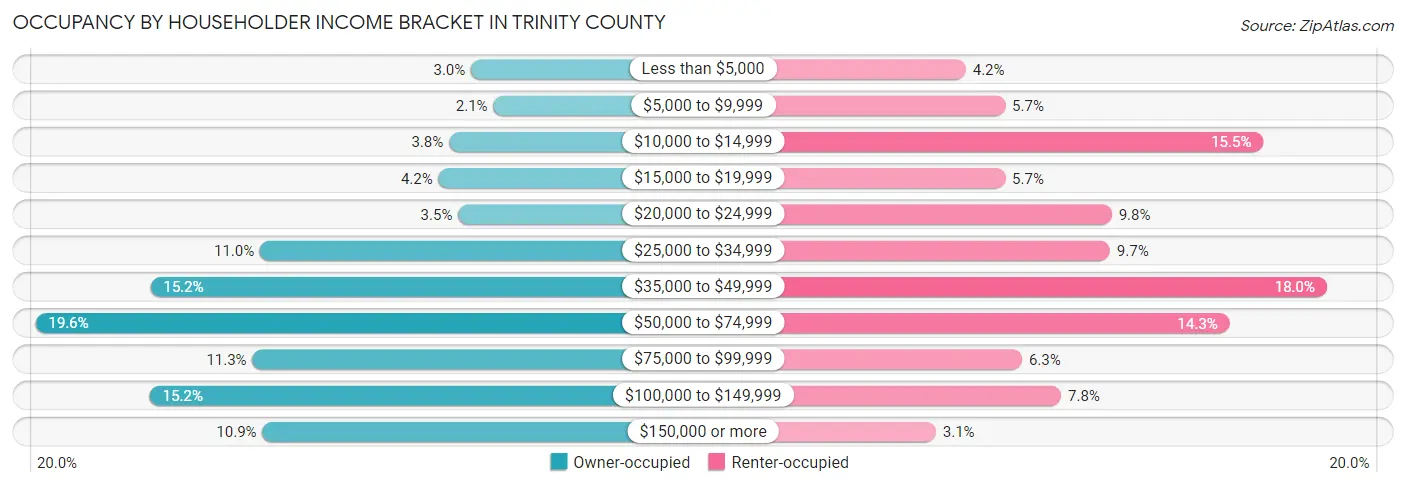
| Income Bracket | Owner-occupied | Renter-occupied |
| Less than $5,000 | 136 (3.0%) | 59 (4.2%) |
| $5,000 to $9,999 | 97 (2.1%) | 80 (5.7%) |
| $10,000 to $14,999 | 174 (3.8%) | 218 (15.5%) |
| $15,000 to $19,999 | 192 (4.2%) | 80 (5.7%) |
| $20,000 to $24,999 | 158 (3.5%) | 137 (9.8%) |
| $25,000 to $34,999 | 501 (11.0%) | 136 (9.7%) |
| $35,000 to $49,999 | 691 (15.2%) | 252 (17.9%) |
| $50,000 to $74,999 | 890 (19.6%) | 200 (14.2%) |
| $75,000 to $99,999 | 514 (11.3%) | 89 (6.3%) |
| $100,000 to $149,999 | 692 (15.2%) | 110 (7.8%) |
| $150,000 or more | 497 (10.9%) | 43 (3.1%) |
| Total | 4,542 (100.0%) | 1,404 (100.0%) |
Monthly Housing Cost Tiers in Trinity County
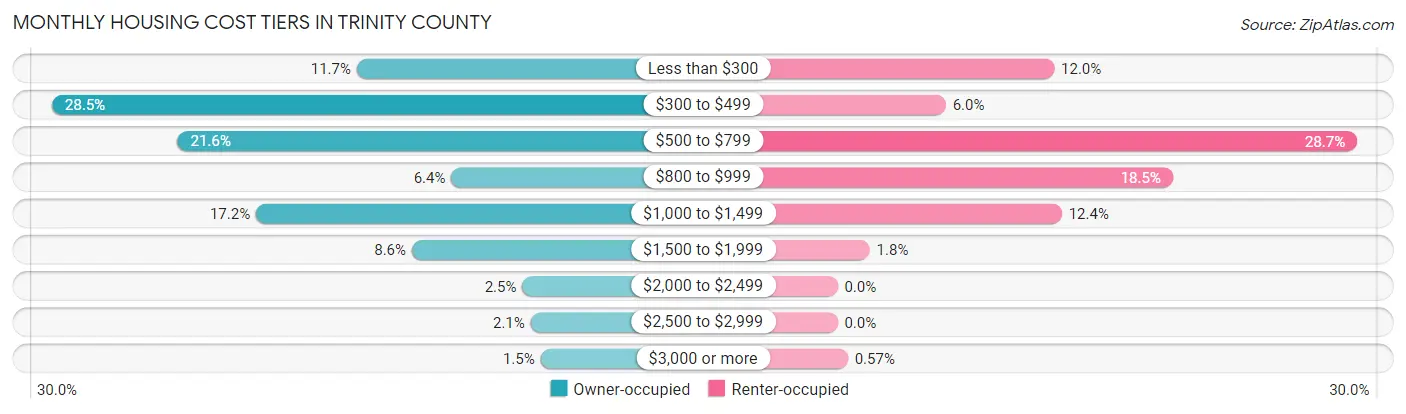
| Monthly Cost | Owner-occupied | Renter-occupied |
| Less than $300 | 529 (11.7%) | 168 (12.0%) |
| $300 to $499 | 1,294 (28.5%) | 84 (6.0%) |
| $500 to $799 | 979 (21.5%) | 403 (28.7%) |
| $800 to $999 | 292 (6.4%) | 260 (18.5%) |
| $1,000 to $1,499 | 782 (17.2%) | 174 (12.4%) |
| $1,500 to $1,999 | 391 (8.6%) | 25 (1.8%) |
| $2,000 to $2,499 | 114 (2.5%) | 0 (0.0%) |
| $2,500 to $2,999 | 93 (2.1%) | 0 (0.0%) |
| $3,000 or more | 68 (1.5%) | 8 (0.6%) |
| Total | 4,542 (100.0%) | 1,404 (100.0%) |
Physical Housing Characteristics in Trinity County
Housing Structures in Trinity County
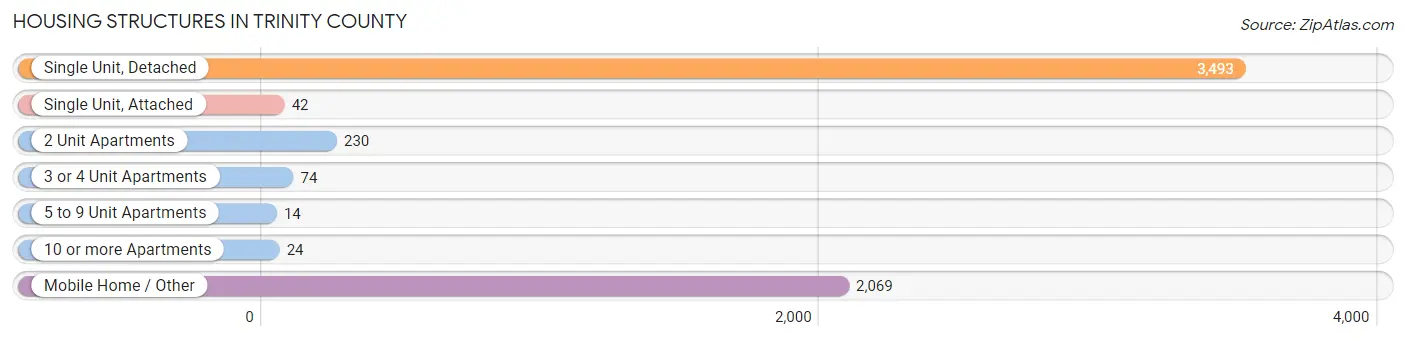
| Structure Type | # Housing Units | % Housing Units |
| Single Unit, Detached | 3,493 | 58.8% |
| Single Unit, Attached | 42 | 0.7% |
| 2 Unit Apartments | 230 | 3.9% |
| 3 or 4 Unit Apartments | 74 | 1.2% |
| 5 to 9 Unit Apartments | 14 | 0.2% |
| 10 or more Apartments | 24 | 0.4% |
| Mobile Home / Other | 2,069 | 34.8% |
| Total | 5,946 | 100.0% |
Housing Structures by Occupancy in Trinity County
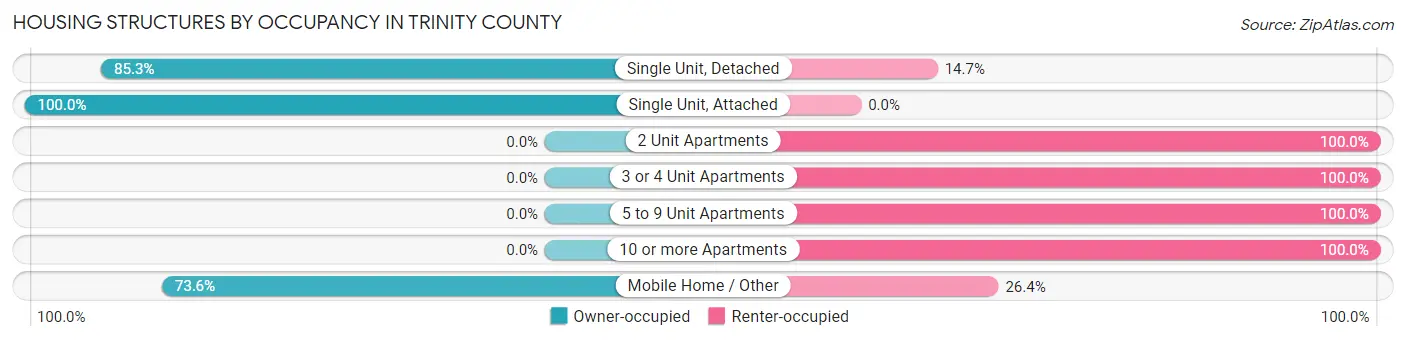
| Structure Type | Owner-occupied | Renter-occupied |
| Single Unit, Detached | 2,978 (85.3%) | 515 (14.7%) |
| Single Unit, Attached | 42 (100.0%) | 0 (0.0%) |
| 2 Unit Apartments | 0 (0.0%) | 230 (100.0%) |
| 3 or 4 Unit Apartments | 0 (0.0%) | 74 (100.0%) |
| 5 to 9 Unit Apartments | 0 (0.0%) | 14 (100.0%) |
| 10 or more Apartments | 0 (0.0%) | 24 (100.0%) |
| Mobile Home / Other | 1,522 (73.6%) | 547 (26.4%) |
| Total | 4,542 (76.4%) | 1,404 (23.6%) |
Housing Structures by Number of Rooms in Trinity County
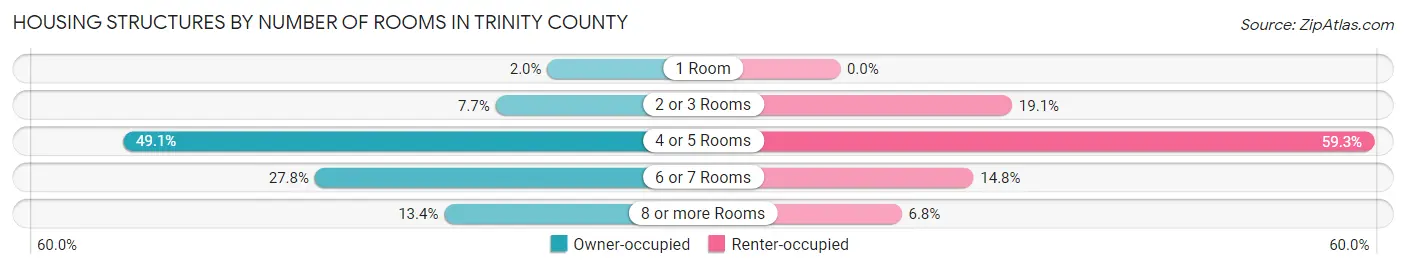
| Number of Rooms | Owner-occupied | Renter-occupied |
| 1 Room | 90 (2.0%) | 0 (0.0%) |
| 2 or 3 Rooms | 351 (7.7%) | 268 (19.1%) |
| 4 or 5 Rooms | 2,229 (49.1%) | 832 (59.3%) |
| 6 or 7 Rooms | 1,262 (27.8%) | 208 (14.8%) |
| 8 or more Rooms | 610 (13.4%) | 96 (6.8%) |
| Total | 4,542 (100.0%) | 1,404 (100.0%) |
Housing Structure by Heating Type in Trinity County
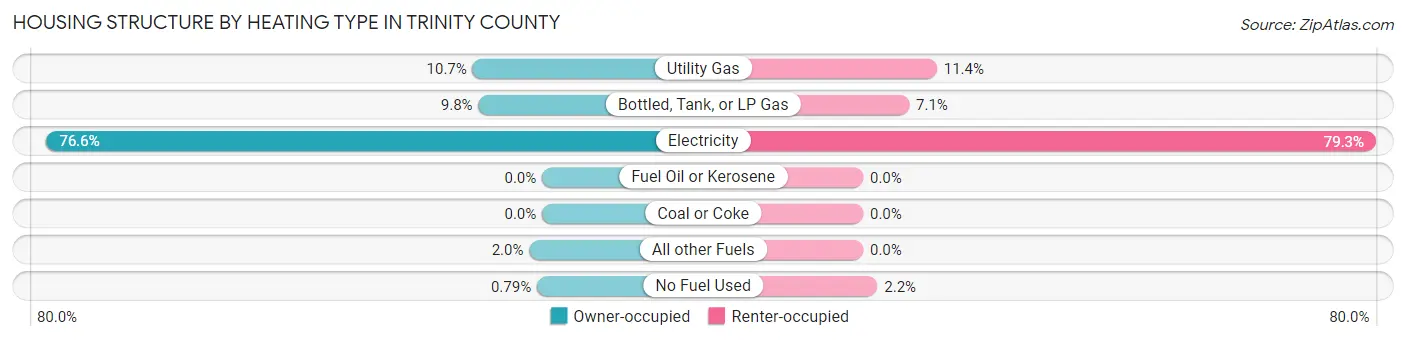
| Heating Type | Owner-occupied | Renter-occupied |
| Utility Gas | 488 (10.7%) | 160 (11.4%) |
| Bottled, Tank, or LP Gas | 447 (9.8%) | 100 (7.1%) |
| Electricity | 3,481 (76.6%) | 1,113 (79.3%) |
| Fuel Oil or Kerosene | 0 (0.0%) | 0 (0.0%) |
| Coal or Coke | 0 (0.0%) | 0 (0.0%) |
| All other Fuels | 90 (2.0%) | 0 (0.0%) |
| No Fuel Used | 36 (0.8%) | 31 (2.2%) |
| Total | 4,542 (100.0%) | 1,404 (100.0%) |
Household Vehicle Usage in Trinity County
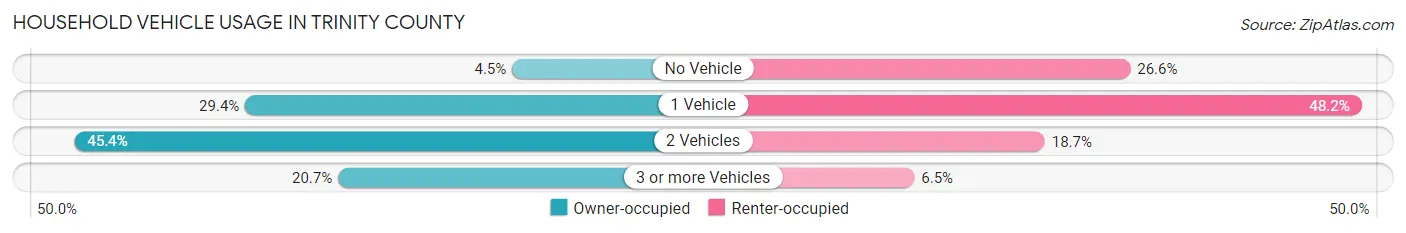
| Vehicles per Household | Owner-occupied | Renter-occupied |
| No Vehicle | 204 (4.5%) | 374 (26.6%) |
| 1 Vehicle | 1,336 (29.4%) | 677 (48.2%) |
| 2 Vehicles | 2,060 (45.4%) | 262 (18.7%) |
| 3 or more Vehicles | 942 (20.7%) | 91 (6.5%) |
| Total | 4,542 (100.0%) | 1,404 (100.0%) |
Real Estate & Mortgages in Trinity County
Real Estate and Mortgage Overview in Trinity County
| Characteristic | Without Mortgage | With Mortgage |
| Housing Units | 2,933 | 1,609 |
| Median Property Value | $89,400 | $140,800 |
| Median Household Income | $44,633 | $286 |
| Monthly Housing Costs | $432 | $68 |
| Real Estate Taxes | $987 | $155 |
Property Value by Mortgage Status in Trinity County
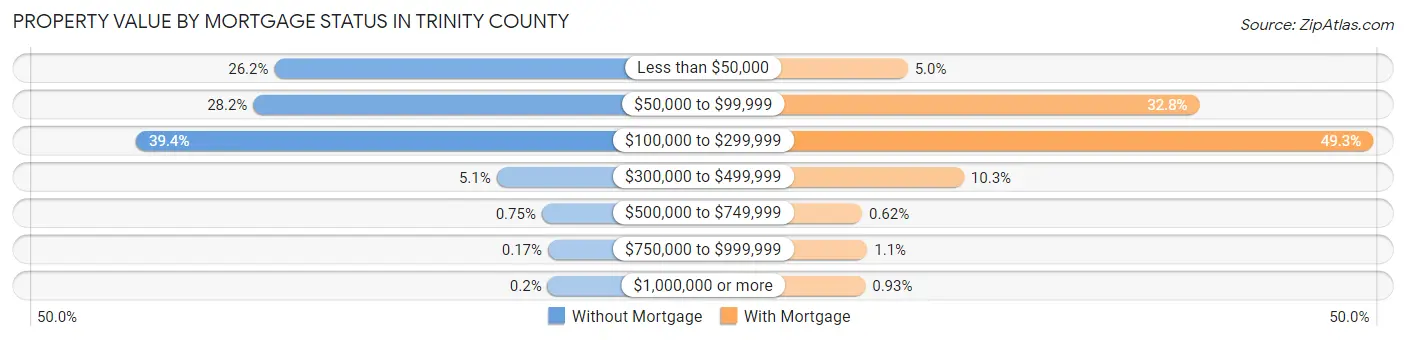
| Property Value | Without Mortgage | With Mortgage |
| Less than $50,000 | 769 (26.2%) | 80 (5.0%) |
| $50,000 to $99,999 | 828 (28.2%) | 527 (32.8%) |
| $100,000 to $299,999 | 1,155 (39.4%) | 793 (49.3%) |
| $300,000 to $499,999 | 148 (5.1%) | 166 (10.3%) |
| $500,000 to $749,999 | 22 (0.7%) | 10 (0.6%) |
| $750,000 to $999,999 | 5 (0.2%) | 18 (1.1%) |
| $1,000,000 or more | 6 (0.2%) | 15 (0.9%) |
| Total | 2,933 (100.0%) | 1,609 (100.0%) |
Household Income by Mortgage Status in Trinity County
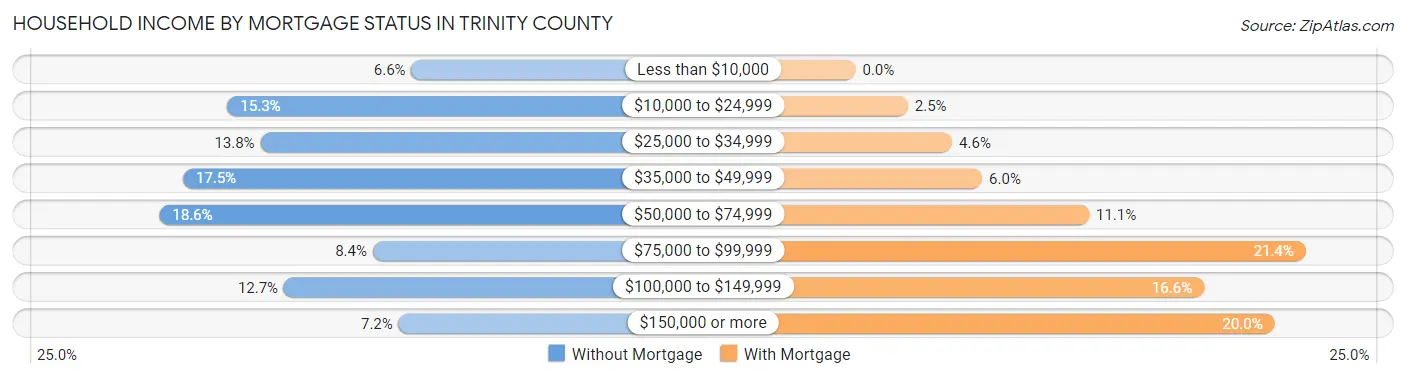
| Household Income | Without Mortgage | With Mortgage |
| Less than $10,000 | 193 (6.6%) | 0 (0.0%) |
| $10,000 to $24,999 | 450 (15.3%) | 40 (2.5%) |
| $25,000 to $34,999 | 404 (13.8%) | 74 (4.6%) |
| $35,000 to $49,999 | 512 (17.5%) | 97 (6.0%) |
| $50,000 to $74,999 | 545 (18.6%) | 179 (11.1%) |
| $75,000 to $99,999 | 247 (8.4%) | 345 (21.4%) |
| $100,000 to $149,999 | 371 (12.7%) | 267 (16.6%) |
| $150,000 or more | 211 (7.2%) | 321 (20.0%) |
| Total | 2,933 (100.0%) | 1,609 (100.0%) |
Property Value to Household Income Ratio in Trinity County
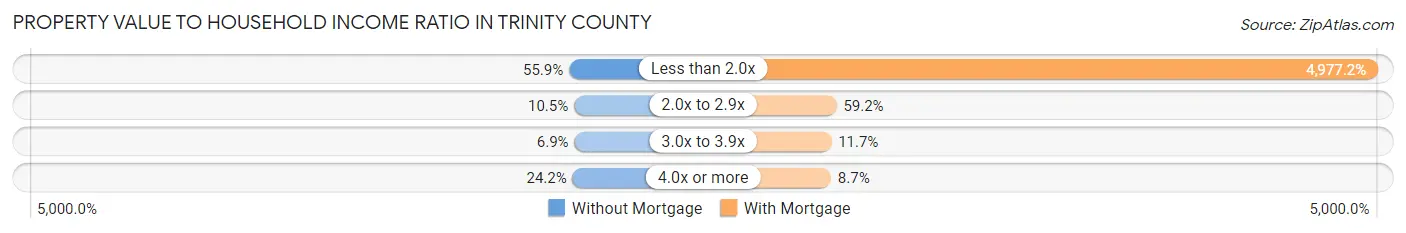
| Value-to-Income Ratio | Without Mortgage | With Mortgage |
| Less than 2.0x | 1,639 (55.9%) | 80,083 (4,977.2%) |
| 2.0x to 2.9x | 309 (10.5%) | 952 (59.2%) |
| 3.0x to 3.9x | 203 (6.9%) | 188 (11.7%) |
| 4.0x or more | 711 (24.2%) | 140 (8.7%) |
| Total | 2,933 (100.0%) | 1,609 (100.0%) |
Real Estate Taxes by Mortgage Status in Trinity County
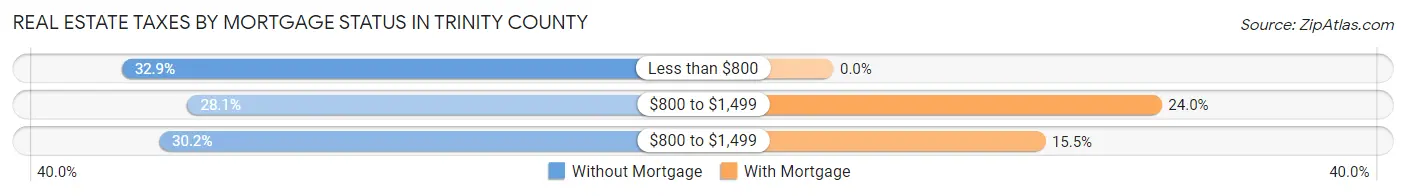
| Property Taxes | Without Mortgage | With Mortgage |
| Less than $800 | 965 (32.9%) | 0 (0.0%) |
| $800 to $1,499 | 824 (28.1%) | 386 (24.0%) |
| $800 to $1,499 | 885 (30.2%) | 249 (15.5%) |
| Total | 2,933 (100.0%) | 1,609 (100.0%) |
Health & Disability in Trinity County
Health Insurance Coverage by Age in Trinity County
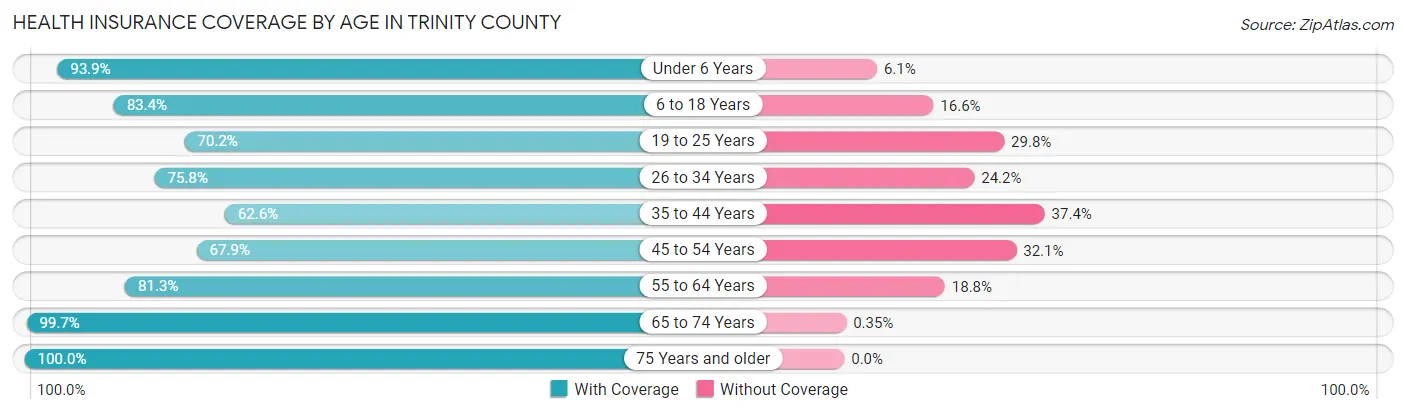
| Age Bracket | With Coverage | Without Coverage |
| Under 6 Years | 846 (93.9%) | 55 (6.1%) |
| 6 to 18 Years | 1,610 (83.4%) | 321 (16.6%) |
| 19 to 25 Years | 704 (70.2%) | 299 (29.8%) |
| 26 to 34 Years | 819 (75.8%) | 262 (24.2%) |
| 35 to 44 Years | 803 (62.6%) | 479 (37.4%) |
| 45 to 54 Years | 1,074 (67.9%) | 507 (32.1%) |
| 55 to 64 Years | 1,846 (81.2%) | 426 (18.8%) |
| 65 to 74 Years | 2,019 (99.7%) | 7 (0.4%) |
| 75 Years and older | 1,505 (100.0%) | 0 (0.0%) |
| Total | 11,226 (82.7%) | 2,356 (17.3%) |
Health Insurance Coverage by Citizenship Status in Trinity County
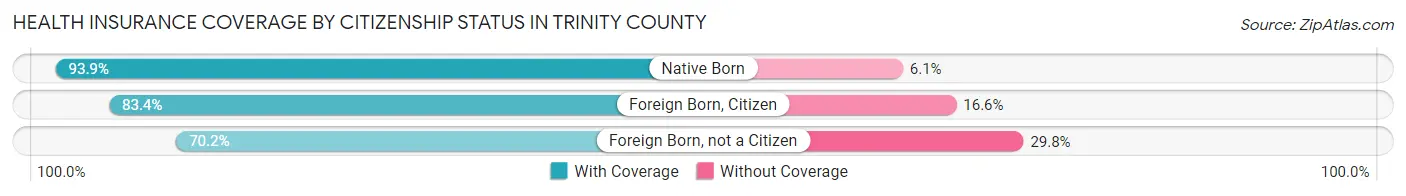
| Citizenship Status | With Coverage | Without Coverage |
| Native Born | 846 (93.9%) | 55 (6.1%) |
| Foreign Born, Citizen | 1,610 (83.4%) | 321 (16.6%) |
| Foreign Born, not a Citizen | 704 (70.2%) | 299 (29.8%) |
Health Insurance Coverage by Household Income in Trinity County
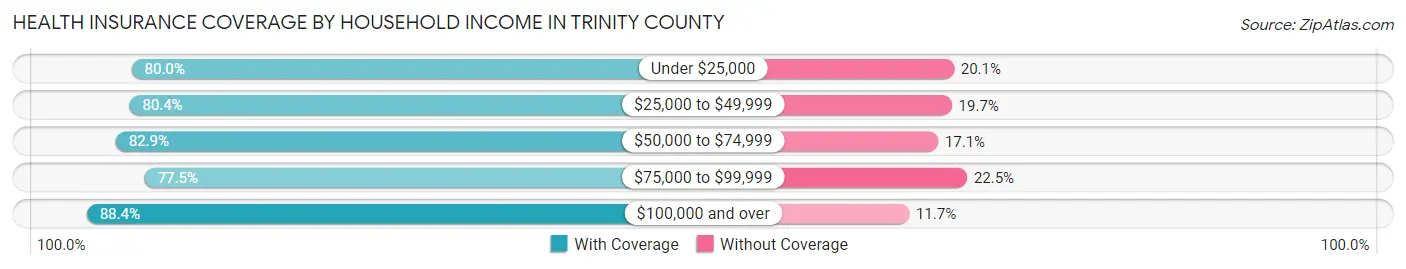
| Household Income | With Coverage | Without Coverage |
| Under $25,000 | 1,774 (79.9%) | 445 (20.1%) |
| $25,000 to $49,999 | 2,600 (80.3%) | 636 (19.7%) |
| $50,000 to $74,999 | 2,224 (82.9%) | 458 (17.1%) |
| $75,000 to $99,999 | 1,305 (77.5%) | 379 (22.5%) |
| $100,000 and over | 3,323 (88.3%) | 438 (11.7%) |
Public vs Private Health Insurance Coverage by Age in Trinity County
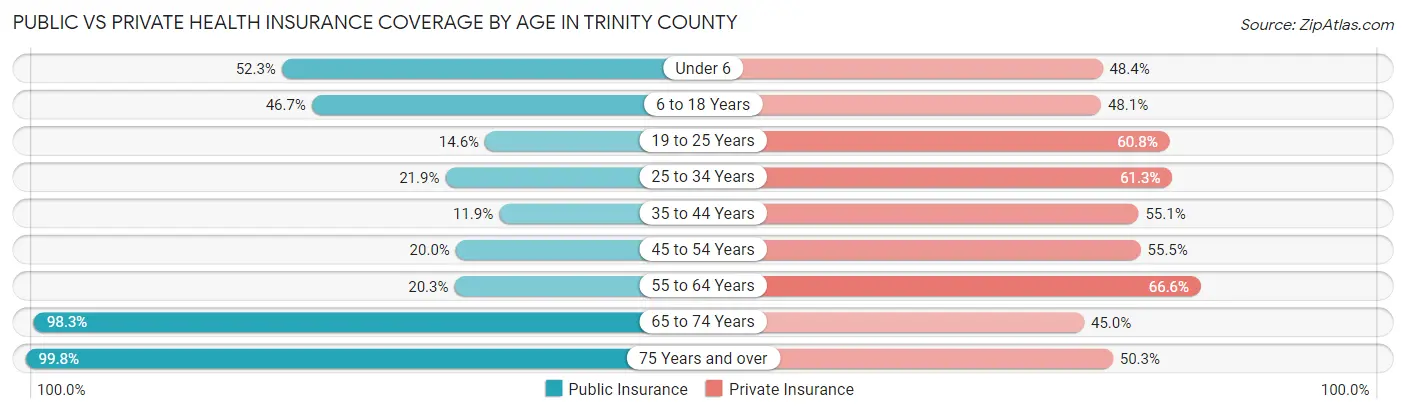
| Age Bracket | Public Insurance | Private Insurance |
| Under 6 | 471 (52.3%) | 436 (48.4%) |
| 6 to 18 Years | 902 (46.7%) | 929 (48.1%) |
| 19 to 25 Years | 146 (14.6%) | 610 (60.8%) |
| 25 to 34 Years | 237 (21.9%) | 663 (61.3%) |
| 35 to 44 Years | 153 (11.9%) | 706 (55.1%) |
| 45 to 54 Years | 316 (20.0%) | 877 (55.5%) |
| 55 to 64 Years | 460 (20.3%) | 1,514 (66.6%) |
| 65 to 74 Years | 1,991 (98.3%) | 911 (45.0%) |
| 75 Years and over | 1,502 (99.8%) | 757 (50.3%) |
| Total | 6,178 (45.5%) | 7,403 (54.5%) |
Disability Status by Sex by Age in Trinity County
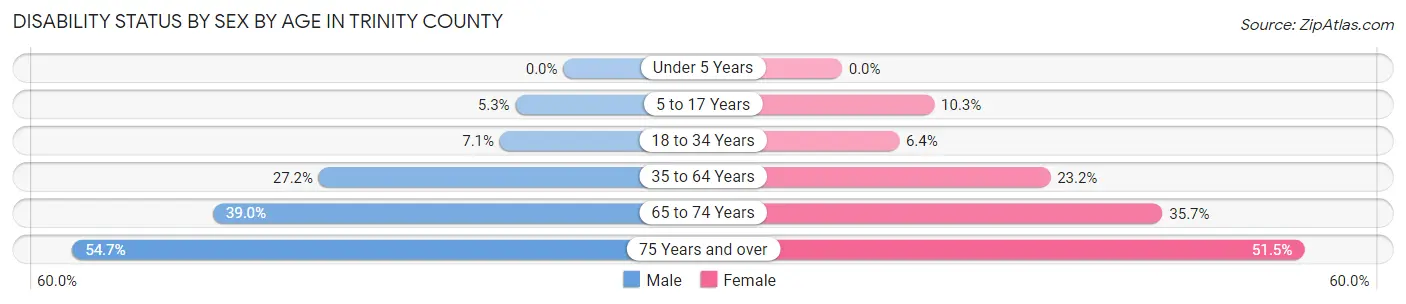
| Age Bracket | Male | Female |
| Under 5 Years | 0 (0.0%) | 0 (0.0%) |
| 5 to 17 Years | 59 (5.3%) | 97 (10.3%) |
| 18 to 34 Years | 74 (7.1%) | 74 (6.4%) |
| 35 to 64 Years | 685 (27.2%) | 608 (23.2%) |
| 65 to 74 Years | 395 (39.0%) | 362 (35.7%) |
| 75 Years and over | 397 (54.7%) | 401 (51.5%) |
Disability Class by Sex by Age in Trinity County
Disability Class: Hearing Difficulty
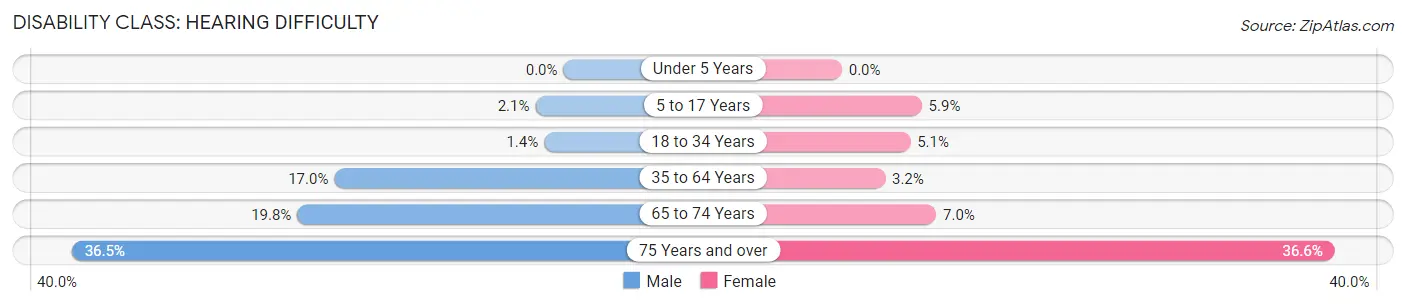
| Age Bracket | Male | Female |
| Under 5 Years | 0 (0.0%) | 0 (0.0%) |
| 5 to 17 Years | 23 (2.1%) | 56 (5.9%) |
| 18 to 34 Years | 15 (1.4%) | 59 (5.1%) |
| 35 to 64 Years | 428 (17.0%) | 84 (3.2%) |
| 65 to 74 Years | 200 (19.8%) | 71 (7.0%) |
| 75 Years and over | 265 (36.5%) | 285 (36.6%) |
Disability Class: Vision Difficulty
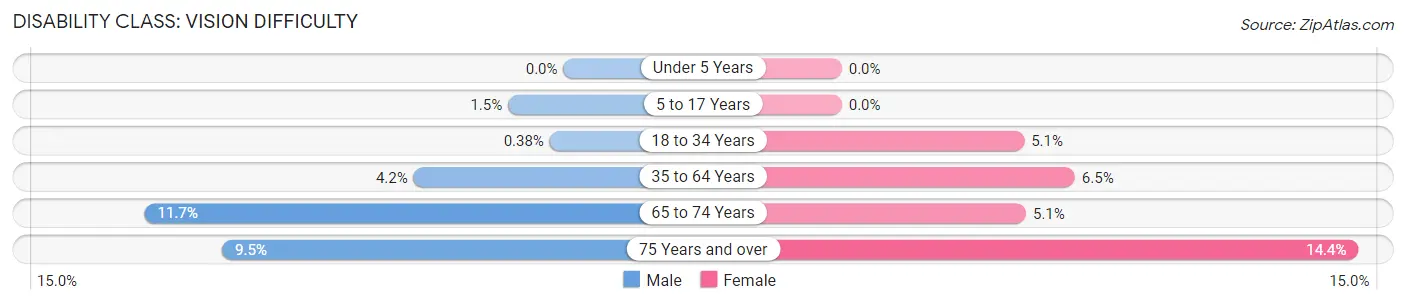
| Age Bracket | Male | Female |
| Under 5 Years | 0 (0.0%) | 0 (0.0%) |
| 5 to 17 Years | 17 (1.5%) | 0 (0.0%) |
| 18 to 34 Years | 4 (0.4%) | 59 (5.1%) |
| 35 to 64 Years | 105 (4.2%) | 170 (6.5%) |
| 65 to 74 Years | 118 (11.7%) | 52 (5.1%) |
| 75 Years and over | 69 (9.5%) | 112 (14.4%) |
Disability Class: Cognitive Difficulty
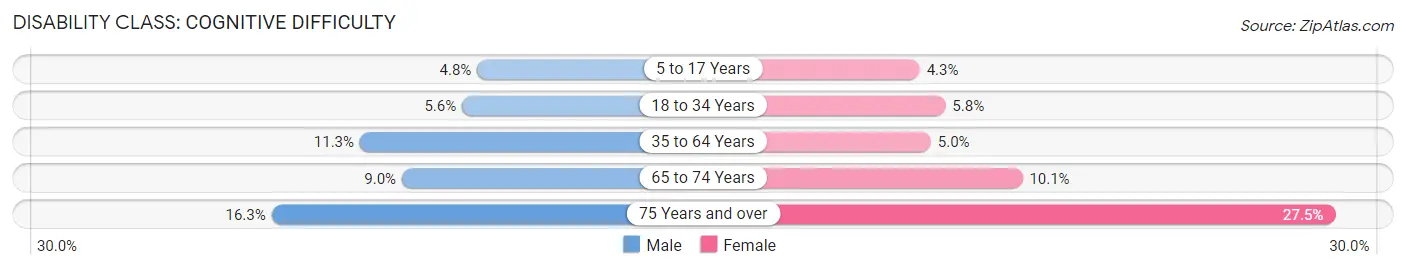
| Age Bracket | Male | Female |
| 5 to 17 Years | 53 (4.8%) | 41 (4.3%) |
| 18 to 34 Years | 59 (5.6%) | 67 (5.8%) |
| 35 to 64 Years | 285 (11.3%) | 130 (5.0%) |
| 65 to 74 Years | 91 (9.0%) | 102 (10.1%) |
| 75 Years and over | 118 (16.3%) | 214 (27.5%) |
Disability Class: Ambulatory Difficulty
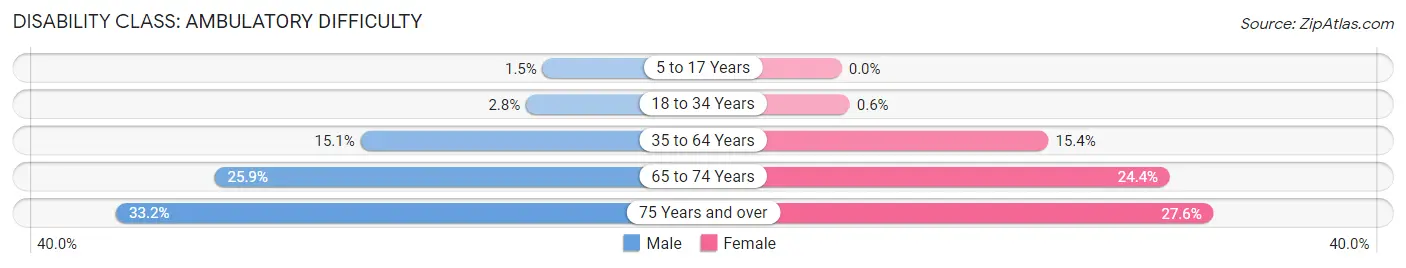
| Age Bracket | Male | Female |
| 5 to 17 Years | 17 (1.5%) | 0 (0.0%) |
| 18 to 34 Years | 29 (2.8%) | 7 (0.6%) |
| 35 to 64 Years | 379 (15.1%) | 402 (15.3%) |
| 65 to 74 Years | 262 (25.9%) | 247 (24.4%) |
| 75 Years and over | 241 (33.2%) | 215 (27.6%) |
Disability Class: Self-Care Difficulty
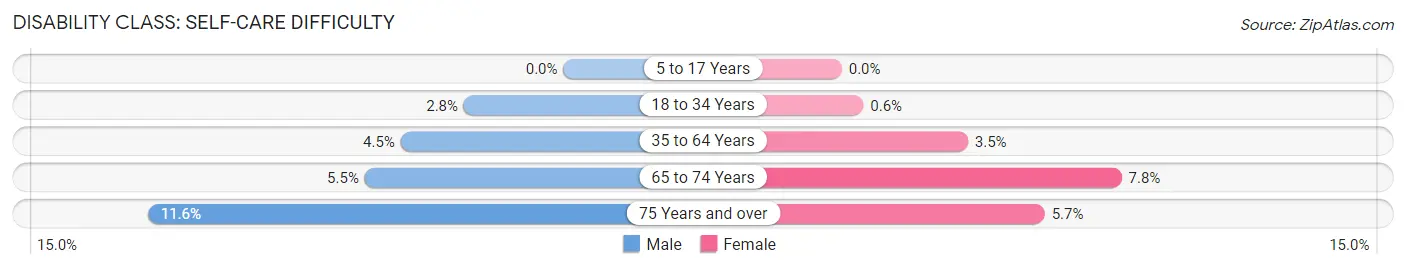
| Age Bracket | Male | Female |
| 5 to 17 Years | 0 (0.0%) | 0 (0.0%) |
| 18 to 34 Years | 29 (2.8%) | 7 (0.6%) |
| 35 to 64 Years | 114 (4.5%) | 92 (3.5%) |
| 65 to 74 Years | 56 (5.5%) | 79 (7.8%) |
| 75 Years and over | 84 (11.6%) | 44 (5.7%) |
Technology Access in Trinity County
Computing Device Access in Trinity County
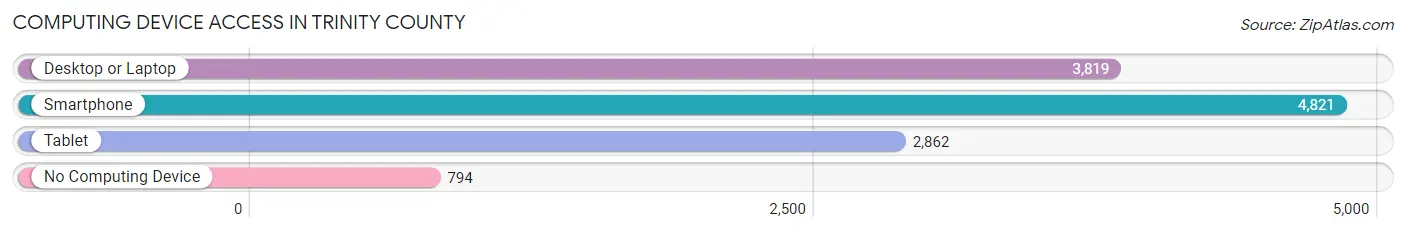
| Device Type | # Households | % Households |
| Desktop or Laptop | 3,819 | 64.2% |
| Smartphone | 4,821 | 81.1% |
| Tablet | 2,862 | 48.1% |
| No Computing Device | 794 | 13.4% |
| Total | 5,946 | 100.0% |
Internet Access in Trinity County
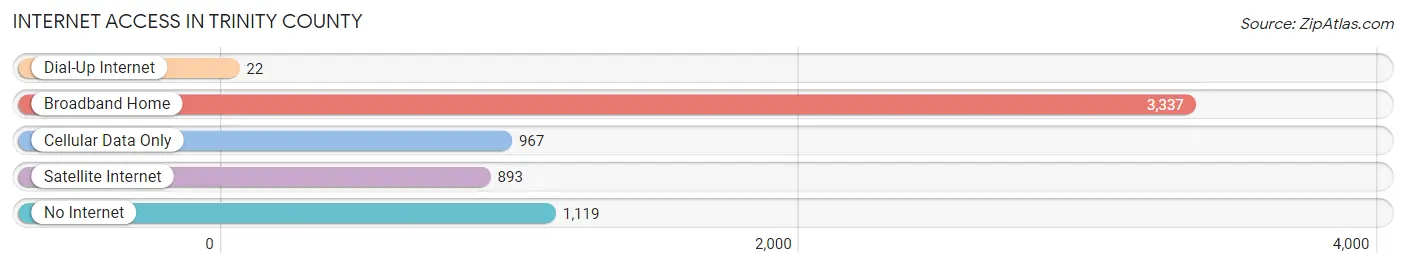
| Internet Type | # Households | % Households |
| Dial-Up Internet | 22 | 0.4% |
| Broadband Home | 3,337 | 56.1% |
| Cellular Data Only | 967 | 16.3% |
| Satellite Internet | 893 | 15.0% |
| No Internet | 1,119 | 18.8% |
| Total | 5,946 | 100.0% |
Trinity County Summary
Trinity County is located in the eastern part of Texas, and is part of the Piney Woods region. It is bordered by Houston, Polk, San Jacinto, Walker, and Anderson counties. The county seat is Groveton, and the largest city is Trinity. The county was established in 1846 and named after the Trinity River.
Geography
Trinity County covers an area of 1,068 square miles, making it the 33rd largest county in Texas. The terrain is mostly flat, with some rolling hills in the northern part of the county. The Trinity River forms the eastern border of the county, and the Neches River forms the western border. The county is mostly forested, with some agricultural land in the south. The climate is humid subtropical, with hot summers and mild winters.
Demographics
As of the 2010 census, Trinity County had a population of 14,585. The racial makeup of the county was 79.3% White, 15.2% African American, 0.7% Native American, 0.3% Asian, 0.1% Pacific Islander, 2.7% from other races, and 1.9% from two or more races. Hispanic or Latino of any race were 6.3% of the population.
Economy
Trinity County’s economy is largely based on agriculture and timber. The county is home to several large timber companies, and the timber industry is the largest employer in the county. Other major industries include oil and gas, manufacturing, and tourism.
History
Trinity County was established in 1846 and named after the Trinity River. The county was originally part of Houston County, but was split off in 1854. The county seat was originally located in Pennington, but was moved to Groveton in 1856.
The county was largely rural until the early 20th century, when the timber industry began to take off. The timber industry was the main driver of the county’s economy for much of the 20th century. In the 1950s, oil and gas production began to take off, and the county’s economy diversified.
In the late 20th century, the county began to attract tourists, and the tourism industry has become an important part of the county’s economy. The county is home to several state parks, including the Davy Crockett National Forest and the Lake Livingston State Park.
Conclusion
Trinity County is a rural county located in the eastern part of Texas. It is bordered by Houston, Polk, San Jacinto, Walker, and Anderson counties. The county was established in 1846 and named after the Trinity River. The county’s economy is largely based on agriculture and timber, and the timber industry is the largest employer in the county. The county also has a growing tourism industry, and is home to several state parks.
Common Questions
What is Per Capita Income in Trinity County?
Per Capita income in Trinity County is $30,911.
What is the Median Family Income in Trinity County?
Median Family Income in Trinity County is $66,215.
What is the Median Household income in Trinity County?
Median Household Income in Trinity County is $51,165.
What is Income or Wage Gap in Trinity County?
Income or Wage Gap in Trinity County is 35.7%.
Women in Trinity County earn 64.3 cents for every dollar earned by a man.
What is Family Income Deficit in Trinity County?
Family Income Deficit in Trinity County is $12,641.
Families that are below poverty line in Trinity County earn $12,641 less on average than the poverty threshold level.
What is Inequality or Gini Index in Trinity County?
Inequality or Gini Index in Trinity County is 0.46.
What is the Total Population of Trinity County?
Total Population of Trinity County is 13,735.
What is the Total Male Population of Trinity County?
Total Male Population of Trinity County is 6,786.
What is the Total Female Population of Trinity County?
Total Female Population of Trinity County is 6,949.
What is the Ratio of Males per 100 Females in Trinity County?
There are 97.65 Males per 100 Females in Trinity County.
What is the Ratio of Females per 100 Males in Trinity County?
There are 102.40 Females per 100 Males in Trinity County.
What is the Median Population Age in Trinity County?
Median Population Age in Trinity County is 50.1 Years.
What is the Average Family Size in Trinity County
Average Family Size in Trinity County is 2.8 People.
What is the Average Household Size in Trinity County
Average Household Size in Trinity County is 2.3 People.
How Large is the Labor Force in Trinity County?
There are 5,372 People in the Labor Forcein in Trinity County.
What is the Percentage of People in the Labor Force in Trinity County?
47.2% of People are in the Labor Force in Trinity County.
What is the Unemployment Rate in Trinity County?
Unemployment Rate in Trinity County is 7.0%.