Tom Green County, TX Map & Demographics
Tom Green County Map
Tom Green County Overview
$33,861
PER CAPITA INCOME
$81,166
AVG FAMILY INCOME
$67,215
AVG HOUSEHOLD INCOME
33.3%
WAGE / INCOME GAP [ % ]
66.7¢/ $1
WAGE / INCOME GAP [ $ ]
$11,680
FAMILY INCOME DEFICIT
0.45
INEQUALITY / GINI INDEX
119,276
TOTAL POPULATION
59,736
MALE POPULATION
59,540
FEMALE POPULATION
100.33
MALES / 100 FEMALES
99.67
FEMALES / 100 MALES
35.0
MEDIAN AGE
3.1
AVG FAMILY SIZE
2.5
AVG HOUSEHOLD SIZE
60,360
LABOR FORCE [ PEOPLE ]
64.4%
PERCENT IN LABOR FORCE
3.2%
UNEMPLOYMENT RATE
Tom Green County Area Codes
Income in Tom Green County
Income Overview in Tom Green County
Per Capita Income in Tom Green County is $33,861, while median incomes of families and households are $81,166 and $67,215 respectively.
| Characteristic | Number | Measure |
| Per Capita Income | 119,276 | $33,861 |
| Median Family Income | 29,322 | $81,166 |
| Mean Family Income | 29,322 | $100,619 |
| Median Household Income | 45,449 | $67,215 |
| Mean Household Income | 45,449 | $86,111 |
| Income Deficit | 29,322 | $11,680 |
| Wage / Income Gap (%) | 119,276 | 33.35% |
| Wage / Income Gap ($) | 119,276 | 66.65¢ per $1 |
| Gini / Inequality Index | 119,276 | 0.45 |
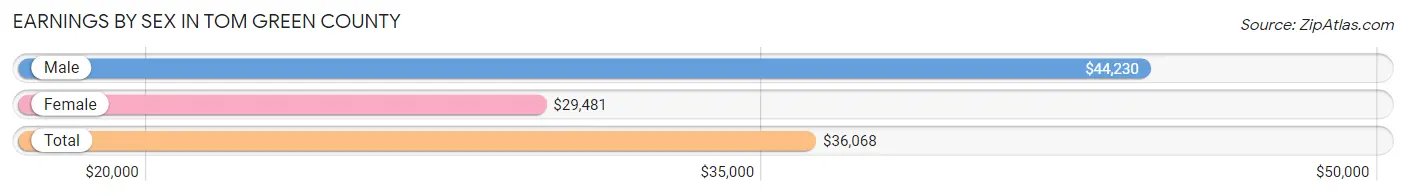
Earnings by Sex in Tom Green County
Average Earnings in Tom Green County are $36,068, $44,230 for men and $29,481 for women, a difference of 33.4%.
| Sex | Number | Average Earnings |
| Male | 34,101 (54.1%) | $44,230 |
| Female | 28,929 (45.9%) | $29,481 |
| Total | 63,030 (100.0%) | $36,068 |
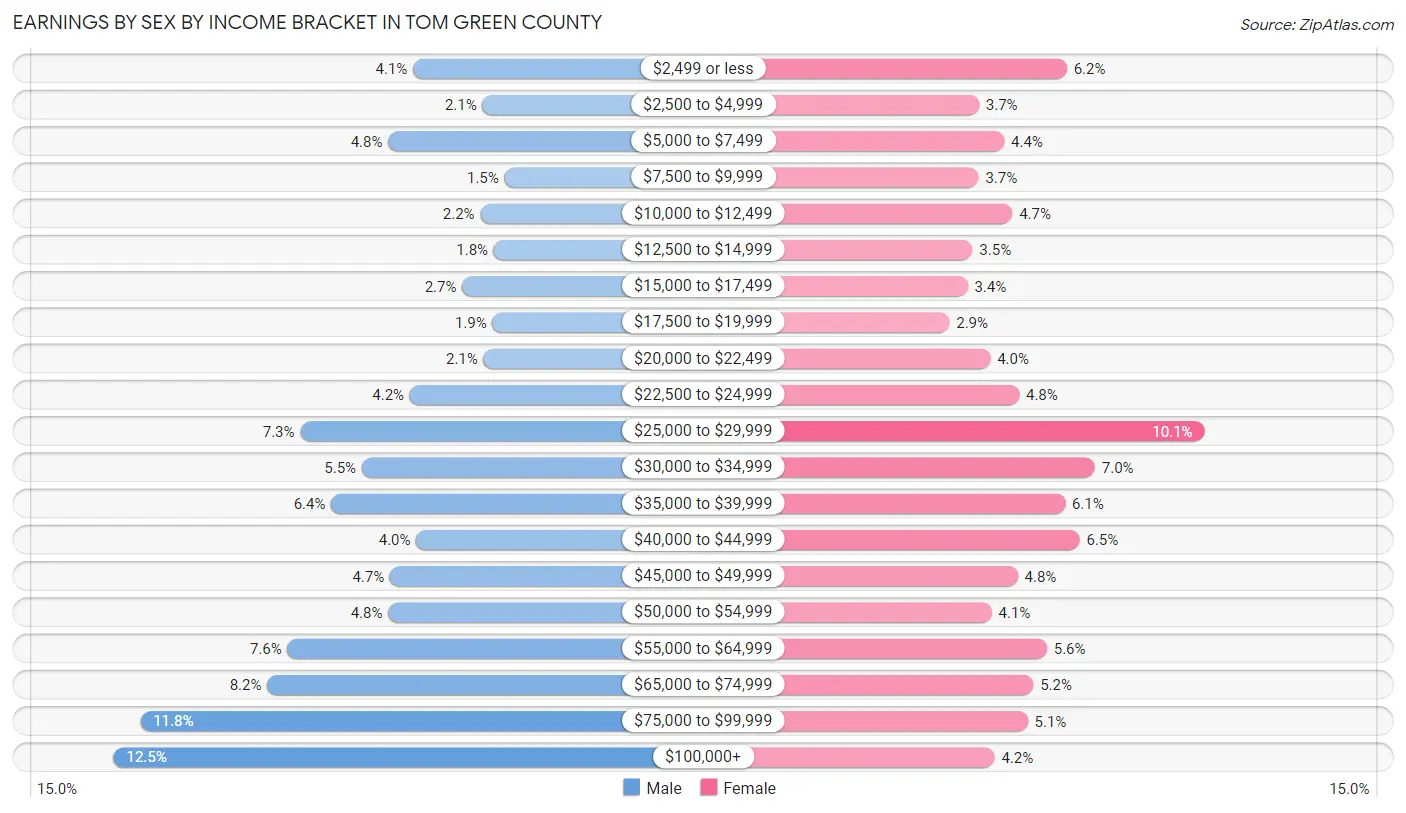
Earnings by Sex by Income Bracket in Tom Green County
The most common earnings brackets in Tom Green County are $100,000+ for men (4,261 | 12.5%) and $25,000 to $29,999 for women (2,908 | 10.1%).
| Income | Male | Female |
| $2,499 or less | 1,390 (4.1%) | 1,789 (6.2%) |
| $2,500 to $4,999 | 725 (2.1%) | 1,072 (3.7%) |
| $5,000 to $7,499 | 1,630 (4.8%) | 1,280 (4.4%) |
| $7,500 to $9,999 | 516 (1.5%) | 1,071 (3.7%) |
| $10,000 to $12,499 | 746 (2.2%) | 1,345 (4.6%) |
| $12,500 to $14,999 | 617 (1.8%) | 1,022 (3.5%) |
| $15,000 to $17,499 | 921 (2.7%) | 982 (3.4%) |
| $17,500 to $19,999 | 631 (1.8%) | 833 (2.9%) |
| $20,000 to $22,499 | 716 (2.1%) | 1,167 (4.0%) |
| $22,500 to $24,999 | 1,422 (4.2%) | 1,400 (4.8%) |
| $25,000 to $29,999 | 2,472 (7.2%) | 2,908 (10.1%) |
| $30,000 to $34,999 | 1,884 (5.5%) | 2,015 (7.0%) |
| $35,000 to $39,999 | 2,177 (6.4%) | 1,772 (6.1%) |
| $40,000 to $44,999 | 1,359 (4.0%) | 1,892 (6.5%) |
| $45,000 to $49,999 | 1,614 (4.7%) | 1,390 (4.8%) |
| $50,000 to $54,999 | 1,631 (4.8%) | 1,178 (4.1%) |
| $55,000 to $64,999 | 2,595 (7.6%) | 1,625 (5.6%) |
| $65,000 to $74,999 | 2,788 (8.2%) | 1,517 (5.2%) |
| $75,000 to $99,999 | 4,006 (11.7%) | 1,471 (5.1%) |
| $100,000+ | 4,261 (12.5%) | 1,200 (4.2%) |
| Total | 34,101 (100.0%) | 28,929 (100.0%) |
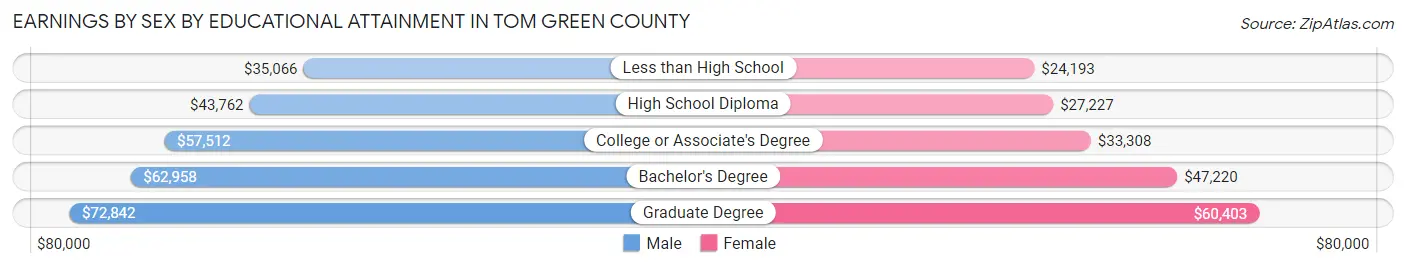
Earnings by Sex by Educational Attainment in Tom Green County
Average earnings in Tom Green County are $53,081 for men and $34,763 for women, a difference of 34.5%. Men with an educational attainment of graduate degree enjoy the highest average annual earnings of $72,842, while those with less than high school education earn the least with $35,066. Women with an educational attainment of graduate degree earn the most with the average annual earnings of $60,403, while those with less than high school education have the smallest earnings of $24,193.
| Educational Attainment | Male Income | Female Income |
| Less than High School | $35,066 | $24,193 |
| High School Diploma | $43,762 | $27,227 |
| College or Associate's Degree | $57,512 | $33,308 |
| Bachelor's Degree | $62,958 | $47,220 |
| Graduate Degree | $72,842 | $60,403 |
| Total | $53,081 | $34,763 |
Family Income in Tom Green County
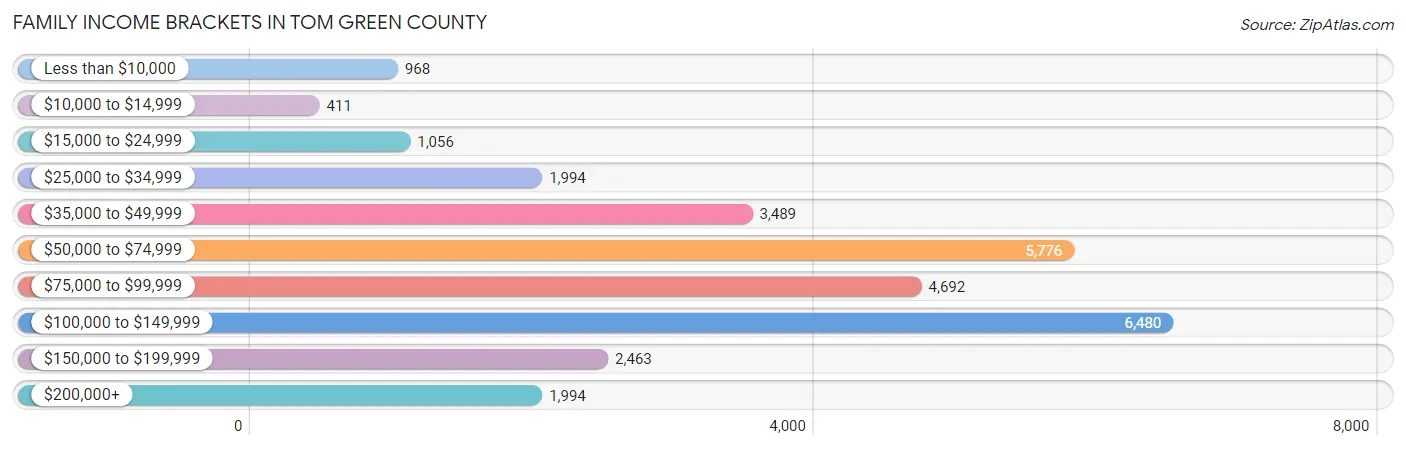
Family Income Brackets in Tom Green County
According to the Tom Green County family income data, there are 6,480 families falling into the $100,000 to $149,999 income range, which is the most common income bracket and makes up 22.1% of all families. Conversely, the $10,000 to $14,999 income bracket is the least frequent group with only 411 families (1.4%) belonging to this category.
| Income Bracket | # Families | % Families |
| Less than $10,000 | 968 | 3.3% |
| $10,000 to $14,999 | 411 | 1.4% |
| $15,000 to $24,999 | 1,056 | 3.6% |
| $25,000 to $34,999 | 1,994 | 6.8% |
| $35,000 to $49,999 | 3,489 | 11.9% |
| $50,000 to $74,999 | 5,776 | 19.7% |
| $75,000 to $99,999 | 4,692 | 16.0% |
| $100,000 to $149,999 | 6,480 | 22.1% |
| $150,000 to $199,999 | 2,463 | 8.4% |
| $200,000+ | 1,994 | 6.8% |
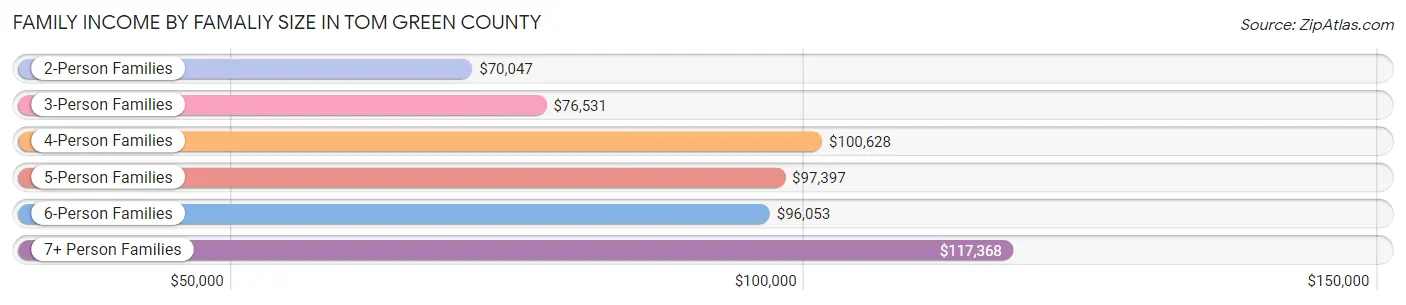
Family Income by Famaliy Size in Tom Green County
7+ person families (536 | 1.8%) account for the highest median family income in Tom Green County with $117,368 per family, while 2-person families (13,968 | 47.6%) have the highest median income of $35,024 per family member.
| Income Bracket | # Families | Median Income |
| 2-Person Families | 13,968 (47.6%) | $70,047 |
| 3-Person Families | 6,093 (20.8%) | $76,531 |
| 4-Person Families | 5,200 (17.7%) | $100,628 |
| 5-Person Families | 2,393 (8.2%) | $97,397 |
| 6-Person Families | 1,132 (3.9%) | $96,053 |
| 7+ Person Families | 536 (1.8%) | $117,368 |
| Total | 29,322 (100.0%) | $81,166 |
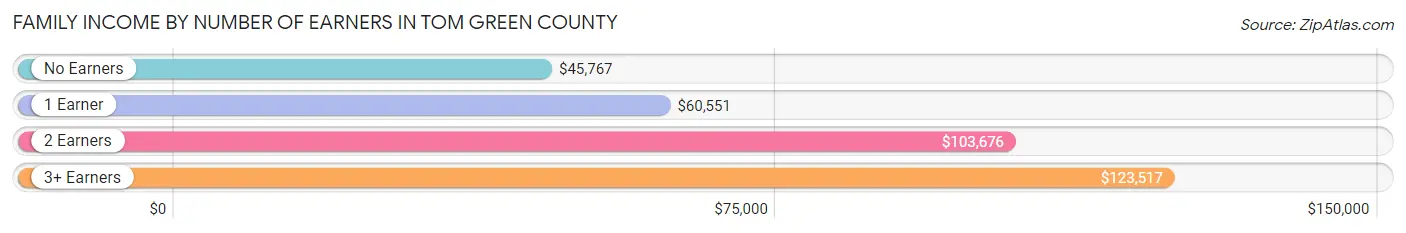
Family Income by Number of Earners in Tom Green County
The median family income in Tom Green County is $81,166, with families comprising 3+ earners (3,138) having the highest median family income of $123,517, while families with no earners (4,309) have the lowest median family income of $45,767, accounting for 10.7% and 14.7% of families, respectively.
| Number of Earners | # Families | Median Income |
| No Earners | 4,309 (14.7%) | $45,767 |
| 1 Earner | 10,609 (36.2%) | $60,551 |
| 2 Earners | 11,266 (38.4%) | $103,676 |
| 3+ Earners | 3,138 (10.7%) | $123,517 |
| Total | 29,322 (100.0%) | $81,166 |
Household Income in Tom Green County
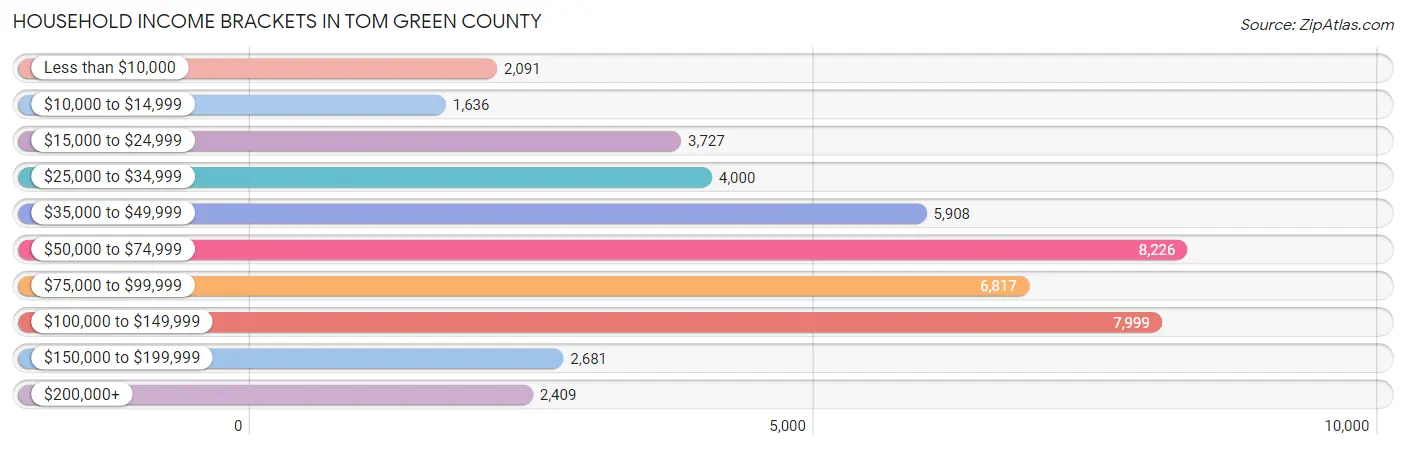
Household Income Brackets in Tom Green County
With 8,226 households falling in the category, the $50,000 to $74,999 income range is the most frequent in Tom Green County, accounting for 18.1% of all households. In contrast, only 1,636 households (3.6%) fall into the $10,000 to $14,999 income bracket, making it the least populous group.
| Income Bracket | # Households | % Households |
| Less than $10,000 | 2,091 | 4.6% |
| $10,000 to $14,999 | 1,636 | 3.6% |
| $15,000 to $24,999 | 3,727 | 8.2% |
| $25,000 to $34,999 | 4,000 | 8.8% |
| $35,000 to $49,999 | 5,908 | 13.0% |
| $50,000 to $74,999 | 8,226 | 18.1% |
| $75,000 to $99,999 | 6,817 | 15.0% |
| $100,000 to $149,999 | 7,999 | 17.6% |
| $150,000 to $199,999 | 2,681 | 5.9% |
| $200,000+ | 2,409 | 5.3% |
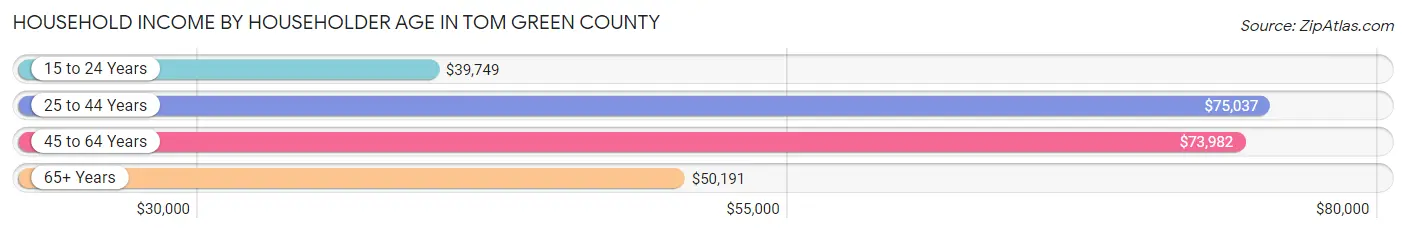
Household Income by Householder Age in Tom Green County
The median household income in Tom Green County is $67,215, with the highest median household income of $75,037 found in the 25 to 44 years age bracket for the primary householder. A total of 15,998 households (35.2%) fall into this category. Meanwhile, the 15 to 24 years age bracket for the primary householder has the lowest median household income of $39,749, with 2,882 households (6.3%) in this group.
| Income Bracket | # Households | Median Income |
| 15 to 24 Years | 2,882 (6.3%) | $39,749 |
| 25 to 44 Years | 15,998 (35.2%) | $75,037 |
| 45 to 64 Years | 14,639 (32.2%) | $73,982 |
| 65+ Years | 11,930 (26.3%) | $50,191 |
| Total | 45,449 (100.0%) | $67,215 |
Poverty in Tom Green County
Income Below Poverty by Sex and Age in Tom Green County
With 9.7% poverty level for males and 13.8% for females among the residents of Tom Green County, under 5 year old males and 18 to 24 year old females are the most vulnerable to poverty, with 973 males (24.6%) and 1,212 females (24.3%) in their respective age groups living below the poverty level.
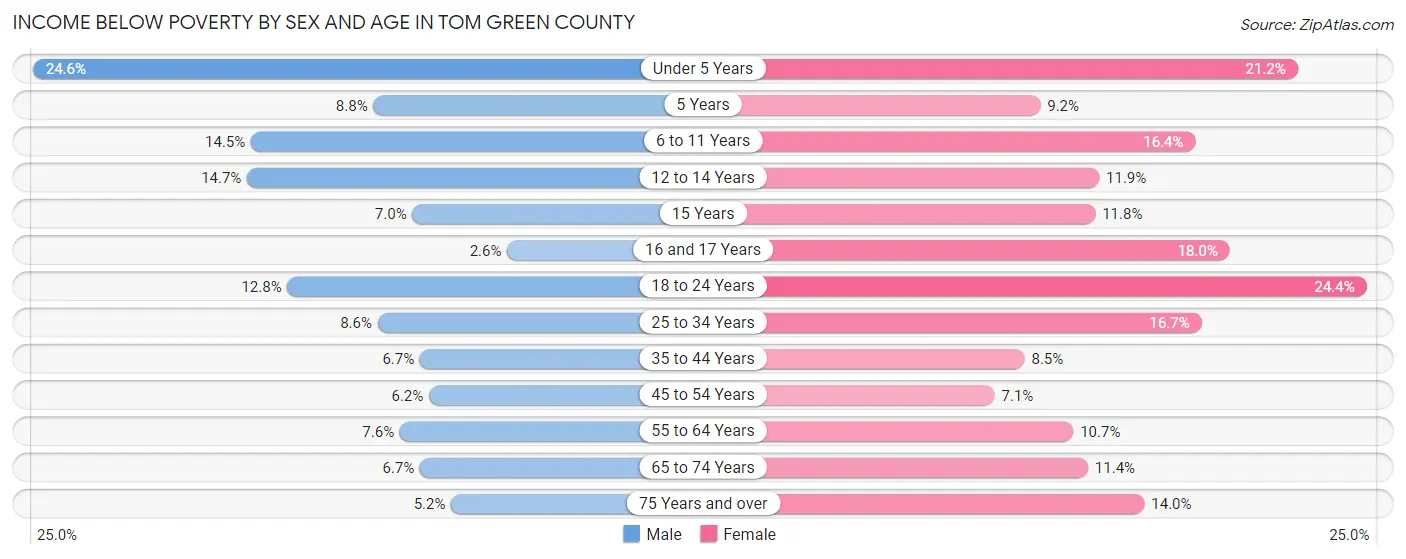
| Age Bracket | Male | Female |
| Under 5 Years | 973 (24.6%) | 741 (21.1%) |
| 5 Years | 73 (8.8%) | 65 (9.2%) |
| 6 to 11 Years | 713 (14.5%) | 817 (16.4%) |
| 12 to 14 Years | 358 (14.7%) | 274 (11.9%) |
| 15 Years | 48 (7.0%) | 100 (11.8%) |
| 16 and 17 Years | 42 (2.6%) | 263 (18.0%) |
| 18 to 24 Years | 617 (12.8%) | 1,212 (24.3%) |
| 25 to 34 Years | 765 (8.6%) | 1,353 (16.7%) |
| 35 to 44 Years | 486 (6.7%) | 619 (8.5%) |
| 45 to 54 Years | 365 (6.2%) | 432 (7.1%) |
| 55 to 64 Years | 484 (7.6%) | 759 (10.7%) |
| 65 to 74 Years | 348 (6.7%) | 658 (11.4%) |
| 75 Years and over | 170 (5.2%) | 597 (14.0%) |
| Total | 5,442 (9.7%) | 7,890 (13.8%) |
Income Above Poverty by Sex and Age in Tom Green County
According to the poverty statistics in Tom Green County, males aged 16 and 17 years and females aged 45 to 54 years are the age groups that are most secure financially, with 97.4% of males and 92.9% of females in these age groups living above the poverty line.
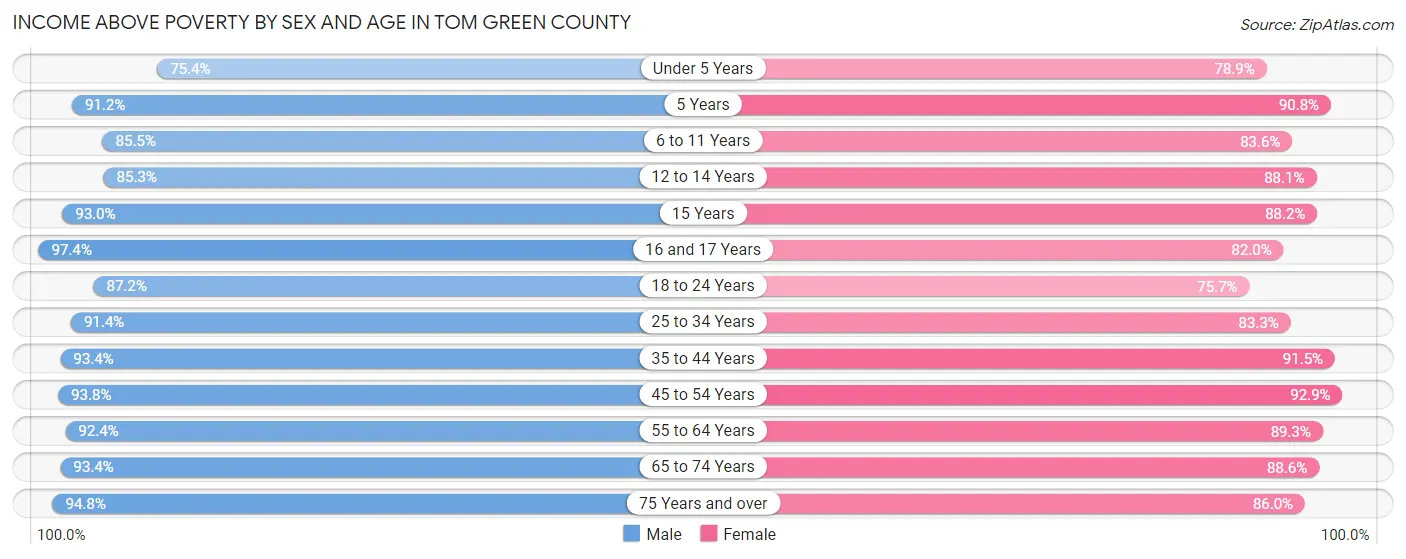
| Age Bracket | Male | Female |
| Under 5 Years | 2,979 (75.4%) | 2,762 (78.8%) |
| 5 Years | 756 (91.2%) | 641 (90.8%) |
| 6 to 11 Years | 4,208 (85.5%) | 4,165 (83.6%) |
| 12 to 14 Years | 2,082 (85.3%) | 2,020 (88.1%) |
| 15 Years | 638 (93.0%) | 750 (88.2%) |
| 16 and 17 Years | 1,575 (97.4%) | 1,198 (82.0%) |
| 18 to 24 Years | 4,202 (87.2%) | 3,765 (75.6%) |
| 25 to 34 Years | 8,116 (91.4%) | 6,755 (83.3%) |
| 35 to 44 Years | 6,822 (93.3%) | 6,679 (91.5%) |
| 45 to 54 Years | 5,496 (93.8%) | 5,659 (92.9%) |
| 55 to 64 Years | 5,904 (92.4%) | 6,310 (89.3%) |
| 65 to 74 Years | 4,886 (93.3%) | 5,106 (88.6%) |
| 75 Years and over | 3,102 (94.8%) | 3,656 (86.0%) |
| Total | 50,766 (90.3%) | 49,466 (86.2%) |
Income Below Poverty Among Married-Couple Families in Tom Green County
The poverty statistics for married-couple families in Tom Green County show that 3.1% or 658 of the total 21,390 families live below the poverty line. Families with 5 or more children have the highest poverty rate of 19.2%, comprising of 35 families. On the other hand, families with 1 or 2 children have the lowest poverty rate of 1.1%, which includes 76 families.
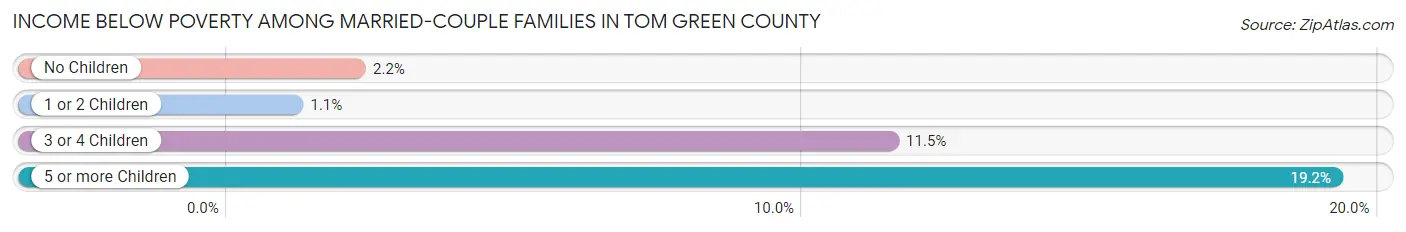
| Children | Above Poverty | Below Poverty |
| No Children | 11,849 (97.8%) | 270 (2.2%) |
| 1 or 2 Children | 6,606 (98.9%) | 76 (1.1%) |
| 3 or 4 Children | 2,130 (88.5%) | 277 (11.5%) |
| 5 or more Children | 147 (80.8%) | 35 (19.2%) |
| Total | 20,732 (96.9%) | 658 (3.1%) |
Income Below Poverty Among Single-Parent Households in Tom Green County
According to the poverty data in Tom Green County, 10.1% or 254 single-father households and 26.8% or 1,456 single-mother households are living below the poverty line. Among single-father households, those with 3 or 4 children have the highest poverty rate, with 29 households (22.0%) experiencing poverty. Likewise, among single-mother households, those with 5 or more children have the highest poverty rate, with 89 households (100.0%) falling below the poverty line.
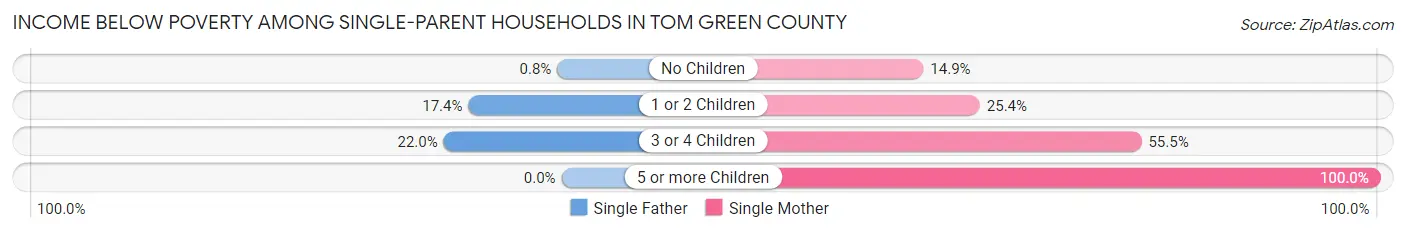
| Children | Single Father | Single Mother |
| No Children | 9 (0.8%) | 250 (14.8%) |
| 1 or 2 Children | 216 (17.4%) | 767 (25.4%) |
| 3 or 4 Children | 29 (22.0%) | 350 (55.5%) |
| 5 or more Children | 0 (0.0%) | 89 (100.0%) |
| Total | 254 (10.1%) | 1,456 (26.8%) |
Income Below Poverty Among Married-Couple vs Single-Parent Households in Tom Green County
The poverty data for Tom Green County shows that 658 of the married-couple family households (3.1%) and 1,710 of the single-parent households (21.6%) are living below the poverty level. Within the married-couple family households, those with 5 or more children have the highest poverty rate, with 35 households (19.2%) falling below the poverty line. Among the single-parent households, those with 5 or more children have the highest poverty rate, with 89 household (100.0%) living below poverty.
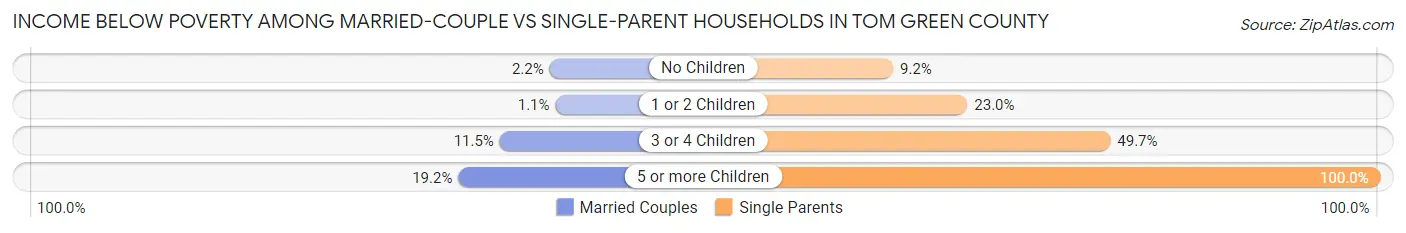
| Children | Married-Couple Families | Single-Parent Households |
| No Children | 270 (2.2%) | 259 (9.2%) |
| 1 or 2 Children | 76 (1.1%) | 983 (23.0%) |
| 3 or 4 Children | 277 (11.5%) | 379 (49.7%) |
| 5 or more Children | 35 (19.2%) | 89 (100.0%) |
| Total | 658 (3.1%) | 1,710 (21.6%) |
Race in Tom Green County
The most populous races in Tom Green County are White / Caucasian (87,149 | 73.1%), Hispanic or Latino (49,838 | 41.8%), and Two or more Races (17,891 | 15.0%).
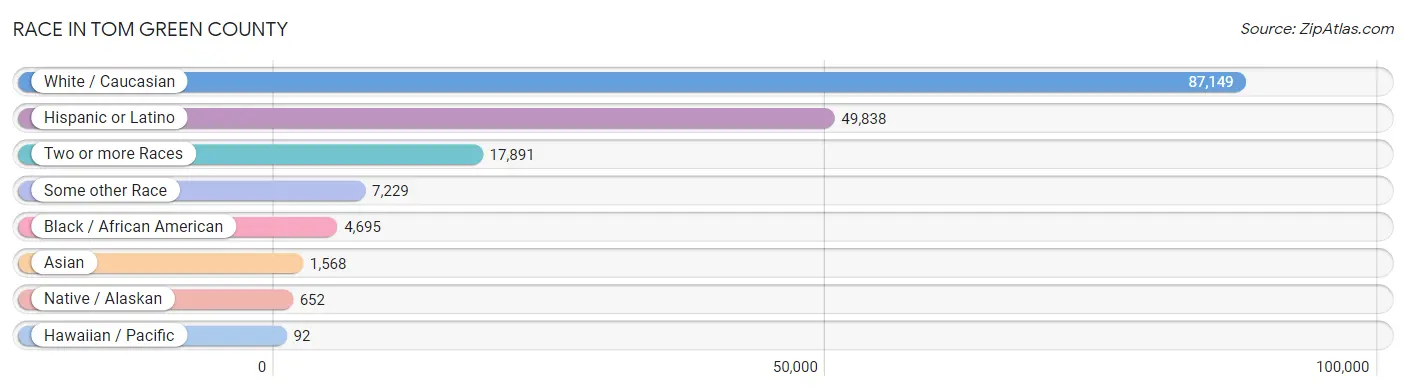
| Race | # Population | % Population |
| Asian | 1,568 | 1.3% |
| Black / African American | 4,695 | 3.9% |
| Hawaiian / Pacific | 92 | 0.1% |
| Hispanic or Latino | 49,838 | 41.8% |
| Native / Alaskan | 652 | 0.5% |
| White / Caucasian | 87,149 | 73.1% |
| Two or more Races | 17,891 | 15.0% |
| Some other Race | 7,229 | 6.1% |
| Total | 119,276 | 100.0% |
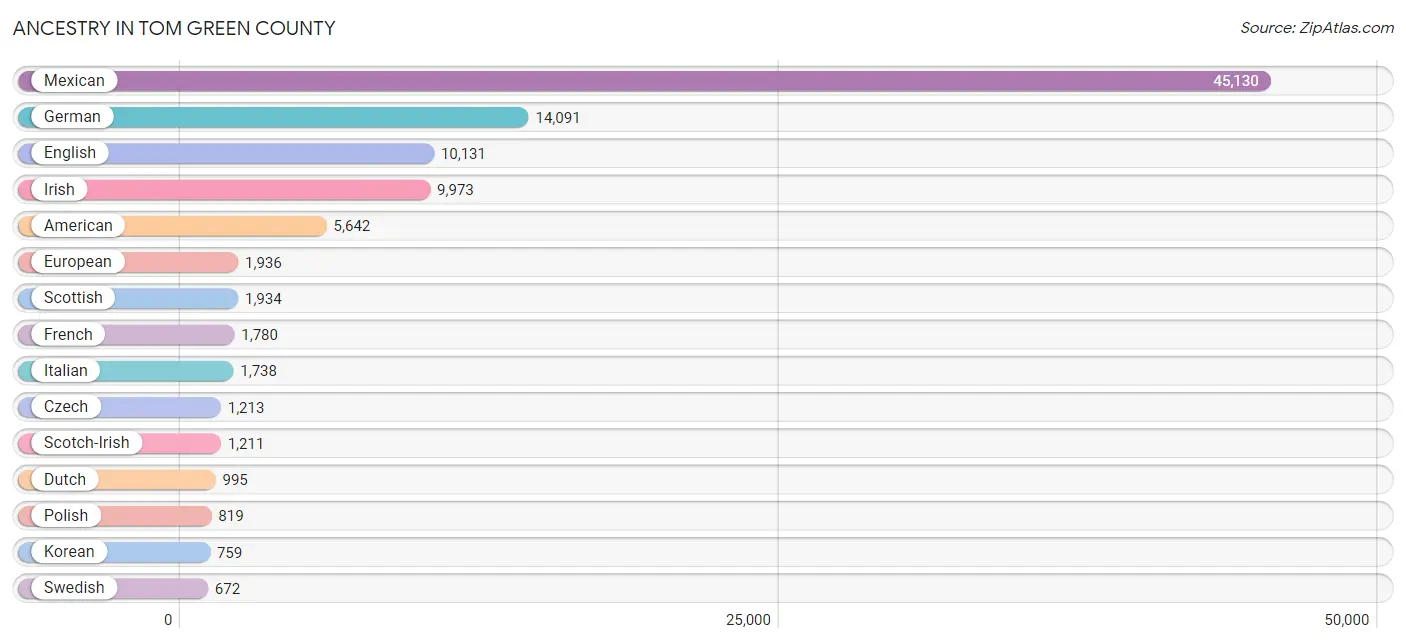
Ancestry in Tom Green County
The most populous ancestries reported in Tom Green County are Mexican (45,130 | 37.8%), German (14,091 | 11.8%), English (10,131 | 8.5%), Irish (9,973 | 8.4%), and American (5,642 | 4.7%), together accounting for 71.2% of all Tom Green County residents.
| Ancestry | # Population | % Population |
| African | 500 | 0.4% |
| Alaskan Athabascan | 16 | 0.0% |
| American | 5,642 | 4.7% |
| Apache | 13 | 0.0% |
| Arab | 214 | 0.2% |
| Argentinean | 114 | 0.1% |
| Austrian | 241 | 0.2% |
| Bangladeshi | 29 | 0.0% |
| Belgian | 138 | 0.1% |
| Bermudan | 24 | 0.0% |
| Bhutanese | 153 | 0.1% |
| Blackfeet | 20 | 0.0% |
| Bolivian | 41 | 0.0% |
| Brazilian | 38 | 0.0% |
| British | 410 | 0.3% |
| British West Indian | 32 | 0.0% |
| Burmese | 381 | 0.3% |
| Cajun | 63 | 0.1% |
| Canadian | 17 | 0.0% |
| Central American | 275 | 0.2% |
| Central American Indian | 50 | 0.0% |
| Cherokee | 464 | 0.4% |
| Chickasaw | 6 | 0.0% |
| Choctaw | 184 | 0.2% |
| Colombian | 172 | 0.1% |
| Comanche | 8 | 0.0% |
| Creek | 6 | 0.0% |
| Croatian | 4 | 0.0% |
| Cuban | 56 | 0.1% |
| Czech | 1,213 | 1.0% |
| Czechoslovakian | 46 | 0.0% |
| Danish | 114 | 0.1% |
| Dominican | 269 | 0.2% |
| Dutch | 995 | 0.8% |
| Dutch West Indian | 7 | 0.0% |
| Eastern European | 6 | 0.0% |
| Ecuadorian | 13 | 0.0% |
| English | 10,131 | 8.5% |
| European | 1,936 | 1.6% |
| Finnish | 100 | 0.1% |
| French | 1,780 | 1.5% |
| French Canadian | 212 | 0.2% |
| German | 14,091 | 11.8% |
| Greek | 64 | 0.1% |
| Guamanian / Chamorro | 25 | 0.0% |
| Guatemalan | 208 | 0.2% |
| Haitian | 97 | 0.1% |
| Hopi | 21 | 0.0% |
| Houma | 6 | 0.0% |
| Hungarian | 11 | 0.0% |
| Indian (Asian) | 381 | 0.3% |
| Iraqi | 42 | 0.0% |
| Irish | 9,973 | 8.4% |
| Iroquois | 38 | 0.0% |
| Italian | 1,738 | 1.5% |
| Jamaican | 55 | 0.1% |
| Japanese | 5 | 0.0% |
| Kenyan | 36 | 0.0% |
| Kiowa | 8 | 0.0% |
| Korean | 759 | 0.6% |
| Lebanese | 69 | 0.1% |
| Lithuanian | 23 | 0.0% |
| Luxembourger | 21 | 0.0% |
| Malaysian | 13 | 0.0% |
| Mexican | 45,130 | 37.8% |
| Mexican American Indian | 204 | 0.2% |
| Native Hawaiian | 123 | 0.1% |
| Navajo | 19 | 0.0% |
| Nicaraguan | 10 | 0.0% |
| Nigerian | 96 | 0.1% |
| Northern European | 93 | 0.1% |
| Norwegian | 556 | 0.5% |
| Ottawa | 5 | 0.0% |
| Pakistani | 17 | 0.0% |
| Panamanian | 24 | 0.0% |
| Pennsylvania German | 149 | 0.1% |
| Polish | 819 | 0.7% |
| Portuguese | 83 | 0.1% |
| Potawatomi | 9 | 0.0% |
| Puerto Rican | 668 | 0.6% |
| Romanian | 71 | 0.1% |
| Russian | 113 | 0.1% |
| Salvadoran | 33 | 0.0% |
| Samoan | 22 | 0.0% |
| Scandinavian | 175 | 0.2% |
| Scotch-Irish | 1,211 | 1.0% |
| Scottish | 1,934 | 1.6% |
| Serbian | 27 | 0.0% |
| Sioux | 30 | 0.0% |
| Slavic | 33 | 0.0% |
| South African | 12 | 0.0% |
| South American | 531 | 0.4% |
| Spaniard | 266 | 0.2% |
| Spanish | 349 | 0.3% |
| Spanish American Indian | 18 | 0.0% |
| Sri Lankan | 295 | 0.3% |
| Subsaharan African | 644 | 0.5% |
| Swedish | 672 | 0.6% |
| Swiss | 215 | 0.2% |
| Syrian | 19 | 0.0% |
| Thai | 156 | 0.1% |
| Trinidadian and Tobagonian | 28 | 0.0% |
| Turkish | 97 | 0.1% |
| Ukrainian | 64 | 0.1% |
| Venezuelan | 191 | 0.2% |
| Welsh | 382 | 0.3% |
| West Indian | 36 | 0.0% |
| Yugoslavian | 105 | 0.1% | View All 108 Rows |
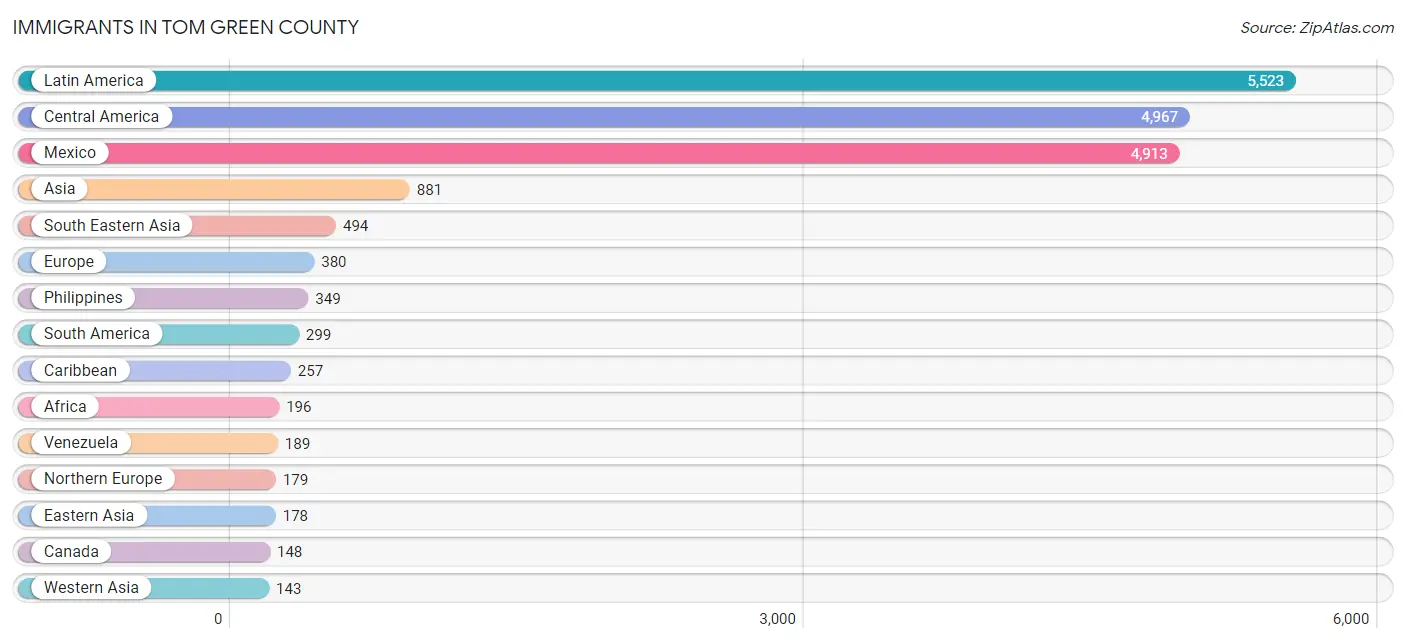
Immigrants in Tom Green County
The most numerous immigrant groups reported in Tom Green County came from Latin America (5,523 | 4.6%), Central America (4,967 | 4.2%), Mexico (4,913 | 4.1%), Asia (881 | 0.7%), and South Eastern Asia (494 | 0.4%), together accounting for 14.1% of all Tom Green County residents.
| Immigration Origin | # Population | % Population |
| Africa | 196 | 0.2% |
| Asia | 881 | 0.7% |
| Australia | 11 | 0.0% |
| Bolivia | 41 | 0.0% |
| Bosnia and Herzegovina | 31 | 0.0% |
| Brazil | 6 | 0.0% |
| Canada | 148 | 0.1% |
| Caribbean | 257 | 0.2% |
| Central America | 4,967 | 4.2% |
| China | 63 | 0.1% |
| Cuba | 4 | 0.0% |
| Dominican Republic | 124 | 0.1% |
| Eastern Africa | 74 | 0.1% |
| Eastern Asia | 178 | 0.2% |
| Eastern Europe | 62 | 0.1% |
| Ecuador | 13 | 0.0% |
| Egypt | 5 | 0.0% |
| England | 87 | 0.1% |
| Ethiopia | 7 | 0.0% |
| Europe | 380 | 0.3% |
| Germany | 87 | 0.1% |
| Grenada | 32 | 0.0% |
| Guatemala | 54 | 0.1% |
| Guyana | 50 | 0.0% |
| Haiti | 28 | 0.0% |
| India | 34 | 0.0% |
| Iraq | 24 | 0.0% |
| Italy | 24 | 0.0% |
| Jamaica | 46 | 0.0% |
| Kenya | 67 | 0.1% |
| Korea | 115 | 0.1% |
| Latin America | 5,523 | 4.6% |
| Mexico | 4,913 | 4.1% |
| Nepal | 30 | 0.0% |
| Netherlands | 8 | 0.0% |
| Nigeria | 75 | 0.1% |
| Northern Africa | 5 | 0.0% |
| Northern Europe | 179 | 0.2% |
| Oceania | 11 | 0.0% |
| Pakistan | 2 | 0.0% |
| Philippines | 349 | 0.3% |
| South Africa | 13 | 0.0% |
| South America | 299 | 0.3% |
| South Central Asia | 66 | 0.1% |
| South Eastern Asia | 494 | 0.4% |
| Southern Europe | 26 | 0.0% |
| Spain | 2 | 0.0% |
| Switzerland | 18 | 0.0% |
| Taiwan | 13 | 0.0% |
| Thailand | 59 | 0.1% |
| Trinidad and Tobago | 23 | 0.0% |
| Turkey | 59 | 0.1% |
| Ukraine | 31 | 0.0% |
| Venezuela | 189 | 0.2% |
| Vietnam | 86 | 0.1% |
| Western Africa | 75 | 0.1% |
| Western Asia | 143 | 0.1% |
| Western Europe | 113 | 0.1% | View All 58 Rows |
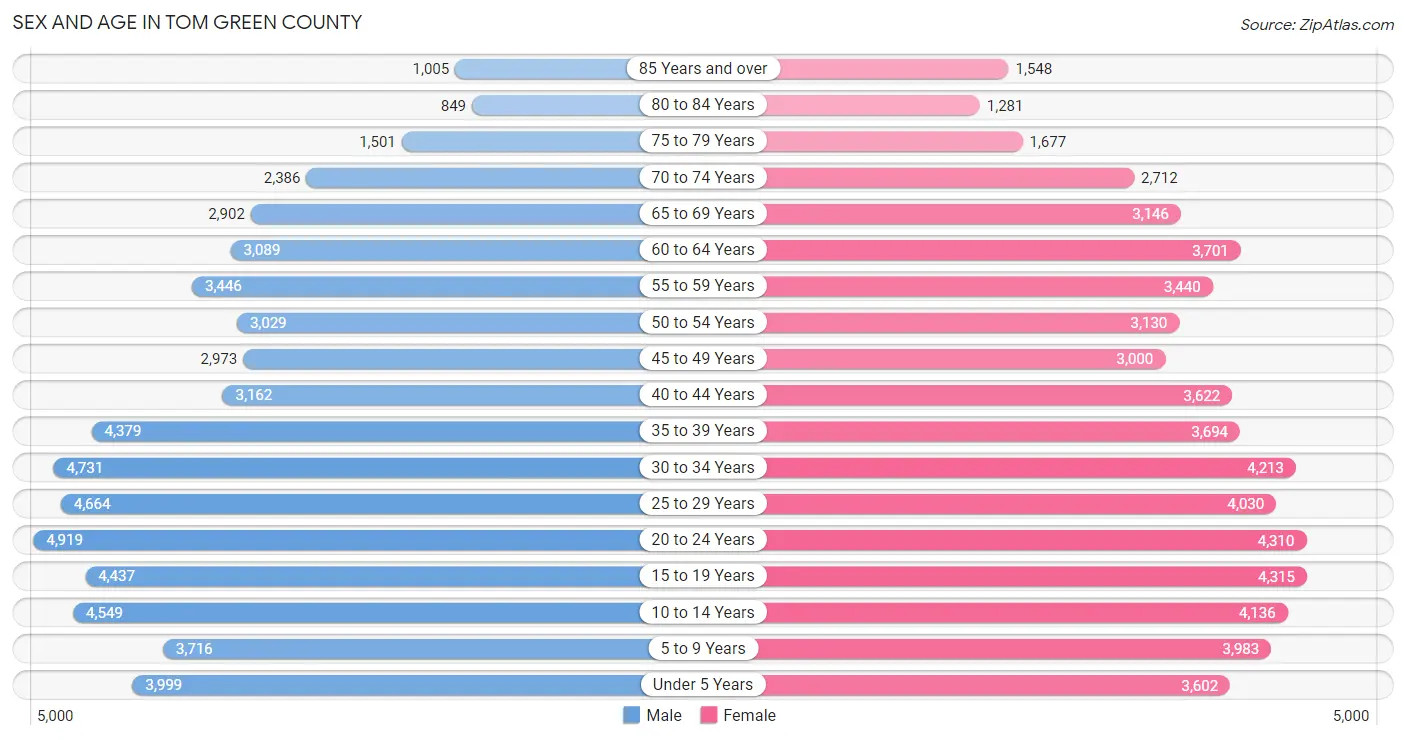
Sex and Age in Tom Green County
Sex and Age in Tom Green County
The most populous age groups in Tom Green County are 20 to 24 Years (4,919 | 8.2%) for men and 15 to 19 Years (4,315 | 7.2%) for women.
| Age Bracket | Male | Female |
| Under 5 Years | 3,999 (6.7%) | 3,602 (6.0%) |
| 5 to 9 Years | 3,716 (6.2%) | 3,983 (6.7%) |
| 10 to 14 Years | 4,549 (7.6%) | 4,136 (7.0%) |
| 15 to 19 Years | 4,437 (7.4%) | 4,315 (7.2%) |
| 20 to 24 Years | 4,919 (8.2%) | 4,310 (7.2%) |
| 25 to 29 Years | 4,664 (7.8%) | 4,030 (6.8%) |
| 30 to 34 Years | 4,731 (7.9%) | 4,213 (7.1%) |
| 35 to 39 Years | 4,379 (7.3%) | 3,694 (6.2%) |
| 40 to 44 Years | 3,162 (5.3%) | 3,622 (6.1%) |
| 45 to 49 Years | 2,973 (5.0%) | 3,000 (5.0%) |
| 50 to 54 Years | 3,029 (5.1%) | 3,130 (5.3%) |
| 55 to 59 Years | 3,446 (5.8%) | 3,440 (5.8%) |
| 60 to 64 Years | 3,089 (5.2%) | 3,701 (6.2%) |
| 65 to 69 Years | 2,902 (4.9%) | 3,146 (5.3%) |
| 70 to 74 Years | 2,386 (4.0%) | 2,712 (4.5%) |
| 75 to 79 Years | 1,501 (2.5%) | 1,677 (2.8%) |
| 80 to 84 Years | 849 (1.4%) | 1,281 (2.1%) |
| 85 Years and over | 1,005 (1.7%) | 1,548 (2.6%) |
| Total | 59,736 (100.0%) | 59,540 (100.0%) |
Families and Households in Tom Green County
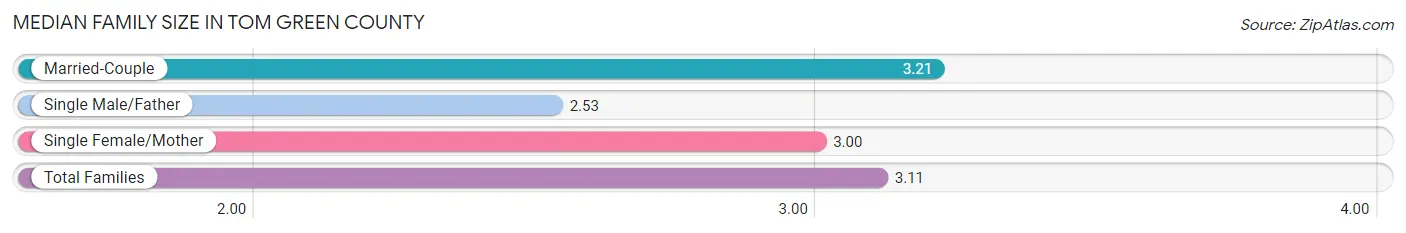
Median Family Size in Tom Green County
The median family size in Tom Green County is 3.11 persons per family, with married-couple families (21,390 | 73.0%) accounting for the largest median family size of 3.21 persons per family. On the other hand, single male/father families (2,505 | 8.5%) represent the smallest median family size with 2.53 persons per family.
| Family Type | # Families | Family Size |
| Married-Couple | 21,390 (73.0%) | 3.21 |
| Single Male/Father | 2,505 (8.5%) | 2.53 |
| Single Female/Mother | 5,427 (18.5%) | 3.00 |
| Total Families | 29,322 (100.0%) | 3.11 |
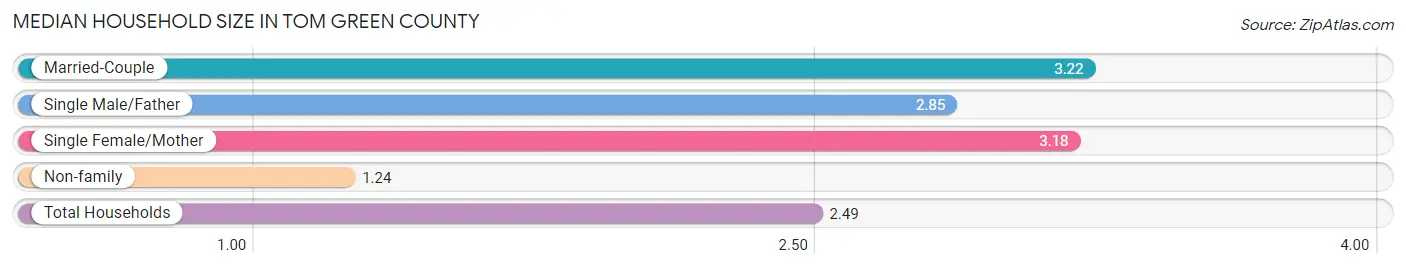
Median Household Size in Tom Green County
The median household size in Tom Green County is 2.49 persons per household, with married-couple households (21,390 | 47.1%) accounting for the largest median household size of 3.22 persons per household. non-family households (16,127 | 35.5%) represent the smallest median household size with 1.24 persons per household.
| Household Type | # Households | Household Size |
| Married-Couple | 21,390 (47.1%) | 3.22 |
| Single Male/Father | 2,505 (5.5%) | 2.85 |
| Single Female/Mother | 5,427 (11.9%) | 3.18 |
| Non-family | 16,127 (35.5%) | 1.24 |
| Total Households | 45,449 (100.0%) | 2.49 |
Household Size by Marriage Status in Tom Green County
Out of a total of 45,449 households in Tom Green County, 29,322 (64.5%) are family households, while 16,127 (35.5%) are nonfamily households. The most numerous type of family households are 2-person households, comprising 13,118, and the most common type of nonfamily households are 1-person households, comprising 13,024.
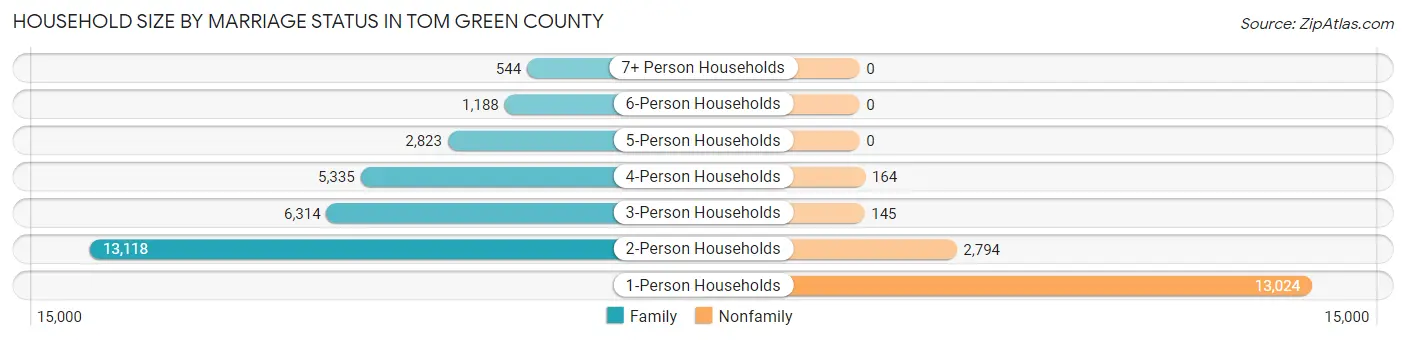
| Household Size | Family Households | Nonfamily Households |
| 1-Person Households | - | 13,024 (28.7%) |
| 2-Person Households | 13,118 (28.9%) | 2,794 (6.1%) |
| 3-Person Households | 6,314 (13.9%) | 145 (0.3%) |
| 4-Person Households | 5,335 (11.7%) | 164 (0.4%) |
| 5-Person Households | 2,823 (6.2%) | 0 (0.0%) |
| 6-Person Households | 1,188 (2.6%) | 0 (0.0%) |
| 7+ Person Households | 544 (1.2%) | 0 (0.0%) |
| Total | 29,322 (64.5%) | 16,127 (35.5%) |
Female Fertility in Tom Green County
Fertility by Age in Tom Green County
Average fertility rate in Tom Green County is 52.0 births per 1,000 women. Women in the age bracket of 20 to 34 years have the highest fertility rate with 97.0 births per 1,000 women. Women in the age bracket of 20 to 34 years acount for 84.4% of all women with births.
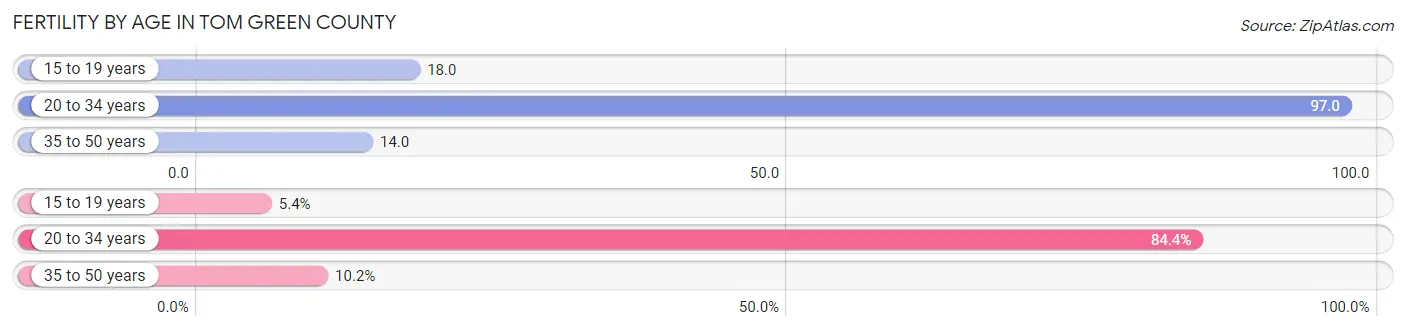
| Age Bracket | Women with Births | Births / 1,000 Women |
| 15 to 19 years | 78 (5.4%) | 18.0 |
| 20 to 34 years | 1,218 (84.4%) | 97.0 |
| 35 to 50 years | 147 (10.2%) | 14.0 |
| Total | 1,443 (100.0%) | 52.0 |
Fertility by Age by Marriage Status in Tom Green County
70.1% of women with births (1,443) in Tom Green County are married. The highest percentage of unmarried women with births falls into 15 to 19 years age bracket with 100.0% of them unmarried at the time of birth, while the lowest percentage of unmarried women with births belong to 35 to 50 years age bracket with 0.0% of them unmarried.
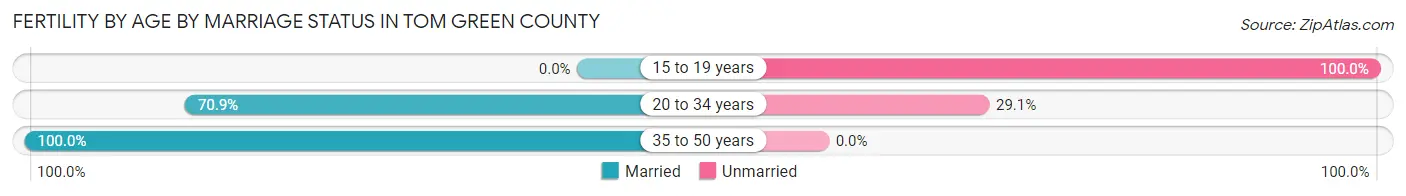
| Age Bracket | Married | Unmarried |
| 15 to 19 years | 0 (0.0%) | 78 (100.0%) |
| 20 to 34 years | 864 (70.9%) | 354 (29.1%) |
| 35 to 50 years | 147 (100.0%) | 0 (0.0%) |
| Total | 1,012 (70.1%) | 431 (29.9%) |
Fertility by Education in Tom Green County
Average fertility rate in Tom Green County is 52.0 births per 1,000 women. Women with the education attainment of bachelor's degree have the highest fertility rate of 82.0 births per 1,000 women, while women with the education attainment of less than high school have the lowest fertility at 31.0 births per 1,000 women. Women with the education attainment of high school diploma represent 29.9% of all women with births.
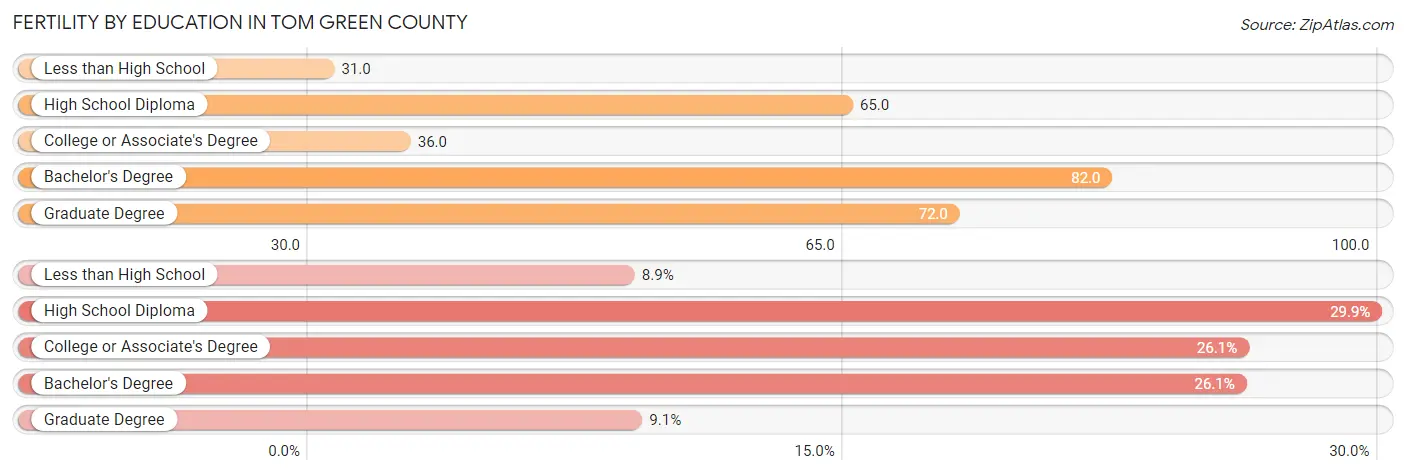
| Educational Attainment | Women with Births | Births / 1,000 Women |
| Less than High School | 128 (8.9%) | 31.0 |
| High School Diploma | 431 (29.9%) | 65.0 |
| College or Associate's Degree | 377 (26.1%) | 36.0 |
| Bachelor's Degree | 376 (26.1%) | 82.0 |
| Graduate Degree | 131 (9.1%) | 72.0 |
| Total | 1,443 (100.0%) | 52.0 |
Fertility by Education by Marriage Status in Tom Green County
29.9% of women with births in Tom Green County are unmarried. Women with the educational attainment of graduate degree are most likely to be married with 100.0% of them married at childbirth, while women with the educational attainment of less than high school are least likely to be married with 66.4% of them unmarried at childbirth.
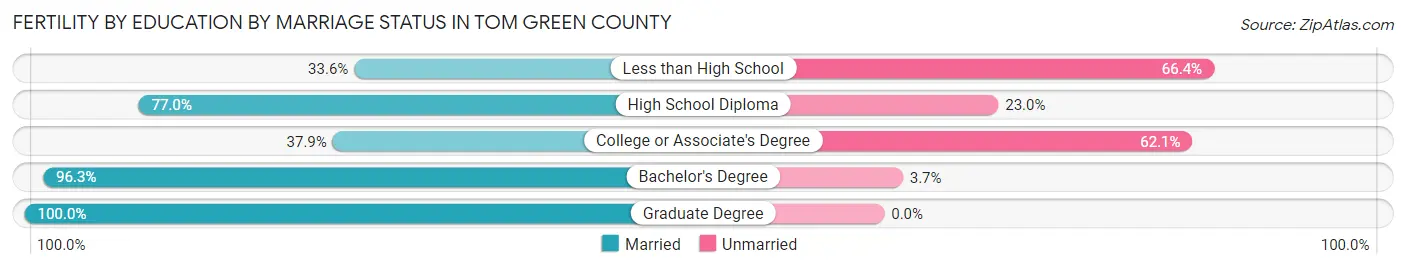
| Educational Attainment | Married | Unmarried |
| Less than High School | 43 (33.6%) | 85 (66.4%) |
| High School Diploma | 332 (77.0%) | 99 (23.0%) |
| College or Associate's Degree | 143 (37.9%) | 234 (62.1%) |
| Bachelor's Degree | 362 (96.3%) | 14 (3.7%) |
| Graduate Degree | 131 (100.0%) | 0 (0.0%) |
| Total | 1,012 (70.1%) | 431 (29.9%) |
Employment Characteristics in Tom Green County
Employment by Class of Employer in Tom Green County
Among the 57,290 employed individuals in Tom Green County, private company employees (34,074 | 59.5%), federal government employees (5,180 | 9.0%), and not-for-profit organizations (5,121 | 8.9%) make up the most common classes of employment.
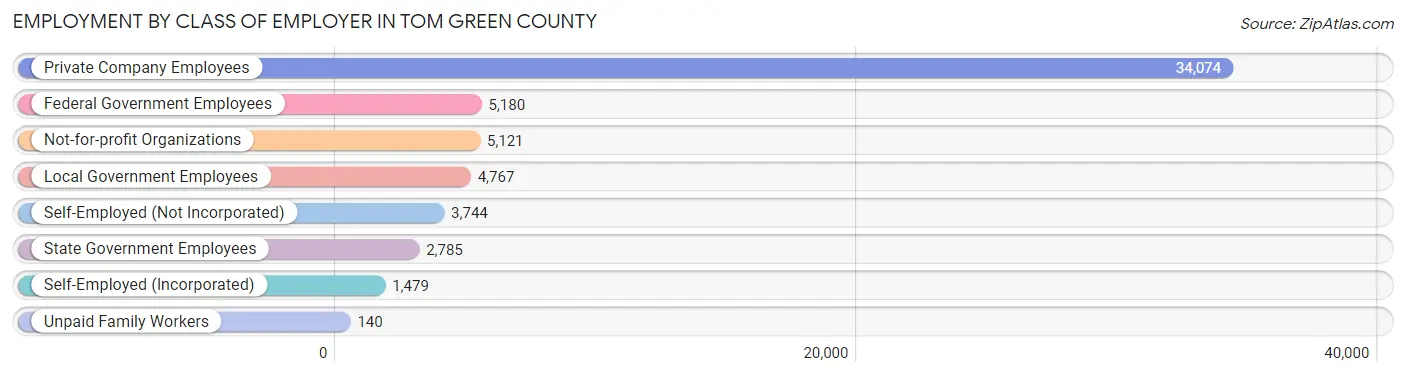
| Employer Class | # Employees | % Employees |
| Private Company Employees | 34,074 | 59.5% |
| Self-Employed (Incorporated) | 1,479 | 2.6% |
| Self-Employed (Not Incorporated) | 3,744 | 6.5% |
| Not-for-profit Organizations | 5,121 | 8.9% |
| Local Government Employees | 4,767 | 8.3% |
| State Government Employees | 2,785 | 4.9% |
| Federal Government Employees | 5,180 | 9.0% |
| Unpaid Family Workers | 140 | 0.2% |
| Total | 57,290 | 100.0% |
Employment Status by Age in Tom Green County
According to the labor force statistics for Tom Green County, out of the total population over 16 years of age (93,727), 64.4% or 60,360 individuals are in the labor force, with 3.2% or 1,932 of them unemployed. The age group with the highest labor force participation rate is 45 to 54 years, with 84.2% or 10,215 individuals in the labor force. Within the labor force, the 16 to 19 years age range has the highest percentage of unemployed individuals, with 9.8% or 314 of them being unemployed.
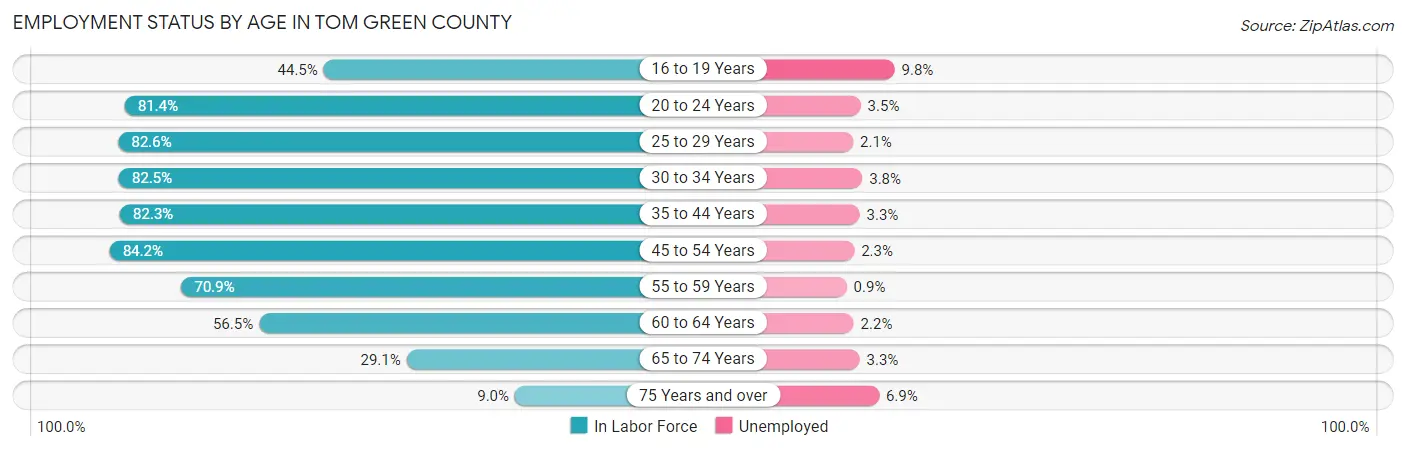
| Age Bracket | In Labor Force | Unemployed |
| 16 to 19 Years | 3,199 (44.5%) | 314 (9.8%) |
| 20 to 24 Years | 7,512 (81.4%) | 263 (3.5%) |
| 25 to 29 Years | 7,181 (82.6%) | 151 (2.1%) |
| 30 to 34 Years | 7,379 (82.5%) | 280 (3.8%) |
| 35 to 44 Years | 12,227 (82.3%) | 403 (3.3%) |
| 45 to 54 Years | 10,215 (84.2%) | 235 (2.3%) |
| 55 to 59 Years | 4,882 (70.9%) | 44 (0.9%) |
| 60 to 64 Years | 3,836 (56.5%) | 84 (2.2%) |
| 65 to 74 Years | 3,243 (29.1%) | 107 (3.3%) |
| 75 Years and over | 707 (9.0%) | 49 (6.9%) |
| Total | 60,360 (64.4%) | 1,932 (3.2%) |
Employment Status by Educational Attainment in Tom Green County
According to labor force statistics for Tom Green County, 78.4% of individuals (45,710) out of the total population between 25 and 64 years of age (58,303) are in the labor force, with 2.6% or 1,188 of them being unemployed. The group with the highest labor force participation rate are those with the educational attainment of bachelor's degree or higher, with 86.4% or 12,314 individuals in the labor force. Within the labor force, individuals with less than high school education have the highest percentage of unemployment, with 4.3% or 205 of them being unemployed.
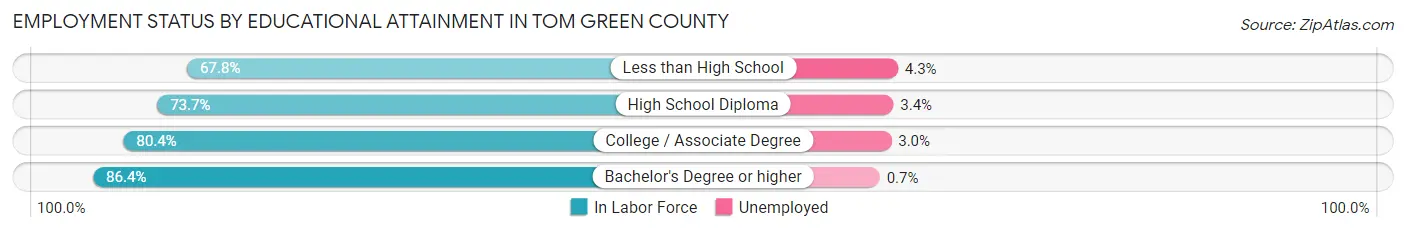
| Educational Attainment | In Labor Force | Unemployed |
| Less than High School | 4,776 (67.8%) | 303 (4.3%) |
| High School Diploma | 12,376 (73.7%) | 571 (3.4%) |
| College / Associate Degree | 16,253 (80.4%) | 606 (3.0%) |
| Bachelor's Degree or higher | 12,314 (86.4%) | 100 (0.7%) |
| Total | 45,710 (78.4%) | 1,516 (2.6%) |
Employment Occupations by Sex in Tom Green County
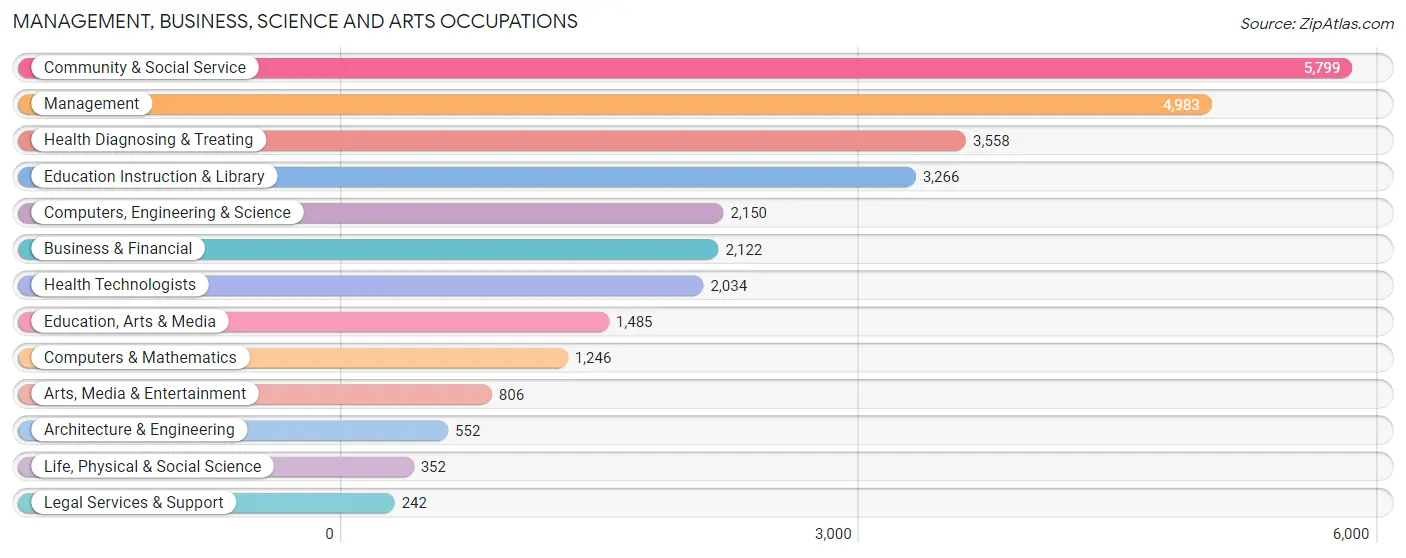
Management, Business, Science and Arts Occupations
The most common Management, Business, Science and Arts occupations in Tom Green County are Community & Social Service (5,799 | 10.4%), Management (4,983 | 8.9%), Health Diagnosing & Treating (3,558 | 6.4%), Education Instruction & Library (3,266 | 5.9%), and Computers, Engineering & Science (2,150 | 3.9%).
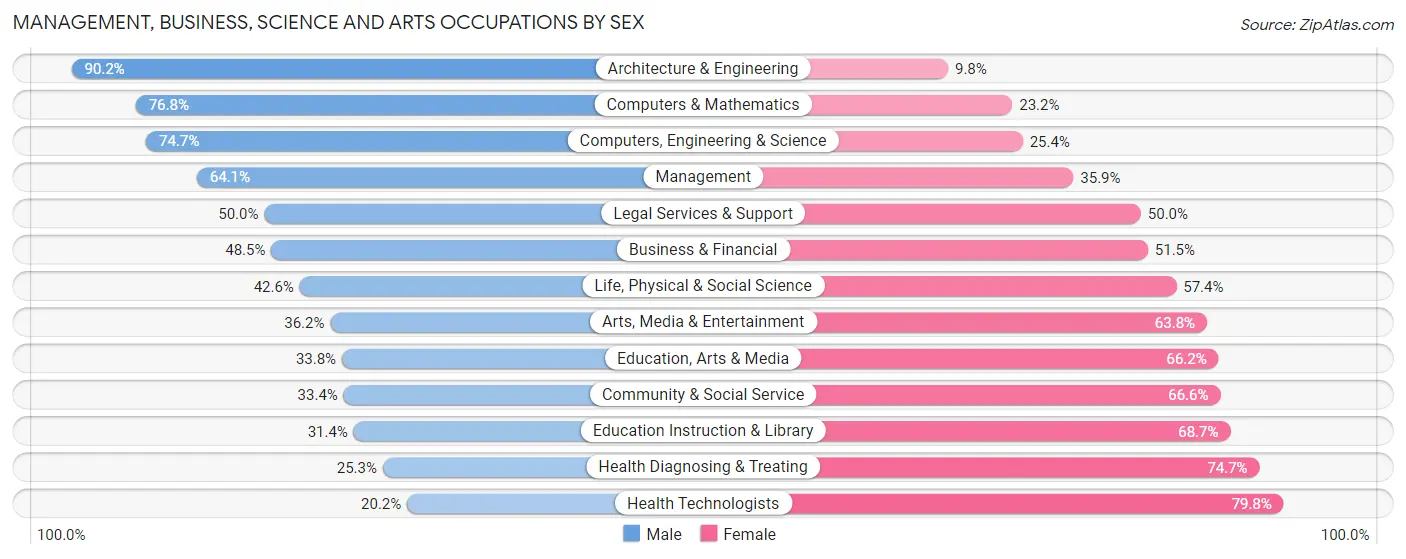
Management, Business, Science and Arts Occupations by Sex
Within the Management, Business, Science and Arts occupations in Tom Green County, the most male-oriented occupations are Architecture & Engineering (90.2%), Computers & Mathematics (76.8%), and Computers, Engineering & Science (74.7%), while the most female-oriented occupations are Health Technologists (79.8%), Health Diagnosing & Treating (74.7%), and Education Instruction & Library (68.6%).
| Occupation | Male | Female |
| Management | 3,193 (64.1%) | 1,790 (35.9%) |
| Business & Financial | 1,030 (48.5%) | 1,092 (51.5%) |
| Computers, Engineering & Science | 1,605 (74.7%) | 545 (25.4%) |
| Computers & Mathematics | 957 (76.8%) | 289 (23.2%) |
| Architecture & Engineering | 498 (90.2%) | 54 (9.8%) |
| Life, Physical & Social Science | 150 (42.6%) | 202 (57.4%) |
| Community & Social Service | 1,939 (33.4%) | 3,860 (66.6%) |
| Education, Arts & Media | 502 (33.8%) | 983 (66.2%) |
| Legal Services & Support | 121 (50.0%) | 121 (50.0%) |
| Education Instruction & Library | 1,024 (31.4%) | 2,242 (68.6%) |
| Arts, Media & Entertainment | 292 (36.2%) | 514 (63.8%) |
| Health Diagnosing & Treating | 899 (25.3%) | 2,659 (74.7%) |
| Health Technologists | 411 (20.2%) | 1,623 (79.8%) |
| Total (Category) | 8,666 (46.6%) | 9,946 (53.4%) |
| Total (Overall) | 29,790 (53.5%) | 25,897 (46.5%) |
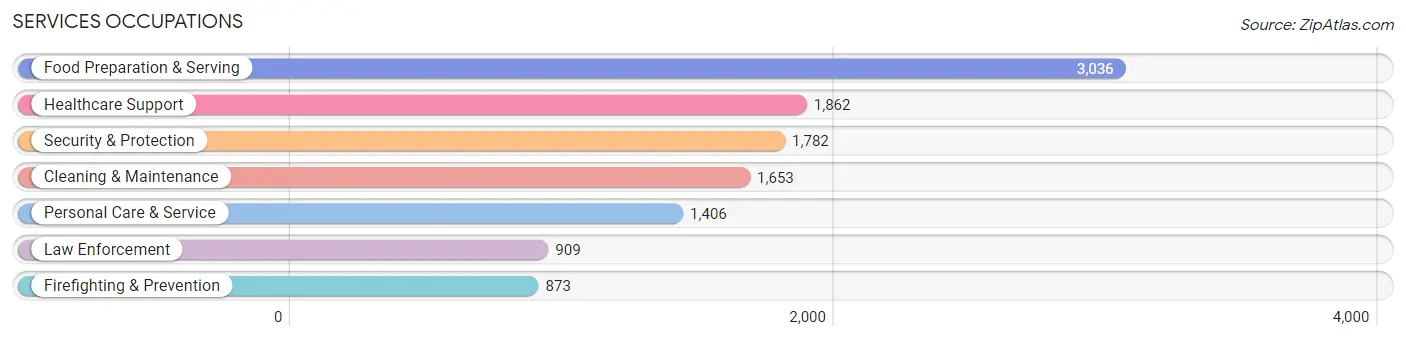
Services Occupations
The most common Services occupations in Tom Green County are Food Preparation & Serving (3,036 | 5.4%), Healthcare Support (1,862 | 3.3%), Security & Protection (1,782 | 3.2%), Cleaning & Maintenance (1,653 | 3.0%), and Personal Care & Service (1,406 | 2.5%).
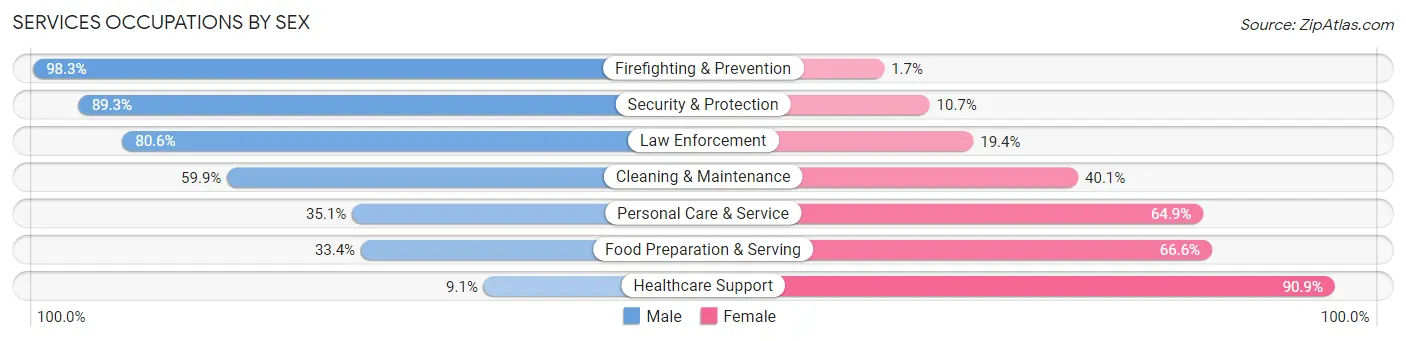
Services Occupations by Sex
Within the Services occupations in Tom Green County, the most male-oriented occupations are Firefighting & Prevention (98.3%), Security & Protection (89.3%), and Law Enforcement (80.6%), while the most female-oriented occupations are Healthcare Support (90.9%), Food Preparation & Serving (66.6%), and Personal Care & Service (64.9%).
| Occupation | Male | Female |
| Healthcare Support | 169 (9.1%) | 1,693 (90.9%) |
| Security & Protection | 1,591 (89.3%) | 191 (10.7%) |
| Firefighting & Prevention | 858 (98.3%) | 15 (1.7%) |
| Law Enforcement | 733 (80.6%) | 176 (19.4%) |
| Food Preparation & Serving | 1,014 (33.4%) | 2,022 (66.6%) |
| Cleaning & Maintenance | 990 (59.9%) | 663 (40.1%) |
| Personal Care & Service | 494 (35.1%) | 912 (64.9%) |
| Total (Category) | 4,258 (43.7%) | 5,481 (56.3%) |
| Total (Overall) | 29,790 (53.5%) | 25,897 (46.5%) |
Sales and Office Occupations
The most common Sales and Office occupations in Tom Green County are Office & Administration (7,580 | 13.6%), and Sales & Related (5,760 | 10.3%).

Sales and Office Occupations by Sex

| Occupation | Male | Female |
| Sales & Related | 2,696 (46.8%) | 3,064 (53.2%) |
| Office & Administration | 1,821 (24.0%) | 5,759 (76.0%) |
| Total (Category) | 4,517 (33.9%) | 8,823 (66.1%) |
| Total (Overall) | 29,790 (53.5%) | 25,897 (46.5%) |
Natural Resources, Construction and Maintenance Occupations
The most common Natural Resources, Construction and Maintenance occupations in Tom Green County are Construction & Extraction (4,202 | 7.5%), Installation, Maintenance & Repair (2,177 | 3.9%), and Farming, Fishing & Forestry (435 | 0.8%).

Natural Resources, Construction and Maintenance Occupations by Sex
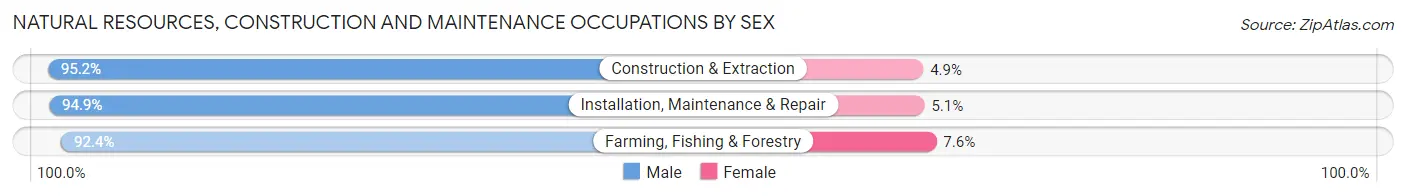
| Occupation | Male | Female |
| Farming, Fishing & Forestry | 402 (92.4%) | 33 (7.6%) |
| Construction & Extraction | 3,998 (95.2%) | 204 (4.9%) |
| Installation, Maintenance & Repair | 2,066 (94.9%) | 111 (5.1%) |
| Total (Category) | 6,466 (94.9%) | 348 (5.1%) |
| Total (Overall) | 29,790 (53.5%) | 25,897 (46.5%) |
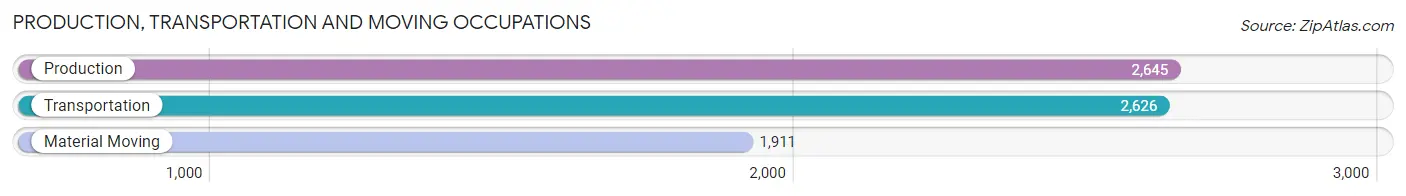
Production, Transportation and Moving Occupations
The most common Production, Transportation and Moving occupations in Tom Green County are Production (2,645 | 4.8%), Transportation (2,626 | 4.7%), and Material Moving (1,911 | 3.4%).
Production, Transportation and Moving Occupations by Sex
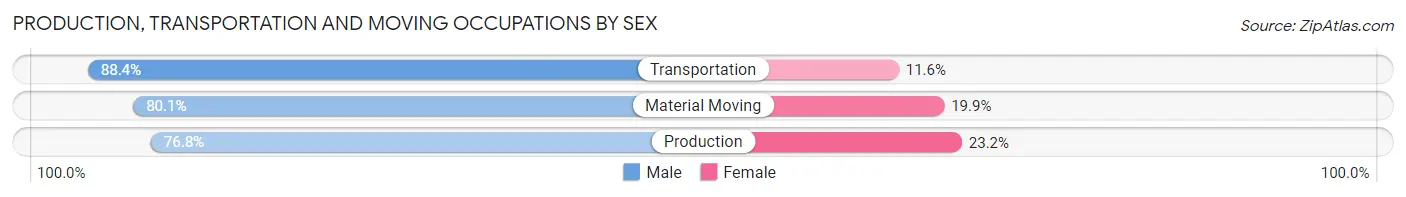
| Occupation | Male | Female |
| Production | 2,032 (76.8%) | 613 (23.2%) |
| Transportation | 2,321 (88.4%) | 305 (11.6%) |
| Material Moving | 1,530 (80.1%) | 381 (19.9%) |
| Total (Category) | 5,883 (81.9%) | 1,299 (18.1%) |
| Total (Overall) | 29,790 (53.5%) | 25,897 (46.5%) |
Employment Industries by Sex in Tom Green County
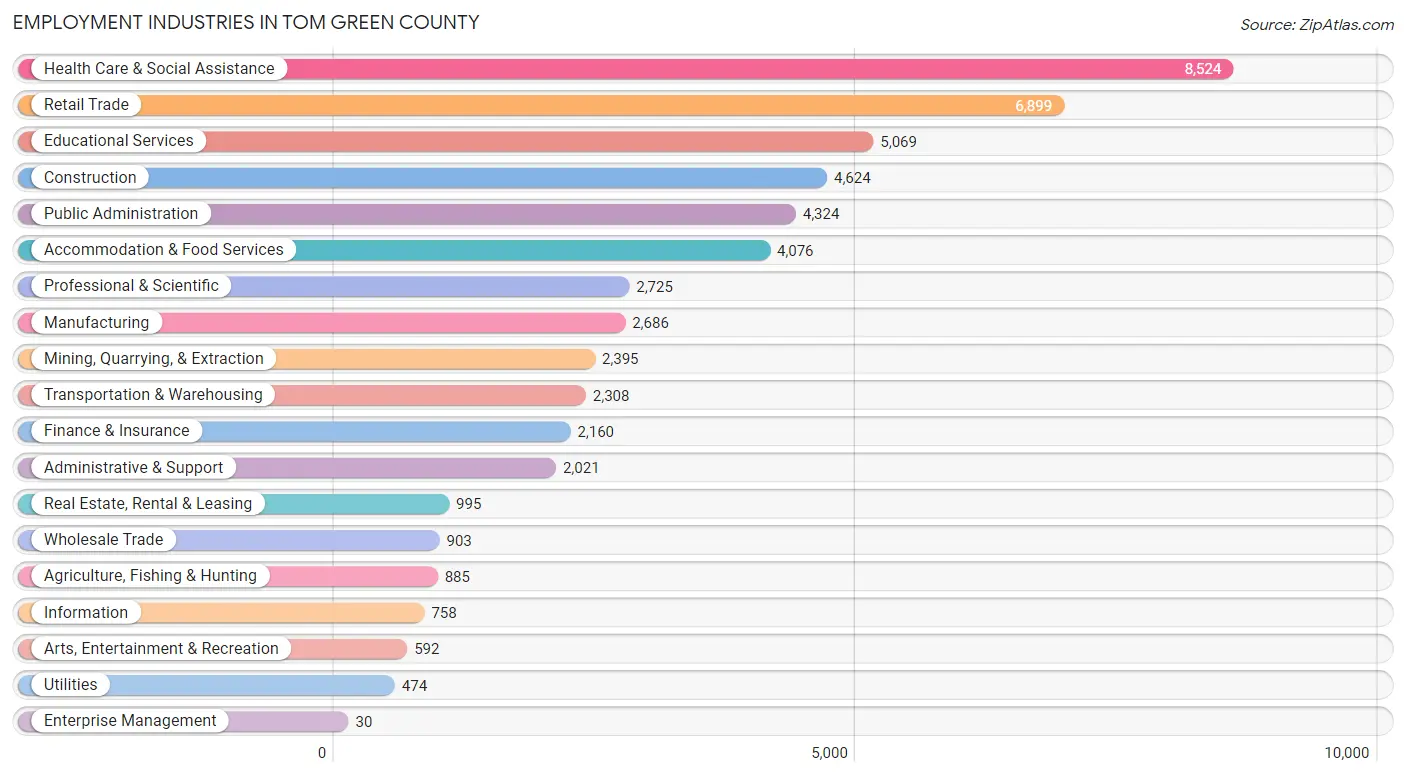
Employment Industries in Tom Green County
The major employment industries in Tom Green County include Health Care & Social Assistance (8,524 | 15.3%), Retail Trade (6,899 | 12.4%), Educational Services (5,069 | 9.1%), Construction (4,624 | 8.3%), and Public Administration (4,324 | 7.8%).
Employment Industries by Sex in Tom Green County
The Tom Green County industries that see more men than women are Agriculture, Fishing & Hunting (95.0%), Utilities (92.4%), and Mining, Quarrying, & Extraction (90.0%), whereas the industries that tend to have a higher number of women are Enterprise Management (100.0%), Health Care & Social Assistance (82.4%), and Finance & Insurance (73.6%).
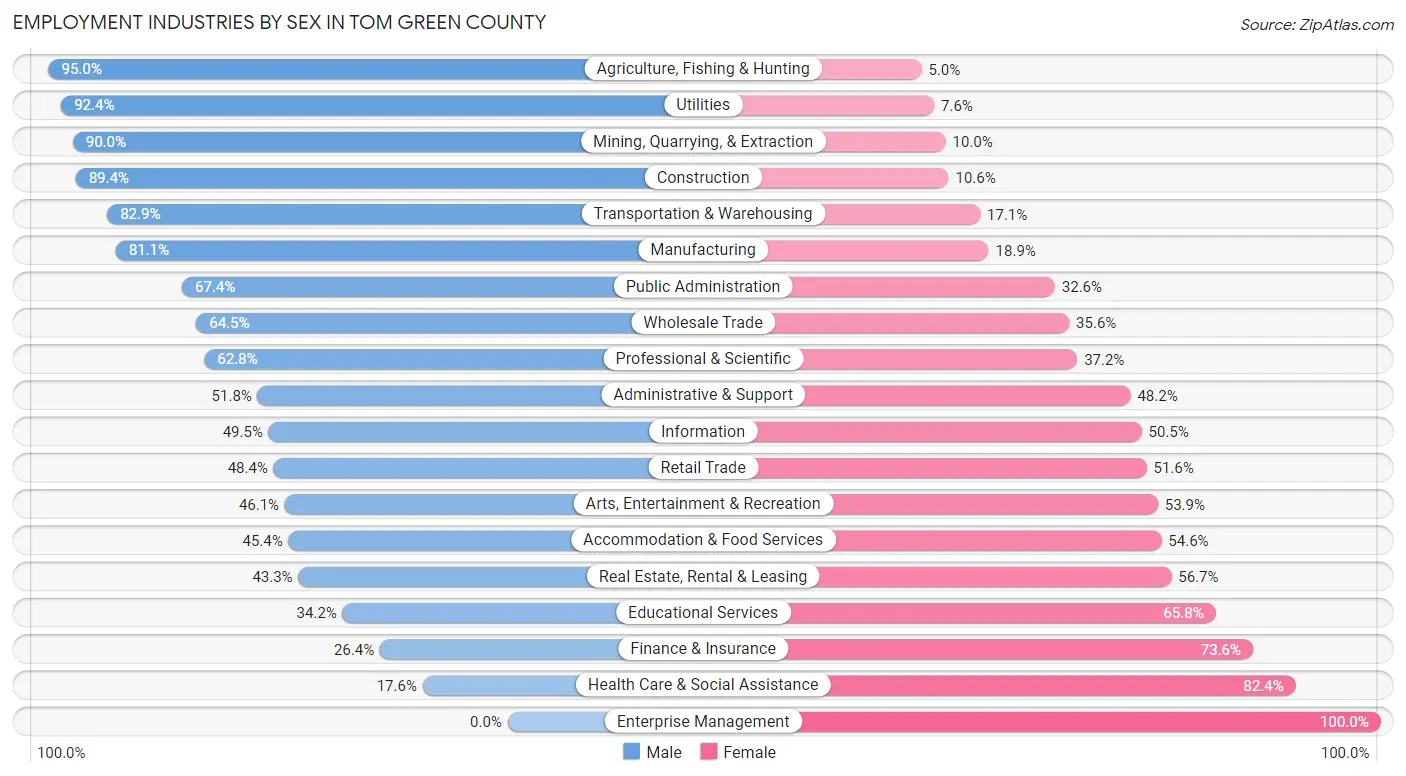
| Industry | Male | Female |
| Agriculture, Fishing & Hunting | 841 (95.0%) | 44 (5.0%) |
| Mining, Quarrying, & Extraction | 2,156 (90.0%) | 239 (10.0%) |
| Construction | 4,135 (89.4%) | 489 (10.6%) |
| Manufacturing | 2,179 (81.1%) | 507 (18.9%) |
| Wholesale Trade | 582 (64.4%) | 321 (35.5%) |
| Retail Trade | 3,342 (48.4%) | 3,557 (51.6%) |
| Transportation & Warehousing | 1,913 (82.9%) | 395 (17.1%) |
| Utilities | 438 (92.4%) | 36 (7.6%) |
| Information | 375 (49.5%) | 383 (50.5%) |
| Finance & Insurance | 571 (26.4%) | 1,589 (73.6%) |
| Real Estate, Rental & Leasing | 431 (43.3%) | 564 (56.7%) |
| Professional & Scientific | 1,711 (62.8%) | 1,014 (37.2%) |
| Enterprise Management | 0 (0.0%) | 30 (100.0%) |
| Administrative & Support | 1,046 (51.8%) | 975 (48.2%) |
| Educational Services | 1,732 (34.2%) | 3,337 (65.8%) |
| Health Care & Social Assistance | 1,499 (17.6%) | 7,025 (82.4%) |
| Arts, Entertainment & Recreation | 273 (46.1%) | 319 (53.9%) |
| Accommodation & Food Services | 1,849 (45.4%) | 2,227 (54.6%) |
| Public Administration | 2,915 (67.4%) | 1,409 (32.6%) |
| Total | 29,790 (53.5%) | 25,897 (46.5%) |
Education in Tom Green County
School Enrollment in Tom Green County
The most common levels of schooling among the 31,001 students in Tom Green County are college / undergraduate (7,987 | 25.8%), middle school (6,876 | 22.2%), and elementary school (6,364 | 20.5%).
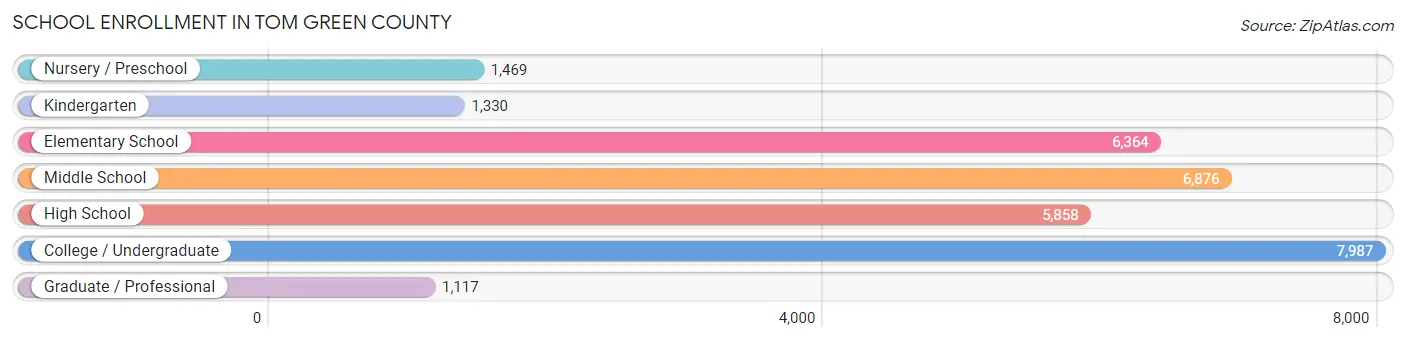
| School Level | # Students | % Students |
| Nursery / Preschool | 1,469 | 4.7% |
| Kindergarten | 1,330 | 4.3% |
| Elementary School | 6,364 | 20.5% |
| Middle School | 6,876 | 22.2% |
| High School | 5,858 | 18.9% |
| College / Undergraduate | 7,987 | 25.8% |
| Graduate / Professional | 1,117 | 3.6% |
| Total | 31,001 | 100.0% |
School Enrollment by Age by Funding Source in Tom Green County
Out of a total of 31,001 students who are enrolled in schools in Tom Green County, 3,472 (11.2%) attend a private institution, while the remaining 27,529 (88.8%) are enrolled in public schools. The age group of 3 to 4 year olds has the highest likelihood of being enrolled in private schools, with 351 (31.5% in the age bracket) enrolled. Conversely, the age group of 18 to 19 year olds has the lowest likelihood of being enrolled in a private school, with 2,652 (96.3% in the age bracket) attending a public institution.
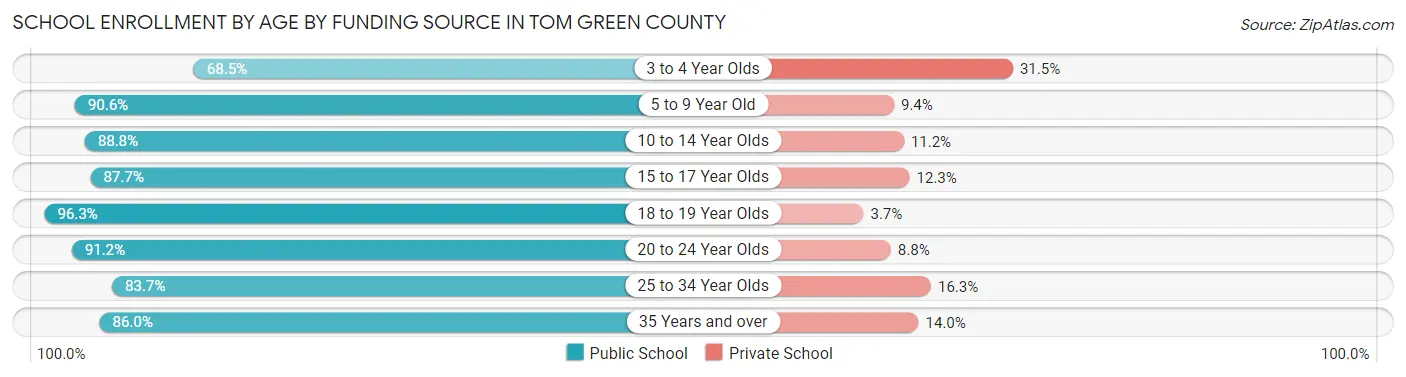
| Age Bracket | Public School | Private School |
| 3 to 4 Year Olds | 762 (68.5%) | 351 (31.5%) |
| 5 to 9 Year Old | 6,281 (90.6%) | 650 (9.4%) |
| 10 to 14 Year Olds | 7,434 (88.8%) | 940 (11.2%) |
| 15 to 17 Year Olds | 3,930 (87.7%) | 550 (12.3%) |
| 18 to 19 Year Olds | 2,652 (96.3%) | 102 (3.7%) |
| 20 to 24 Year Olds | 3,315 (91.2%) | 320 (8.8%) |
| 25 to 34 Year Olds | 1,610 (83.7%) | 313 (16.3%) |
| 35 Years and over | 1,541 (86.0%) | 250 (14.0%) |
| Total | 27,529 (88.8%) | 3,472 (11.2%) |
Educational Attainment by Field of Study in Tom Green County
Business (4,240 | 20.3%), education (2,964 | 14.2%), science & technology (2,203 | 10.6%), bio, nature & agricultural (2,183 | 10.5%), and arts & humanities (1,837 | 8.8%) are the most common fields of study among 20,851 individuals in Tom Green County who have obtained a bachelor's degree or higher.
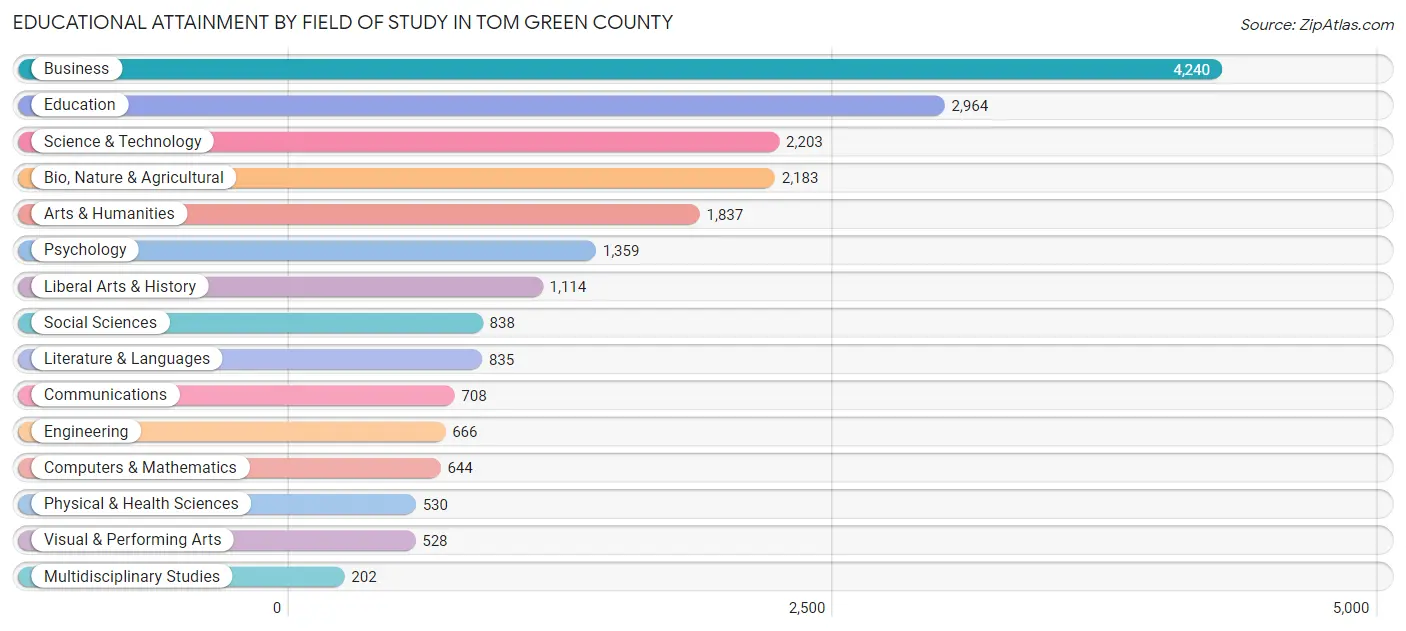
| Field of Study | # Graduates | % Graduates |
| Computers & Mathematics | 644 | 3.1% |
| Bio, Nature & Agricultural | 2,183 | 10.5% |
| Physical & Health Sciences | 530 | 2.5% |
| Psychology | 1,359 | 6.5% |
| Social Sciences | 838 | 4.0% |
| Engineering | 666 | 3.2% |
| Multidisciplinary Studies | 202 | 1.0% |
| Science & Technology | 2,203 | 10.6% |
| Business | 4,240 | 20.3% |
| Education | 2,964 | 14.2% |
| Literature & Languages | 835 | 4.0% |
| Liberal Arts & History | 1,114 | 5.3% |
| Visual & Performing Arts | 528 | 2.5% |
| Communications | 708 | 3.4% |
| Arts & Humanities | 1,837 | 8.8% |
| Total | 20,851 | 100.0% |
Transportation & Commute in Tom Green County
Vehicle Availability by Sex in Tom Green County
The most prevalent vehicle ownership categories in Tom Green County are males with 2 vehicles (13,692, accounting for 46.6%) and females with 2 vehicles (11,010, making up 54.6%).
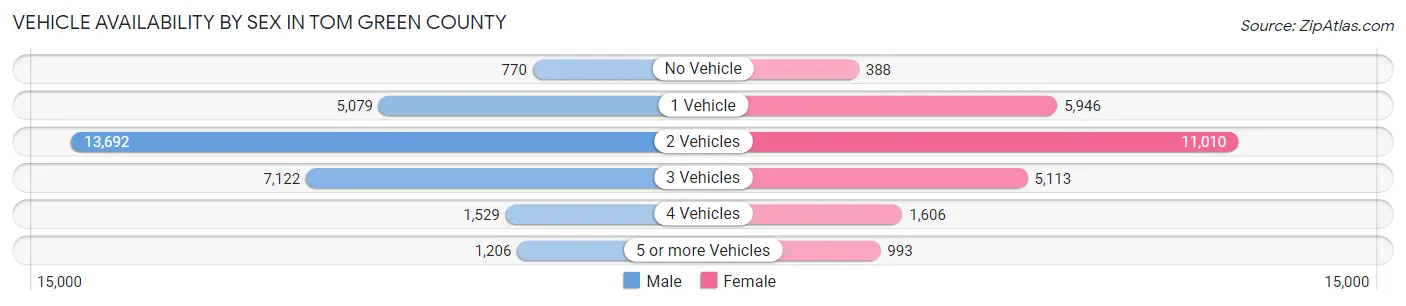
| Vehicles Available | Male | Female |
| No Vehicle | 770 (2.6%) | 388 (1.5%) |
| 1 Vehicle | 5,079 (17.3%) | 5,946 (23.7%) |
| 2 Vehicles | 13,692 (46.6%) | 11,010 (43.9%) |
| 3 Vehicles | 7,122 (24.2%) | 5,113 (20.4%) |
| 4 Vehicles | 1,529 (5.2%) | 1,606 (6.4%) |
| 5 or more Vehicles | 1,206 (4.1%) | 993 (4.0%) |
| Total | 29,398 (100.0%) | 25,056 (100.0%) |
Commute Time in Tom Green County
The most frequently occuring commute durations in Tom Green County are 15 to 19 minutes (14,491 commuters, 27.2%), 10 to 14 minutes (12,224 commuters, 22.9%), and 5 to 9 minutes (9,771 commuters, 18.3%).
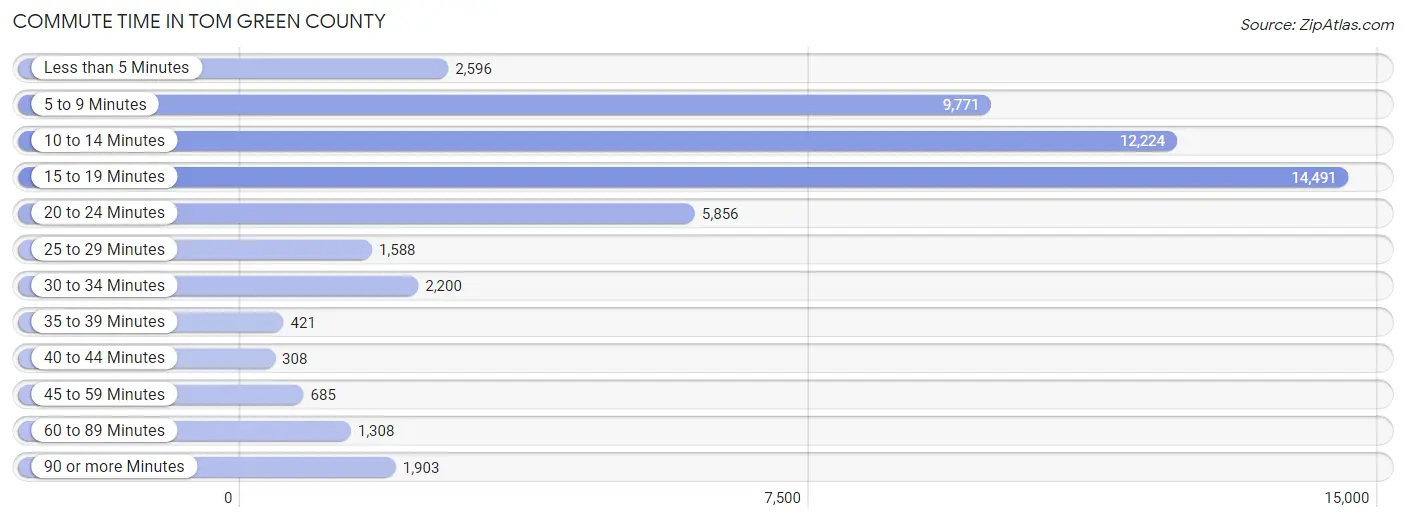
| Commute Time | # Commuters | % Commuters |
| Less than 5 Minutes | 2,596 | 4.9% |
| 5 to 9 Minutes | 9,771 | 18.3% |
| 10 to 14 Minutes | 12,224 | 22.9% |
| 15 to 19 Minutes | 14,491 | 27.2% |
| 20 to 24 Minutes | 5,856 | 11.0% |
| 25 to 29 Minutes | 1,588 | 3.0% |
| 30 to 34 Minutes | 2,200 | 4.1% |
| 35 to 39 Minutes | 421 | 0.8% |
| 40 to 44 Minutes | 308 | 0.6% |
| 45 to 59 Minutes | 685 | 1.3% |
| 60 to 89 Minutes | 1,308 | 2.5% |
| 90 or more Minutes | 1,903 | 3.6% |
Commute Time by Sex in Tom Green County
The most common commute times in Tom Green County are 15 to 19 minutes (7,209 commuters, 24.5%) for males and 15 to 19 minutes (7,282 commuters, 30.5%) for females.
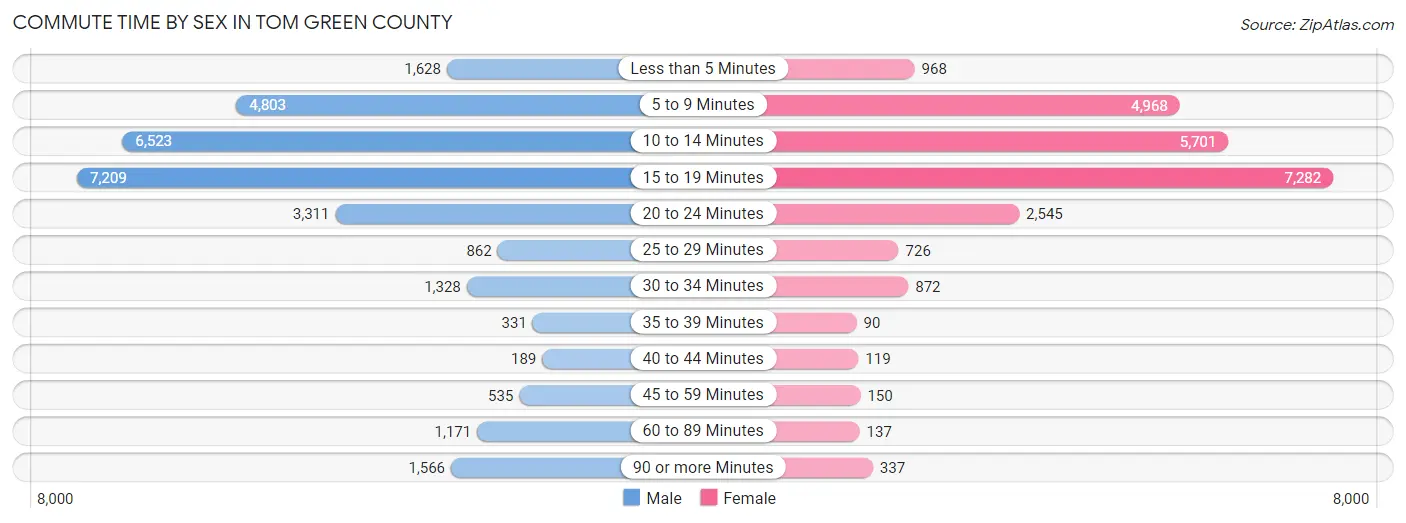
| Commute Time | Male | Female |
| Less than 5 Minutes | 1,628 (5.5%) | 968 (4.1%) |
| 5 to 9 Minutes | 4,803 (16.3%) | 4,968 (20.8%) |
| 10 to 14 Minutes | 6,523 (22.1%) | 5,701 (23.9%) |
| 15 to 19 Minutes | 7,209 (24.5%) | 7,282 (30.5%) |
| 20 to 24 Minutes | 3,311 (11.2%) | 2,545 (10.6%) |
| 25 to 29 Minutes | 862 (2.9%) | 726 (3.0%) |
| 30 to 34 Minutes | 1,328 (4.5%) | 872 (3.6%) |
| 35 to 39 Minutes | 331 (1.1%) | 90 (0.4%) |
| 40 to 44 Minutes | 189 (0.6%) | 119 (0.5%) |
| 45 to 59 Minutes | 535 (1.8%) | 150 (0.6%) |
| 60 to 89 Minutes | 1,171 (4.0%) | 137 (0.6%) |
| 90 or more Minutes | 1,566 (5.3%) | 337 (1.4%) |
Time of Departure to Work by Sex in Tom Green County
The most frequent times of departure to work in Tom Green County are 7:00 AM to 7:29 AM (4,422, 15.0%) for males and 7:30 AM to 7:59 AM (5,238, 21.9%) for females.
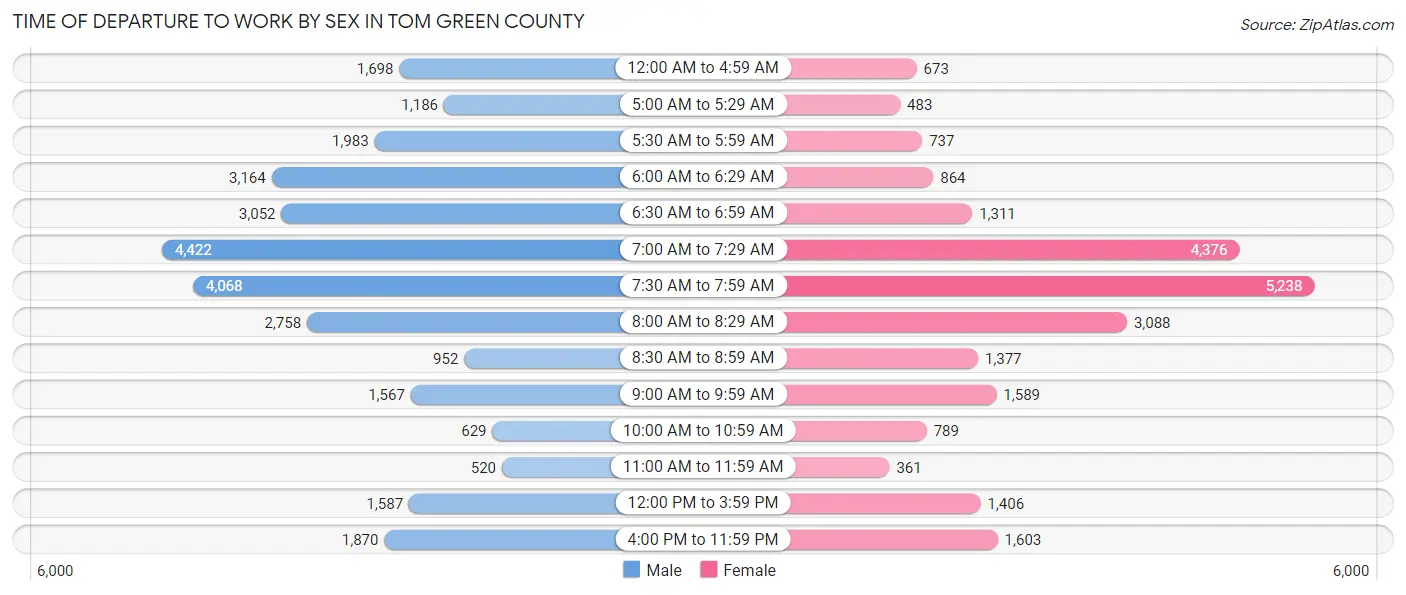
| Time of Departure | Male | Female |
| 12:00 AM to 4:59 AM | 1,698 (5.8%) | 673 (2.8%) |
| 5:00 AM to 5:29 AM | 1,186 (4.0%) | 483 (2.0%) |
| 5:30 AM to 5:59 AM | 1,983 (6.7%) | 737 (3.1%) |
| 6:00 AM to 6:29 AM | 3,164 (10.7%) | 864 (3.6%) |
| 6:30 AM to 6:59 AM | 3,052 (10.4%) | 1,311 (5.5%) |
| 7:00 AM to 7:29 AM | 4,422 (15.0%) | 4,376 (18.3%) |
| 7:30 AM to 7:59 AM | 4,068 (13.8%) | 5,238 (21.9%) |
| 8:00 AM to 8:29 AM | 2,758 (9.4%) | 3,088 (12.9%) |
| 8:30 AM to 8:59 AM | 952 (3.2%) | 1,377 (5.8%) |
| 9:00 AM to 9:59 AM | 1,567 (5.3%) | 1,589 (6.7%) |
| 10:00 AM to 10:59 AM | 629 (2.1%) | 789 (3.3%) |
| 11:00 AM to 11:59 AM | 520 (1.8%) | 361 (1.5%) |
| 12:00 PM to 3:59 PM | 1,587 (5.4%) | 1,406 (5.9%) |
| 4:00 PM to 11:59 PM | 1,870 (6.4%) | 1,603 (6.7%) |
| Total | 29,456 (100.0%) | 23,895 (100.0%) |
Housing Occupancy in Tom Green County
Occupancy by Ownership in Tom Green County
Of the total 45,449 dwellings in Tom Green County, owner-occupied units account for 30,671 (67.5%), while renter-occupied units make up 14,778 (32.5%).
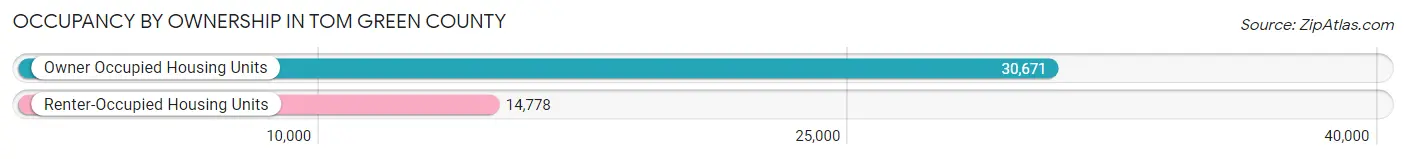
| Occupancy | # Housing Units | % Housing Units |
| Owner Occupied Housing Units | 30,671 | 67.5% |
| Renter-Occupied Housing Units | 14,778 | 32.5% |
| Total Occupied Housing Units | 45,449 | 100.0% |
Occupancy by Household Size in Tom Green County
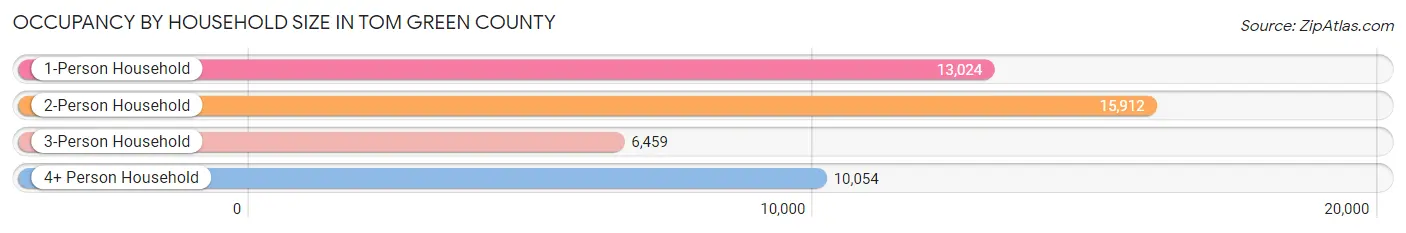
| Household Size | # Housing Units | % Housing Units |
| 1-Person Household | 13,024 | 28.7% |
| 2-Person Household | 15,912 | 35.0% |
| 3-Person Household | 6,459 | 14.2% |
| 4+ Person Household | 10,054 | 22.1% |
| Total Housing Units | 45,449 | 100.0% |
Occupancy by Ownership by Household Size in Tom Green County
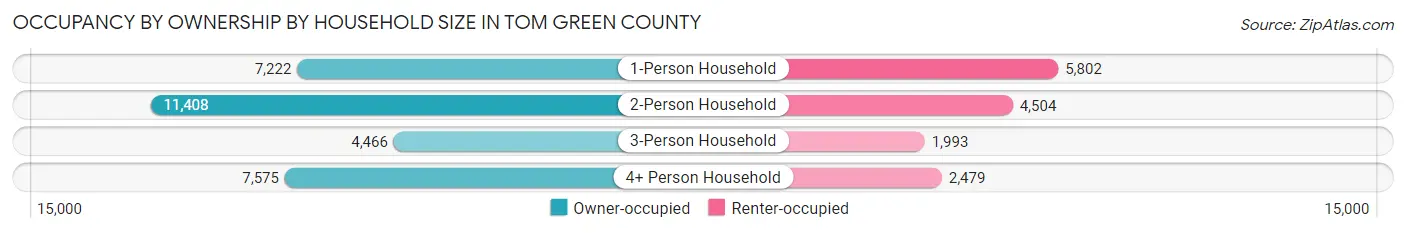
| Household Size | Owner-occupied | Renter-occupied |
| 1-Person Household | 7,222 (55.4%) | 5,802 (44.6%) |
| 2-Person Household | 11,408 (71.7%) | 4,504 (28.3%) |
| 3-Person Household | 4,466 (69.1%) | 1,993 (30.9%) |
| 4+ Person Household | 7,575 (75.3%) | 2,479 (24.7%) |
| Total Housing Units | 30,671 (67.5%) | 14,778 (32.5%) |
Occupancy by Educational Attainment in Tom Green County
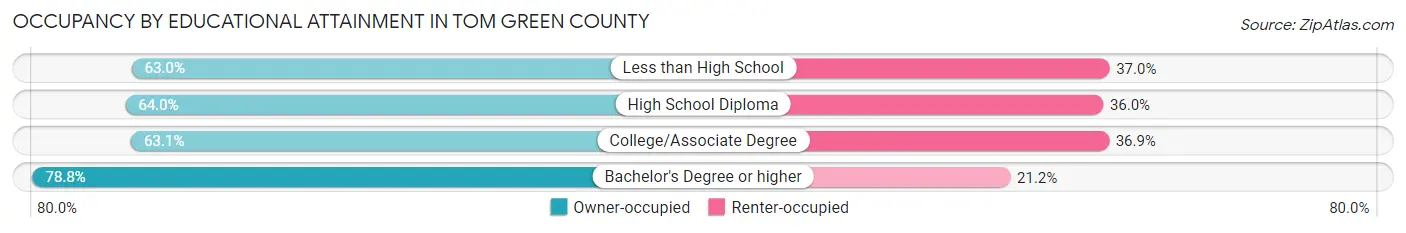
| Household Size | Owner-occupied | Renter-occupied |
| Less than High School | 3,412 (63.0%) | 2,001 (37.0%) |
| High School Diploma | 7,147 (64.0%) | 4,015 (36.0%) |
| College/Associate Degree | 10,611 (63.1%) | 6,200 (36.9%) |
| Bachelor's Degree or higher | 9,501 (78.8%) | 2,562 (21.2%) |
Occupancy by Age of Householder in Tom Green County
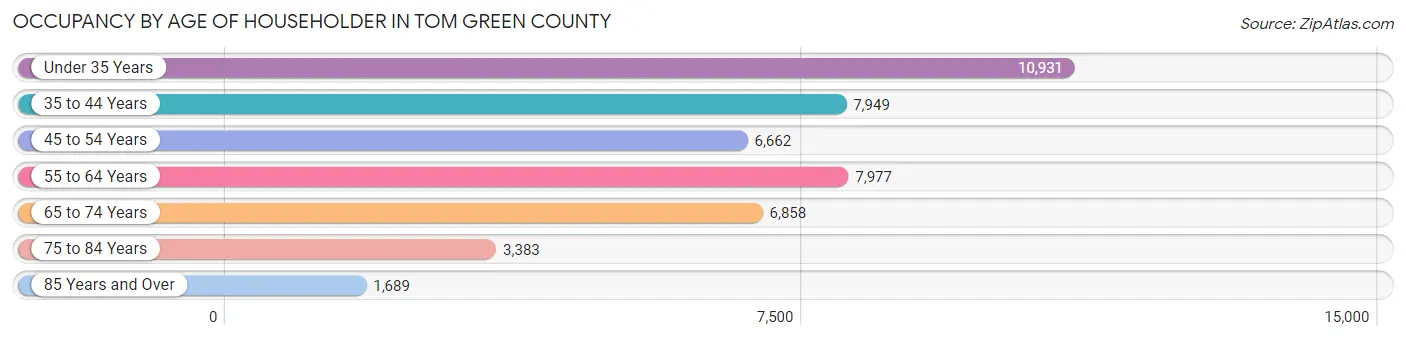
| Age Bracket | # Households | % Households |
| Under 35 Years | 10,931 | 24.0% |
| 35 to 44 Years | 7,949 | 17.5% |
| 45 to 54 Years | 6,662 | 14.7% |
| 55 to 64 Years | 7,977 | 17.5% |
| 65 to 74 Years | 6,858 | 15.1% |
| 75 to 84 Years | 3,383 | 7.4% |
| 85 Years and Over | 1,689 | 3.7% |
| Total | 45,449 | 100.0% |
Housing Finances in Tom Green County
Median Income by Occupancy in Tom Green County
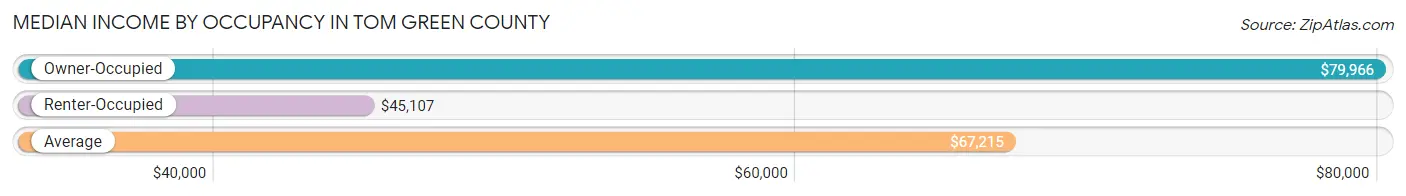
| Occupancy Type | # Households | Median Income |
| Owner-Occupied | 30,671 (67.5%) | $79,966 |
| Renter-Occupied | 14,778 (32.5%) | $45,107 |
| Average | 45,449 (100.0%) | $67,215 |
Occupancy by Householder Income Bracket in Tom Green County
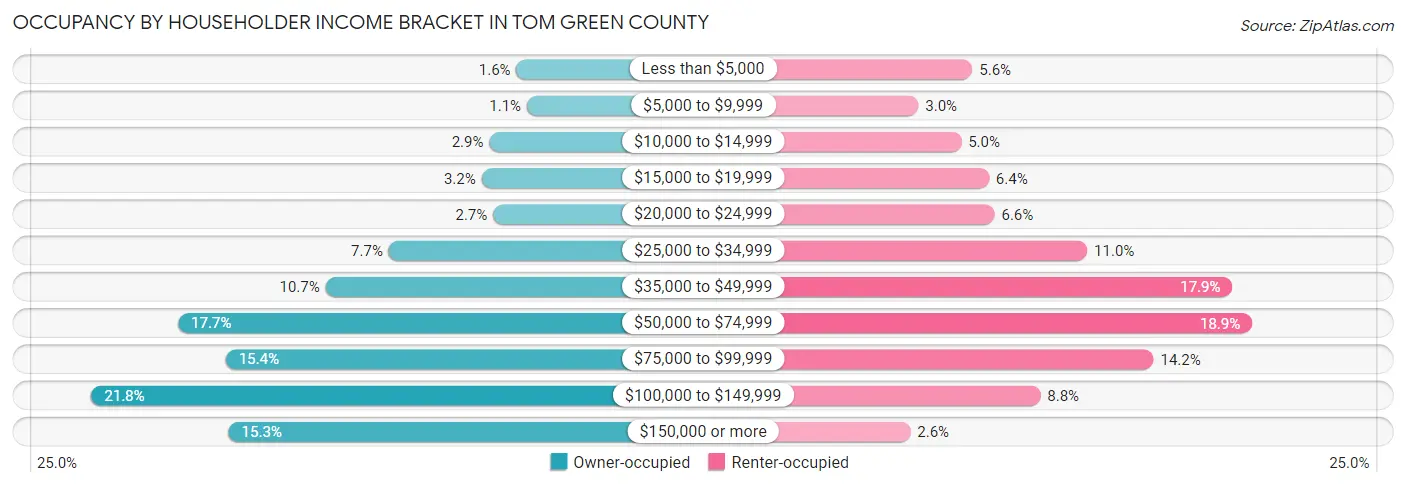
| Income Bracket | Owner-occupied | Renter-occupied |
| Less than $5,000 | 484 (1.6%) | 822 (5.6%) |
| $5,000 to $9,999 | 332 (1.1%) | 442 (3.0%) |
| $10,000 to $14,999 | 880 (2.9%) | 743 (5.0%) |
| $15,000 to $19,999 | 993 (3.2%) | 939 (6.4%) |
| $20,000 to $24,999 | 825 (2.7%) | 978 (6.6%) |
| $25,000 to $34,999 | 2,349 (7.7%) | 1,630 (11.0%) |
| $35,000 to $49,999 | 3,272 (10.7%) | 2,651 (17.9%) |
| $50,000 to $74,999 | 5,427 (17.7%) | 2,790 (18.9%) |
| $75,000 to $99,999 | 4,729 (15.4%) | 2,097 (14.2%) |
| $100,000 to $149,999 | 6,693 (21.8%) | 1,301 (8.8%) |
| $150,000 or more | 4,687 (15.3%) | 385 (2.6%) |
| Total | 30,671 (100.0%) | 14,778 (100.0%) |
Monthly Housing Cost Tiers in Tom Green County
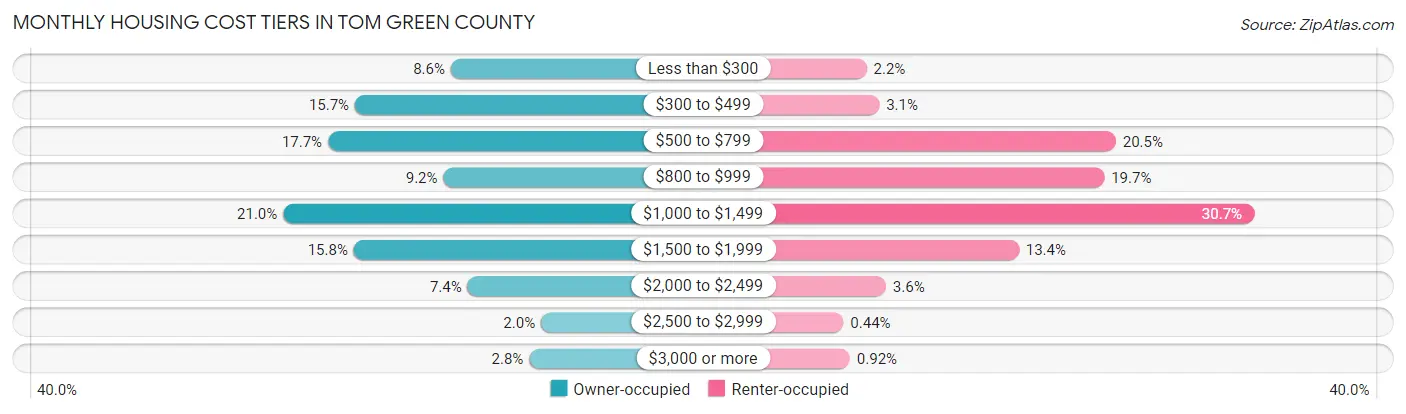
| Monthly Cost | Owner-occupied | Renter-occupied |
| Less than $300 | 2,641 (8.6%) | 317 (2.1%) |
| $300 to $499 | 4,805 (15.7%) | 455 (3.1%) |
| $500 to $799 | 5,417 (17.7%) | 3,030 (20.5%) |
| $800 to $999 | 2,809 (9.2%) | 2,904 (19.7%) |
| $1,000 to $1,499 | 6,430 (21.0%) | 4,532 (30.7%) |
| $1,500 to $1,999 | 4,833 (15.8%) | 1,974 (13.4%) |
| $2,000 to $2,499 | 2,262 (7.4%) | 528 (3.6%) |
| $2,500 to $2,999 | 604 (2.0%) | 65 (0.4%) |
| $3,000 or more | 870 (2.8%) | 136 (0.9%) |
| Total | 30,671 (100.0%) | 14,778 (100.0%) |
Physical Housing Characteristics in Tom Green County
Housing Structures in Tom Green County
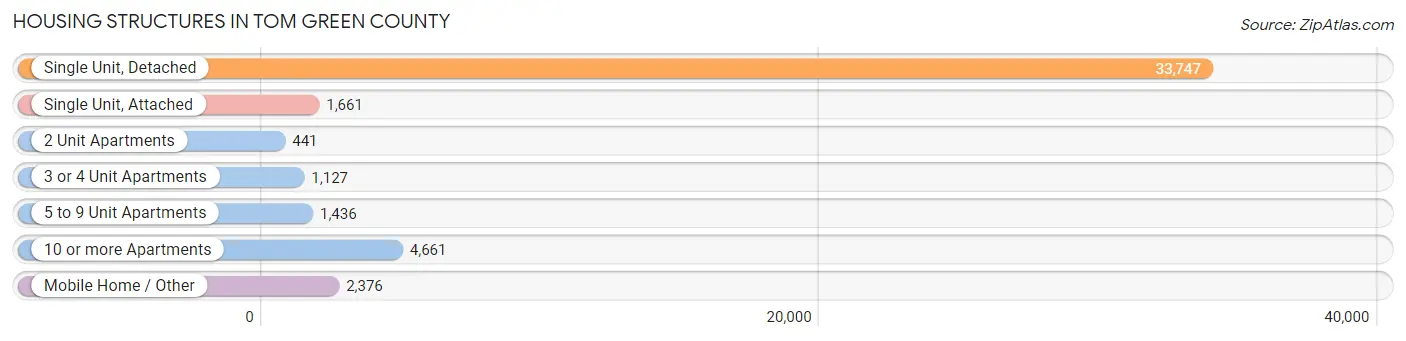
| Structure Type | # Housing Units | % Housing Units |
| Single Unit, Detached | 33,747 | 74.3% |
| Single Unit, Attached | 1,661 | 3.6% |
| 2 Unit Apartments | 441 | 1.0% |
| 3 or 4 Unit Apartments | 1,127 | 2.5% |
| 5 to 9 Unit Apartments | 1,436 | 3.2% |
| 10 or more Apartments | 4,661 | 10.3% |
| Mobile Home / Other | 2,376 | 5.2% |
| Total | 45,449 | 100.0% |
Housing Structures by Occupancy in Tom Green County
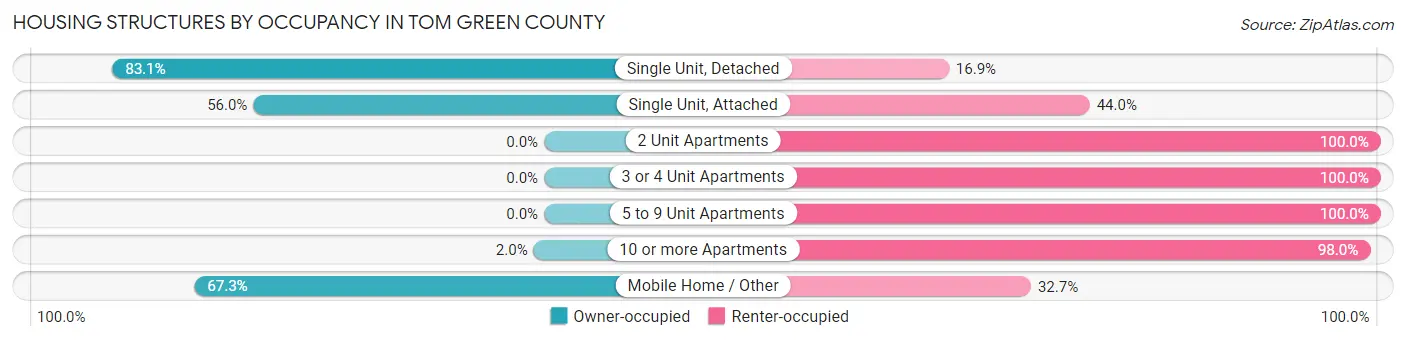
| Structure Type | Owner-occupied | Renter-occupied |
| Single Unit, Detached | 28,048 (83.1%) | 5,699 (16.9%) |
| Single Unit, Attached | 930 (56.0%) | 731 (44.0%) |
| 2 Unit Apartments | 0 (0.0%) | 441 (100.0%) |
| 3 or 4 Unit Apartments | 0 (0.0%) | 1,127 (100.0%) |
| 5 to 9 Unit Apartments | 0 (0.0%) | 1,436 (100.0%) |
| 10 or more Apartments | 94 (2.0%) | 4,567 (98.0%) |
| Mobile Home / Other | 1,599 (67.3%) | 777 (32.7%) |
| Total | 30,671 (67.5%) | 14,778 (32.5%) |
Housing Structures by Number of Rooms in Tom Green County
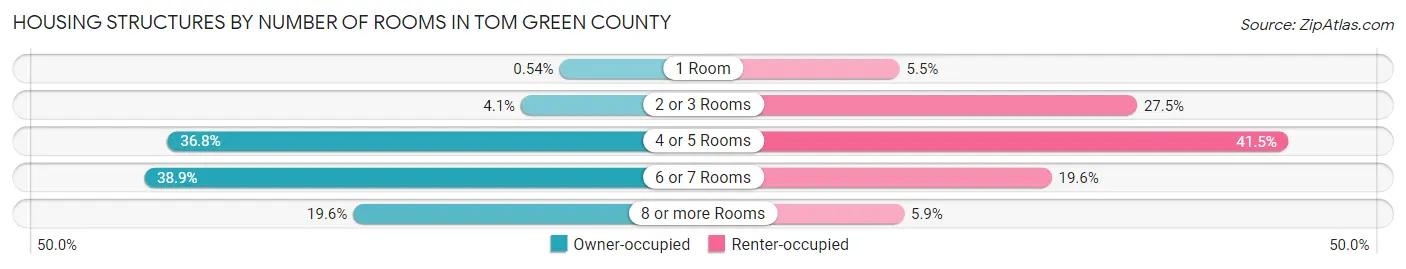
| Number of Rooms | Owner-occupied | Renter-occupied |
| 1 Room | 165 (0.5%) | 816 (5.5%) |
| 2 or 3 Rooms | 1,258 (4.1%) | 4,060 (27.5%) |
| 4 or 5 Rooms | 11,288 (36.8%) | 6,133 (41.5%) |
| 6 or 7 Rooms | 11,942 (38.9%) | 2,892 (19.6%) |
| 8 or more Rooms | 6,018 (19.6%) | 877 (5.9%) |
| Total | 30,671 (100.0%) | 14,778 (100.0%) |
Housing Structure by Heating Type in Tom Green County
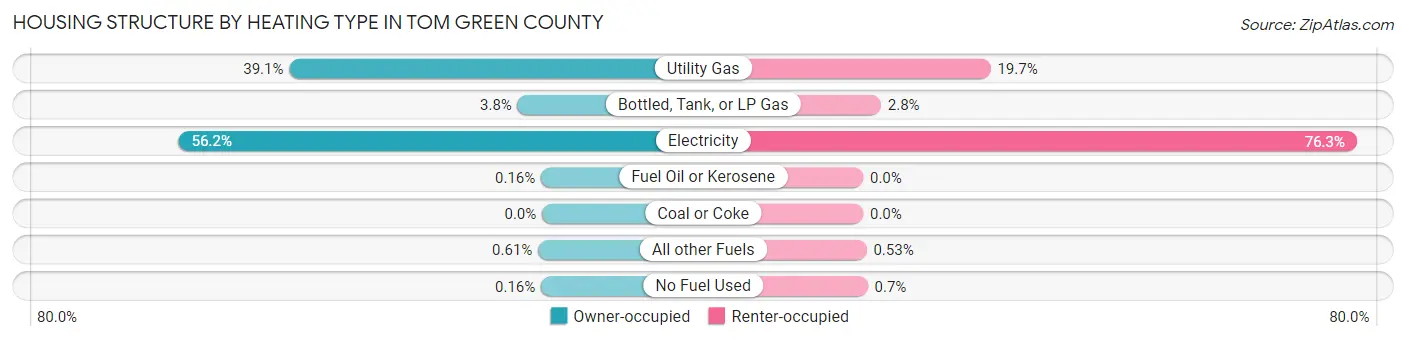
| Heating Type | Owner-occupied | Renter-occupied |
| Utility Gas | 11,987 (39.1%) | 2,912 (19.7%) |
| Bottled, Tank, or LP Gas | 1,158 (3.8%) | 406 (2.8%) |
| Electricity | 17,238 (56.2%) | 11,278 (76.3%) |
| Fuel Oil or Kerosene | 50 (0.2%) | 0 (0.0%) |
| Coal or Coke | 0 (0.0%) | 0 (0.0%) |
| All other Fuels | 188 (0.6%) | 78 (0.5%) |
| No Fuel Used | 50 (0.2%) | 104 (0.7%) |
| Total | 30,671 (100.0%) | 14,778 (100.0%) |
Household Vehicle Usage in Tom Green County
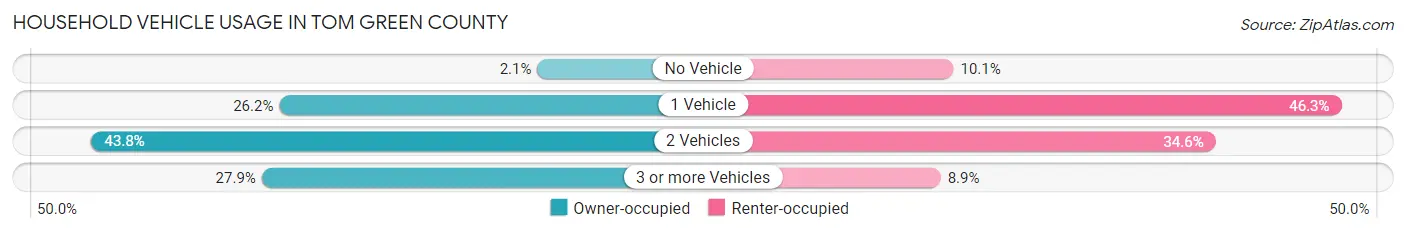
| Vehicles per Household | Owner-occupied | Renter-occupied |
| No Vehicle | 655 (2.1%) | 1,498 (10.1%) |
| 1 Vehicle | 8,045 (26.2%) | 6,848 (46.3%) |
| 2 Vehicles | 13,423 (43.8%) | 5,111 (34.6%) |
| 3 or more Vehicles | 8,548 (27.9%) | 1,321 (8.9%) |
| Total | 30,671 (100.0%) | 14,778 (100.0%) |
Real Estate & Mortgages in Tom Green County
Real Estate and Mortgage Overview in Tom Green County
| Characteristic | Without Mortgage | With Mortgage |
| Housing Units | 15,881 | 14,790 |
| Median Property Value | $159,900 | $193,900 |
| Median Household Income | $64,644 | $2,863 |
| Monthly Housing Costs | $531 | $806 |
| Real Estate Taxes | $1,688 | $715 |
Property Value by Mortgage Status in Tom Green County
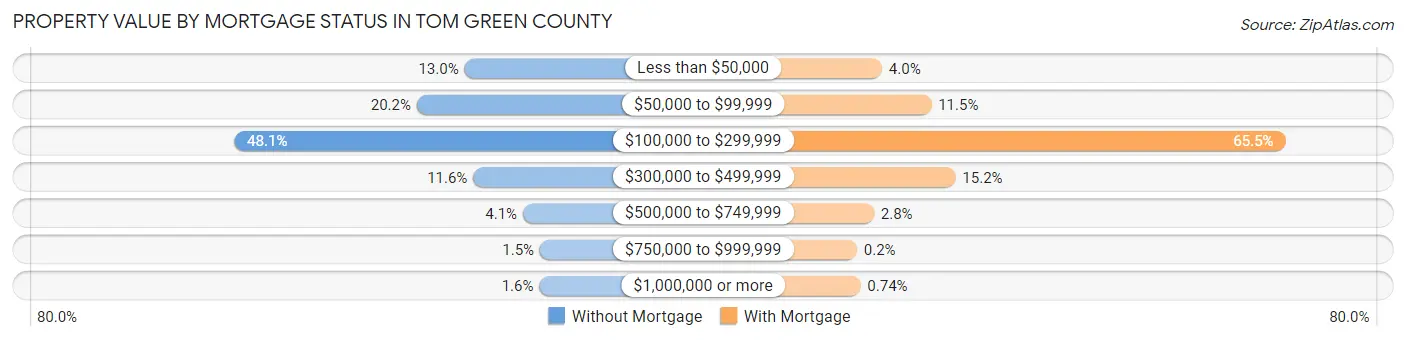
| Property Value | Without Mortgage | With Mortgage |
| Less than $50,000 | 2,059 (13.0%) | 595 (4.0%) |
| $50,000 to $99,999 | 3,214 (20.2%) | 1,705 (11.5%) |
| $100,000 to $299,999 | 7,633 (48.1%) | 9,687 (65.5%) |
| $300,000 to $499,999 | 1,848 (11.6%) | 2,251 (15.2%) |
| $500,000 to $749,999 | 644 (4.1%) | 413 (2.8%) |
| $750,000 to $999,999 | 233 (1.5%) | 29 (0.2%) |
| $1,000,000 or more | 250 (1.6%) | 110 (0.7%) |
| Total | 15,881 (100.0%) | 14,790 (100.0%) |
Household Income by Mortgage Status in Tom Green County
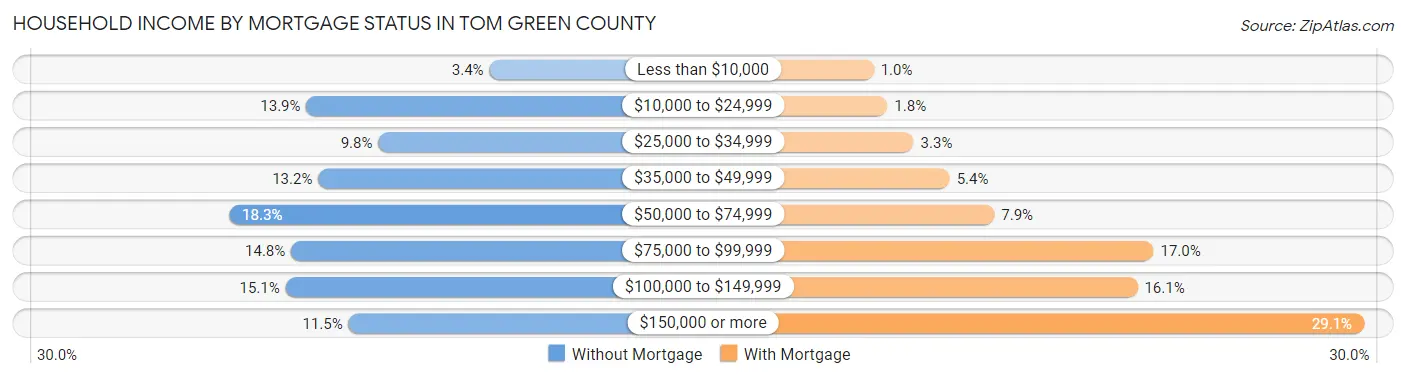
| Household Income | Without Mortgage | With Mortgage |
| Less than $10,000 | 547 (3.4%) | 154 (1.0%) |
| $10,000 to $24,999 | 2,207 (13.9%) | 269 (1.8%) |
| $25,000 to $34,999 | 1,554 (9.8%) | 491 (3.3%) |
| $35,000 to $49,999 | 2,099 (13.2%) | 795 (5.4%) |
| $50,000 to $74,999 | 2,908 (18.3%) | 1,173 (7.9%) |
| $75,000 to $99,999 | 2,346 (14.8%) | 2,519 (17.0%) |
| $100,000 to $149,999 | 2,396 (15.1%) | 2,383 (16.1%) |
| $150,000 or more | 1,824 (11.5%) | 4,297 (29.0%) |
| Total | 15,881 (100.0%) | 14,790 (100.0%) |
Property Value to Household Income Ratio in Tom Green County
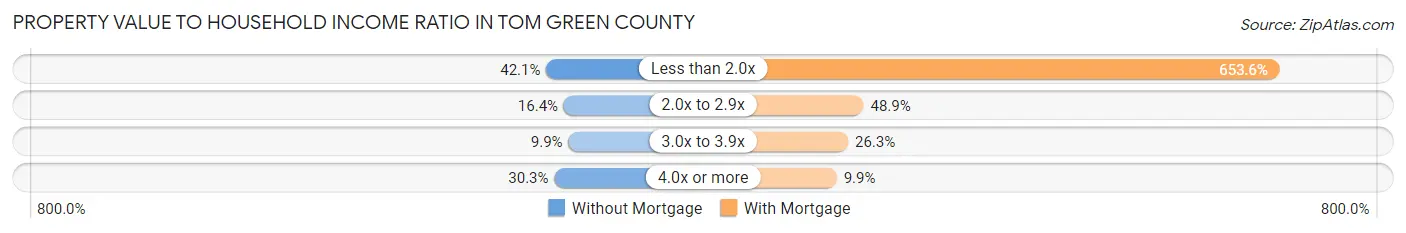
| Value-to-Income Ratio | Without Mortgage | With Mortgage |
| Less than 2.0x | 6,682 (42.1%) | 96,662 (653.6%) |
| 2.0x to 2.9x | 2,607 (16.4%) | 7,231 (48.9%) |
| 3.0x to 3.9x | 1,577 (9.9%) | 3,892 (26.3%) |
| 4.0x or more | 4,814 (30.3%) | 1,468 (9.9%) |
| Total | 15,881 (100.0%) | 14,790 (100.0%) |
Real Estate Taxes by Mortgage Status in Tom Green County
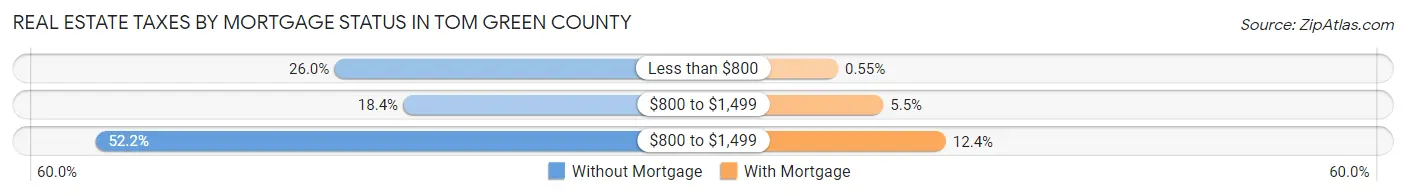
| Property Taxes | Without Mortgage | With Mortgage |
| Less than $800 | 4,125 (26.0%) | 82 (0.5%) |
| $800 to $1,499 | 2,927 (18.4%) | 815 (5.5%) |
| $800 to $1,499 | 8,295 (52.2%) | 1,829 (12.4%) |
| Total | 15,881 (100.0%) | 14,790 (100.0%) |
Health & Disability in Tom Green County
Health Insurance Coverage by Age in Tom Green County
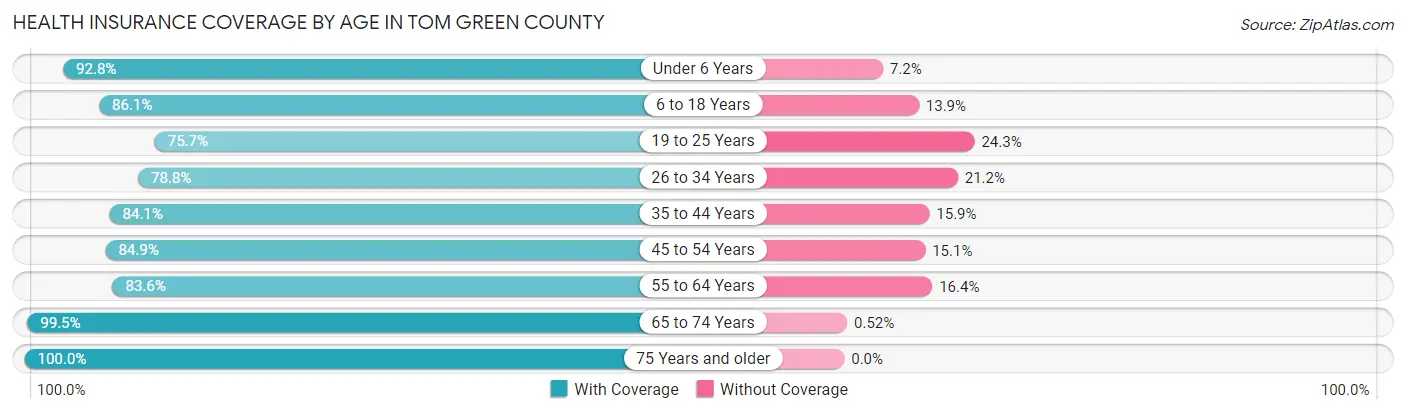
| Age Bracket | With Coverage | Without Coverage |
| Under 6 Years | 8,489 (92.8%) | 659 (7.2%) |
| 6 to 18 Years | 18,024 (86.1%) | 2,909 (13.9%) |
| 19 to 25 Years | 8,571 (75.7%) | 2,749 (24.3%) |
| 26 to 34 Years | 11,719 (78.8%) | 3,146 (21.2%) |
| 35 to 44 Years | 11,985 (84.1%) | 2,259 (15.9%) |
| 45 to 54 Years | 10,140 (84.9%) | 1,802 (15.1%) |
| 55 to 64 Years | 11,250 (83.6%) | 2,207 (16.4%) |
| 65 to 74 Years | 10,941 (99.5%) | 57 (0.5%) |
| 75 Years and older | 7,525 (100.0%) | 0 (0.0%) |
| Total | 98,644 (86.2%) | 15,788 (13.8%) |
Health Insurance Coverage by Citizenship Status in Tom Green County

| Citizenship Status | With Coverage | Without Coverage |
| Native Born | 8,489 (92.8%) | 659 (7.2%) |
| Foreign Born, Citizen | 18,024 (86.1%) | 2,909 (13.9%) |
| Foreign Born, not a Citizen | 8,571 (75.7%) | 2,749 (24.3%) |
Health Insurance Coverage by Household Income in Tom Green County
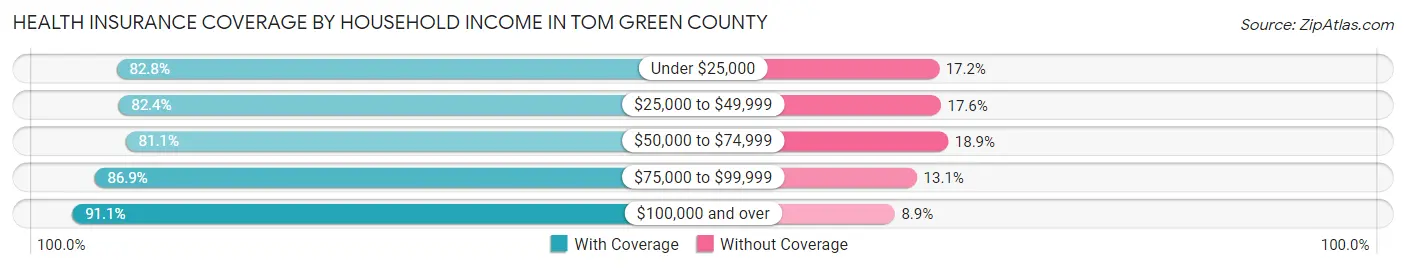
| Household Income | With Coverage | Without Coverage |
| Under $25,000 | 9,878 (82.8%) | 2,055 (17.2%) |
| $25,000 to $49,999 | 17,776 (82.4%) | 3,786 (17.6%) |
| $50,000 to $74,999 | 16,517 (81.1%) | 3,857 (18.9%) |
| $75,000 to $99,999 | 15,993 (86.9%) | 2,409 (13.1%) |
| $100,000 and over | 36,308 (91.1%) | 3,559 (8.9%) |
Public vs Private Health Insurance Coverage by Age in Tom Green County
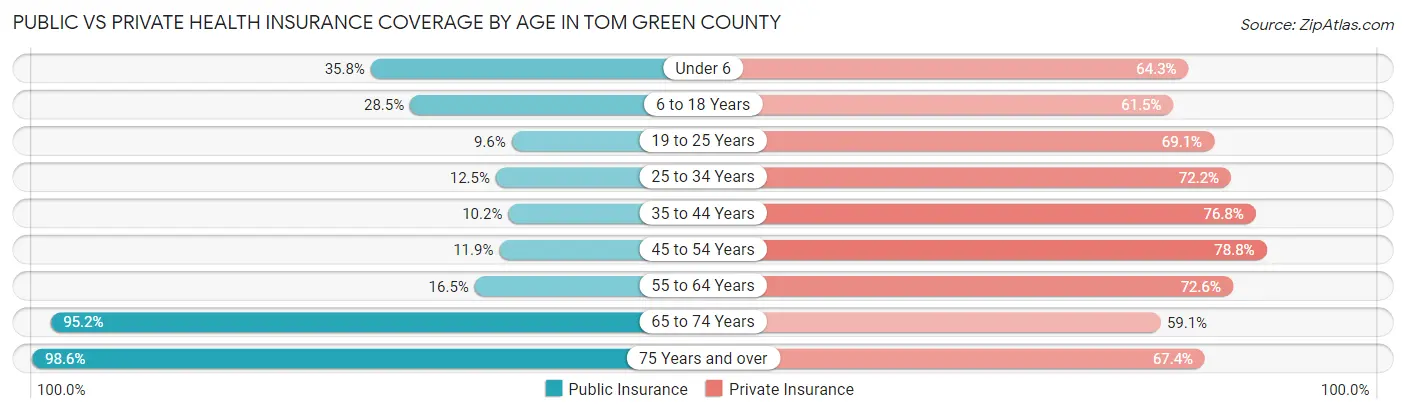
| Age Bracket | Public Insurance | Private Insurance |
| Under 6 | 3,271 (35.8%) | 5,885 (64.3%) |
| 6 to 18 Years | 5,958 (28.5%) | 12,883 (61.5%) |
| 19 to 25 Years | 1,089 (9.6%) | 7,818 (69.1%) |
| 25 to 34 Years | 1,864 (12.5%) | 10,736 (72.2%) |
| 35 to 44 Years | 1,457 (10.2%) | 10,941 (76.8%) |
| 45 to 54 Years | 1,421 (11.9%) | 9,412 (78.8%) |
| 55 to 64 Years | 2,215 (16.5%) | 9,764 (72.6%) |
| 65 to 74 Years | 10,475 (95.2%) | 6,494 (59.1%) |
| 75 Years and over | 7,420 (98.6%) | 5,072 (67.4%) |
| Total | 35,170 (30.7%) | 79,005 (69.0%) |
Disability Status by Sex by Age in Tom Green County
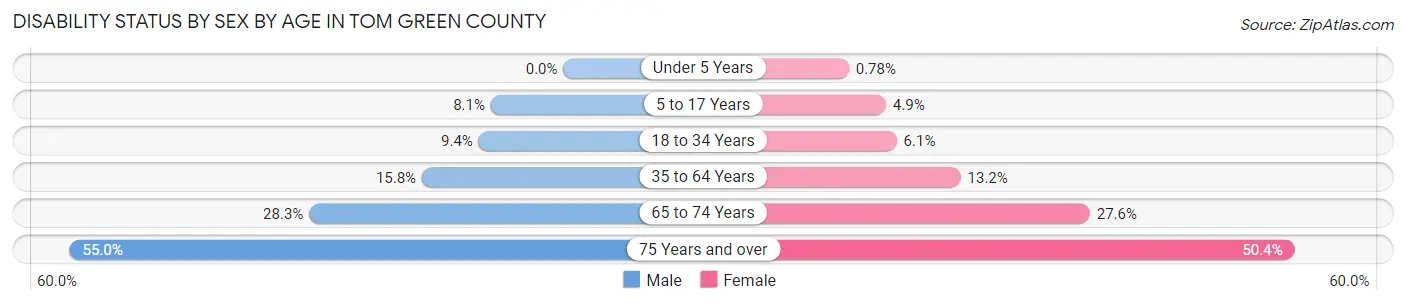
| Age Bracket | Male | Female |
| Under 5 Years | 0 (0.0%) | 28 (0.8%) |
| 5 to 17 Years | 852 (8.1%) | 512 (4.9%) |
| 18 to 34 Years | 1,306 (9.4%) | 846 (6.1%) |
| 35 to 64 Years | 3,024 (15.8%) | 2,705 (13.2%) |
| 65 to 74 Years | 1,482 (28.3%) | 1,592 (27.6%) |
| 75 Years and over | 1,799 (55.0%) | 2,144 (50.4%) |
Disability Class by Sex by Age in Tom Green County
Disability Class: Hearing Difficulty
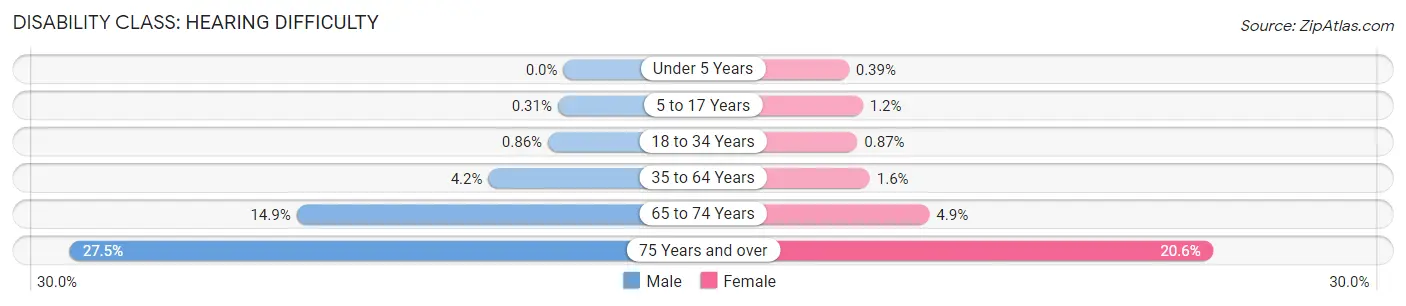
| Age Bracket | Male | Female |
| Under 5 Years | 0 (0.0%) | 14 (0.4%) |
| 5 to 17 Years | 33 (0.3%) | 122 (1.2%) |
| 18 to 34 Years | 119 (0.9%) | 121 (0.9%) |
| 35 to 64 Years | 802 (4.2%) | 318 (1.6%) |
| 65 to 74 Years | 778 (14.9%) | 281 (4.9%) |
| 75 Years and over | 899 (27.5%) | 878 (20.6%) |
Disability Class: Vision Difficulty
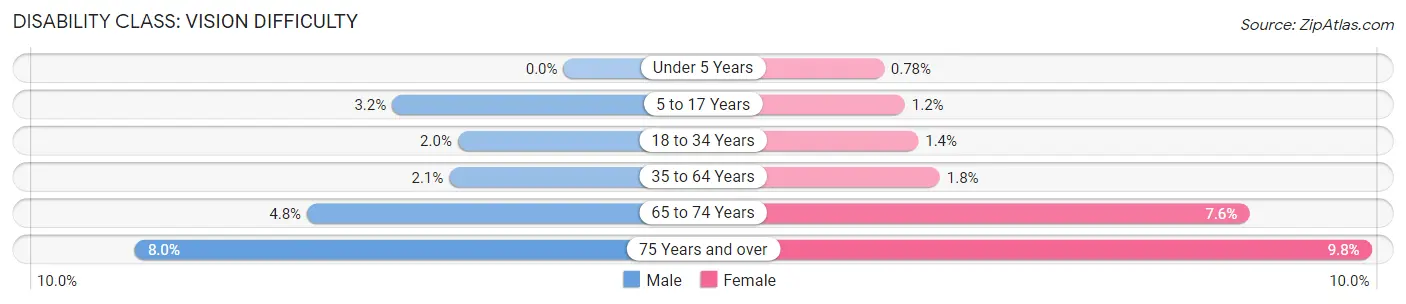
| Age Bracket | Male | Female |
| Under 5 Years | 0 (0.0%) | 28 (0.8%) |
| 5 to 17 Years | 336 (3.2%) | 122 (1.2%) |
| 18 to 34 Years | 272 (2.0%) | 196 (1.4%) |
| 35 to 64 Years | 407 (2.1%) | 373 (1.8%) |
| 65 to 74 Years | 249 (4.8%) | 436 (7.6%) |
| 75 Years and over | 260 (8.0%) | 418 (9.8%) |
Disability Class: Cognitive Difficulty
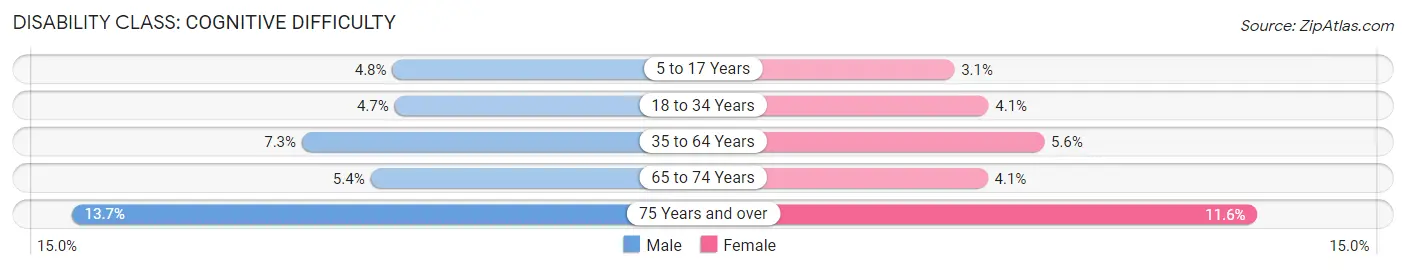
| Age Bracket | Male | Female |
| 5 to 17 Years | 502 (4.8%) | 326 (3.1%) |
| 18 to 34 Years | 651 (4.7%) | 565 (4.1%) |
| 35 to 64 Years | 1,397 (7.3%) | 1,151 (5.6%) |
| 65 to 74 Years | 281 (5.4%) | 234 (4.1%) |
| 75 Years and over | 448 (13.7%) | 492 (11.6%) |
Disability Class: Ambulatory Difficulty

| Age Bracket | Male | Female |
| 5 to 17 Years | 0 (0.0%) | 30 (0.3%) |
| 18 to 34 Years | 362 (2.6%) | 184 (1.3%) |
| 35 to 64 Years | 1,592 (8.3%) | 1,641 (8.0%) |
| 65 to 74 Years | 651 (12.4%) | 979 (17.0%) |
| 75 Years and over | 1,035 (31.6%) | 1,503 (35.3%) |
Disability Class: Self-Care Difficulty
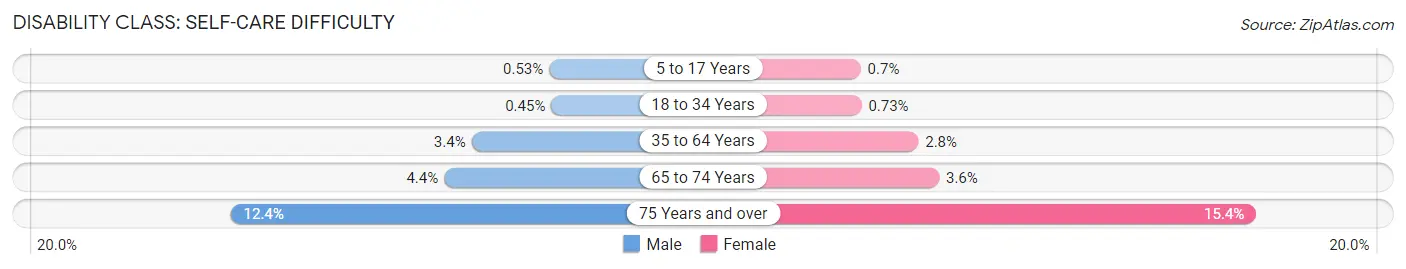
| Age Bracket | Male | Female |
| 5 to 17 Years | 56 (0.5%) | 73 (0.7%) |
| 18 to 34 Years | 63 (0.4%) | 101 (0.7%) |
| 35 to 64 Years | 655 (3.4%) | 580 (2.8%) |
| 65 to 74 Years | 232 (4.4%) | 208 (3.6%) |
| 75 Years and over | 404 (12.3%) | 654 (15.4%) |
Technology Access in Tom Green County
Computing Device Access in Tom Green County
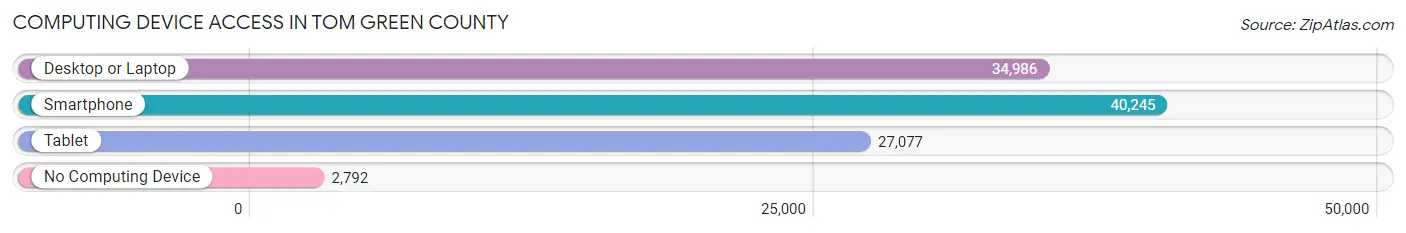
| Device Type | # Households | % Households |
| Desktop or Laptop | 34,986 | 77.0% |
| Smartphone | 40,245 | 88.5% |
| Tablet | 27,077 | 59.6% |
| No Computing Device | 2,792 | 6.1% |
| Total | 45,449 | 100.0% |
Internet Access in Tom Green County
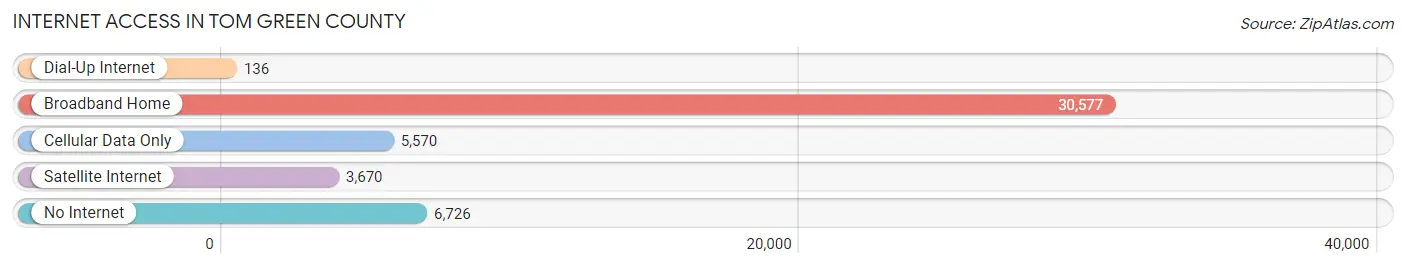
| Internet Type | # Households | % Households |
| Dial-Up Internet | 136 | 0.3% |
| Broadband Home | 30,577 | 67.3% |
| Cellular Data Only | 5,570 | 12.3% |
| Satellite Internet | 3,670 | 8.1% |
| No Internet | 6,726 | 14.8% |
| Total | 45,449 | 100.0% |
Tom Green County Summary
Tom Green County is located in the state of Texas in the United States. It is located in the Concho Valley region of the state and is bordered by Coke, Runnels, Concho, and Irion counties. The county seat is San Angelo, which is also the largest city in the county. Tom Green County was established in 1874 and is named after Thomas Green, a Confederate general who fought in the Civil War.
Geography
Tom Green County covers an area of 1,541 square miles and is located in the Concho Valley region of Texas. The county is mostly flat with some rolling hills and is drained by the Concho River and its tributaries. The county is located in the Edwards Plateau and is home to several species of wildlife, including white-tailed deer, coyotes, bobcats, and various species of birds. The climate is semi-arid with hot summers and mild winters.
Demographics
As of the 2010 census, Tom Green County had a population of 110,224. The population was spread out with 24.7% under the age of 18, 10.3% from 18 to 24, 28.2% from 25 to 44, 22.2% from 45 to 64, and 14.6% who were 65 years of age or older. The median age was 34.4 years. The racial makeup of the county was 75.2% White, 5.3% African American, 0.7% Native American, 1.2% Asian, 0.1% Pacific Islander, 15.2% from other races, and 2.3% from two or more races. Hispanic or Latino of any race were 44.2% of the population.
Economy
Tom Green County has a diverse economy that is largely based on agriculture, manufacturing, and tourism. The county is home to several large agricultural operations, including cattle, sheep, and goat ranches. The county is also home to several manufacturing companies, including a large oil refinery and a large food processing plant. Tourism is also an important part of the economy, with the city of San Angelo being a popular destination for visitors.
The county has a strong job market, with the unemployment rate in 2020 being 3.2%. The median household income in the county was $50,845 in 2019, and the median home value was $142,400.
Conclusion
Tom Green County is a vibrant and diverse county located in the state of Texas. It is home to a diverse economy that is largely based on agriculture, manufacturing, and tourism. The county has a strong job market and a median household income that is higher than the national average. The county is also home to a variety of wildlife and is a popular destination for visitors.
Common Questions
What is Per Capita Income in Tom Green County?
Per Capita income in Tom Green County is $33,861.
What is the Median Family Income in Tom Green County?
Median Family Income in Tom Green County is $81,166.
What is the Median Household income in Tom Green County?
Median Household Income in Tom Green County is $67,215.
What is Income or Wage Gap in Tom Green County?
Income or Wage Gap in Tom Green County is 33.3%.
Women in Tom Green County earn 66.7 cents for every dollar earned by a man.
What is Family Income Deficit in Tom Green County?
Family Income Deficit in Tom Green County is $11,680.
Families that are below poverty line in Tom Green County earn $11,680 less on average than the poverty threshold level.
What is Inequality or Gini Index in Tom Green County?
Inequality or Gini Index in Tom Green County is 0.45.
What is the Total Population of Tom Green County?
Total Population of Tom Green County is 119,276.
What is the Total Male Population of Tom Green County?
Total Male Population of Tom Green County is 59,736.
What is the Total Female Population of Tom Green County?
Total Female Population of Tom Green County is 59,540.
What is the Ratio of Males per 100 Females in Tom Green County?
There are 100.33 Males per 100 Females in Tom Green County.
What is the Ratio of Females per 100 Males in Tom Green County?
There are 99.67 Females per 100 Males in Tom Green County.
What is the Median Population Age in Tom Green County?
Median Population Age in Tom Green County is 35.0 Years.
What is the Average Family Size in Tom Green County
Average Family Size in Tom Green County is 3.1 People.
What is the Average Household Size in Tom Green County
Average Household Size in Tom Green County is 2.5 People.
How Large is the Labor Force in Tom Green County?
There are 60,360 People in the Labor Forcein in Tom Green County.
What is the Percentage of People in the Labor Force in Tom Green County?
64.4% of People are in the Labor Force in Tom Green County.
What is the Unemployment Rate in Tom Green County?
Unemployment Rate in Tom Green County is 3.2%.