Throckmorton County, TX Map & Demographics
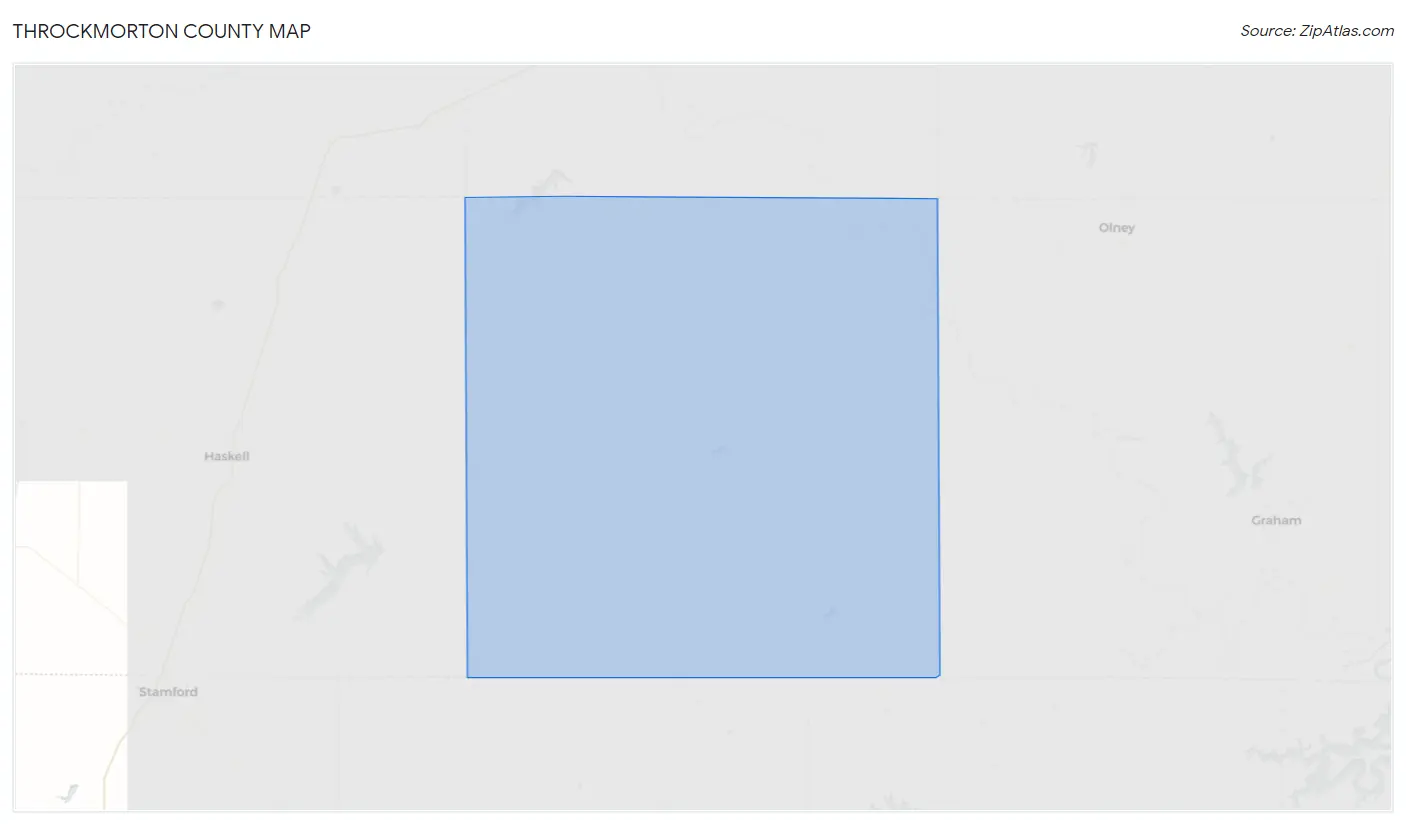
Throckmorton County Map
Throckmorton County Overview
$30,381
PER CAPITA INCOME
$68,125
AVG FAMILY INCOME
$55,221
AVG HOUSEHOLD INCOME
14.9%
WAGE / INCOME GAP [ % ]
85.1¢/ $1
WAGE / INCOME GAP [ $ ]
0.42
INEQUALITY / GINI INDEX
1,439
TOTAL POPULATION
773
MALE POPULATION
666
FEMALE POPULATION
116.07
MALES / 100 FEMALES
86.16
FEMALES / 100 MALES
48.8
MEDIAN AGE
3.2
AVG FAMILY SIZE
2.3
AVG HOUSEHOLD SIZE
753
LABOR FORCE [ PEOPLE ]
61.2%
PERCENT IN LABOR FORCE
2.5%
UNEMPLOYMENT RATE
Throckmorton County Area Codes
Income in Throckmorton County
Income Overview in Throckmorton County
Per Capita Income in Throckmorton County is $30,381, while median incomes of families and households are $68,125 and $55,221 respectively.
| Characteristic | Number | Measure |
| Per Capita Income | 1,439 | $30,381 |
| Median Family Income | 337 | $68,125 |
| Mean Family Income | 337 | $87,009 |
| Median Household Income | 635 | $55,221 |
| Mean Household Income | 635 | $66,570 |
| Income Deficit | 337 | $0 |
| Wage / Income Gap (%) | 1,439 | 14.91% |
| Wage / Income Gap ($) | 1,439 | 85.09¢ per $1 |
| Gini / Inequality Index | 1,439 | 0.42 |
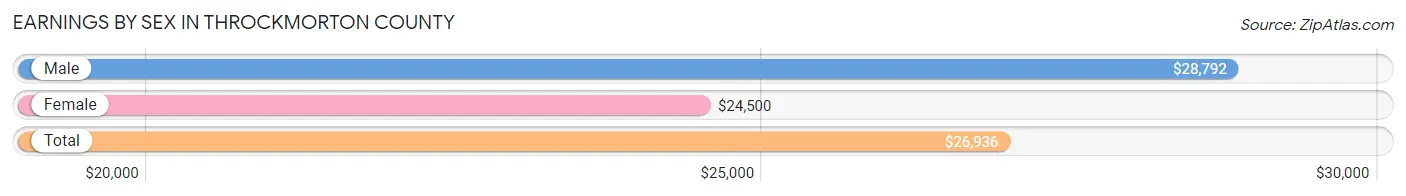
Earnings by Sex in Throckmorton County
Average Earnings in Throckmorton County are $26,936, $28,792 for men and $24,500 for women, a difference of 14.9%.
| Sex | Number | Average Earnings |
| Male | 515 (62.7%) | $28,792 |
| Female | 306 (37.3%) | $24,500 |
| Total | 821 (100.0%) | $26,936 |
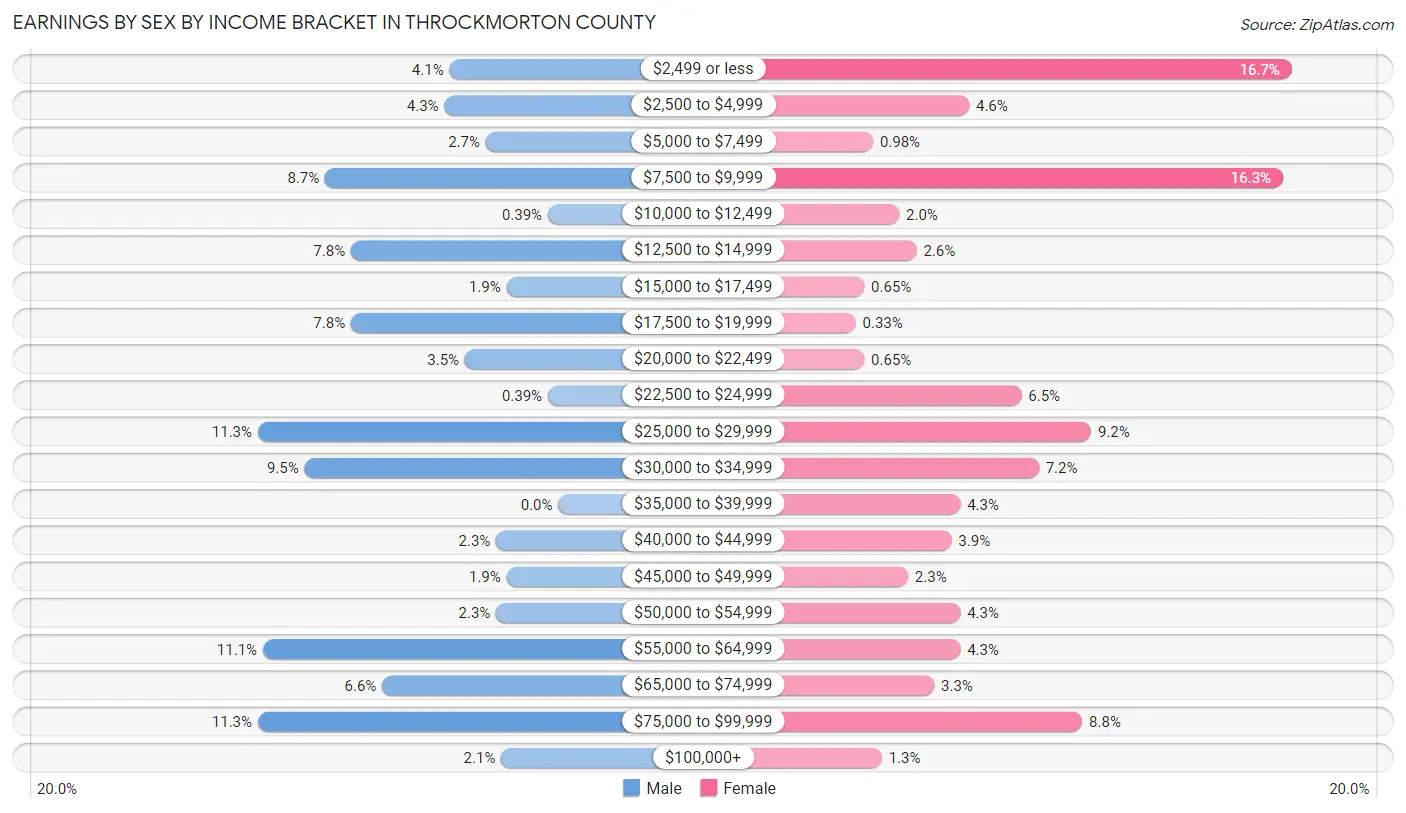
Earnings by Sex by Income Bracket in Throckmorton County
The most common earnings brackets in Throckmorton County are $25,000 to $29,999 for men (58 | 11.3%) and $2,499 or less for women (51 | 16.7%).
| Income | Male | Female |
| $2,499 or less | 21 (4.1%) | 51 (16.7%) |
| $2,500 to $4,999 | 22 (4.3%) | 14 (4.6%) |
| $5,000 to $7,499 | 14 (2.7%) | 3 (1.0%) |
| $7,500 to $9,999 | 45 (8.7%) | 50 (16.3%) |
| $10,000 to $12,499 | 2 (0.4%) | 6 (2.0%) |
| $12,500 to $14,999 | 40 (7.8%) | 8 (2.6%) |
| $15,000 to $17,499 | 10 (1.9%) | 2 (0.6%) |
| $17,500 to $19,999 | 40 (7.8%) | 1 (0.3%) |
| $20,000 to $22,499 | 18 (3.5%) | 2 (0.6%) |
| $22,500 to $24,999 | 2 (0.4%) | 20 (6.5%) |
| $25,000 to $29,999 | 58 (11.3%) | 28 (9.1%) |
| $30,000 to $34,999 | 49 (9.5%) | 22 (7.2%) |
| $35,000 to $39,999 | 0 (0.0%) | 13 (4.3%) |
| $40,000 to $44,999 | 12 (2.3%) | 12 (3.9%) |
| $45,000 to $49,999 | 10 (1.9%) | 7 (2.3%) |
| $50,000 to $54,999 | 12 (2.3%) | 13 (4.3%) |
| $55,000 to $64,999 | 57 (11.1%) | 13 (4.3%) |
| $65,000 to $74,999 | 34 (6.6%) | 10 (3.3%) |
| $75,000 to $99,999 | 58 (11.3%) | 27 (8.8%) |
| $100,000+ | 11 (2.1%) | 4 (1.3%) |
| Total | 515 (100.0%) | 306 (100.0%) |
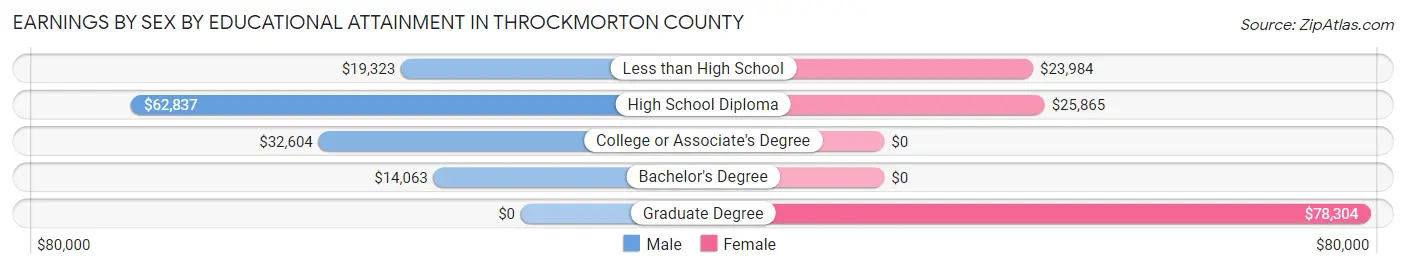
Earnings by Sex by Educational Attainment in Throckmorton County
Average earnings in Throckmorton County are $32,963 for men and $25,357 for women, a difference of 23.1%. Men with an educational attainment of high school diploma enjoy the highest average annual earnings of $62,837, while those with bachelor's degree education earn the least with $14,063. Women with an educational attainment of graduate degree earn the most with the average annual earnings of $78,304, while those with less than high school education have the smallest earnings of $23,984.
| Educational Attainment | Male Income | Female Income |
| Less than High School | $19,323 | $23,984 |
| High School Diploma | $62,837 | $25,865 |
| College or Associate's Degree | $32,604 | $0 |
| Bachelor's Degree | $14,063 | $0 |
| Graduate Degree | - | - |
| Total | $32,963 | $25,357 |
Family Income in Throckmorton County
Family Income Brackets in Throckmorton County
According to the Throckmorton County family income data, there are 87 families falling into the $50,000 to $74,999 income range, which is the most common income bracket and makes up 25.8% of all families. Conversely, the less than $10,000 income bracket is the least frequent group with only 3 families (0.9%) belonging to this category.
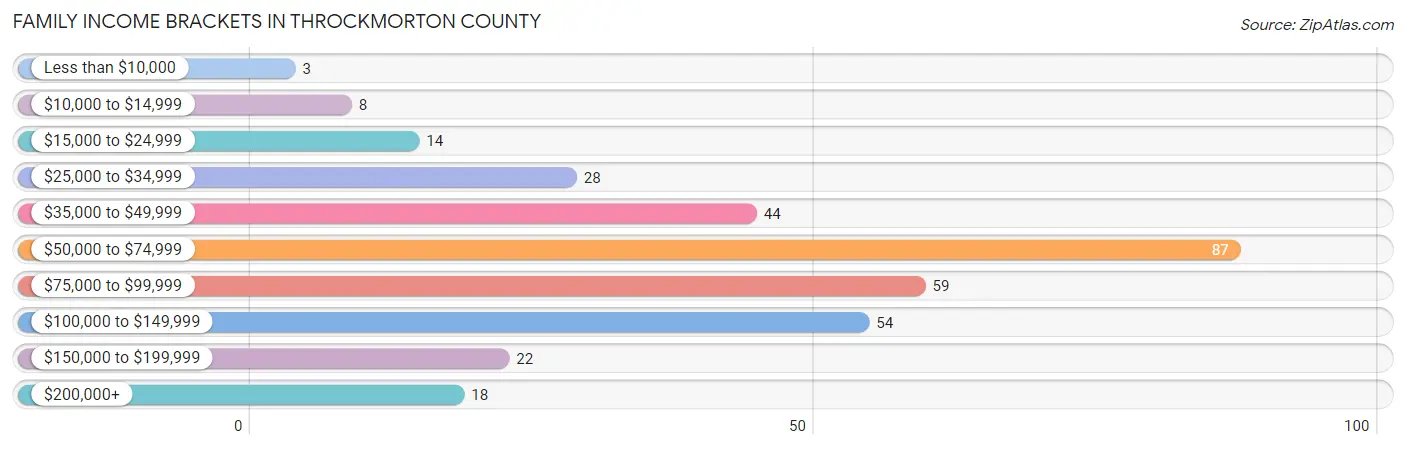
| Income Bracket | # Families | % Families |
| Less than $10,000 | 3 | 0.9% |
| $10,000 to $14,999 | 8 | 2.4% |
| $15,000 to $24,999 | 14 | 4.2% |
| $25,000 to $34,999 | 28 | 8.3% |
| $35,000 to $49,999 | 44 | 13.1% |
| $50,000 to $74,999 | 87 | 25.8% |
| $75,000 to $99,999 | 59 | 17.5% |
| $100,000 to $149,999 | 54 | 16.0% |
| $150,000 to $199,999 | 22 | 6.5% |
| $200,000+ | 18 | 5.3% |
Family Income by Famaliy Size in Throckmorton County
5-person families (19 | 5.6%) account for the highest median family income in Throckmorton County with $85,750 per family, while 2-person families (202 | 59.9%) have the highest median income of $35,000 per family member.
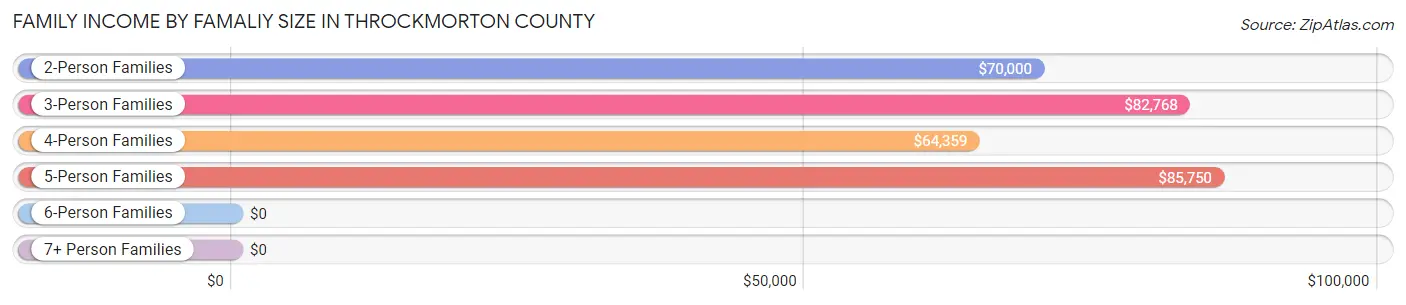
| Income Bracket | # Families | Median Income |
| 2-Person Families | 202 (59.9%) | $70,000 |
| 3-Person Families | 51 (15.1%) | $82,768 |
| 4-Person Families | 58 (17.2%) | $64,359 |
| 5-Person Families | 19 (5.6%) | $85,750 |
| 6-Person Families | 0 (0.0%) | $0 |
| 7+ Person Families | 7 (2.1%) | $0 |
| Total | 337 (100.0%) | $68,125 |
Family Income by Number of Earners in Throckmorton County
The median family income in Throckmorton County is $68,125, with families comprising 3+ earners (42) having the highest median family income of $89,167, while families with no earners (63) have the lowest median family income of $39,338, accounting for 12.5% and 18.7% of families, respectively.
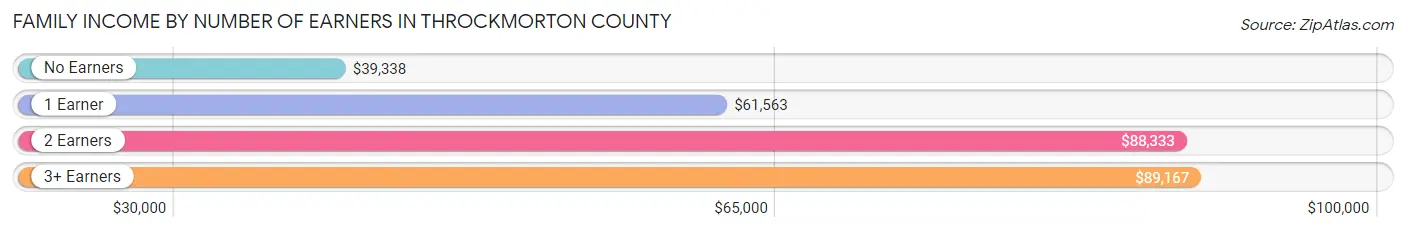
| Number of Earners | # Families | Median Income |
| No Earners | 63 (18.7%) | $39,338 |
| 1 Earner | 100 (29.7%) | $61,563 |
| 2 Earners | 132 (39.2%) | $88,333 |
| 3+ Earners | 42 (12.5%) | $89,167 |
| Total | 337 (100.0%) | $68,125 |
Household Income in Throckmorton County
Household Income Brackets in Throckmorton County
With 144 households falling in the category, the $50,000 to $74,999 income range is the most frequent in Throckmorton County, accounting for 22.7% of all households. In contrast, only 20 households (3.2%) fall into the $200,000+ income bracket, making it the least populous group.
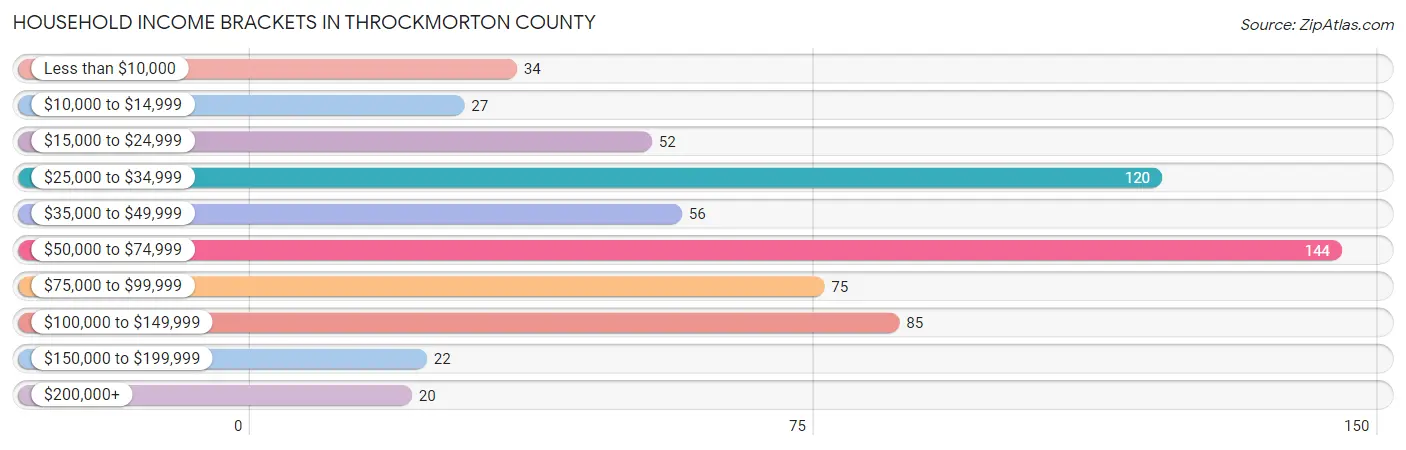
| Income Bracket | # Households | % Households |
| Less than $10,000 | 34 | 5.4% |
| $10,000 to $14,999 | 27 | 4.3% |
| $15,000 to $24,999 | 52 | 8.2% |
| $25,000 to $34,999 | 120 | 18.9% |
| $35,000 to $49,999 | 56 | 8.8% |
| $50,000 to $74,999 | 144 | 22.7% |
| $75,000 to $99,999 | 75 | 11.8% |
| $100,000 to $149,999 | 85 | 13.4% |
| $150,000 to $199,999 | 22 | 3.5% |
| $200,000+ | 20 | 3.1% |
Household Income by Householder Age in Throckmorton County
The median household income in Throckmorton County is $55,221, with the highest median household income of $63,846 found in the 25 to 44 years age bracket for the primary householder. A total of 126 households (19.8%) fall into this category. Meanwhile, the 15 to 24 years age bracket for the primary householder has the lowest median household income of $25,909, with 22 households (3.5%) in this group.
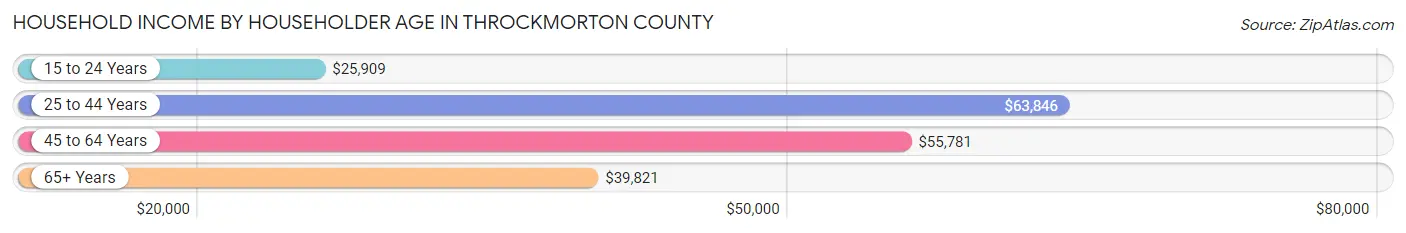
| Income Bracket | # Households | Median Income |
| 15 to 24 Years | 22 (3.5%) | $25,909 |
| 25 to 44 Years | 126 (19.8%) | $63,846 |
| 45 to 64 Years | 238 (37.5%) | $55,781 |
| 65+ Years | 249 (39.2%) | $39,821 |
| Total | 635 (100.0%) | $55,221 |
Poverty in Throckmorton County
Income Below Poverty by Sex and Age in Throckmorton County
With 6.6% poverty level for males and 22.5% for females among the residents of Throckmorton County, 12 to 14 year old males and 12 to 14 year old females are the most vulnerable to poverty, with 10 males (25.6%) and 10 females (100.0%) in their respective age groups living below the poverty level.
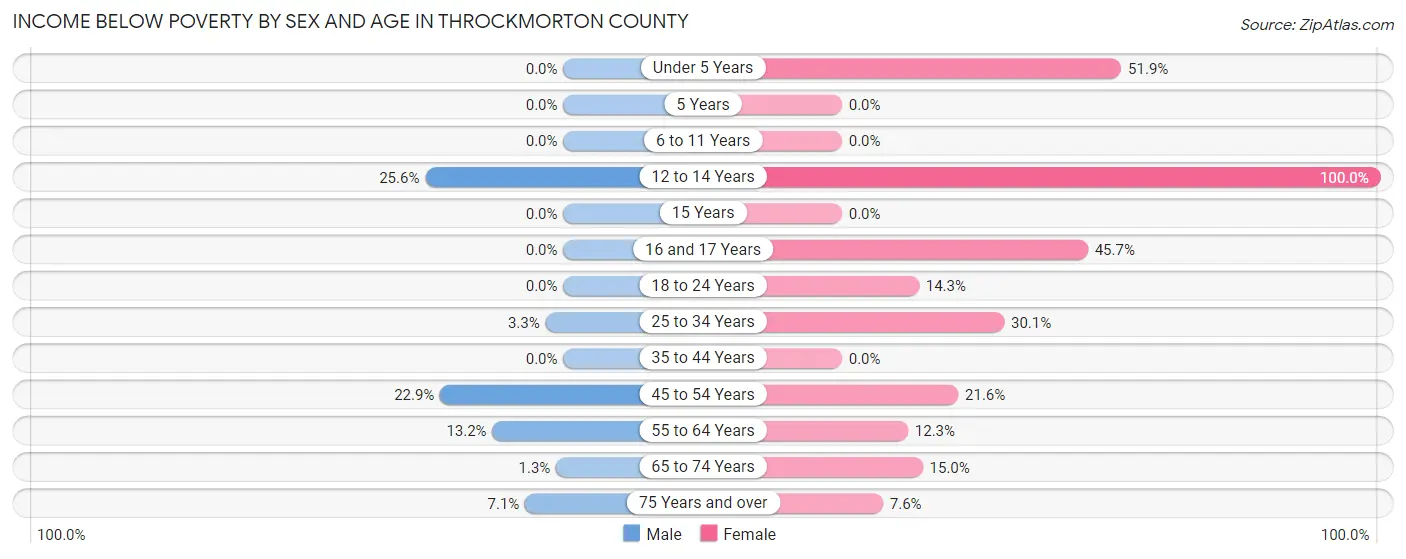
| Age Bracket | Male | Female |
| Under 5 Years | 0 (0.0%) | 42 (51.8%) |
| 5 Years | 0 (0.0%) | 0 (0.0%) |
| 6 to 11 Years | 0 (0.0%) | 0 (0.0%) |
| 12 to 14 Years | 10 (25.6%) | 10 (100.0%) |
| 15 Years | 0 (0.0%) | 0 (0.0%) |
| 16 and 17 Years | 0 (0.0%) | 21 (45.7%) |
| 18 to 24 Years | 0 (0.0%) | 3 (14.3%) |
| 25 to 34 Years | 3 (3.3%) | 25 (30.1%) |
| 35 to 44 Years | 0 (0.0%) | 0 (0.0%) |
| 45 to 54 Years | 8 (22.9%) | 19 (21.6%) |
| 55 to 64 Years | 20 (13.2%) | 13 (12.3%) |
| 65 to 74 Years | 1 (1.3%) | 9 (15.0%) |
| 75 Years and over | 9 (7.1%) | 8 (7.6%) |
| Total | 51 (6.6%) | 150 (22.5%) |
Income Above Poverty by Sex and Age in Throckmorton County
According to the poverty statistics in Throckmorton County, males aged under 5 years and females aged 6 to 11 years are the age groups that are most secure financially, with 100.0% of males and 100.0% of females in these age groups living above the poverty line.
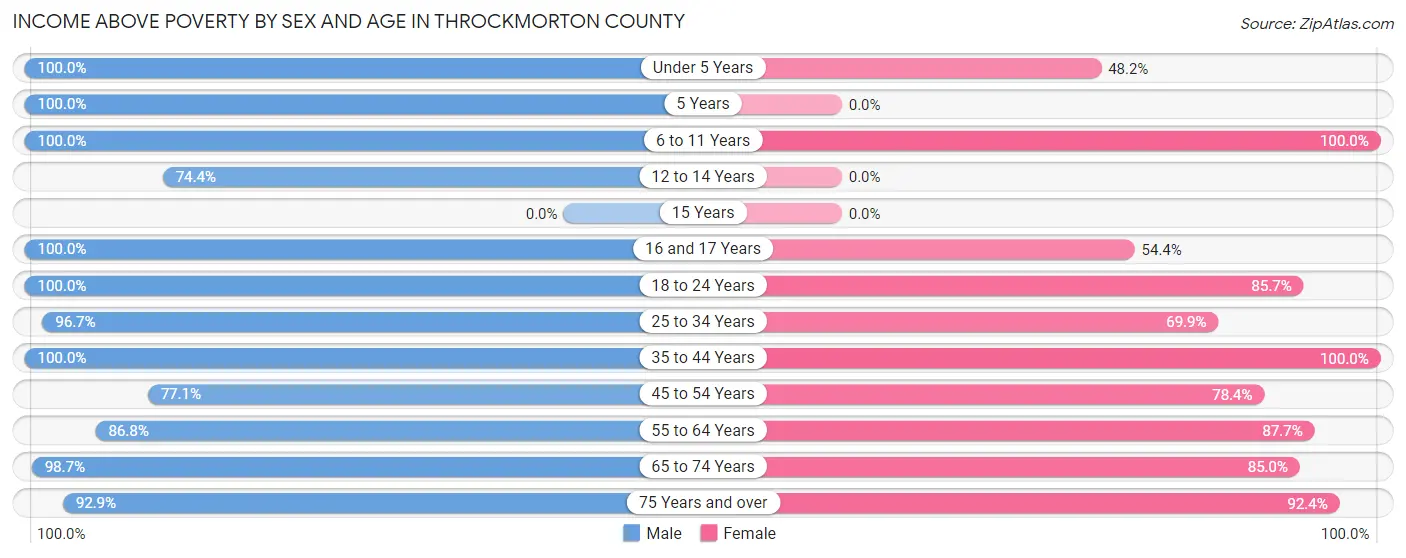
| Age Bracket | Male | Female |
| Under 5 Years | 36 (100.0%) | 39 (48.1%) |
| 5 Years | 6 (100.0%) | 0 (0.0%) |
| 6 to 11 Years | 21 (100.0%) | 16 (100.0%) |
| 12 to 14 Years | 29 (74.4%) | 0 (0.0%) |
| 15 Years | 0 (0.0%) | 0 (0.0%) |
| 16 and 17 Years | 9 (100.0%) | 25 (54.3%) |
| 18 to 24 Years | 90 (100.0%) | 18 (85.7%) |
| 25 to 34 Years | 88 (96.7%) | 58 (69.9%) |
| 35 to 44 Years | 92 (100.0%) | 50 (100.0%) |
| 45 to 54 Years | 27 (77.1%) | 69 (78.4%) |
| 55 to 64 Years | 132 (86.8%) | 93 (87.7%) |
| 65 to 74 Years | 74 (98.7%) | 51 (85.0%) |
| 75 Years and over | 118 (92.9%) | 97 (92.4%) |
| Total | 722 (93.4%) | 516 (77.5%) |
Income Below Poverty Among Married-Couple Families in Throckmorton County
The poverty statistics for married-couple families in Throckmorton County show that 6.9% or 21 of the total 303 families live below the poverty line. Families with 3 or 4 children have the highest poverty rate of 61.5%, comprising of 8 families. On the other hand, families with 1 or 2 children have the lowest poverty rate of 0.0%, which includes 0 families.
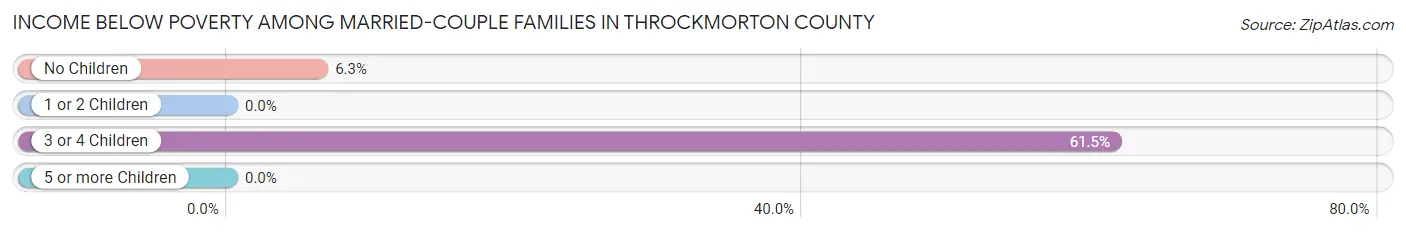
| Children | Above Poverty | Below Poverty |
| No Children | 194 (93.7%) | 13 (6.3%) |
| 1 or 2 Children | 83 (100.0%) | 0 (0.0%) |
| 3 or 4 Children | 5 (38.5%) | 8 (61.5%) |
| 5 or more Children | 0 (0.0%) | 0 (0.0%) |
| Total | 282 (93.1%) | 21 (6.9%) |
Income Below Poverty Among Single-Parent Households in Throckmorton County
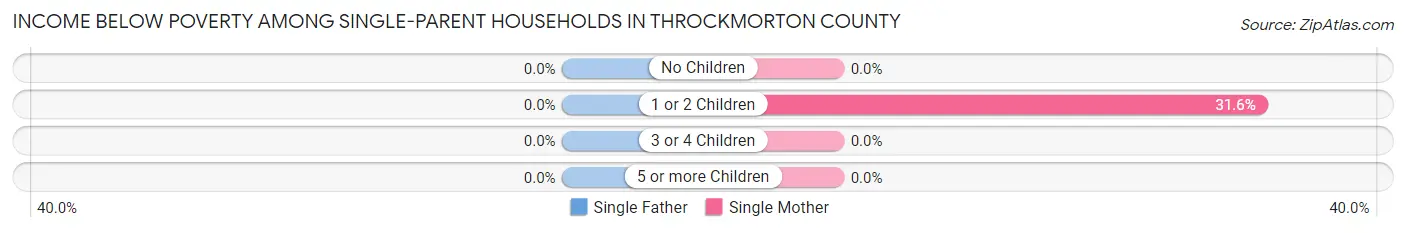
| Children | Single Father | Single Mother |
| No Children | 0 (0.0%) | 0 (0.0%) |
| 1 or 2 Children | 0 (0.0%) | 6 (31.6%) |
| 3 or 4 Children | 0 (0.0%) | 0 (0.0%) |
| 5 or more Children | 0 (0.0%) | 0 (0.0%) |
| Total | 0 (0.0%) | 6 (17.6%) |
Income Below Poverty Among Married-Couple vs Single-Parent Households in Throckmorton County
The poverty data for Throckmorton County shows that 21 of the married-couple family households (6.9%) and 6 of the single-parent households (17.6%) are living below the poverty level. Within the married-couple family households, those with 3 or 4 children have the highest poverty rate, with 8 households (61.5%) falling below the poverty line. Among the single-parent households, those with 1 or 2 children have the highest poverty rate, with 6 household (31.6%) living below poverty.
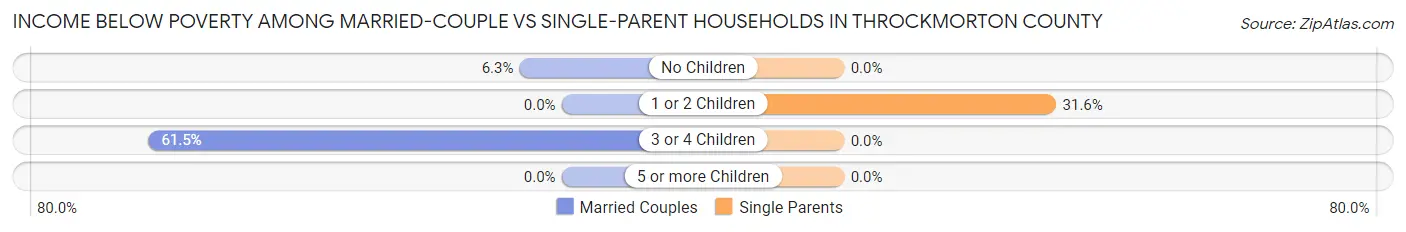
| Children | Married-Couple Families | Single-Parent Households |
| No Children | 13 (6.3%) | 0 (0.0%) |
| 1 or 2 Children | 0 (0.0%) | 6 (31.6%) |
| 3 or 4 Children | 8 (61.5%) | 0 (0.0%) |
| 5 or more Children | 0 (0.0%) | 0 (0.0%) |
| Total | 21 (6.9%) | 6 (17.6%) |
Race in Throckmorton County
The most populous races in Throckmorton County are White / Caucasian (1,330 | 92.4%), Hispanic or Latino (186 | 12.9%), and Two or more Races (89 | 6.2%).
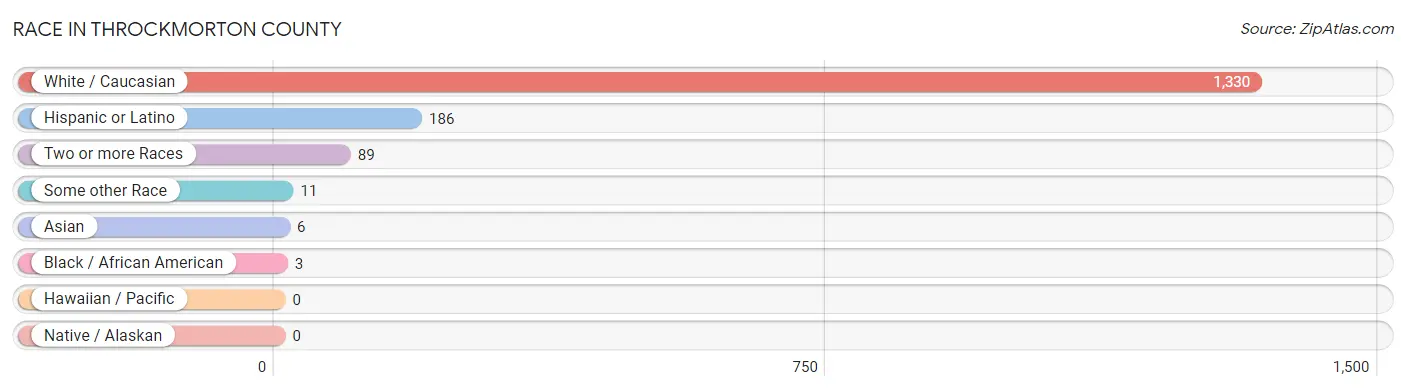
| Race | # Population | % Population |
| Asian | 6 | 0.4% |
| Black / African American | 3 | 0.2% |
| Hawaiian / Pacific | 0 | 0.0% |
| Hispanic or Latino | 186 | 12.9% |
| Native / Alaskan | 0 | 0.0% |
| White / Caucasian | 1,330 | 92.4% |
| Two or more Races | 89 | 6.2% |
| Some other Race | 11 | 0.8% |
| Total | 1,439 | 100.0% |
Ancestry in Throckmorton County
The most populous ancestries reported in Throckmorton County are Irish (246 | 17.1%), German (214 | 14.9%), English (189 | 13.1%), Mexican (141 | 9.8%), and Central American (42 | 2.9%), together accounting for 57.8% of all Throckmorton County residents.
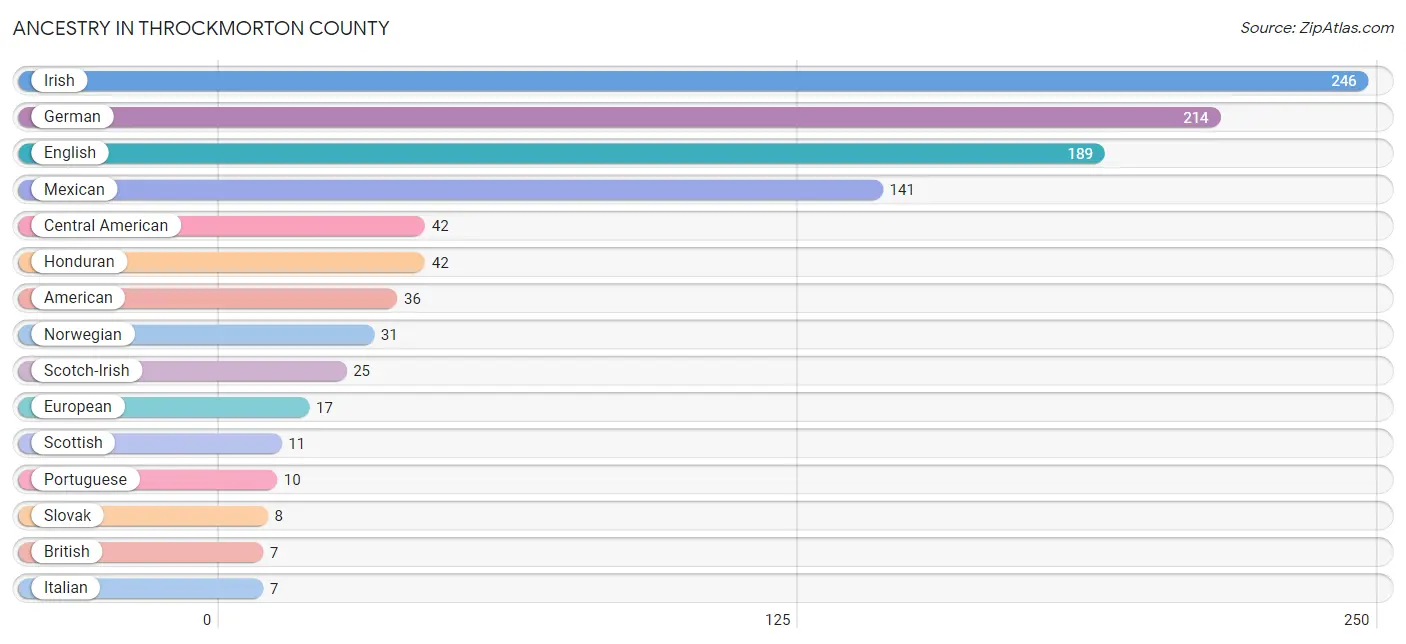
| Ancestry | # Population | % Population |
| American | 36 | 2.5% |
| British | 7 | 0.5% |
| Central American | 42 | 2.9% |
| Cherokee | 3 | 0.2% |
| Choctaw | 4 | 0.3% |
| Czech | 5 | 0.4% |
| Dutch | 6 | 0.4% |
| Dutch West Indian | 4 | 0.3% |
| English | 189 | 13.1% |
| European | 17 | 1.2% |
| French | 5 | 0.4% |
| German | 214 | 14.9% |
| Honduran | 42 | 2.9% |
| Hungarian | 2 | 0.1% |
| Irish | 246 | 17.1% |
| Italian | 7 | 0.5% |
| Korean | 6 | 0.4% |
| Mexican | 141 | 9.8% |
| Norwegian | 31 | 2.1% |
| Portuguese | 10 | 0.7% |
| Scotch-Irish | 25 | 1.7% |
| Scottish | 11 | 0.8% |
| Slovak | 8 | 0.6% |
| Spanish | 3 | 0.2% |
| Swedish | 3 | 0.2% |
| Tohono O'Odham | 3 | 0.2% | View All 26 Rows |
Immigrants in Throckmorton County
The most numerous immigrant groups reported in Throckmorton County came from Central America (24 | 1.7%), Latin America (24 | 1.7%), Mexico (24 | 1.7%), Czechoslovakia (8 | 0.6%), and Eastern Europe (8 | 0.6%), together accounting for 6.1% of all Throckmorton County residents.
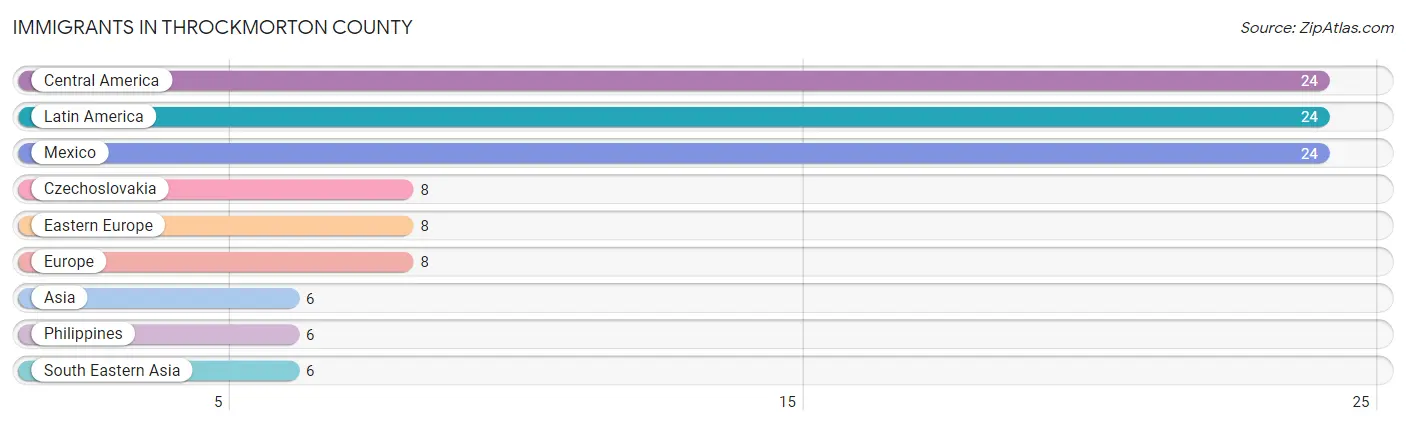
| Immigration Origin | # Population | % Population |
| Asia | 6 | 0.4% |
| Central America | 24 | 1.7% |
| Czechoslovakia | 8 | 0.6% |
| Eastern Europe | 8 | 0.6% |
| Europe | 8 | 0.6% |
| Latin America | 24 | 1.7% |
| Mexico | 24 | 1.7% |
| Philippines | 6 | 0.4% |
| South Eastern Asia | 6 | 0.4% | View All 9 Rows |
Sex and Age in Throckmorton County
Sex and Age in Throckmorton County
The most populous age groups in Throckmorton County are 75 to 79 Years (93 | 12.0%) for men and Under 5 Years (81 | 12.2%) for women.
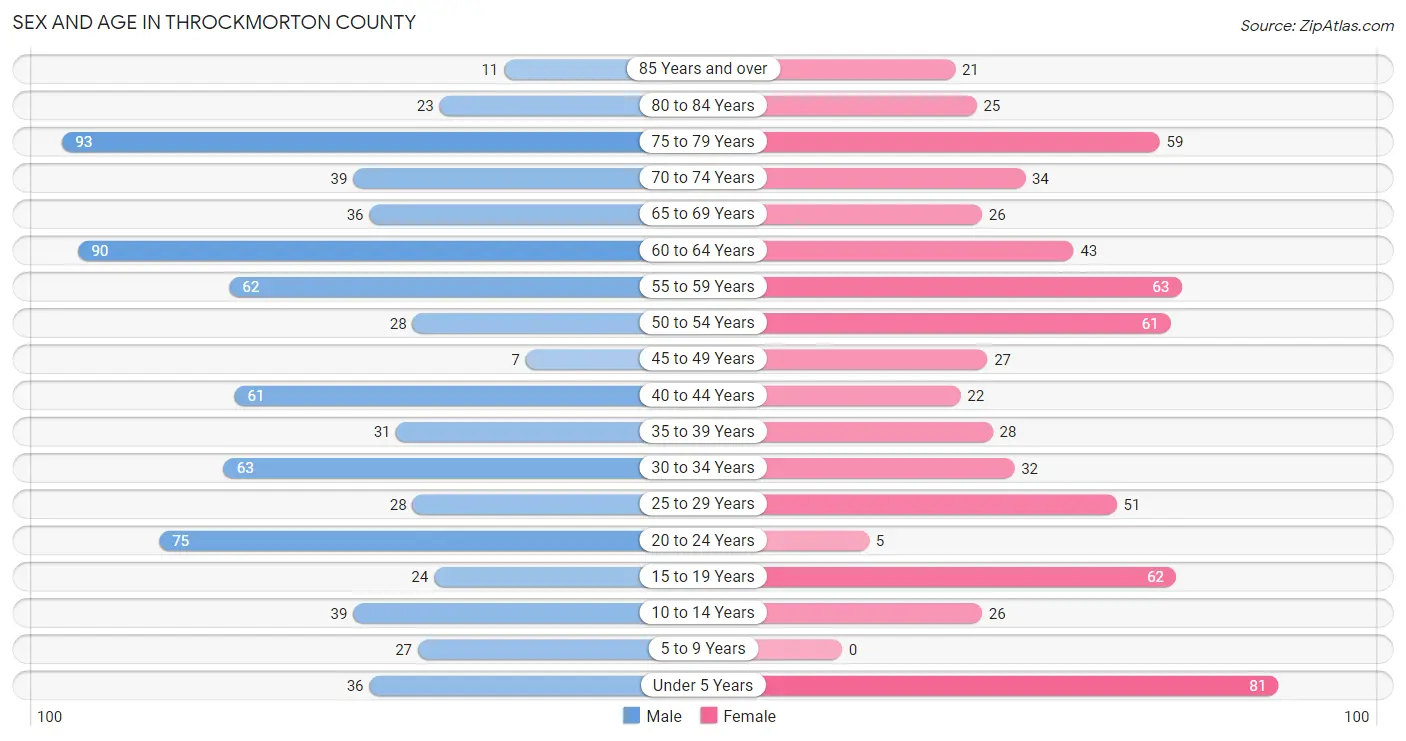
| Age Bracket | Male | Female |
| Under 5 Years | 36 (4.7%) | 81 (12.2%) |
| 5 to 9 Years | 27 (3.5%) | 0 (0.0%) |
| 10 to 14 Years | 39 (5.1%) | 26 (3.9%) |
| 15 to 19 Years | 24 (3.1%) | 62 (9.3%) |
| 20 to 24 Years | 75 (9.7%) | 5 (0.7%) |
| 25 to 29 Years | 28 (3.6%) | 51 (7.7%) |
| 30 to 34 Years | 63 (8.2%) | 32 (4.8%) |
| 35 to 39 Years | 31 (4.0%) | 28 (4.2%) |
| 40 to 44 Years | 61 (7.9%) | 22 (3.3%) |
| 45 to 49 Years | 7 (0.9%) | 27 (4.1%) |
| 50 to 54 Years | 28 (3.6%) | 61 (9.2%) |
| 55 to 59 Years | 62 (8.0%) | 63 (9.5%) |
| 60 to 64 Years | 90 (11.6%) | 43 (6.5%) |
| 65 to 69 Years | 36 (4.7%) | 26 (3.9%) |
| 70 to 74 Years | 39 (5.1%) | 34 (5.1%) |
| 75 to 79 Years | 93 (12.0%) | 59 (8.9%) |
| 80 to 84 Years | 23 (3.0%) | 25 (3.7%) |
| 85 Years and over | 11 (1.4%) | 21 (3.2%) |
| Total | 773 (100.0%) | 666 (100.0%) |
Families and Households in Throckmorton County
Median Family Size in Throckmorton County

| Family Type | # Families | Family Size |
| Married-Couple | 303 (89.9%) | 2.84 |
| Single Male/Father | 0 (0.0%) | - |
| Single Female/Mother | 34 (10.1%) | 6.03 |
| Total Families | 337 (100.0%) | 3.16 |
Median Household Size in Throckmorton County
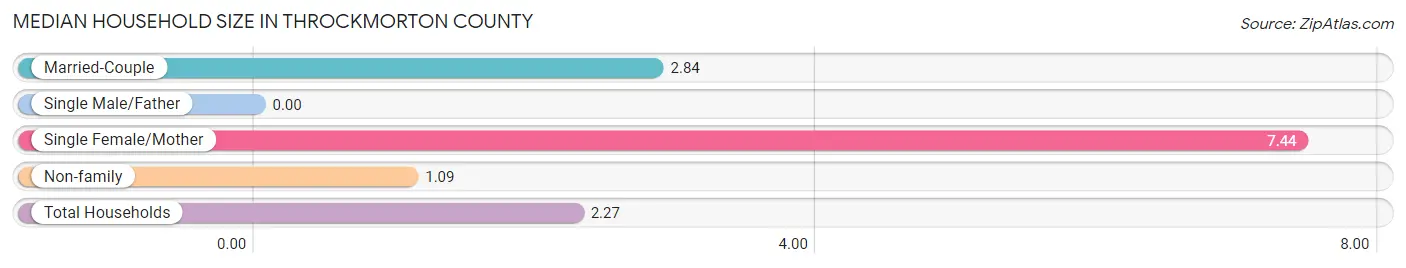
| Household Type | # Households | Household Size |
| Married-Couple | 303 (47.7%) | 2.84 |
| Single Male/Father | 0 (0.0%) | - |
| Single Female/Mother | 34 (5.3%) | 7.44 |
| Non-family | 298 (46.9%) | 1.09 |
| Total Households | 635 (100.0%) | 2.27 |
Household Size by Marriage Status in Throckmorton County
Out of a total of 635 households in Throckmorton County, 337 (53.1%) are family households, while 298 (46.9%) are nonfamily households. The most numerous type of family households are 2-person households, comprising 196, and the most common type of nonfamily households are 1-person households, comprising 269.
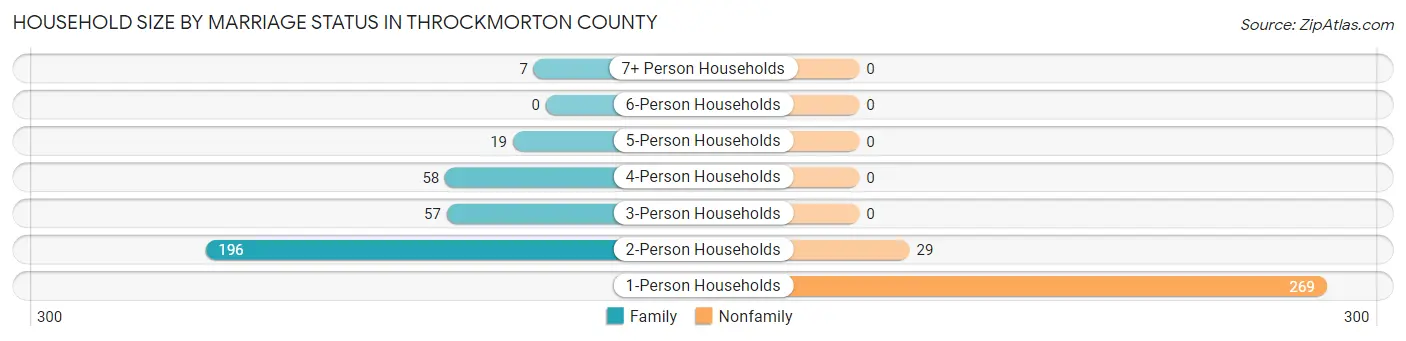
| Household Size | Family Households | Nonfamily Households |
| 1-Person Households | - | 269 (42.4%) |
| 2-Person Households | 196 (30.9%) | 29 (4.6%) |
| 3-Person Households | 57 (9.0%) | 0 (0.0%) |
| 4-Person Households | 58 (9.1%) | 0 (0.0%) |
| 5-Person Households | 19 (3.0%) | 0 (0.0%) |
| 6-Person Households | 0 (0.0%) | 0 (0.0%) |
| 7+ Person Households | 7 (1.1%) | 0 (0.0%) |
| Total | 337 (53.1%) | 298 (46.9%) |
Female Fertility in Throckmorton County
Fertility by Age in Throckmorton County
Average fertility rate in Throckmorton County is 83.0 births per 1,000 women. Women in the age bracket of 20 to 34 years have the highest fertility rate with 227.0 births per 1,000 women. Women in the age bracket of 20 to 34 years acount for 100.0% of all women with births.
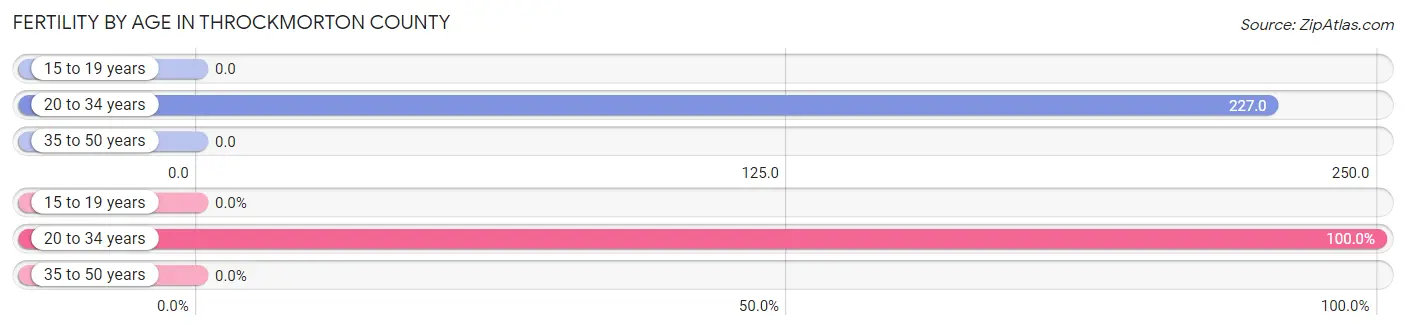
| Age Bracket | Women with Births | Births / 1,000 Women |
| 15 to 19 years | 0 (0.0%) | 0.0 |
| 20 to 34 years | 20 (100.0%) | 227.0 |
| 35 to 50 years | 0 (0.0%) | 0.0 |
| Total | 20 (100.0%) | 83.0 |
Fertility by Age by Marriage Status in Throckmorton County
90.0% of women with births (20) in Throckmorton County are married. The highest percentage of unmarried women with births falls into 20 to 34 years age bracket with 10.0% of them unmarried at the time of birth, while the lowest percentage of unmarried women with births belong to 20 to 34 years age bracket with 10.0% of them unmarried.
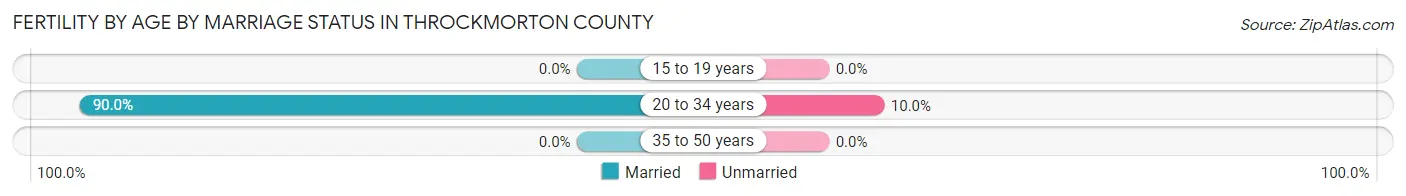
| Age Bracket | Married | Unmarried |
| 15 to 19 years | 0 (0.0%) | 0 (0.0%) |
| 20 to 34 years | 18 (90.0%) | 2 (10.0%) |
| 35 to 50 years | 0 (0.0%) | 0 (0.0%) |
| Total | 18 (90.0%) | 2 (10.0%) |
Fertility by Education in Throckmorton County
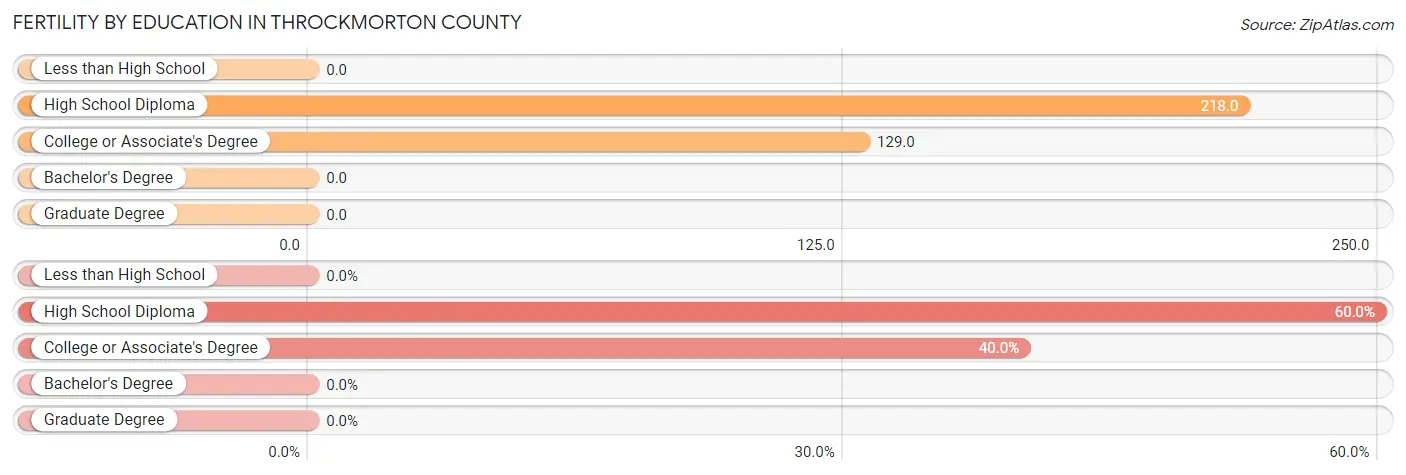
| Educational Attainment | Women with Births | Births / 1,000 Women |
| Less than High School | 0 (0.0%) | 0.0 |
| High School Diploma | 12 (60.0%) | 218.0 |
| College or Associate's Degree | 8 (40.0%) | 129.0 |
| Bachelor's Degree | 0 (0.0%) | 0.0 |
| Graduate Degree | 0 (0.0%) | 0.0 |
| Total | 20 (100.0%) | 83.0 |
Fertility by Education by Marriage Status in Throckmorton County
10.0% of women with births in Throckmorton County are unmarried. Women with the educational attainment of high school diploma are most likely to be married with 100.0% of them married at childbirth, while women with the educational attainment of college or associate's degree are least likely to be married with 25.0% of them unmarried at childbirth.
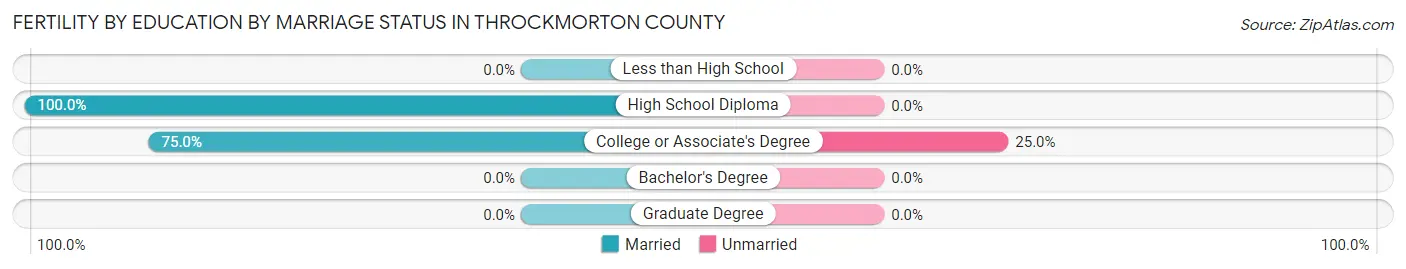
| Educational Attainment | Married | Unmarried |
| Less than High School | 0 (0.0%) | 0 (0.0%) |
| High School Diploma | 12 (100.0%) | 0 (0.0%) |
| College or Associate's Degree | 6 (75.0%) | 2 (25.0%) |
| Bachelor's Degree | 0 (0.0%) | 0 (0.0%) |
| Graduate Degree | 0 (0.0%) | 0 (0.0%) |
| Total | 18 (90.0%) | 2 (10.0%) |
Employment Characteristics in Throckmorton County
Employment by Class of Employer in Throckmorton County
Among the 717 employed individuals in Throckmorton County, private company employees (343 | 47.8%), self-employed (not incorporated) (136 | 19.0%), and local government employees (90 | 12.6%) make up the most common classes of employment.
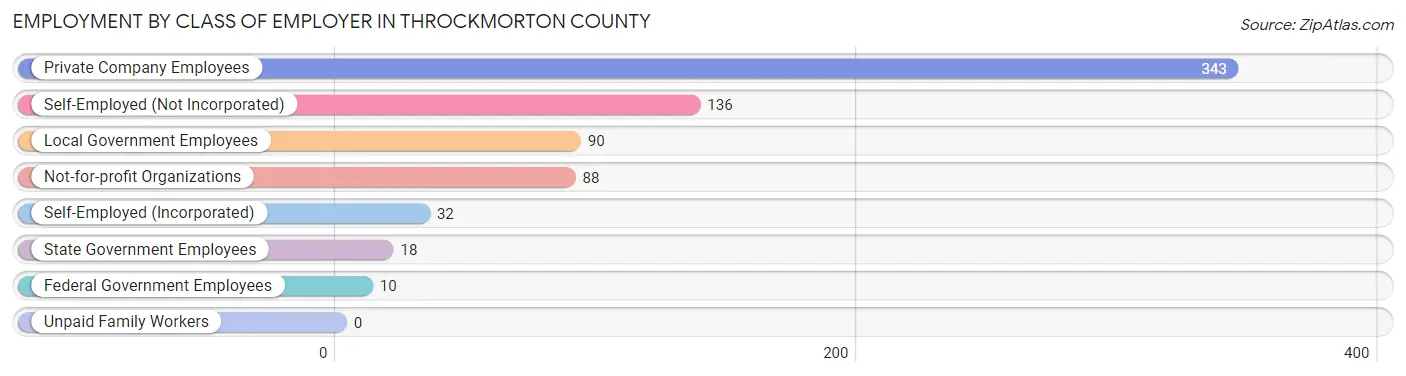
| Employer Class | # Employees | % Employees |
| Private Company Employees | 343 | 47.8% |
| Self-Employed (Incorporated) | 32 | 4.5% |
| Self-Employed (Not Incorporated) | 136 | 19.0% |
| Not-for-profit Organizations | 88 | 12.3% |
| Local Government Employees | 90 | 12.6% |
| State Government Employees | 18 | 2.5% |
| Federal Government Employees | 10 | 1.4% |
| Unpaid Family Workers | 0 | 0.0% |
| Total | 717 | 100.0% |
Employment Status by Age in Throckmorton County
According to the labor force statistics for Throckmorton County, out of the total population over 16 years of age (1,230), 61.2% or 753 individuals are in the labor force, with 2.5% or 19 of them unemployed. The age group with the highest labor force participation rate is 30 to 34 years, with 100.0% or 95 individuals in the labor force. Within the labor force, the 60 to 64 years age range has the highest percentage of unemployed individuals, with 20.0% or 19 of them being unemployed.
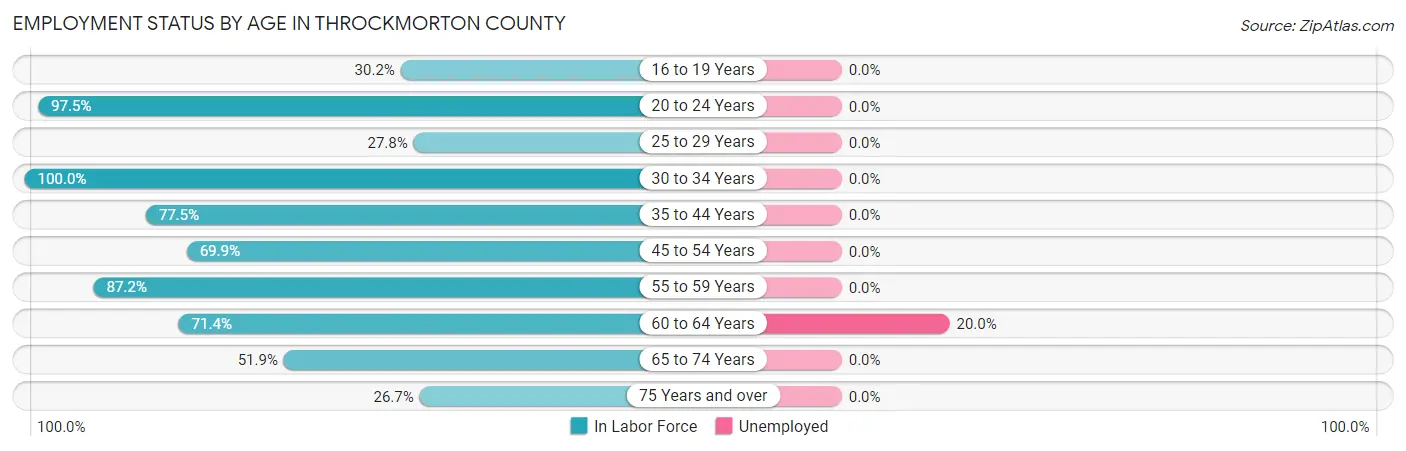
| Age Bracket | In Labor Force | Unemployed |
| 16 to 19 Years | 26 (30.2%) | 0 (0.0%) |
| 20 to 24 Years | 78 (97.5%) | 0 (0.0%) |
| 25 to 29 Years | 22 (27.8%) | 0 (0.0%) |
| 30 to 34 Years | 95 (100.0%) | 0 (0.0%) |
| 35 to 44 Years | 110 (77.5%) | 0 (0.0%) |
| 45 to 54 Years | 86 (69.9%) | 0 (0.0%) |
| 55 to 59 Years | 109 (87.2%) | 0 (0.0%) |
| 60 to 64 Years | 95 (71.4%) | 19 (20.0%) |
| 65 to 74 Years | 70 (51.9%) | 0 (0.0%) |
| 75 Years and over | 62 (26.7%) | 0 (0.0%) |
| Total | 753 (61.2%) | 19 (2.5%) |
Employment Status by Educational Attainment in Throckmorton County
According to labor force statistics for Throckmorton County, 74.2% of individuals (517) out of the total population between 25 and 64 years of age (697) are in the labor force, with 3.7% or 19 of them being unemployed. The group with the highest labor force participation rate are those with the educational attainment of bachelor's degree or higher, with 91.6% or 152 individuals in the labor force. Within the labor force, individuals with college / associate degree education have the highest percentage of unemployment, with 14.6% or 19 of them being unemployed.
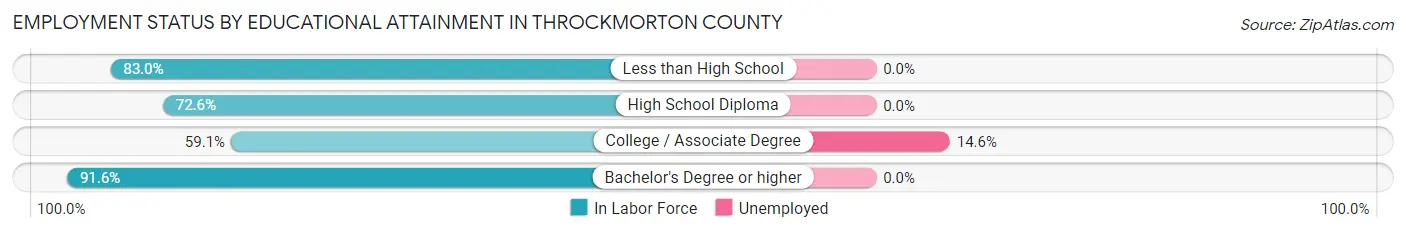
| Educational Attainment | In Labor Force | Unemployed |
| Less than High School | 73 (83.0%) | 0 (0.0%) |
| High School Diploma | 162 (72.6%) | 0 (0.0%) |
| College / Associate Degree | 130 (59.1%) | 32 (14.6%) |
| Bachelor's Degree or higher | 152 (91.6%) | 0 (0.0%) |
| Total | 517 (74.2%) | 26 (3.7%) |
Employment Occupations by Sex in Throckmorton County
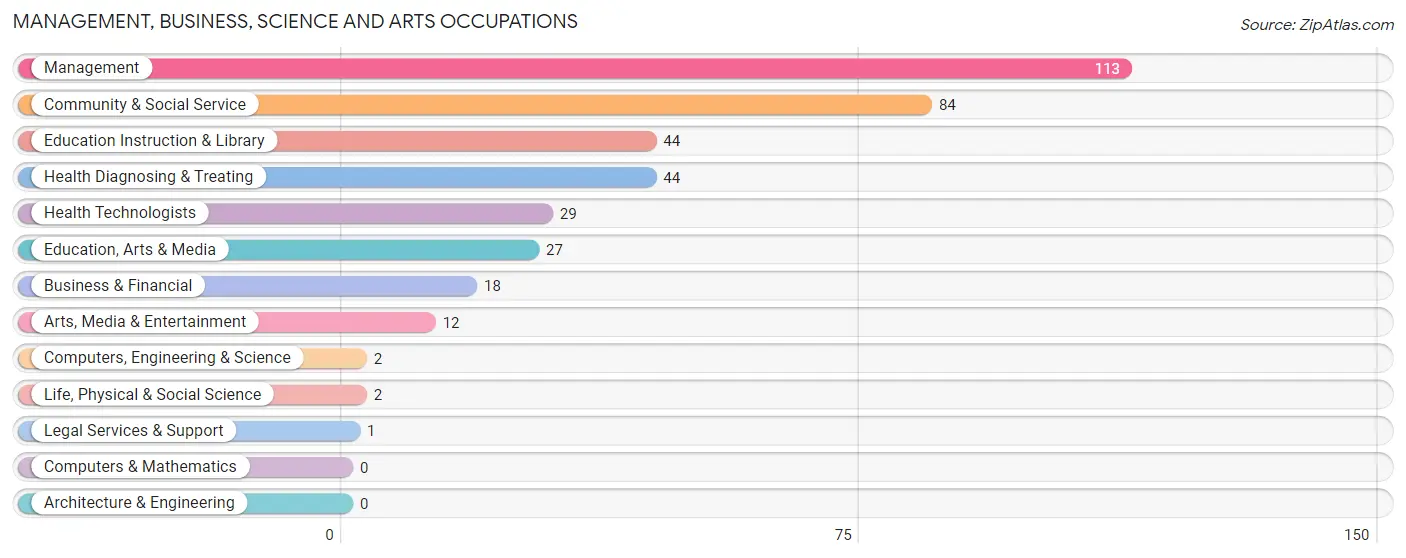
Management, Business, Science and Arts Occupations
The most common Management, Business, Science and Arts occupations in Throckmorton County are Management (113 | 15.4%), Community & Social Service (84 | 11.4%), Education Instruction & Library (44 | 6.0%), Health Diagnosing & Treating (44 | 6.0%), and Health Technologists (29 | 4.0%).
Management, Business, Science and Arts Occupations by Sex
Within the Management, Business, Science and Arts occupations in Throckmorton County, the most male-oriented occupations are Education, Arts & Media (92.6%), Education Instruction & Library (68.2%), and Community & Social Service (67.9%), while the most female-oriented occupations are Business & Financial (100.0%), Computers, Engineering & Science (100.0%), and Life, Physical & Social Science (100.0%).
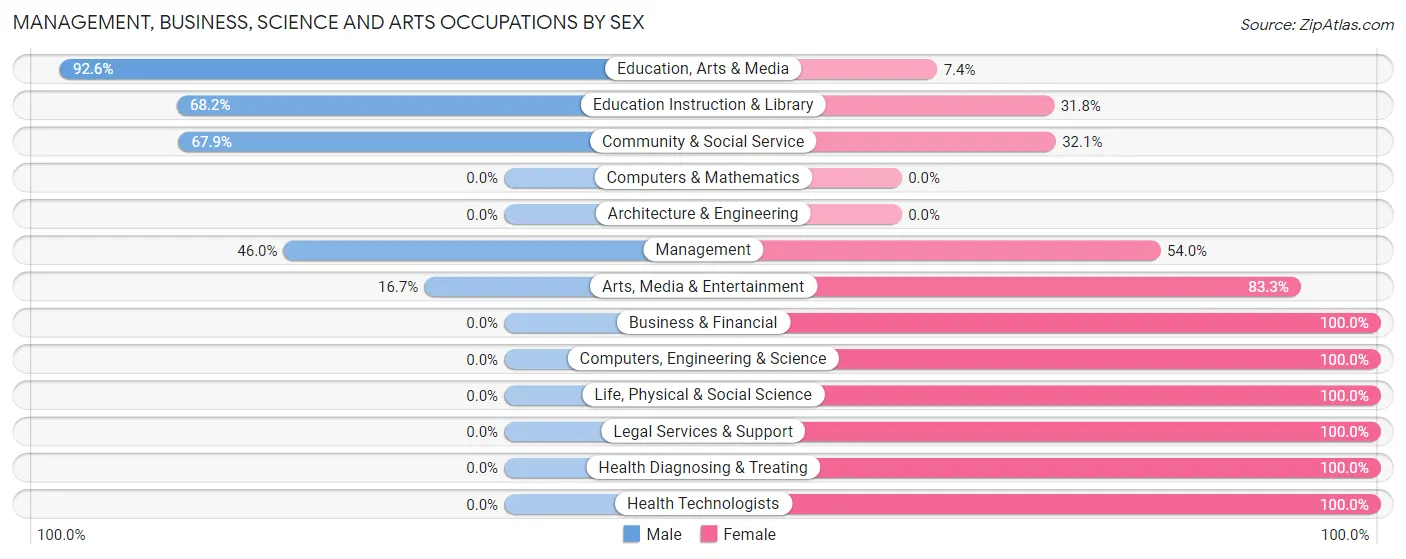
| Occupation | Male | Female |
| Management | 52 (46.0%) | 61 (54.0%) |
| Business & Financial | 0 (0.0%) | 18 (100.0%) |
| Computers, Engineering & Science | 0 (0.0%) | 2 (100.0%) |
| Computers & Mathematics | 0 (0.0%) | 0 (0.0%) |
| Architecture & Engineering | 0 (0.0%) | 0 (0.0%) |
| Life, Physical & Social Science | 0 (0.0%) | 2 (100.0%) |
| Community & Social Service | 57 (67.9%) | 27 (32.1%) |
| Education, Arts & Media | 25 (92.6%) | 2 (7.4%) |
| Legal Services & Support | 0 (0.0%) | 1 (100.0%) |
| Education Instruction & Library | 30 (68.2%) | 14 (31.8%) |
| Arts, Media & Entertainment | 2 (16.7%) | 10 (83.3%) |
| Health Diagnosing & Treating | 0 (0.0%) | 44 (100.0%) |
| Health Technologists | 0 (0.0%) | 29 (100.0%) |
| Total (Category) | 109 (41.8%) | 152 (58.2%) |
| Total (Overall) | 485 (66.1%) | 249 (33.9%) |
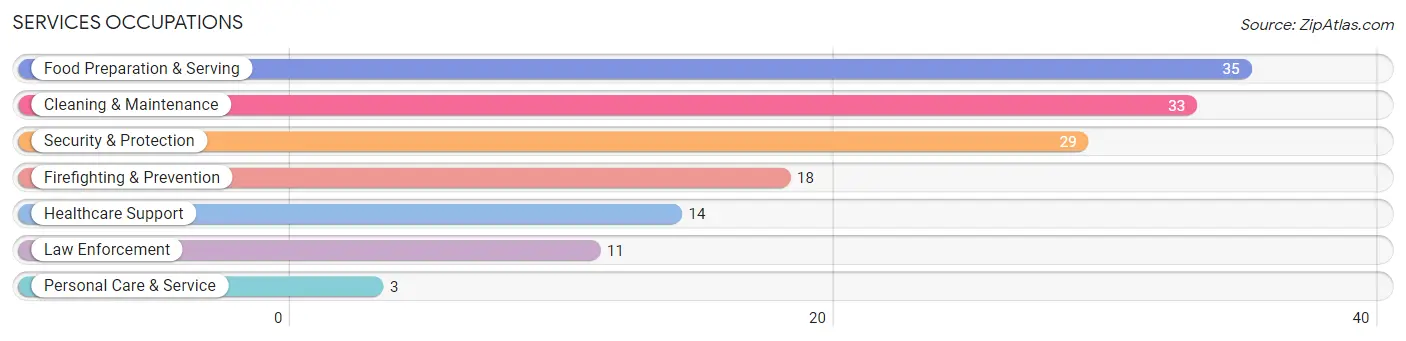
Services Occupations
The most common Services occupations in Throckmorton County are Food Preparation & Serving (35 | 4.8%), Cleaning & Maintenance (33 | 4.5%), Security & Protection (29 | 4.0%), Firefighting & Prevention (18 | 2.5%), and Healthcare Support (14 | 1.9%).
Services Occupations by Sex
Within the Services occupations in Throckmorton County, the most male-oriented occupations are Healthcare Support (100.0%), Law Enforcement (100.0%), and Cleaning & Maintenance (72.7%), while the most female-oriented occupations are Personal Care & Service (100.0%), Food Preparation & Serving (74.3%), and Firefighting & Prevention (50.0%).
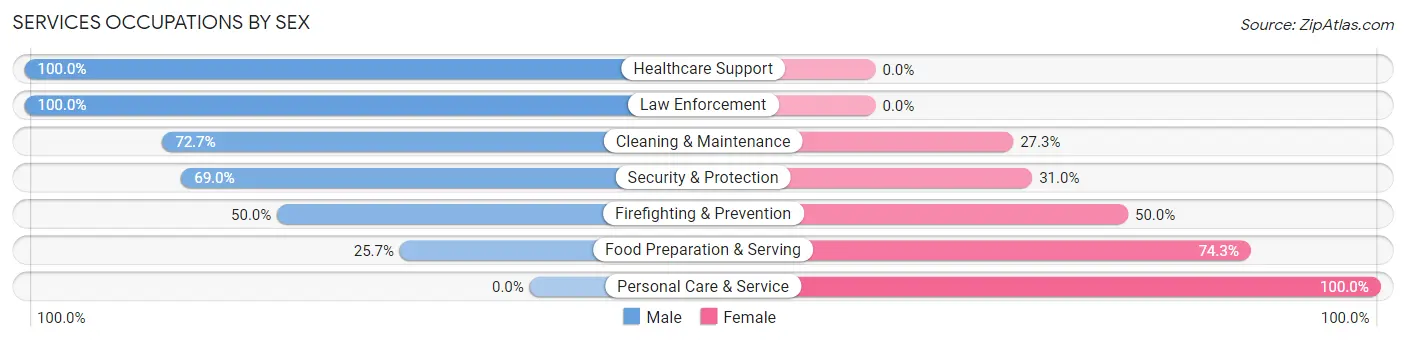
| Occupation | Male | Female |
| Healthcare Support | 14 (100.0%) | 0 (0.0%) |
| Security & Protection | 20 (69.0%) | 9 (31.0%) |
| Firefighting & Prevention | 9 (50.0%) | 9 (50.0%) |
| Law Enforcement | 11 (100.0%) | 0 (0.0%) |
| Food Preparation & Serving | 9 (25.7%) | 26 (74.3%) |
| Cleaning & Maintenance | 24 (72.7%) | 9 (27.3%) |
| Personal Care & Service | 0 (0.0%) | 3 (100.0%) |
| Total (Category) | 67 (58.8%) | 47 (41.2%) |
| Total (Overall) | 485 (66.1%) | 249 (33.9%) |
Sales and Office Occupations
The most common Sales and Office occupations in Throckmorton County are Sales & Related (70 | 9.5%), and Office & Administration (62 | 8.5%).
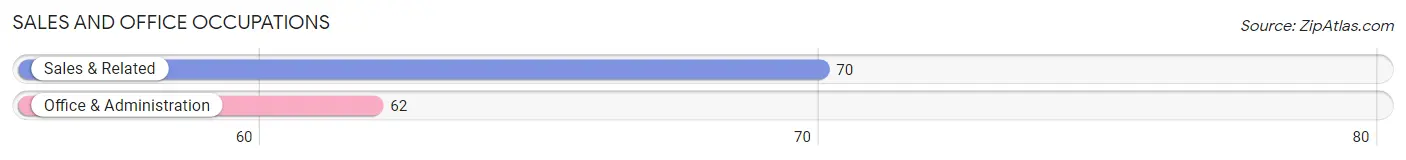
Sales and Office Occupations by Sex
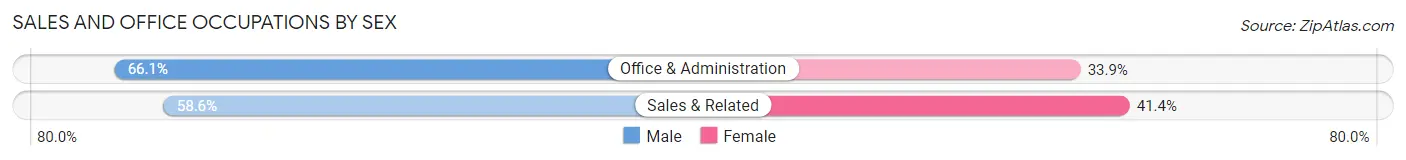
| Occupation | Male | Female |
| Sales & Related | 41 (58.6%) | 29 (41.4%) |
| Office & Administration | 41 (66.1%) | 21 (33.9%) |
| Total (Category) | 82 (62.1%) | 50 (37.9%) |
| Total (Overall) | 485 (66.1%) | 249 (33.9%) |
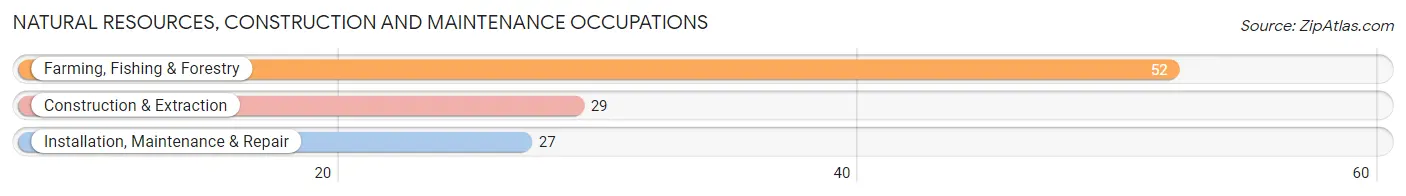
Natural Resources, Construction and Maintenance Occupations
The most common Natural Resources, Construction and Maintenance occupations in Throckmorton County are Farming, Fishing & Forestry (52 | 7.1%), Construction & Extraction (29 | 4.0%), and Installation, Maintenance & Repair (27 | 3.7%).
Natural Resources, Construction and Maintenance Occupations by Sex
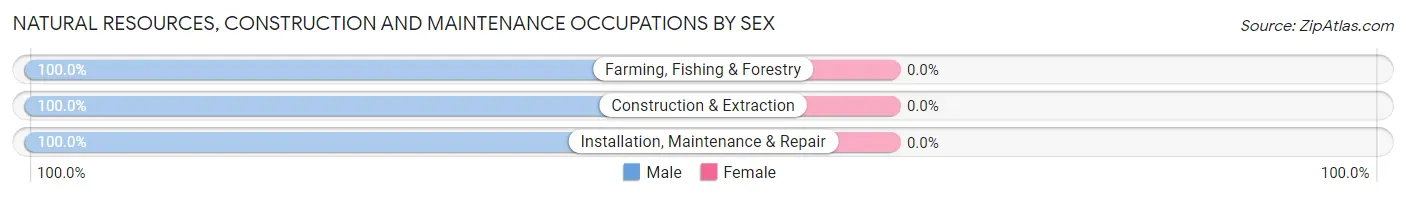
| Occupation | Male | Female |
| Farming, Fishing & Forestry | 52 (100.0%) | 0 (0.0%) |
| Construction & Extraction | 29 (100.0%) | 0 (0.0%) |
| Installation, Maintenance & Repair | 27 (100.0%) | 0 (0.0%) |
| Total (Category) | 108 (100.0%) | 0 (0.0%) |
| Total (Overall) | 485 (66.1%) | 249 (33.9%) |
Production, Transportation and Moving Occupations
The most common Production, Transportation and Moving occupations in Throckmorton County are Material Moving (64 | 8.7%), Production (40 | 5.4%), and Transportation (15 | 2.0%).
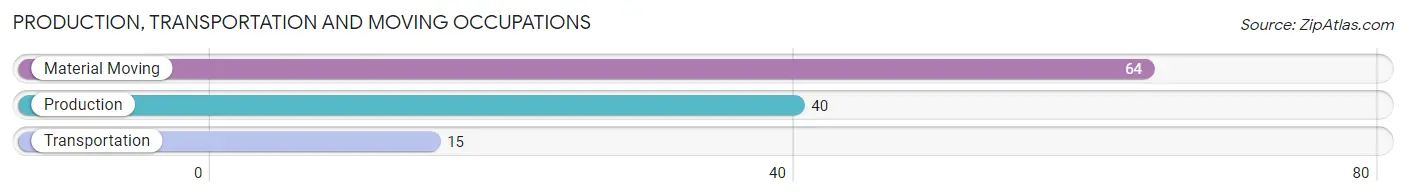
Production, Transportation and Moving Occupations by Sex
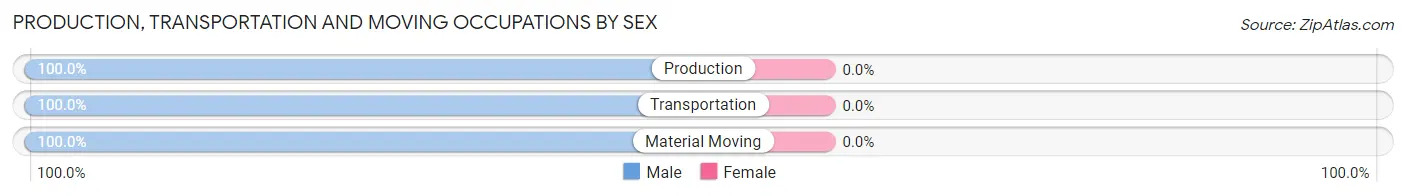
| Occupation | Male | Female |
| Production | 40 (100.0%) | 0 (0.0%) |
| Transportation | 15 (100.0%) | 0 (0.0%) |
| Material Moving | 64 (100.0%) | 0 (0.0%) |
| Total (Category) | 119 (100.0%) | 0 (0.0%) |
| Total (Overall) | 485 (66.1%) | 249 (33.9%) |
Employment Industries by Sex in Throckmorton County
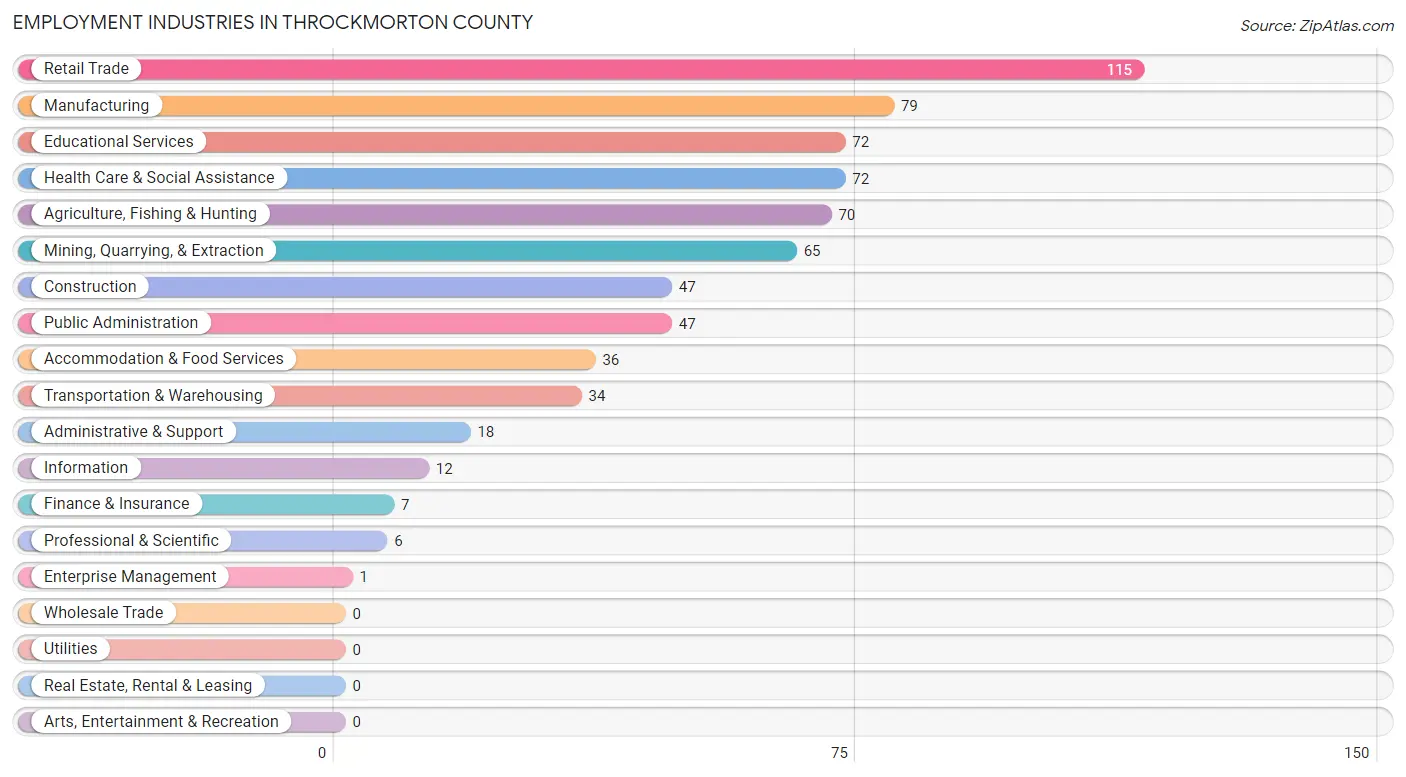
Employment Industries in Throckmorton County
The major employment industries in Throckmorton County include Retail Trade (115 | 15.7%), Manufacturing (79 | 10.8%), Educational Services (72 | 9.8%), Health Care & Social Assistance (72 | 9.8%), and Agriculture, Fishing & Hunting (70 | 9.5%).
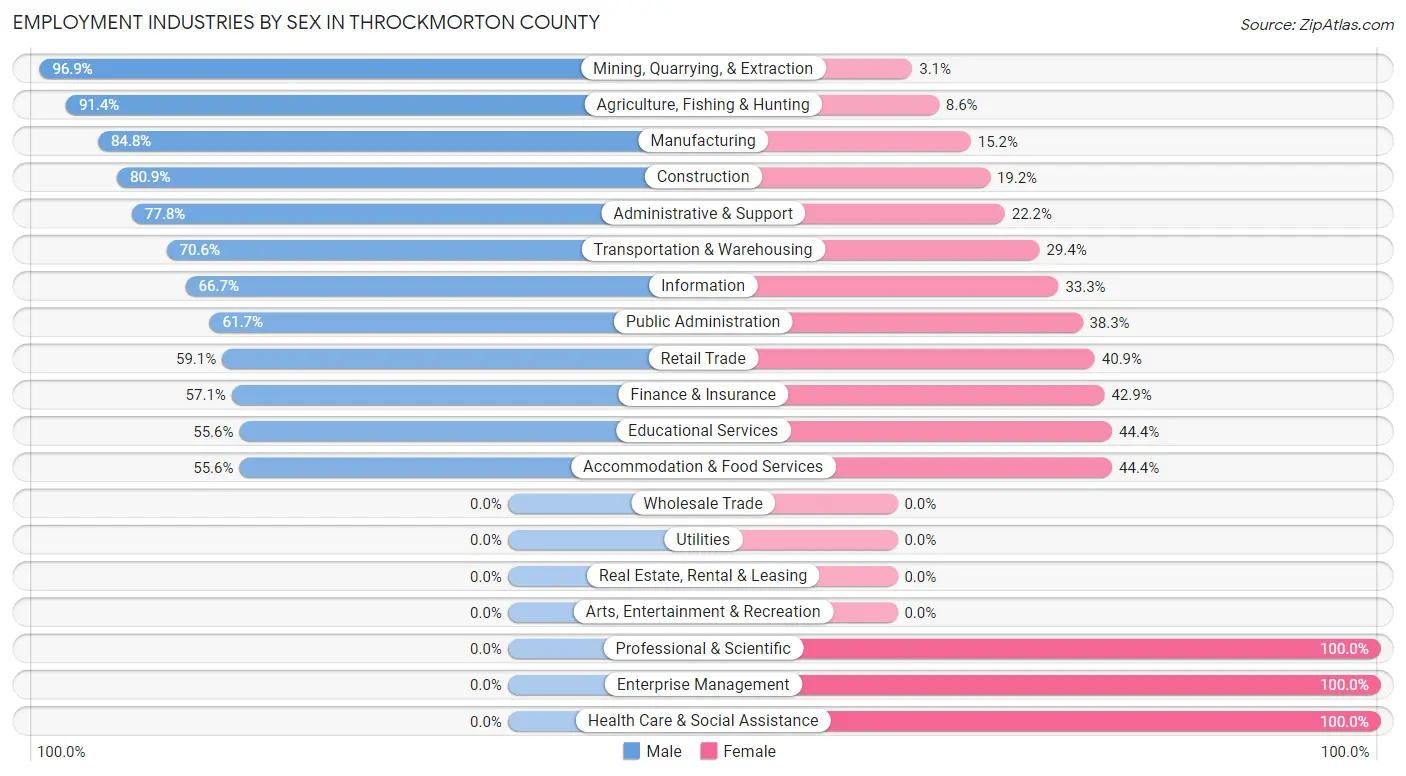
Employment Industries by Sex in Throckmorton County
The Throckmorton County industries that see more men than women are Mining, Quarrying, & Extraction (96.9%), Agriculture, Fishing & Hunting (91.4%), and Manufacturing (84.8%), whereas the industries that tend to have a higher number of women are Professional & Scientific (100.0%), Enterprise Management (100.0%), and Health Care & Social Assistance (100.0%).
| Industry | Male | Female |
| Agriculture, Fishing & Hunting | 64 (91.4%) | 6 (8.6%) |
| Mining, Quarrying, & Extraction | 63 (96.9%) | 2 (3.1%) |
| Construction | 38 (80.8%) | 9 (19.2%) |
| Manufacturing | 67 (84.8%) | 12 (15.2%) |
| Wholesale Trade | 0 (0.0%) | 0 (0.0%) |
| Retail Trade | 68 (59.1%) | 47 (40.9%) |
| Transportation & Warehousing | 24 (70.6%) | 10 (29.4%) |
| Utilities | 0 (0.0%) | 0 (0.0%) |
| Information | 8 (66.7%) | 4 (33.3%) |
| Finance & Insurance | 4 (57.1%) | 3 (42.9%) |
| Real Estate, Rental & Leasing | 0 (0.0%) | 0 (0.0%) |
| Professional & Scientific | 0 (0.0%) | 6 (100.0%) |
| Enterprise Management | 0 (0.0%) | 1 (100.0%) |
| Administrative & Support | 14 (77.8%) | 4 (22.2%) |
| Educational Services | 40 (55.6%) | 32 (44.4%) |
| Health Care & Social Assistance | 0 (0.0%) | 72 (100.0%) |
| Arts, Entertainment & Recreation | 0 (0.0%) | 0 (0.0%) |
| Accommodation & Food Services | 20 (55.6%) | 16 (44.4%) |
| Public Administration | 29 (61.7%) | 18 (38.3%) |
| Total | 485 (66.1%) | 249 (33.9%) |
Education in Throckmorton County
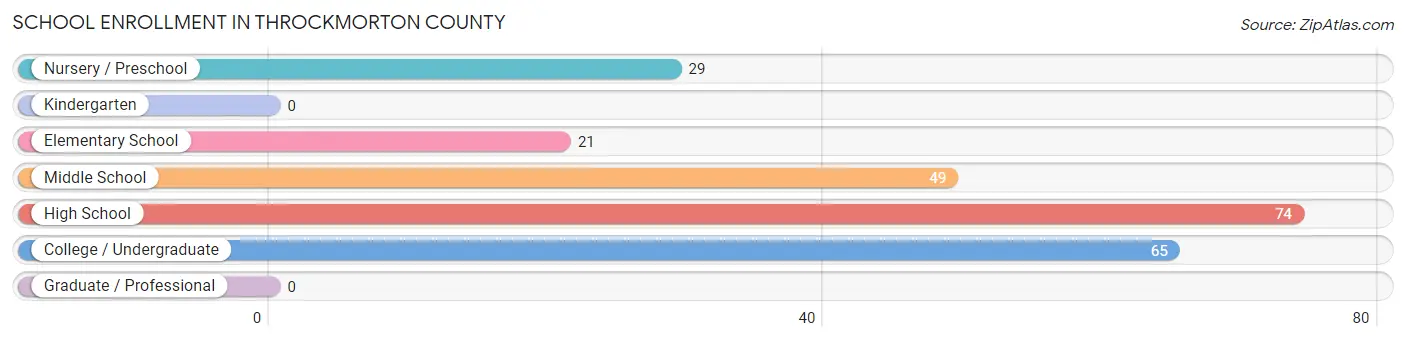
School Enrollment in Throckmorton County
The most common levels of schooling among the 238 students in Throckmorton County are high school (74 | 31.1%), college / undergraduate (65 | 27.3%), and middle school (49 | 20.6%).
| School Level | # Students | % Students |
| Nursery / Preschool | 29 | 12.2% |
| Kindergarten | 0 | 0.0% |
| Elementary School | 21 | 8.8% |
| Middle School | 49 | 20.6% |
| High School | 74 | 31.1% |
| College / Undergraduate | 65 | 27.3% |
| Graduate / Professional | 0 | 0.0% |
| Total | 238 | 100.0% |
School Enrollment by Age by Funding Source in Throckmorton County
Out of a total of 238 students who are enrolled in schools in Throckmorton County, 45 (18.9%) attend a private institution, while the remaining 193 (81.1%) are enrolled in public schools. The age group of 20 to 24 year olds has the highest likelihood of being enrolled in private schools, with 13 (100.0% in the age bracket) enrolled. Conversely, the age group of 3 to 4 year olds has the lowest likelihood of being enrolled in a private school, with 23 (100.0% in the age bracket) attending a public institution.
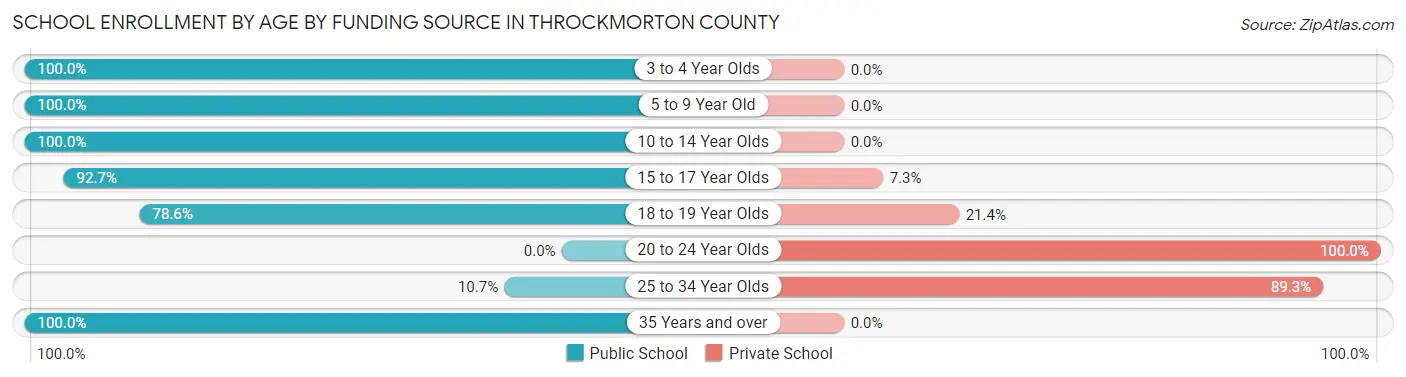
| Age Bracket | Public School | Private School |
| 3 to 4 Year Olds | 23 (100.0%) | 0 (0.0%) |
| 5 to 9 Year Old | 27 (100.0%) | 0 (0.0%) |
| 10 to 14 Year Olds | 65 (100.0%) | 0 (0.0%) |
| 15 to 17 Year Olds | 51 (92.7%) | 4 (7.3%) |
| 18 to 19 Year Olds | 11 (78.6%) | 3 (21.4%) |
| 20 to 24 Year Olds | 0 (0.0%) | 13 (100.0%) |
| 25 to 34 Year Olds | 3 (10.7%) | 25 (89.3%) |
| 35 Years and over | 13 (100.0%) | 0 (0.0%) |
| Total | 193 (81.1%) | 45 (18.9%) |
Educational Attainment by Field of Study in Throckmorton County
Education (72 | 33.3%), bio, nature & agricultural (32 | 14.8%), liberal arts & history (20 | 9.3%), business (19 | 8.8%), and communications (18 | 8.3%) are the most common fields of study among 216 individuals in Throckmorton County who have obtained a bachelor's degree or higher.
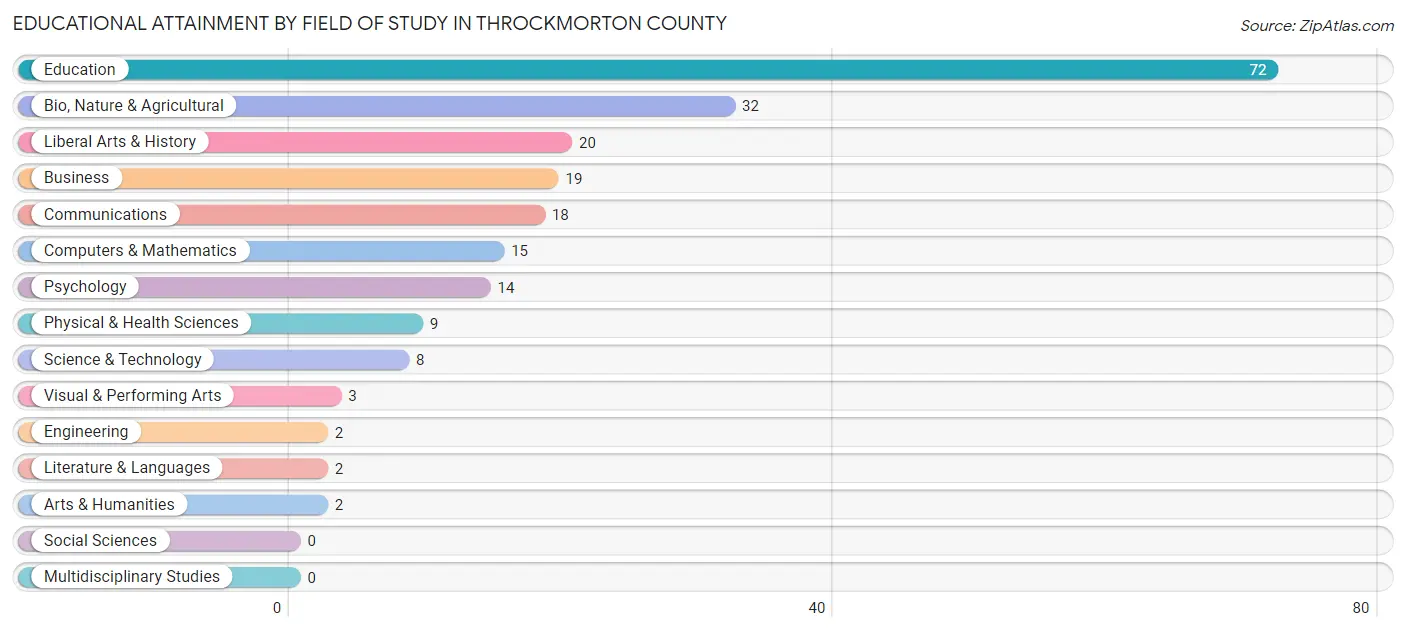
| Field of Study | # Graduates | % Graduates |
| Computers & Mathematics | 15 | 6.9% |
| Bio, Nature & Agricultural | 32 | 14.8% |
| Physical & Health Sciences | 9 | 4.2% |
| Psychology | 14 | 6.5% |
| Social Sciences | 0 | 0.0% |
| Engineering | 2 | 0.9% |
| Multidisciplinary Studies | 0 | 0.0% |
| Science & Technology | 8 | 3.7% |
| Business | 19 | 8.8% |
| Education | 72 | 33.3% |
| Literature & Languages | 2 | 0.9% |
| Liberal Arts & History | 20 | 9.3% |
| Visual & Performing Arts | 3 | 1.4% |
| Communications | 18 | 8.3% |
| Arts & Humanities | 2 | 0.9% |
| Total | 216 | 100.0% |
Transportation & Commute in Throckmorton County
Vehicle Availability by Sex in Throckmorton County
The most prevalent vehicle ownership categories in Throckmorton County are males with 2 vehicles (238, accounting for 50.7%) and females with 2 vehicles (132, making up 96.0%).
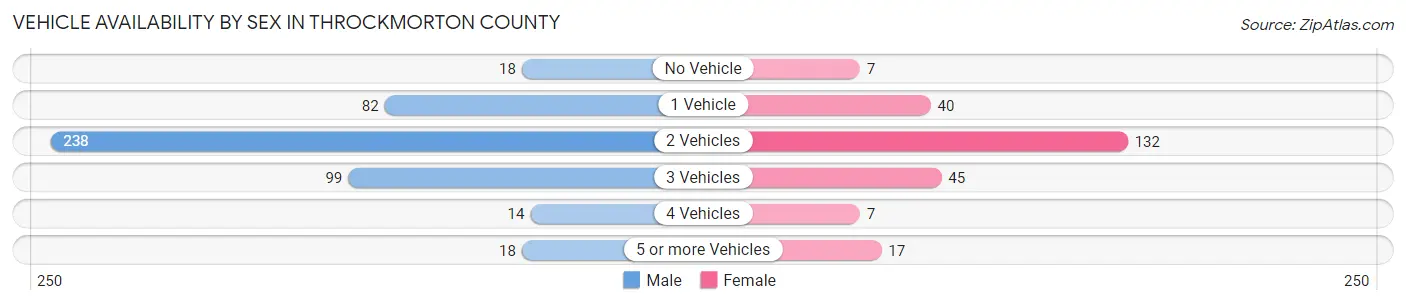
| Vehicles Available | Male | Female |
| No Vehicle | 18 (3.8%) | 7 (2.8%) |
| 1 Vehicle | 82 (17.5%) | 40 (16.1%) |
| 2 Vehicles | 238 (50.7%) | 132 (53.2%) |
| 3 Vehicles | 99 (21.1%) | 45 (18.1%) |
| 4 Vehicles | 14 (3.0%) | 7 (2.8%) |
| 5 or more Vehicles | 18 (3.8%) | 17 (6.9%) |
| Total | 469 (100.0%) | 248 (100.0%) |
Commute Time in Throckmorton County
The most frequently occuring commute durations in Throckmorton County are less than 5 minutes (221 commuters, 31.9%), 5 to 9 minutes (109 commuters, 15.7%), and 30 to 34 minutes (99 commuters, 14.3%).
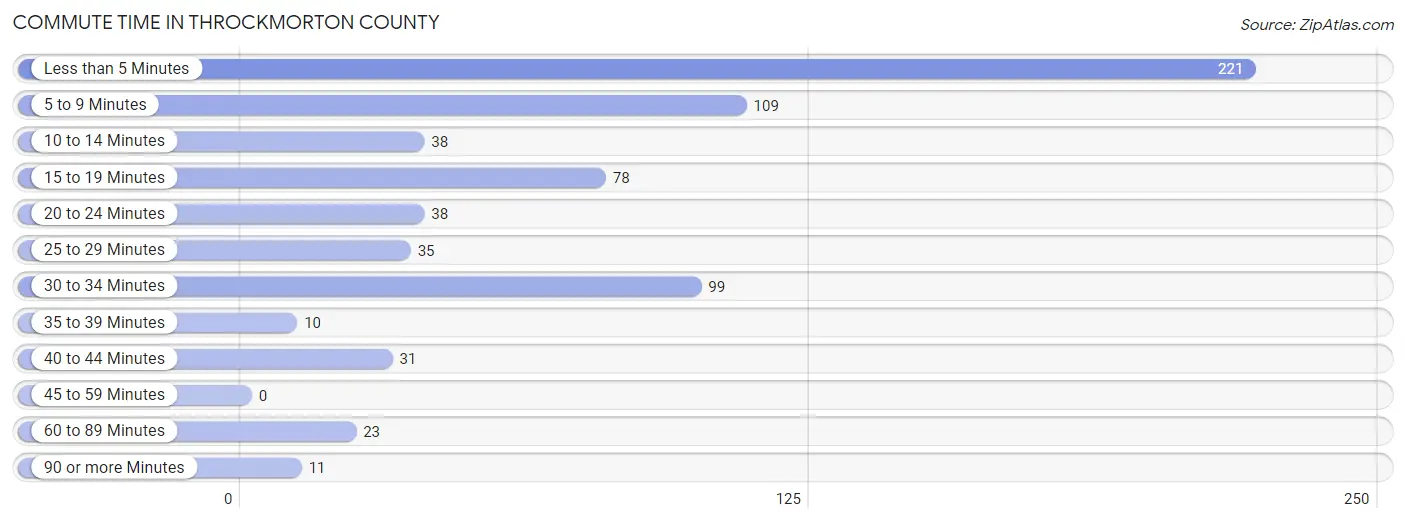
| Commute Time | # Commuters | % Commuters |
| Less than 5 Minutes | 221 | 31.9% |
| 5 to 9 Minutes | 109 | 15.7% |
| 10 to 14 Minutes | 38 | 5.5% |
| 15 to 19 Minutes | 78 | 11.3% |
| 20 to 24 Minutes | 38 | 5.5% |
| 25 to 29 Minutes | 35 | 5.1% |
| 30 to 34 Minutes | 99 | 14.3% |
| 35 to 39 Minutes | 10 | 1.4% |
| 40 to 44 Minutes | 31 | 4.5% |
| 45 to 59 Minutes | 0 | 0.0% |
| 60 to 89 Minutes | 23 | 3.3% |
| 90 or more Minutes | 11 | 1.6% |
Commute Time by Sex in Throckmorton County
The most common commute times in Throckmorton County are less than 5 minutes (137 commuters, 30.6%) for males and less than 5 minutes (84 commuters, 34.3%) for females.
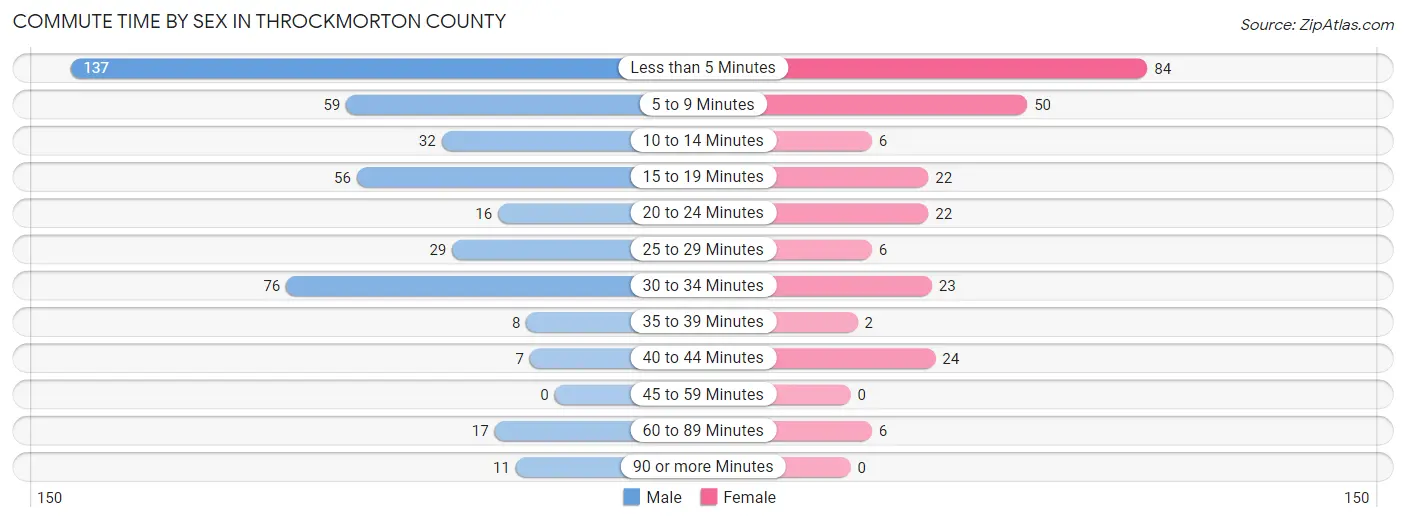
| Commute Time | Male | Female |
| Less than 5 Minutes | 137 (30.6%) | 84 (34.3%) |
| 5 to 9 Minutes | 59 (13.2%) | 50 (20.4%) |
| 10 to 14 Minutes | 32 (7.1%) | 6 (2.5%) |
| 15 to 19 Minutes | 56 (12.5%) | 22 (9.0%) |
| 20 to 24 Minutes | 16 (3.6%) | 22 (9.0%) |
| 25 to 29 Minutes | 29 (6.5%) | 6 (2.5%) |
| 30 to 34 Minutes | 76 (17.0%) | 23 (9.4%) |
| 35 to 39 Minutes | 8 (1.8%) | 2 (0.8%) |
| 40 to 44 Minutes | 7 (1.6%) | 24 (9.8%) |
| 45 to 59 Minutes | 0 (0.0%) | 0 (0.0%) |
| 60 to 89 Minutes | 17 (3.8%) | 6 (2.5%) |
| 90 or more Minutes | 11 (2.5%) | 0 (0.0%) |
Time of Departure to Work by Sex in Throckmorton County
The most frequent times of departure to work in Throckmorton County are 6:30 AM to 6:59 AM (84, 18.8%) for males and 8:00 AM to 8:29 AM (81, 33.1%) for females.
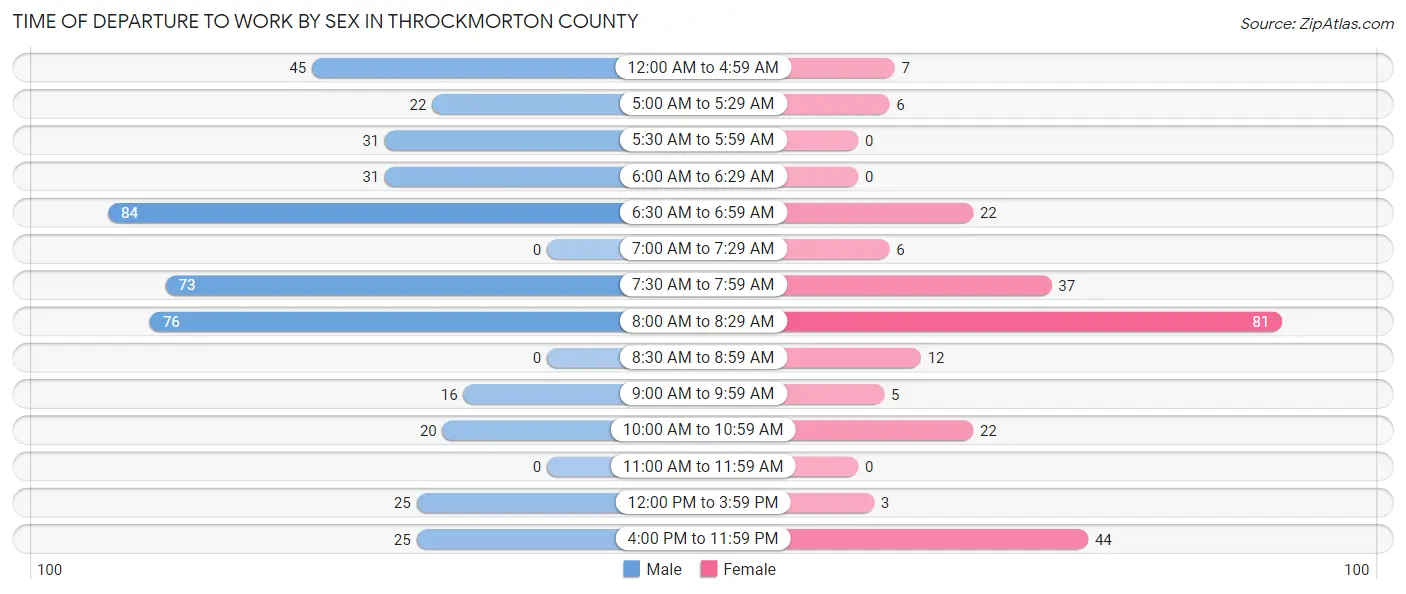
| Time of Departure | Male | Female |
| 12:00 AM to 4:59 AM | 45 (10.0%) | 7 (2.9%) |
| 5:00 AM to 5:29 AM | 22 (4.9%) | 6 (2.5%) |
| 5:30 AM to 5:59 AM | 31 (6.9%) | 0 (0.0%) |
| 6:00 AM to 6:29 AM | 31 (6.9%) | 0 (0.0%) |
| 6:30 AM to 6:59 AM | 84 (18.8%) | 22 (9.0%) |
| 7:00 AM to 7:29 AM | 0 (0.0%) | 6 (2.5%) |
| 7:30 AM to 7:59 AM | 73 (16.3%) | 37 (15.1%) |
| 8:00 AM to 8:29 AM | 76 (17.0%) | 81 (33.1%) |
| 8:30 AM to 8:59 AM | 0 (0.0%) | 12 (4.9%) |
| 9:00 AM to 9:59 AM | 16 (3.6%) | 5 (2.0%) |
| 10:00 AM to 10:59 AM | 20 (4.5%) | 22 (9.0%) |
| 11:00 AM to 11:59 AM | 0 (0.0%) | 0 (0.0%) |
| 12:00 PM to 3:59 PM | 25 (5.6%) | 3 (1.2%) |
| 4:00 PM to 11:59 PM | 25 (5.6%) | 44 (18.0%) |
| Total | 448 (100.0%) | 245 (100.0%) |
Housing Occupancy in Throckmorton County
Occupancy by Ownership in Throckmorton County
Of the total 635 dwellings in Throckmorton County, owner-occupied units account for 445 (70.1%), while renter-occupied units make up 190 (29.9%).
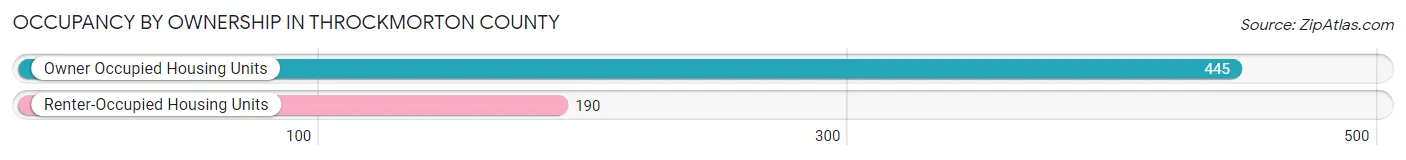
| Occupancy | # Housing Units | % Housing Units |
| Owner Occupied Housing Units | 445 | 70.1% |
| Renter-Occupied Housing Units | 190 | 29.9% |
| Total Occupied Housing Units | 635 | 100.0% |
Occupancy by Household Size in Throckmorton County
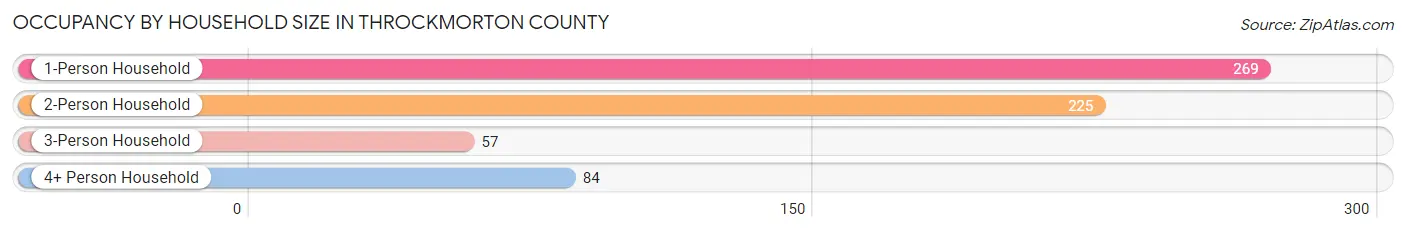
| Household Size | # Housing Units | % Housing Units |
| 1-Person Household | 269 | 42.4% |
| 2-Person Household | 225 | 35.4% |
| 3-Person Household | 57 | 9.0% |
| 4+ Person Household | 84 | 13.2% |
| Total Housing Units | 635 | 100.0% |
Occupancy by Ownership by Household Size in Throckmorton County
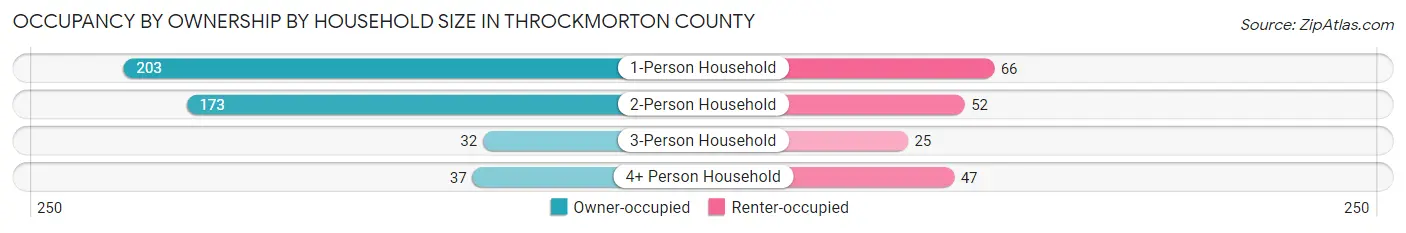
| Household Size | Owner-occupied | Renter-occupied |
| 1-Person Household | 203 (75.5%) | 66 (24.5%) |
| 2-Person Household | 173 (76.9%) | 52 (23.1%) |
| 3-Person Household | 32 (56.1%) | 25 (43.9%) |
| 4+ Person Household | 37 (44.1%) | 47 (55.9%) |
| Total Housing Units | 445 (70.1%) | 190 (29.9%) |
Occupancy by Educational Attainment in Throckmorton County
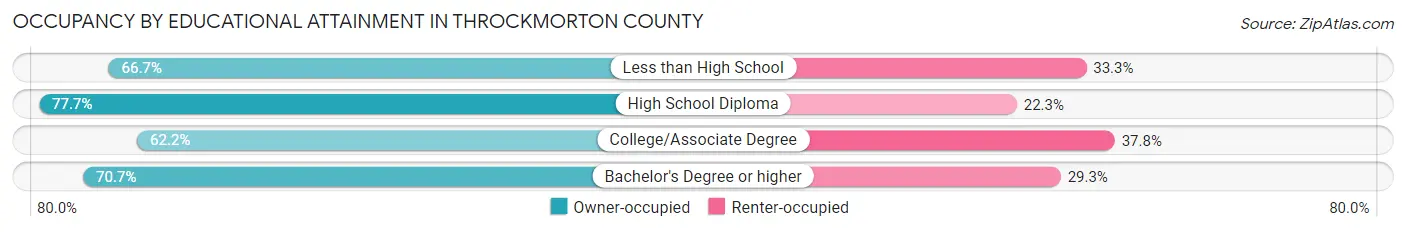
| Household Size | Owner-occupied | Renter-occupied |
| Less than High School | 32 (66.7%) | 16 (33.3%) |
| High School Diploma | 188 (77.7%) | 54 (22.3%) |
| College/Associate Degree | 138 (62.2%) | 84 (37.8%) |
| Bachelor's Degree or higher | 87 (70.7%) | 36 (29.3%) |
Occupancy by Age of Householder in Throckmorton County
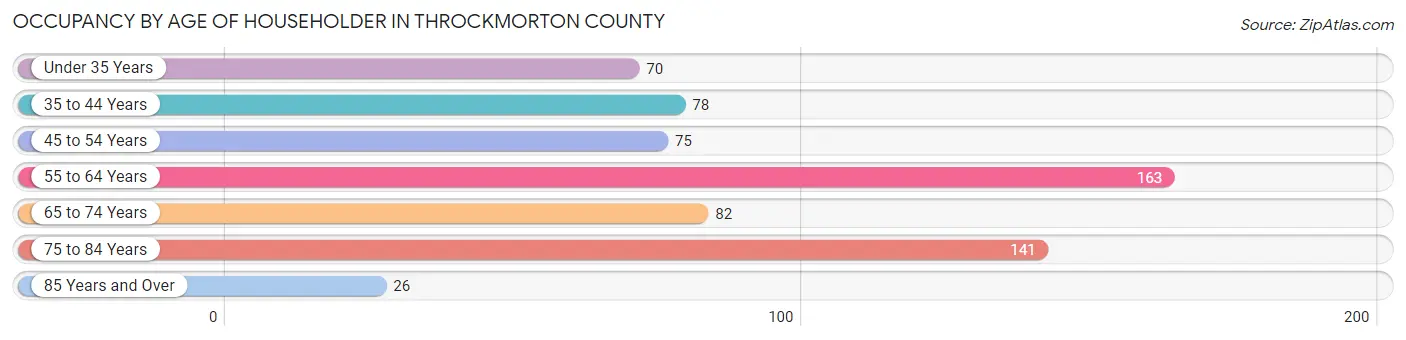
| Age Bracket | # Households | % Households |
| Under 35 Years | 70 | 11.0% |
| 35 to 44 Years | 78 | 12.3% |
| 45 to 54 Years | 75 | 11.8% |
| 55 to 64 Years | 163 | 25.7% |
| 65 to 74 Years | 82 | 12.9% |
| 75 to 84 Years | 141 | 22.2% |
| 85 Years and Over | 26 | 4.1% |
| Total | 635 | 100.0% |
Housing Finances in Throckmorton County
Median Income by Occupancy in Throckmorton County
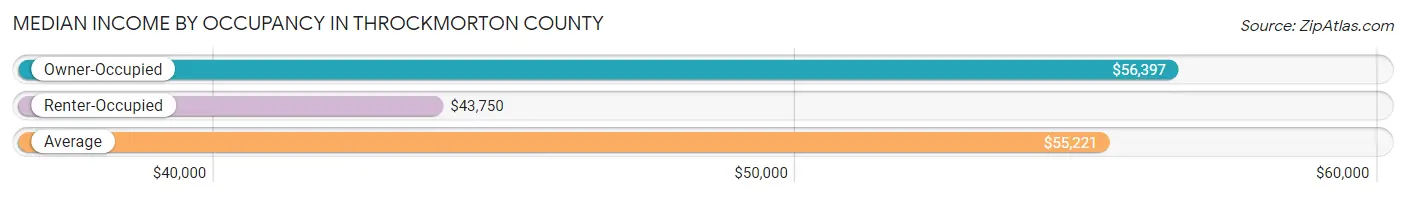
| Occupancy Type | # Households | Median Income |
| Owner-Occupied | 445 (70.1%) | $56,397 |
| Renter-Occupied | 190 (29.9%) | $43,750 |
| Average | 635 (100.0%) | $55,221 |
Occupancy by Householder Income Bracket in Throckmorton County
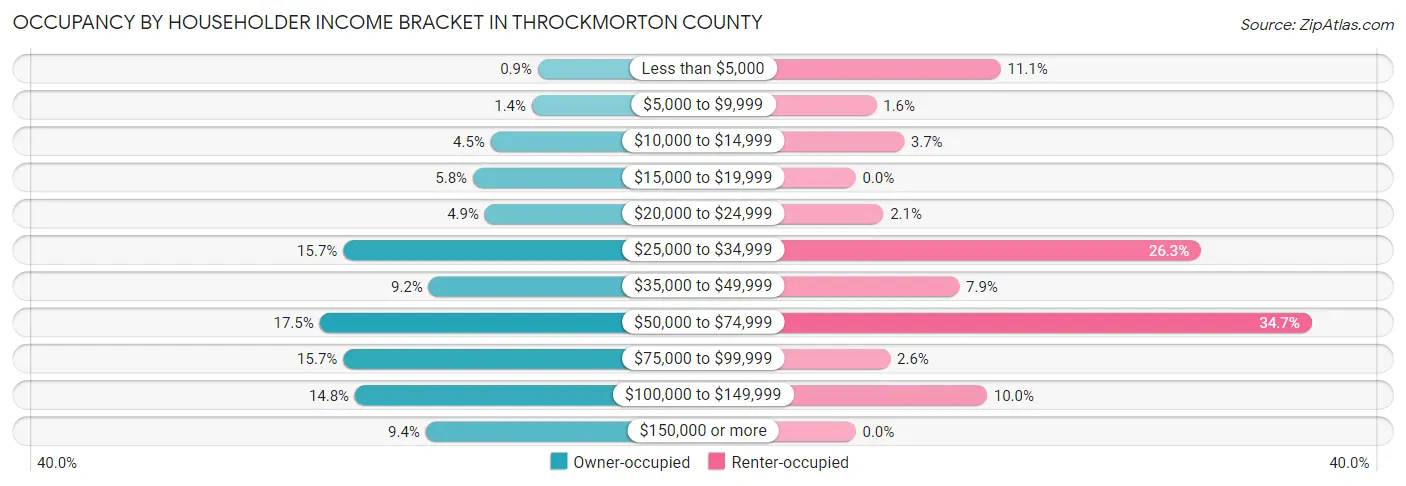
| Income Bracket | Owner-occupied | Renter-occupied |
| Less than $5,000 | 4 (0.9%) | 21 (11.1%) |
| $5,000 to $9,999 | 6 (1.3%) | 3 (1.6%) |
| $10,000 to $14,999 | 20 (4.5%) | 7 (3.7%) |
| $15,000 to $19,999 | 26 (5.8%) | 0 (0.0%) |
| $20,000 to $24,999 | 22 (4.9%) | 4 (2.1%) |
| $25,000 to $34,999 | 70 (15.7%) | 50 (26.3%) |
| $35,000 to $49,999 | 41 (9.2%) | 15 (7.9%) |
| $50,000 to $74,999 | 78 (17.5%) | 66 (34.7%) |
| $75,000 to $99,999 | 70 (15.7%) | 5 (2.6%) |
| $100,000 to $149,999 | 66 (14.8%) | 19 (10.0%) |
| $150,000 or more | 42 (9.4%) | 0 (0.0%) |
| Total | 445 (100.0%) | 190 (100.0%) |
Monthly Housing Cost Tiers in Throckmorton County
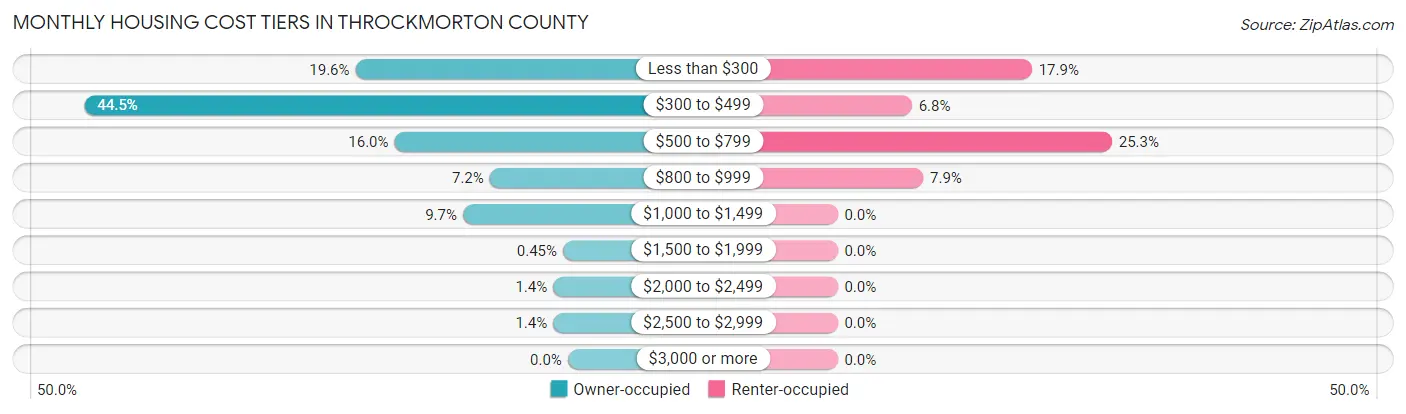
| Monthly Cost | Owner-occupied | Renter-occupied |
| Less than $300 | 87 (19.6%) | 34 (17.9%) |
| $300 to $499 | 198 (44.5%) | 13 (6.8%) |
| $500 to $799 | 71 (16.0%) | 48 (25.3%) |
| $800 to $999 | 32 (7.2%) | 15 (7.9%) |
| $1,000 to $1,499 | 43 (9.7%) | 0 (0.0%) |
| $1,500 to $1,999 | 2 (0.4%) | 0 (0.0%) |
| $2,000 to $2,499 | 6 (1.3%) | 0 (0.0%) |
| $2,500 to $2,999 | 6 (1.3%) | 0 (0.0%) |
| $3,000 or more | 0 (0.0%) | 0 (0.0%) |
| Total | 445 (100.0%) | 190 (100.0%) |
Physical Housing Characteristics in Throckmorton County
Housing Structures in Throckmorton County
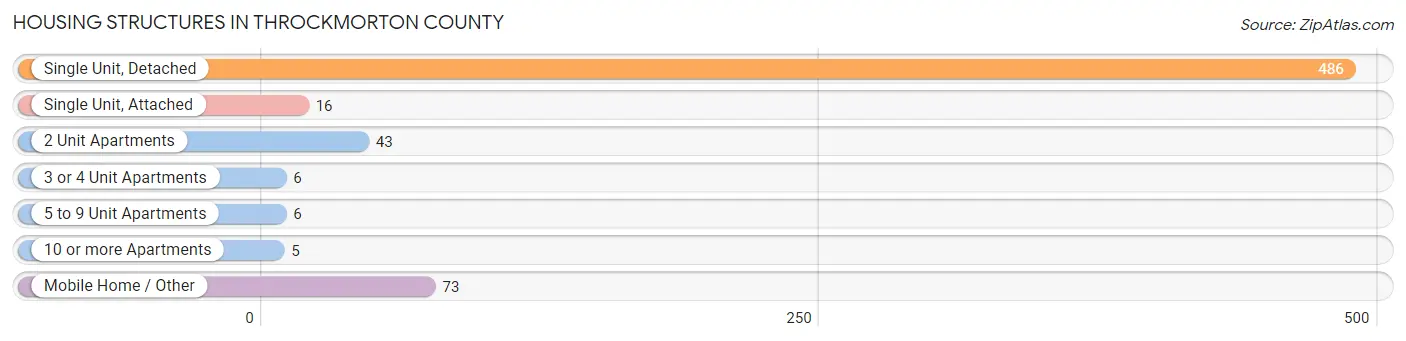
| Structure Type | # Housing Units | % Housing Units |
| Single Unit, Detached | 486 | 76.5% |
| Single Unit, Attached | 16 | 2.5% |
| 2 Unit Apartments | 43 | 6.8% |
| 3 or 4 Unit Apartments | 6 | 0.9% |
| 5 to 9 Unit Apartments | 6 | 0.9% |
| 10 or more Apartments | 5 | 0.8% |
| Mobile Home / Other | 73 | 11.5% |
| Total | 635 | 100.0% |
Housing Structures by Occupancy in Throckmorton County
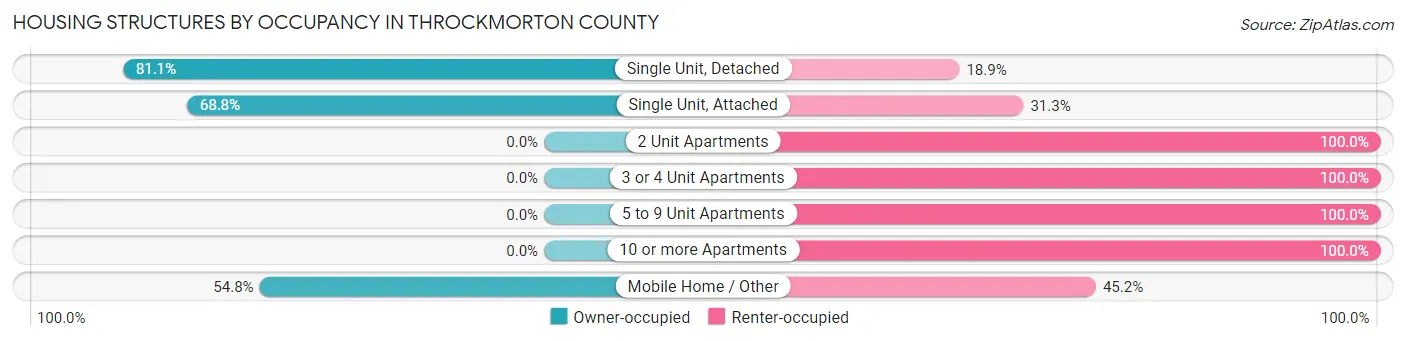
| Structure Type | Owner-occupied | Renter-occupied |
| Single Unit, Detached | 394 (81.1%) | 92 (18.9%) |
| Single Unit, Attached | 11 (68.8%) | 5 (31.2%) |
| 2 Unit Apartments | 0 (0.0%) | 43 (100.0%) |
| 3 or 4 Unit Apartments | 0 (0.0%) | 6 (100.0%) |
| 5 to 9 Unit Apartments | 0 (0.0%) | 6 (100.0%) |
| 10 or more Apartments | 0 (0.0%) | 5 (100.0%) |
| Mobile Home / Other | 40 (54.8%) | 33 (45.2%) |
| Total | 445 (70.1%) | 190 (29.9%) |
Housing Structures by Number of Rooms in Throckmorton County
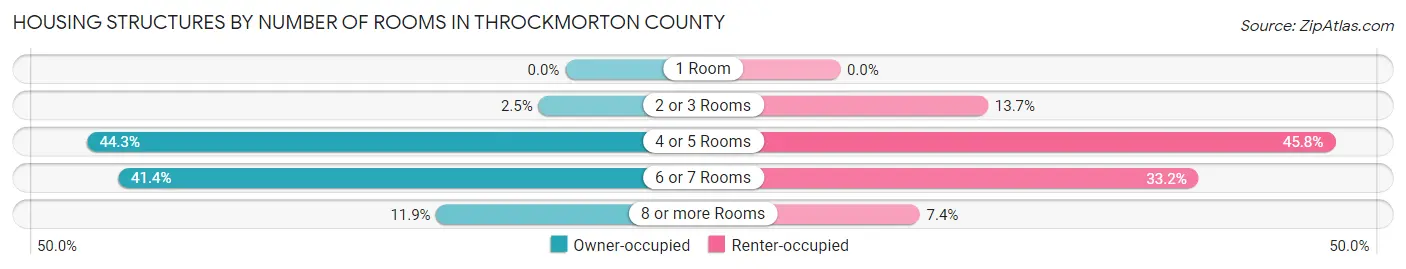
| Number of Rooms | Owner-occupied | Renter-occupied |
| 1 Room | 0 (0.0%) | 0 (0.0%) |
| 2 or 3 Rooms | 11 (2.5%) | 26 (13.7%) |
| 4 or 5 Rooms | 197 (44.3%) | 87 (45.8%) |
| 6 or 7 Rooms | 184 (41.3%) | 63 (33.2%) |
| 8 or more Rooms | 53 (11.9%) | 14 (7.4%) |
| Total | 445 (100.0%) | 190 (100.0%) |
Housing Structure by Heating Type in Throckmorton County
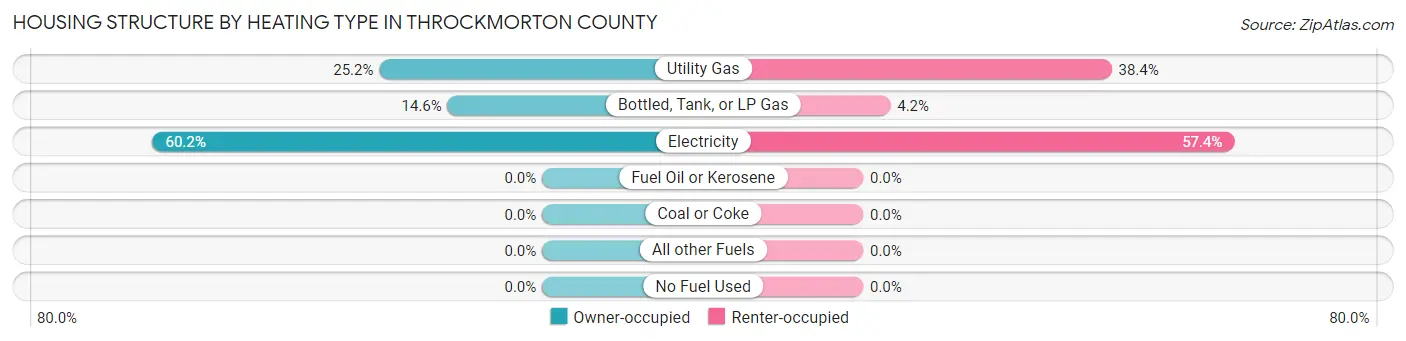
| Heating Type | Owner-occupied | Renter-occupied |
| Utility Gas | 112 (25.2%) | 73 (38.4%) |
| Bottled, Tank, or LP Gas | 65 (14.6%) | 8 (4.2%) |
| Electricity | 268 (60.2%) | 109 (57.4%) |
| Fuel Oil or Kerosene | 0 (0.0%) | 0 (0.0%) |
| Coal or Coke | 0 (0.0%) | 0 (0.0%) |
| All other Fuels | 0 (0.0%) | 0 (0.0%) |
| No Fuel Used | 0 (0.0%) | 0 (0.0%) |
| Total | 445 (100.0%) | 190 (100.0%) |
Household Vehicle Usage in Throckmorton County
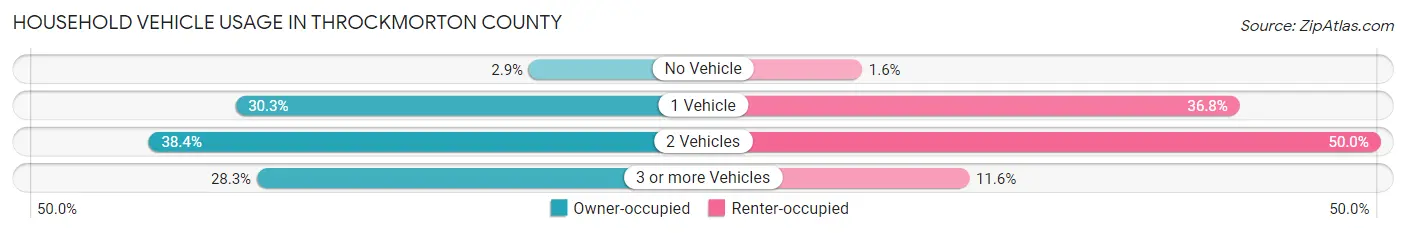
| Vehicles per Household | Owner-occupied | Renter-occupied |
| No Vehicle | 13 (2.9%) | 3 (1.6%) |
| 1 Vehicle | 135 (30.3%) | 70 (36.8%) |
| 2 Vehicles | 171 (38.4%) | 95 (50.0%) |
| 3 or more Vehicles | 126 (28.3%) | 22 (11.6%) |
| Total | 445 (100.0%) | 190 (100.0%) |
Real Estate & Mortgages in Throckmorton County
Real Estate and Mortgage Overview in Throckmorton County
| Characteristic | Without Mortgage | With Mortgage |
| Housing Units | 375 | 70 |
| Median Property Value | $57,200 | $95,000 |
| Median Household Income | $50,673 | $15 |
| Monthly Housing Costs | $393 | $0 |
| Real Estate Taxes | $779 | $0 |
Property Value by Mortgage Status in Throckmorton County
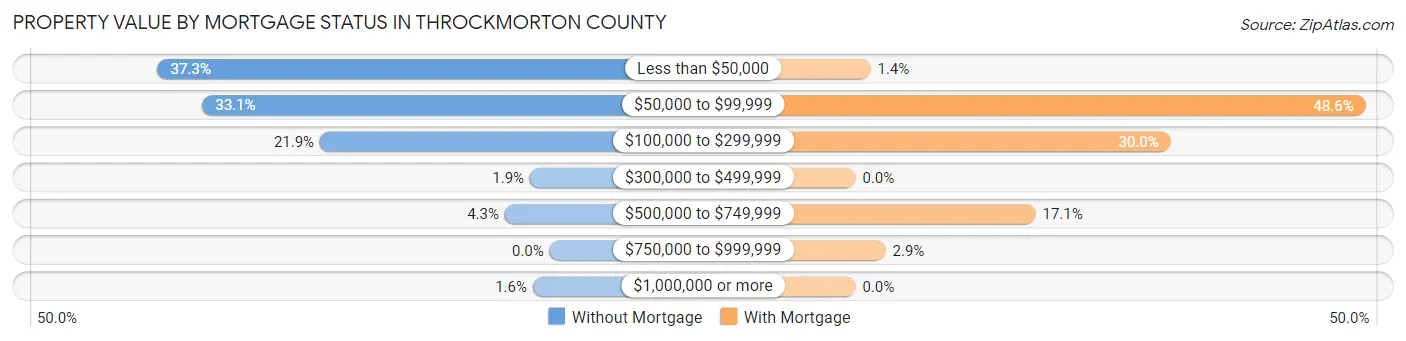
| Property Value | Without Mortgage | With Mortgage |
| Less than $50,000 | 140 (37.3%) | 1 (1.4%) |
| $50,000 to $99,999 | 124 (33.1%) | 34 (48.6%) |
| $100,000 to $299,999 | 82 (21.9%) | 21 (30.0%) |
| $300,000 to $499,999 | 7 (1.9%) | 0 (0.0%) |
| $500,000 to $749,999 | 16 (4.3%) | 12 (17.1%) |
| $750,000 to $999,999 | 0 (0.0%) | 2 (2.9%) |
| $1,000,000 or more | 6 (1.6%) | 0 (0.0%) |
| Total | 375 (100.0%) | 70 (100.0%) |
Household Income by Mortgage Status in Throckmorton County
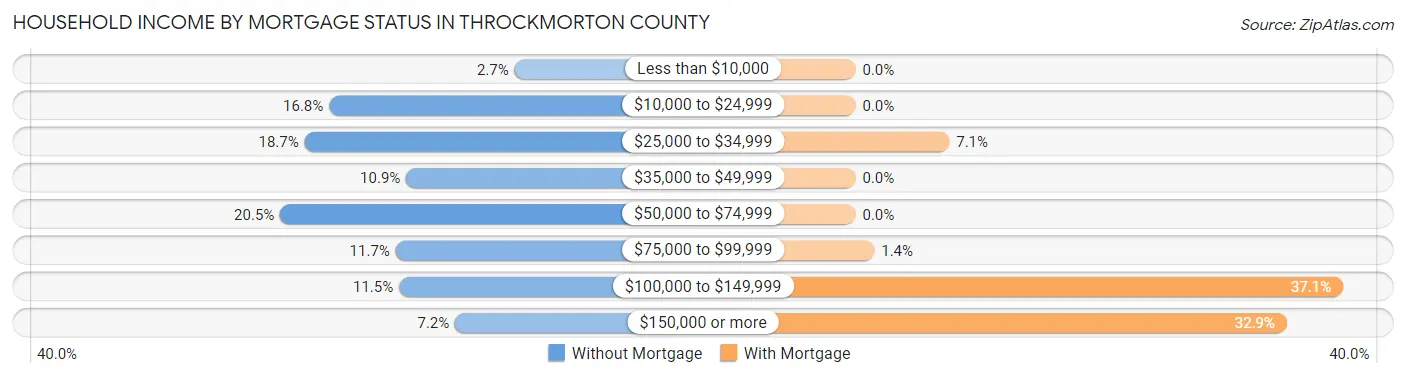
| Household Income | Without Mortgage | With Mortgage |
| Less than $10,000 | 10 (2.7%) | 0 (0.0%) |
| $10,000 to $24,999 | 63 (16.8%) | 0 (0.0%) |
| $25,000 to $34,999 | 70 (18.7%) | 5 (7.1%) |
| $35,000 to $49,999 | 41 (10.9%) | 0 (0.0%) |
| $50,000 to $74,999 | 77 (20.5%) | 0 (0.0%) |
| $75,000 to $99,999 | 44 (11.7%) | 1 (1.4%) |
| $100,000 to $149,999 | 43 (11.5%) | 26 (37.1%) |
| $150,000 or more | 27 (7.2%) | 23 (32.9%) |
| Total | 375 (100.0%) | 70 (100.0%) |
Property Value to Household Income Ratio in Throckmorton County
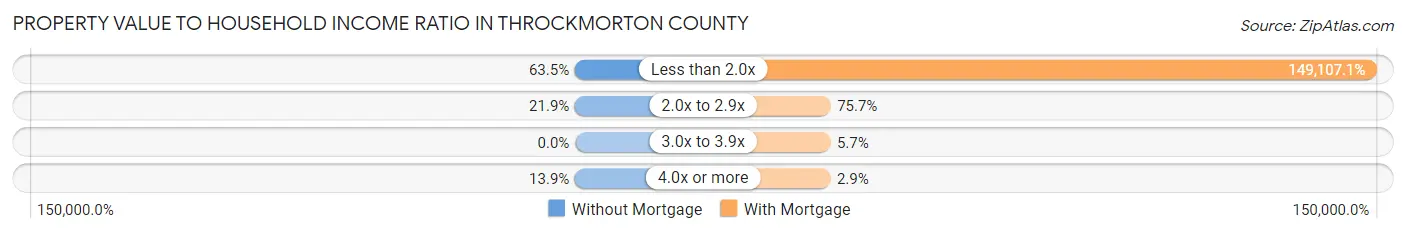
| Value-to-Income Ratio | Without Mortgage | With Mortgage |
| Less than 2.0x | 238 (63.5%) | 104,375 (149,107.1%) |
| 2.0x to 2.9x | 82 (21.9%) | 53 (75.7%) |
| 3.0x to 3.9x | 0 (0.0%) | 4 (5.7%) |
| 4.0x or more | 52 (13.9%) | 2 (2.9%) |
| Total | 375 (100.0%) | 70 (100.0%) |
Real Estate Taxes by Mortgage Status in Throckmorton County
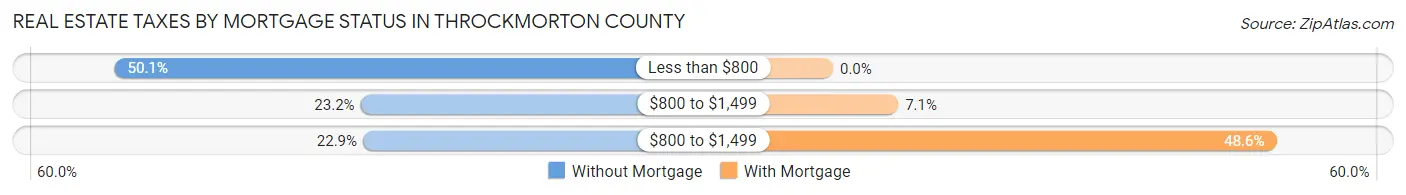
| Property Taxes | Without Mortgage | With Mortgage |
| Less than $800 | 188 (50.1%) | 0 (0.0%) |
| $800 to $1,499 | 87 (23.2%) | 5 (7.1%) |
| $800 to $1,499 | 86 (22.9%) | 34 (48.6%) |
| Total | 375 (100.0%) | 70 (100.0%) |
Health & Disability in Throckmorton County
Health Insurance Coverage by Age in Throckmorton County
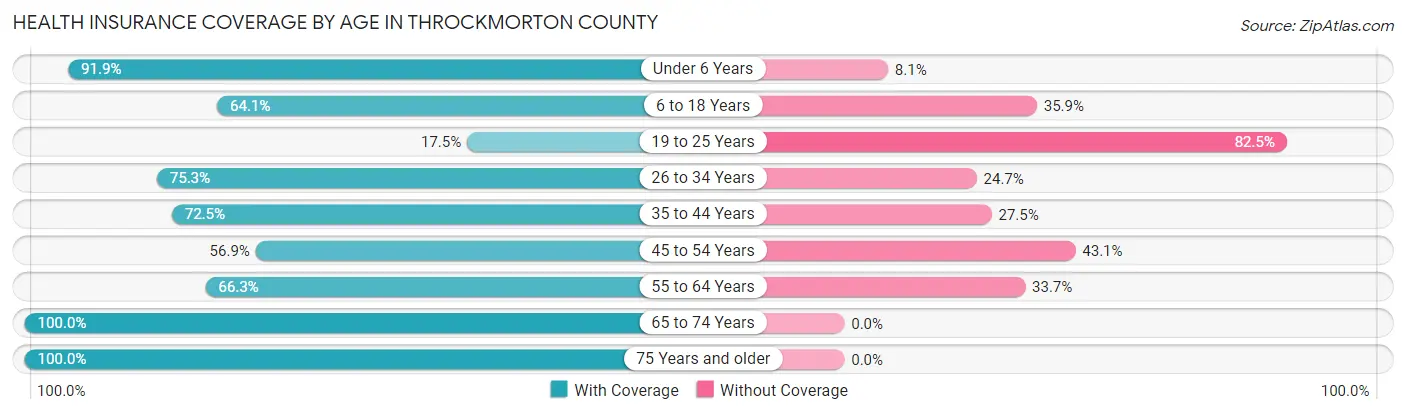
| Age Bracket | With Coverage | Without Coverage |
| Under 6 Years | 113 (91.9%) | 10 (8.1%) |
| 6 to 18 Years | 100 (64.1%) | 56 (35.9%) |
| 19 to 25 Years | 21 (17.5%) | 99 (82.5%) |
| 26 to 34 Years | 113 (75.3%) | 37 (24.7%) |
| 35 to 44 Years | 103 (72.5%) | 39 (27.5%) |
| 45 to 54 Years | 70 (56.9%) | 53 (43.1%) |
| 55 to 64 Years | 171 (66.3%) | 87 (33.7%) |
| 65 to 74 Years | 135 (100.0%) | 0 (0.0%) |
| 75 Years and older | 232 (100.0%) | 0 (0.0%) |
| Total | 1,058 (73.5%) | 381 (26.5%) |
Health Insurance Coverage by Citizenship Status in Throckmorton County
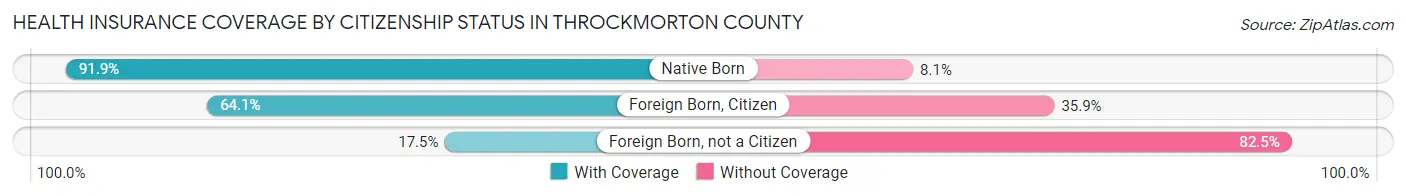
| Citizenship Status | With Coverage | Without Coverage |
| Native Born | 113 (91.9%) | 10 (8.1%) |
| Foreign Born, Citizen | 100 (64.1%) | 56 (35.9%) |
| Foreign Born, not a Citizen | 21 (17.5%) | 99 (82.5%) |
Health Insurance Coverage by Household Income in Throckmorton County
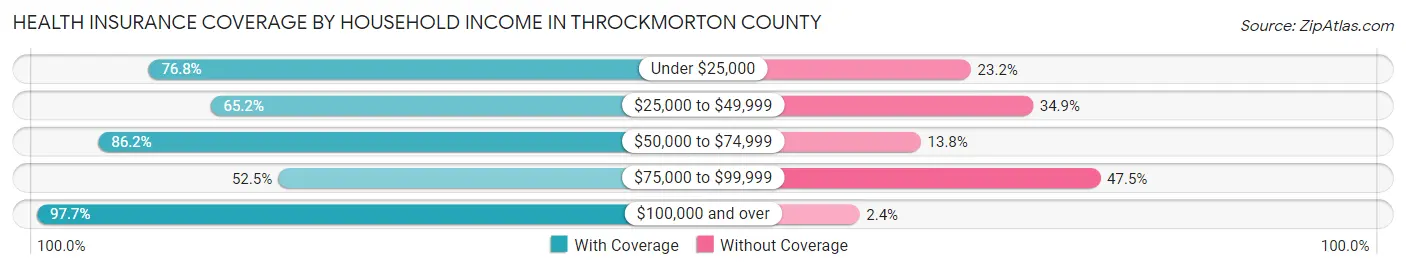
| Household Income | With Coverage | Without Coverage |
| Under $25,000 | 129 (76.8%) | 39 (23.2%) |
| $25,000 to $49,999 | 215 (65.1%) | 115 (34.8%) |
| $50,000 to $74,999 | 268 (86.2%) | 43 (13.8%) |
| $75,000 to $99,999 | 197 (52.5%) | 178 (47.5%) |
| $100,000 and over | 249 (97.7%) | 6 (2.4%) |
Public vs Private Health Insurance Coverage by Age in Throckmorton County
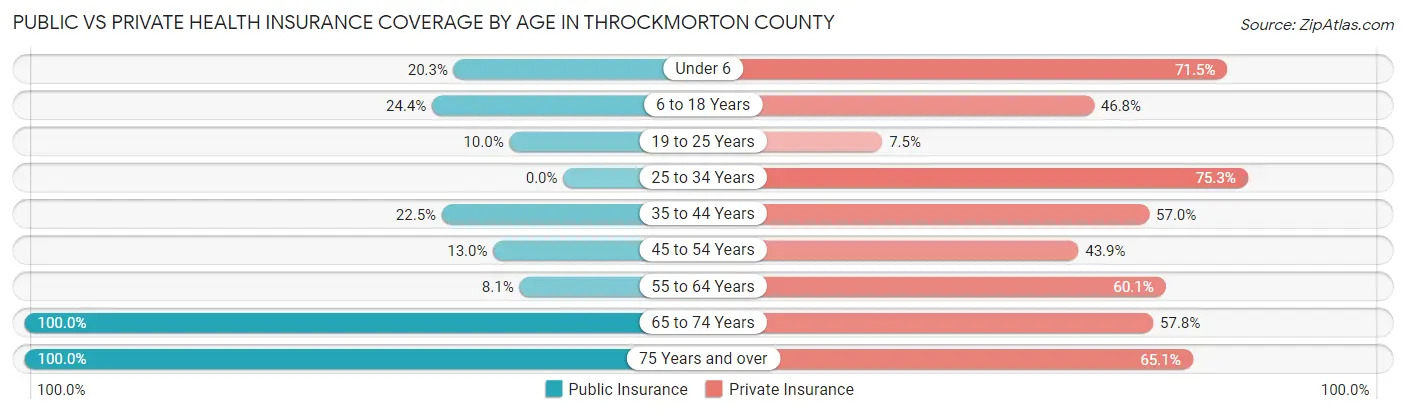
| Age Bracket | Public Insurance | Private Insurance |
| Under 6 | 25 (20.3%) | 88 (71.5%) |
| 6 to 18 Years | 38 (24.4%) | 73 (46.8%) |
| 19 to 25 Years | 12 (10.0%) | 9 (7.5%) |
| 25 to 34 Years | 0 (0.0%) | 113 (75.3%) |
| 35 to 44 Years | 32 (22.5%) | 81 (57.0%) |
| 45 to 54 Years | 16 (13.0%) | 54 (43.9%) |
| 55 to 64 Years | 21 (8.1%) | 155 (60.1%) |
| 65 to 74 Years | 135 (100.0%) | 78 (57.8%) |
| 75 Years and over | 232 (100.0%) | 151 (65.1%) |
| Total | 511 (35.5%) | 802 (55.7%) |
Disability Status by Sex by Age in Throckmorton County
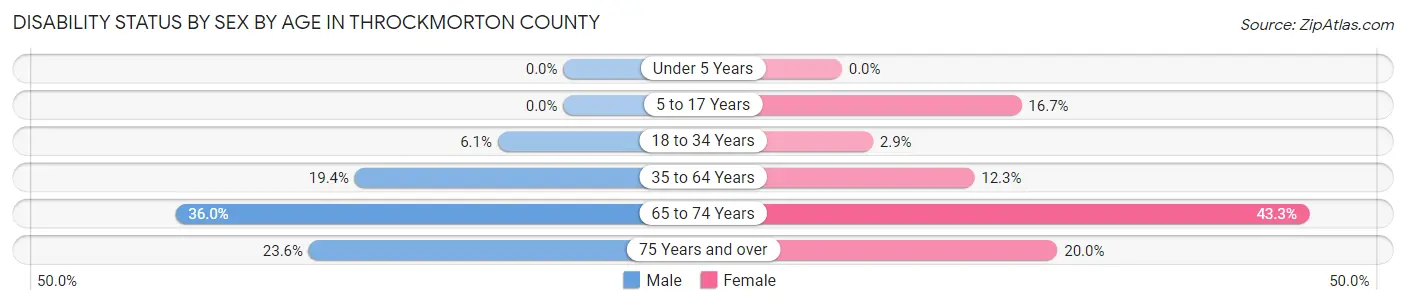
| Age Bracket | Male | Female |
| Under 5 Years | 0 (0.0%) | 0 (0.0%) |
| 5 to 17 Years | 0 (0.0%) | 12 (16.7%) |
| 18 to 34 Years | 11 (6.1%) | 3 (2.9%) |
| 35 to 64 Years | 54 (19.4%) | 30 (12.3%) |
| 65 to 74 Years | 27 (36.0%) | 26 (43.3%) |
| 75 Years and over | 30 (23.6%) | 21 (20.0%) |
Disability Class by Sex by Age in Throckmorton County
Disability Class: Hearing Difficulty
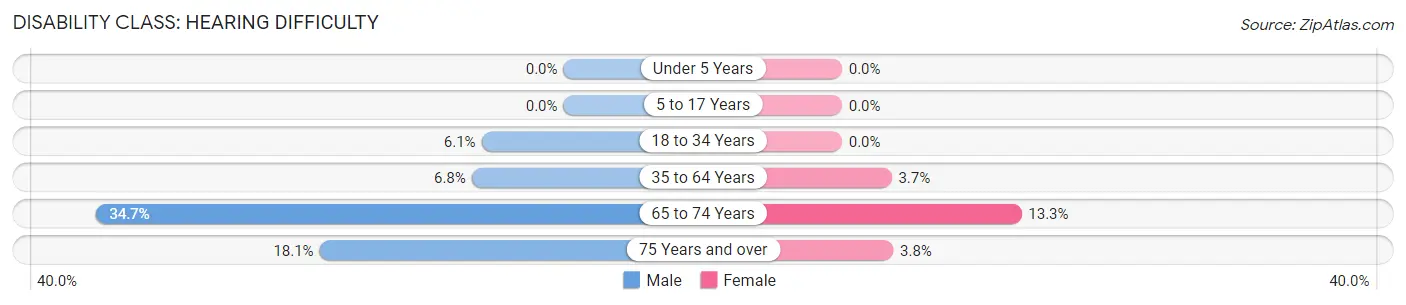
| Age Bracket | Male | Female |
| Under 5 Years | 0 (0.0%) | 0 (0.0%) |
| 5 to 17 Years | 0 (0.0%) | 0 (0.0%) |
| 18 to 34 Years | 11 (6.1%) | 0 (0.0%) |
| 35 to 64 Years | 19 (6.8%) | 9 (3.7%) |
| 65 to 74 Years | 26 (34.7%) | 8 (13.3%) |
| 75 Years and over | 23 (18.1%) | 4 (3.8%) |
Disability Class: Vision Difficulty
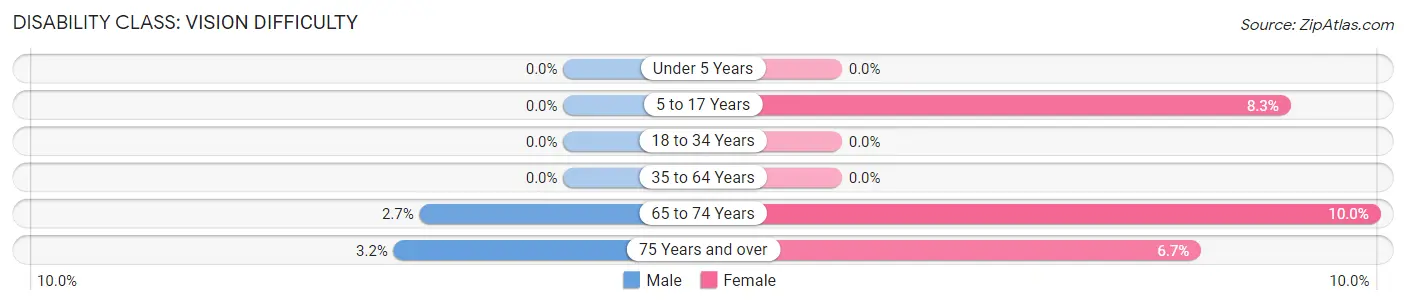
| Age Bracket | Male | Female |
| Under 5 Years | 0 (0.0%) | 0 (0.0%) |
| 5 to 17 Years | 0 (0.0%) | 6 (8.3%) |
| 18 to 34 Years | 0 (0.0%) | 0 (0.0%) |
| 35 to 64 Years | 0 (0.0%) | 0 (0.0%) |
| 65 to 74 Years | 2 (2.7%) | 6 (10.0%) |
| 75 Years and over | 4 (3.2%) | 7 (6.7%) |
Disability Class: Cognitive Difficulty
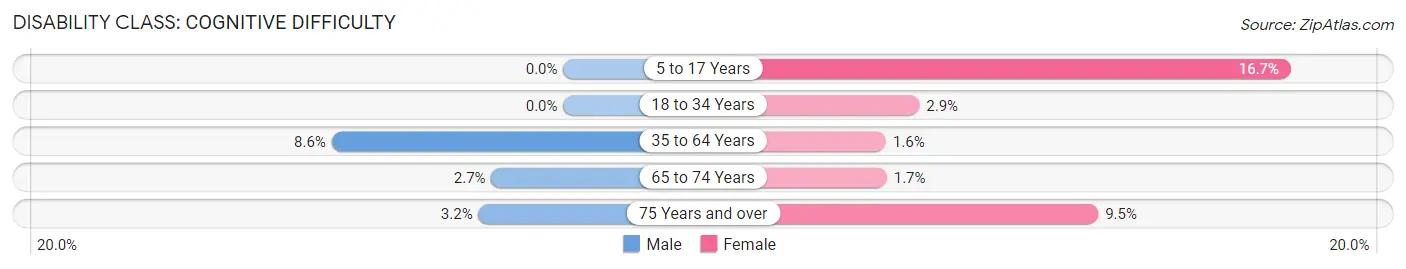
| Age Bracket | Male | Female |
| 5 to 17 Years | 0 (0.0%) | 12 (16.7%) |
| 18 to 34 Years | 0 (0.0%) | 3 (2.9%) |
| 35 to 64 Years | 24 (8.6%) | 4 (1.6%) |
| 65 to 74 Years | 2 (2.7%) | 1 (1.7%) |
| 75 Years and over | 4 (3.2%) | 10 (9.5%) |
Disability Class: Ambulatory Difficulty
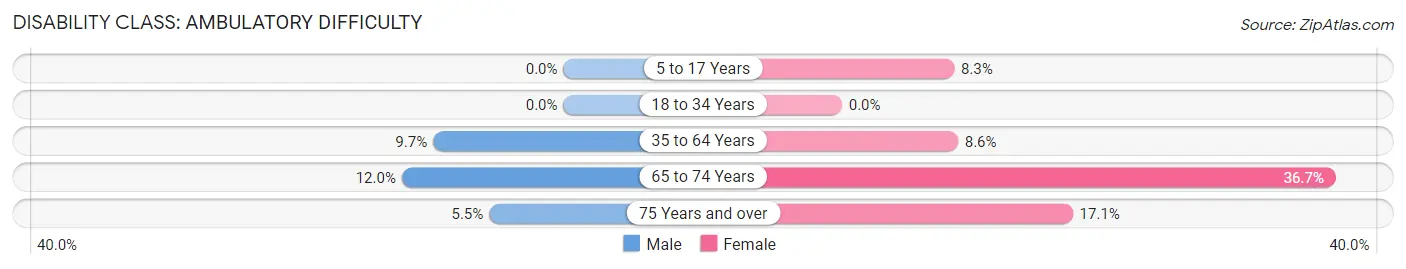
| Age Bracket | Male | Female |
| 5 to 17 Years | 0 (0.0%) | 6 (8.3%) |
| 18 to 34 Years | 0 (0.0%) | 0 (0.0%) |
| 35 to 64 Years | 27 (9.7%) | 21 (8.6%) |
| 65 to 74 Years | 9 (12.0%) | 22 (36.7%) |
| 75 Years and over | 7 (5.5%) | 18 (17.1%) |
Disability Class: Self-Care Difficulty
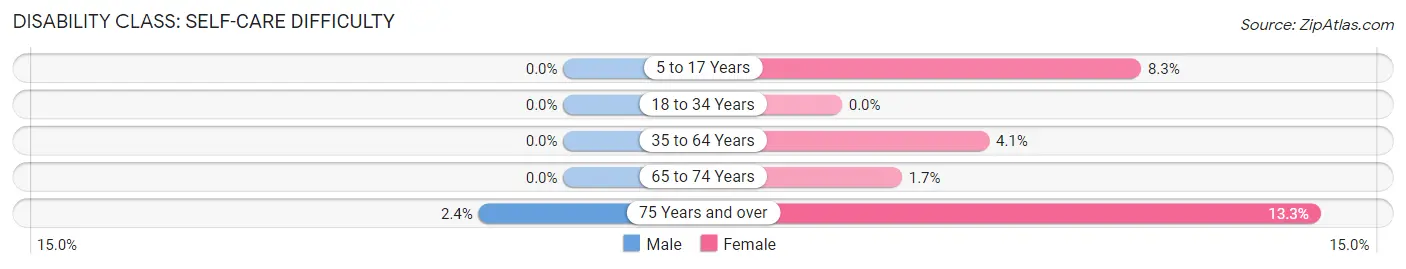
| Age Bracket | Male | Female |
| 5 to 17 Years | 0 (0.0%) | 6 (8.3%) |
| 18 to 34 Years | 0 (0.0%) | 0 (0.0%) |
| 35 to 64 Years | 0 (0.0%) | 10 (4.1%) |
| 65 to 74 Years | 0 (0.0%) | 1 (1.7%) |
| 75 Years and over | 3 (2.4%) | 14 (13.3%) |
Technology Access in Throckmorton County
Computing Device Access in Throckmorton County
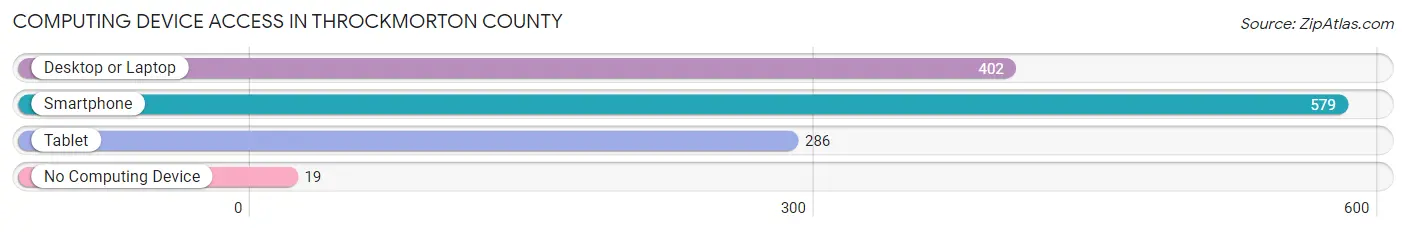
| Device Type | # Households | % Households |
| Desktop or Laptop | 402 | 63.3% |
| Smartphone | 579 | 91.2% |
| Tablet | 286 | 45.0% |
| No Computing Device | 19 | 3.0% |
| Total | 635 | 100.0% |
Internet Access in Throckmorton County
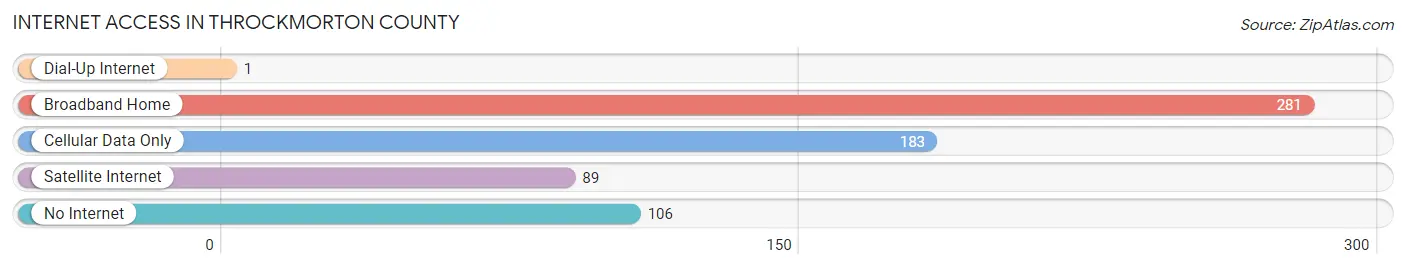
| Internet Type | # Households | % Households |
| Dial-Up Internet | 1 | 0.2% |
| Broadband Home | 281 | 44.3% |
| Cellular Data Only | 183 | 28.8% |
| Satellite Internet | 89 | 14.0% |
| No Internet | 106 | 16.7% |
| Total | 635 | 100.0% |
Throckmorton County Summary
Throckmorton County is located in the north-central region of Texas, and is part of the Wichita Falls Metropolitan Statistical Area. The county is bordered by Archer County to the north, Baylor County to the east, Young County to the south, and Haskell County to the west. The county seat is Throckmorton, and the county has a total area of 890 square miles.
History
Throckmorton County was established in 1858 and named for William E. Throckmorton, a signer of the Texas Declaration of Independence. The county was originally part of Fannin County, and was later divided into two parts, with the eastern portion becoming Archer County. The county was organized in 1879, and the town of Throckmorton was established as the county seat.
The county was largely rural until the early 20th century, when oil was discovered in the area. This led to an influx of people and businesses, and the county experienced a period of rapid growth. The population peaked in the 1940s, and has since declined.
Geography
Throckmorton County is located in the north-central region of Texas, and is part of the Wichita Falls Metropolitan Statistical Area. The county is bordered by Archer County to the north, Baylor County to the east, Young County to the south, and Haskell County to the west. The county has a total area of 890 square miles, and is mostly flat, with some rolling hills. The county is drained by the Brazos River, which forms its western boundary.
The climate of Throckmorton County is semi-arid, with hot summers and mild winters. The average annual temperature is 68°F, and the average annual precipitation is 22 inches.
Economy
The economy of Throckmorton County is largely based on agriculture and oil and gas production. The county is home to several large ranches, and the main crops grown in the area are cotton, wheat, and sorghum. The county is also home to several oil and gas fields, and oil and gas production is a major contributor to the local economy.
In addition to agriculture and oil and gas production, the county is home to several manufacturing companies, including a furniture factory and a plastics factory. The county is also home to several retail businesses, including several restaurants and a few small shops.
Demographics
As of the 2010 census, the population of Throckmorton County was 1,641, a decrease of 8.3% from the 2000 census. The population is spread out, with the largest population center being the town of Throckmorton, which has a population of 1,068. The racial makeup of the county is 94.3% White, 0.2% African American, 0.2% Native American, 0.2% Asian, 0.1% Pacific Islander, 4.2% from other races, and 0.9% from two or more races.
The median household income in Throckmorton County is $37,917, and the median family income is $45,000. The per capita income is $19,945. The unemployment rate is 4.2%. The poverty rate is 17.3%.
Common Questions
What is Per Capita Income in Throckmorton County?
Per Capita income in Throckmorton County is $30,381.
What is the Median Family Income in Throckmorton County?
Median Family Income in Throckmorton County is $68,125.
What is the Median Household income in Throckmorton County?
Median Household Income in Throckmorton County is $55,221.
What is Income or Wage Gap in Throckmorton County?
Income or Wage Gap in Throckmorton County is 14.9%.
Women in Throckmorton County earn 85.1 cents for every dollar earned by a man.
What is Inequality or Gini Index in Throckmorton County?
Inequality or Gini Index in Throckmorton County is 0.42.
What is the Total Population of Throckmorton County?
Total Population of Throckmorton County is 1,439.
What is the Total Male Population of Throckmorton County?
Total Male Population of Throckmorton County is 773.
What is the Total Female Population of Throckmorton County?
Total Female Population of Throckmorton County is 666.
What is the Ratio of Males per 100 Females in Throckmorton County?
There are 116.07 Males per 100 Females in Throckmorton County.
What is the Ratio of Females per 100 Males in Throckmorton County?
There are 86.16 Females per 100 Males in Throckmorton County.
What is the Median Population Age in Throckmorton County?
Median Population Age in Throckmorton County is 48.8 Years.
What is the Average Family Size in Throckmorton County
Average Family Size in Throckmorton County is 3.2 People.
What is the Average Household Size in Throckmorton County
Average Household Size in Throckmorton County is 2.3 People.
How Large is the Labor Force in Throckmorton County?
There are 753 People in the Labor Forcein in Throckmorton County.
What is the Percentage of People in the Labor Force in Throckmorton County?
61.2% of People are in the Labor Force in Throckmorton County.
What is the Unemployment Rate in Throckmorton County?
Unemployment Rate in Throckmorton County is 2.5%.