Terry County, TX Map & Demographics
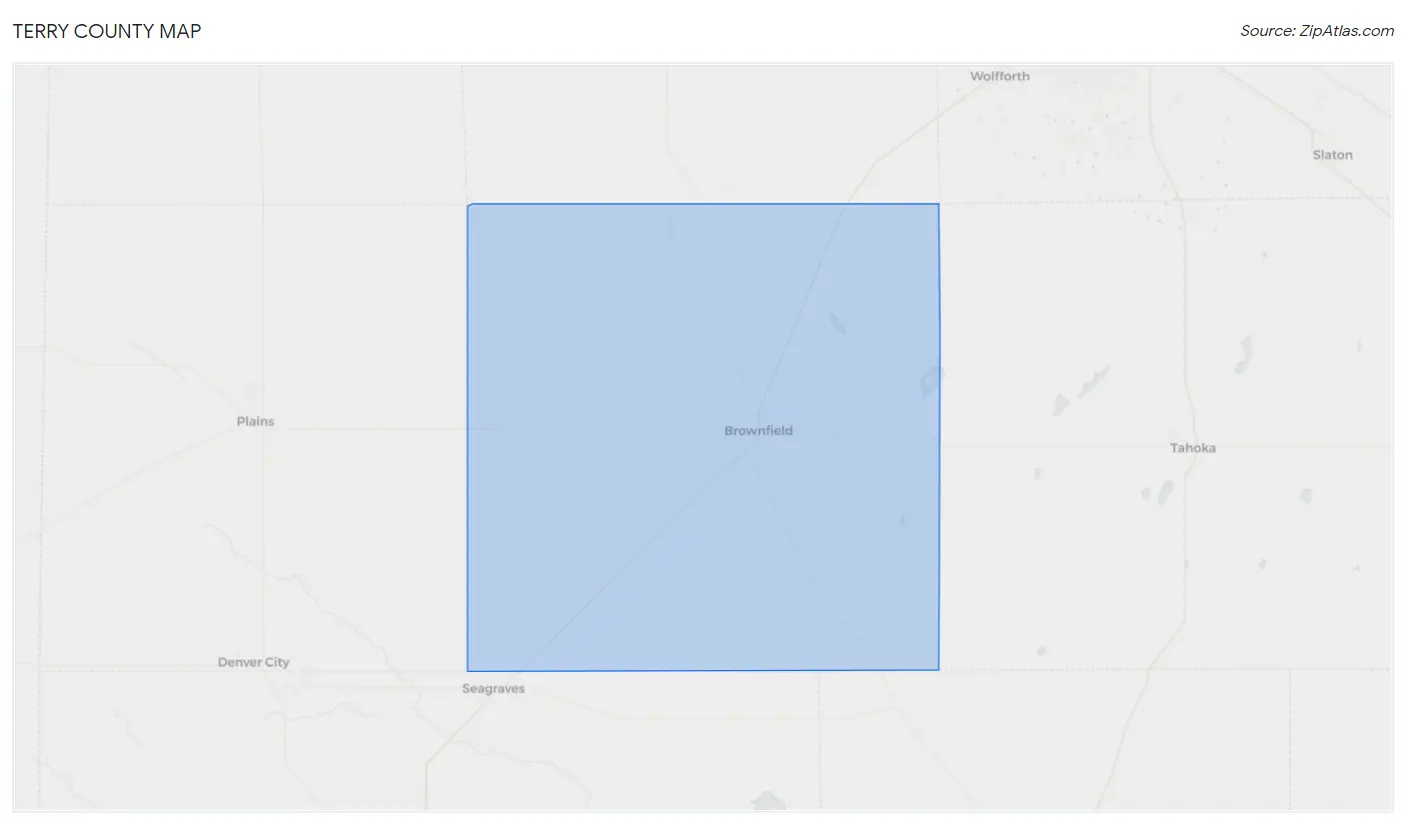
Terry County Map
Terry County Overview
$25,206
PER CAPITA INCOME
$54,138
AVG FAMILY INCOME
$42,694
AVG HOUSEHOLD INCOME
36.8%
WAGE / INCOME GAP [ % ]
63.2¢/ $1
WAGE / INCOME GAP [ $ ]
0.47
INEQUALITY / GINI INDEX
11,816
TOTAL POPULATION
6,456
MALE POPULATION
5,360
FEMALE POPULATION
120.45
MALES / 100 FEMALES
83.02
FEMALES / 100 MALES
35.4
MEDIAN AGE
3.3
AVG FAMILY SIZE
2.6
AVG HOUSEHOLD SIZE
5,238
LABOR FORCE [ PEOPLE ]
59.1%
PERCENT IN LABOR FORCE
4.8%
UNEMPLOYMENT RATE
Terry County Area Codes
Income in Terry County
Income Overview in Terry County
Per Capita Income in Terry County is $25,206, while median incomes of families and households are $54,138 and $42,694 respectively.
| Characteristic | Number | Measure |
| Per Capita Income | 11,816 | $25,206 |
| Median Family Income | 2,818 | $54,138 |
| Mean Family Income | 2,818 | $79,670 |
| Median Household Income | 4,170 | $42,694 |
| Mean Household Income | 4,170 | $67,747 |
| Income Deficit | 2,818 | $0 |
| Wage / Income Gap (%) | 11,816 | 36.80% |
| Wage / Income Gap ($) | 11,816 | 63.20¢ per $1 |
| Gini / Inequality Index | 11,816 | 0.47 |
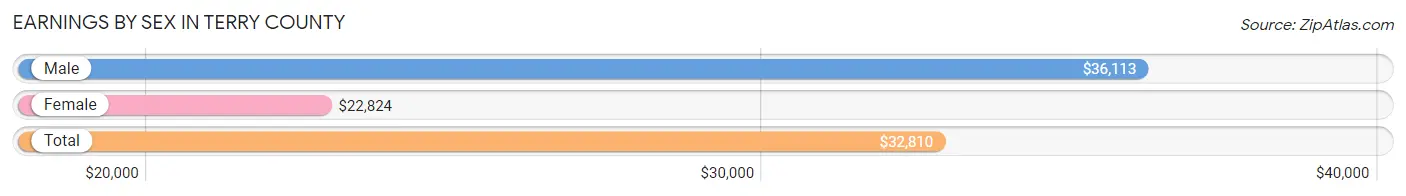
Earnings by Sex in Terry County
Average Earnings in Terry County are $32,810, $36,113 for men and $22,824 for women, a difference of 36.8%.
| Sex | Number | Average Earnings |
| Male | 3,244 (56.6%) | $36,113 |
| Female | 2,488 (43.4%) | $22,824 |
| Total | 5,732 (100.0%) | $32,810 |
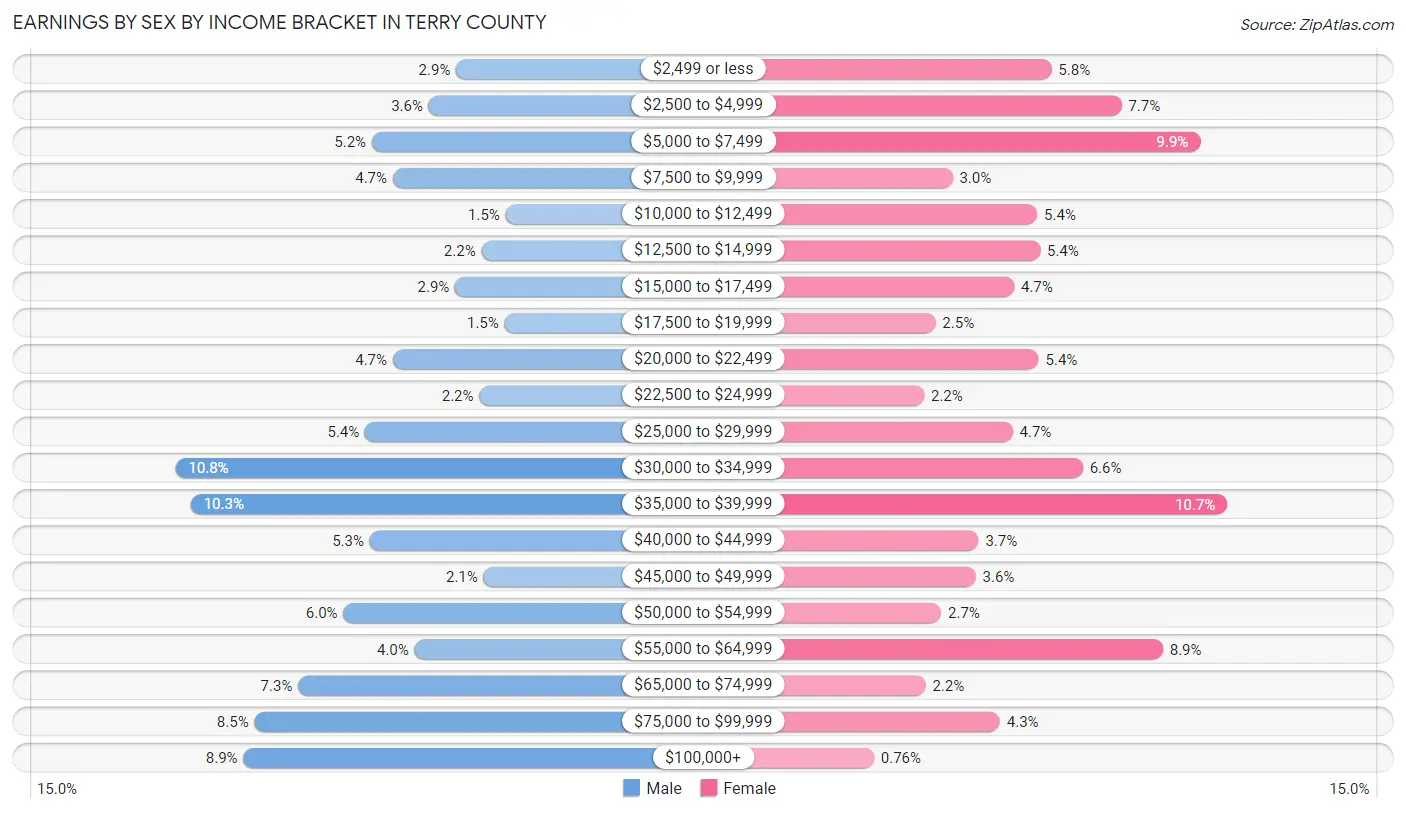
Earnings by Sex by Income Bracket in Terry County
The most common earnings brackets in Terry County are $30,000 to $34,999 for men (349 | 10.8%) and $35,000 to $39,999 for women (266 | 10.7%).
| Income | Male | Female |
| $2,499 or less | 93 (2.9%) | 143 (5.8%) |
| $2,500 to $4,999 | 118 (3.6%) | 192 (7.7%) |
| $5,000 to $7,499 | 170 (5.2%) | 247 (9.9%) |
| $7,500 to $9,999 | 151 (4.6%) | 74 (3.0%) |
| $10,000 to $12,499 | 48 (1.5%) | 133 (5.3%) |
| $12,500 to $14,999 | 70 (2.2%) | 135 (5.4%) |
| $15,000 to $17,499 | 94 (2.9%) | 117 (4.7%) |
| $17,500 to $19,999 | 49 (1.5%) | 62 (2.5%) |
| $20,000 to $22,499 | 151 (4.6%) | 134 (5.4%) |
| $22,500 to $24,999 | 72 (2.2%) | 54 (2.2%) |
| $25,000 to $29,999 | 176 (5.4%) | 116 (4.7%) |
| $30,000 to $34,999 | 349 (10.8%) | 165 (6.6%) |
| $35,000 to $39,999 | 335 (10.3%) | 266 (10.7%) |
| $40,000 to $44,999 | 172 (5.3%) | 92 (3.7%) |
| $45,000 to $49,999 | 68 (2.1%) | 90 (3.6%) |
| $50,000 to $54,999 | 196 (6.0%) | 66 (2.6%) |
| $55,000 to $64,999 | 131 (4.0%) | 221 (8.9%) |
| $65,000 to $74,999 | 237 (7.3%) | 55 (2.2%) |
| $75,000 to $99,999 | 277 (8.5%) | 107 (4.3%) |
| $100,000+ | 287 (8.8%) | 19 (0.8%) |
| Total | 3,244 (100.0%) | 2,488 (100.0%) |
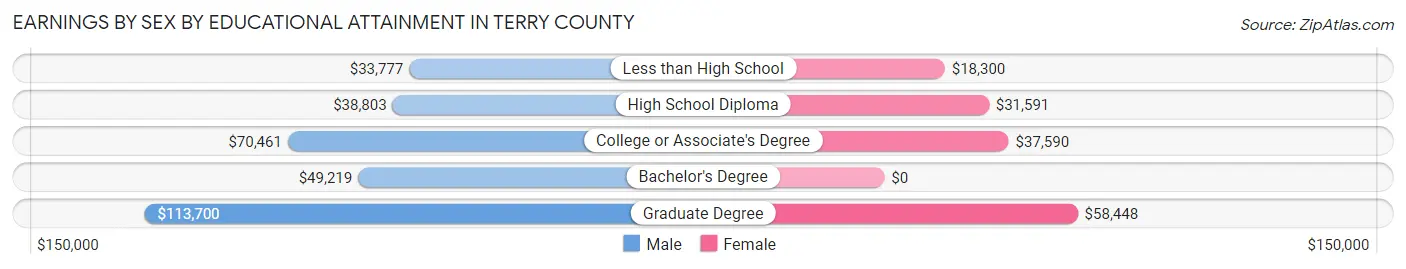
Earnings by Sex by Educational Attainment in Terry County
Average earnings in Terry County are $39,044 for men and $32,644 for women, a difference of 16.4%. Men with an educational attainment of graduate degree enjoy the highest average annual earnings of $113,700, while those with less than high school education earn the least with $33,777. Women with an educational attainment of graduate degree earn the most with the average annual earnings of $58,448, while those with less than high school education have the smallest earnings of $18,300.
| Educational Attainment | Male Income | Female Income |
| Less than High School | $33,777 | $18,300 |
| High School Diploma | $38,803 | $31,591 |
| College or Associate's Degree | $70,461 | $37,590 |
| Bachelor's Degree | $49,219 | $0 |
| Graduate Degree | $113,700 | $58,448 |
| Total | $39,044 | $32,644 |
Family Income in Terry County
Family Income Brackets in Terry County
According to the Terry County family income data, there are 575 families falling into the $35,000 to $49,999 income range, which is the most common income bracket and makes up 20.4% of all families. Conversely, the $10,000 to $14,999 income bracket is the least frequent group with only 70 families (2.5%) belonging to this category.
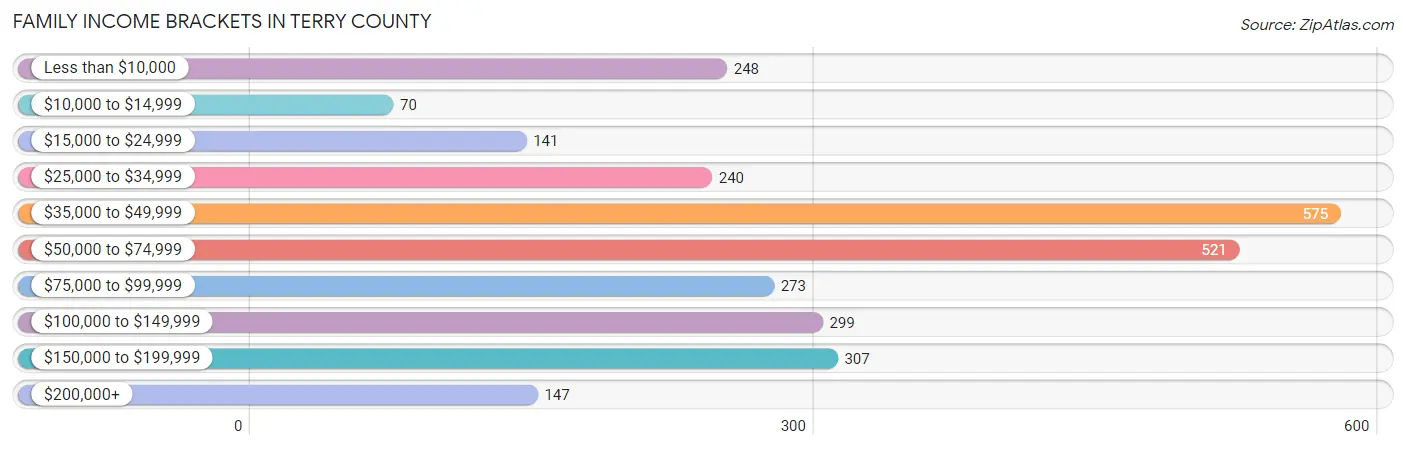
| Income Bracket | # Families | % Families |
| Less than $10,000 | 248 | 8.8% |
| $10,000 to $14,999 | 70 | 2.5% |
| $15,000 to $24,999 | 141 | 5.0% |
| $25,000 to $34,999 | 240 | 8.5% |
| $35,000 to $49,999 | 575 | 20.4% |
| $50,000 to $74,999 | 521 | 18.5% |
| $75,000 to $99,999 | 273 | 9.7% |
| $100,000 to $149,999 | 299 | 10.6% |
| $150,000 to $199,999 | 307 | 10.9% |
| $200,000+ | 147 | 5.2% |
Family Income by Famaliy Size in Terry County
4-person families (438 | 15.5%) account for the highest median family income in Terry County with $83,393 per family, while 2-person families (1,136 | 40.3%) have the highest median income of $33,000 per family member.
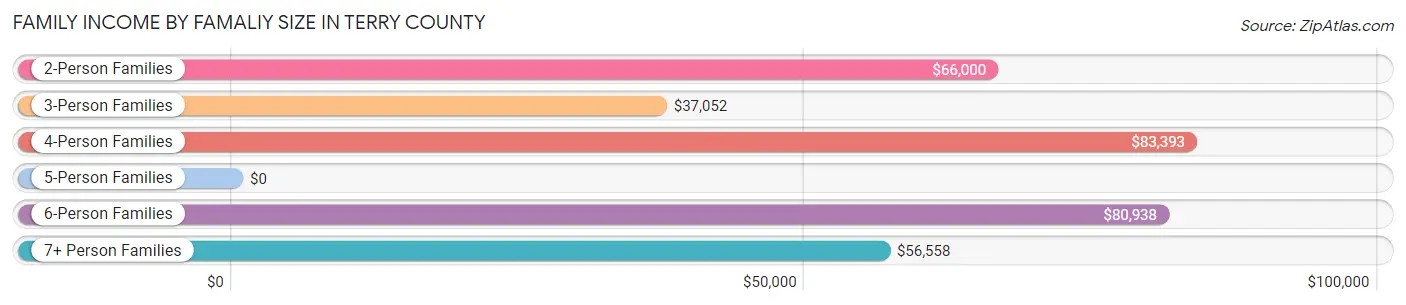
| Income Bracket | # Families | Median Income |
| 2-Person Families | 1,136 (40.3%) | $66,000 |
| 3-Person Families | 803 (28.5%) | $37,052 |
| 4-Person Families | 438 (15.5%) | $83,393 |
| 5-Person Families | 267 (9.5%) | $0 |
| 6-Person Families | 59 (2.1%) | $80,938 |
| 7+ Person Families | 115 (4.1%) | $56,558 |
| Total | 2,818 (100.0%) | $54,138 |
Family Income by Number of Earners in Terry County
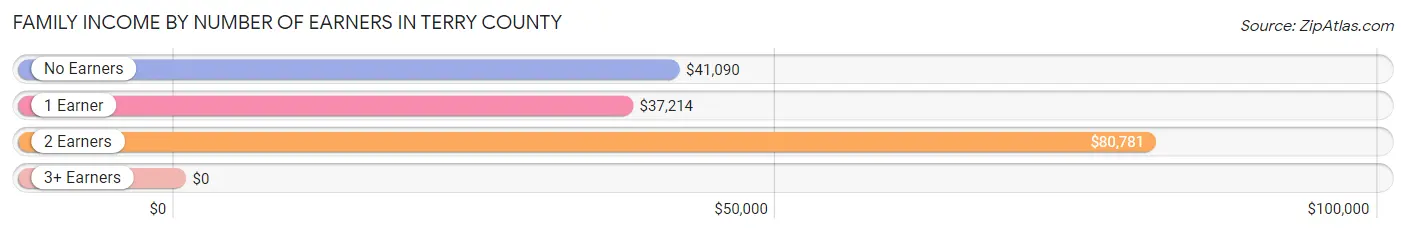
| Number of Earners | # Families | Median Income |
| No Earners | 441 (15.7%) | $41,090 |
| 1 Earner | 1,085 (38.5%) | $37,214 |
| 2 Earners | 937 (33.3%) | $80,781 |
| 3+ Earners | 355 (12.6%) | $0 |
| Total | 2,818 (100.0%) | $54,138 |
Household Income in Terry County
Household Income Brackets in Terry County
With 880 households falling in the category, the $35,000 to $49,999 income range is the most frequent in Terry County, accounting for 21.1% of all households. In contrast, only 154 households (3.7%) fall into the $200,000+ income bracket, making it the least populous group.
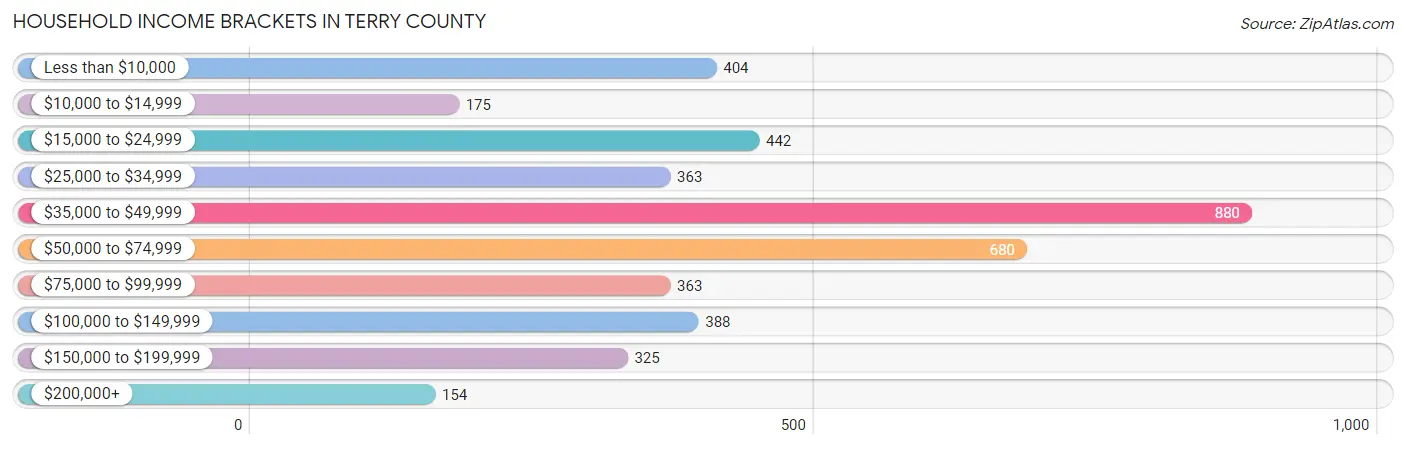
| Income Bracket | # Households | % Households |
| Less than $10,000 | 404 | 9.7% |
| $10,000 to $14,999 | 175 | 4.2% |
| $15,000 to $24,999 | 442 | 10.6% |
| $25,000 to $34,999 | 363 | 8.7% |
| $35,000 to $49,999 | 880 | 21.1% |
| $50,000 to $74,999 | 680 | 16.3% |
| $75,000 to $99,999 | 363 | 8.7% |
| $100,000 to $149,999 | 388 | 9.3% |
| $150,000 to $199,999 | 325 | 7.8% |
| $200,000+ | 154 | 3.7% |
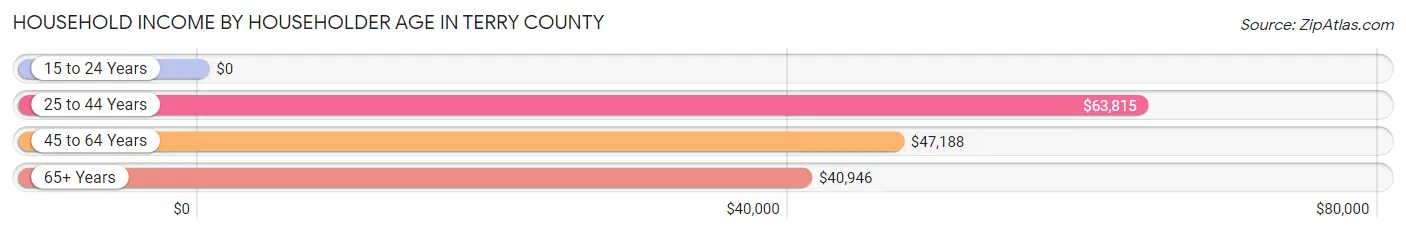
Household Income by Householder Age in Terry County
The median household income in Terry County is $42,694, with the highest median household income of $63,815 found in the 25 to 44 years age bracket for the primary householder. A total of 1,239 households (29.7%) fall into this category. Meanwhile, the 15 to 24 years age bracket for the primary householder has the lowest median household income of $0, with 308 households (7.4%) in this group.
| Income Bracket | # Households | Median Income |
| 15 to 24 Years | 308 (7.4%) | $0 |
| 25 to 44 Years | 1,239 (29.7%) | $63,815 |
| 45 to 64 Years | 1,532 (36.7%) | $47,188 |
| 65+ Years | 1,091 (26.2%) | $40,946 |
| Total | 4,170 (100.0%) | $42,694 |
Poverty in Terry County
Income Below Poverty by Sex and Age in Terry County
With 17.9% poverty level for males and 27.1% for females among the residents of Terry County, 5 year old males and 6 to 11 year old females are the most vulnerable to poverty, with 141 males (63.8%) and 309 females (56.3%) in their respective age groups living below the poverty level.
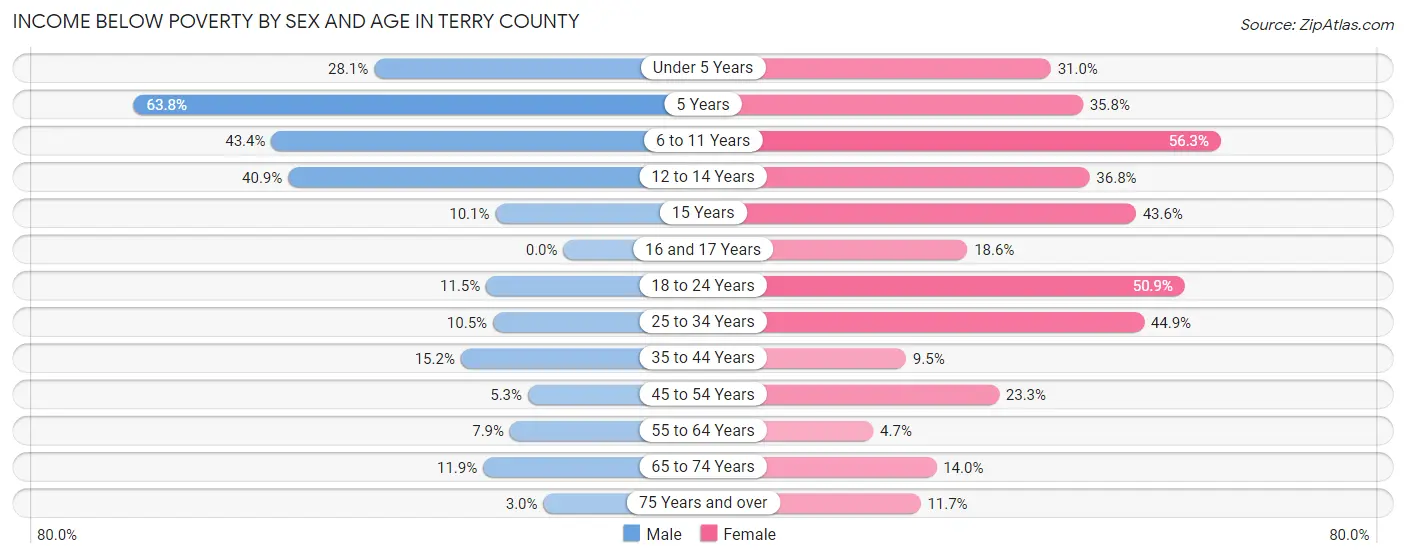
| Age Bracket | Male | Female |
| Under 5 Years | 179 (28.1%) | 67 (31.0%) |
| 5 Years | 141 (63.8%) | 39 (35.8%) |
| 6 to 11 Years | 180 (43.4%) | 309 (56.3%) |
| 12 to 14 Years | 132 (40.9%) | 82 (36.8%) |
| 15 Years | 20 (10.1%) | 24 (43.6%) |
| 16 and 17 Years | 0 (0.0%) | 35 (18.6%) |
| 18 to 24 Years | 64 (11.5%) | 273 (50.9%) |
| 25 to 34 Years | 66 (10.5%) | 262 (44.9%) |
| 35 to 44 Years | 98 (15.2%) | 69 (9.5%) |
| 45 to 54 Years | 33 (5.3%) | 128 (23.3%) |
| 55 to 64 Years | 52 (7.9%) | 30 (4.7%) |
| 65 to 74 Years | 55 (11.9%) | 68 (14.0%) |
| 75 Years and over | 8 (3.0%) | 50 (11.7%) |
| Total | 1,028 (17.9%) | 1,436 (27.1%) |
Income Above Poverty by Sex and Age in Terry County
According to the poverty statistics in Terry County, males aged 16 and 17 years and females aged 55 to 64 years are the age groups that are most secure financially, with 100.0% of males and 95.3% of females in these age groups living above the poverty line.
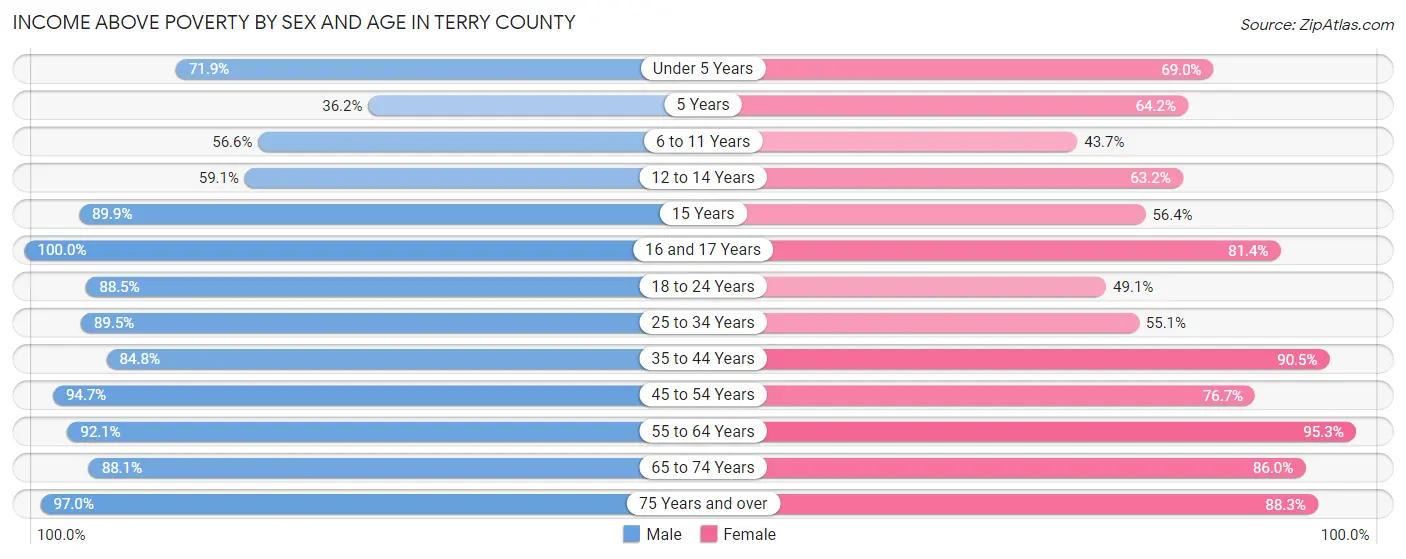
| Age Bracket | Male | Female |
| Under 5 Years | 458 (71.9%) | 149 (69.0%) |
| 5 Years | 80 (36.2%) | 70 (64.2%) |
| 6 to 11 Years | 235 (56.6%) | 240 (43.7%) |
| 12 to 14 Years | 191 (59.1%) | 141 (63.2%) |
| 15 Years | 178 (89.9%) | 31 (56.4%) |
| 16 and 17 Years | 95 (100.0%) | 153 (81.4%) |
| 18 to 24 Years | 494 (88.5%) | 263 (49.1%) |
| 25 to 34 Years | 565 (89.5%) | 322 (55.1%) |
| 35 to 44 Years | 545 (84.8%) | 656 (90.5%) |
| 45 to 54 Years | 593 (94.7%) | 421 (76.7%) |
| 55 to 64 Years | 603 (92.1%) | 614 (95.3%) |
| 65 to 74 Years | 406 (88.1%) | 417 (86.0%) |
| 75 Years and over | 261 (97.0%) | 378 (88.3%) |
| Total | 4,704 (82.1%) | 3,855 (72.9%) |
Income Below Poverty Among Married-Couple Families in Terry County
The poverty statistics for married-couple families in Terry County show that 10.3% or 189 of the total 1,830 families live below the poverty line. Families with 5 or more children have the highest poverty rate of 93.2%, comprising of 82 families. On the other hand, families with 1 or 2 children have the lowest poverty rate of 0.9%, which includes 4 families.
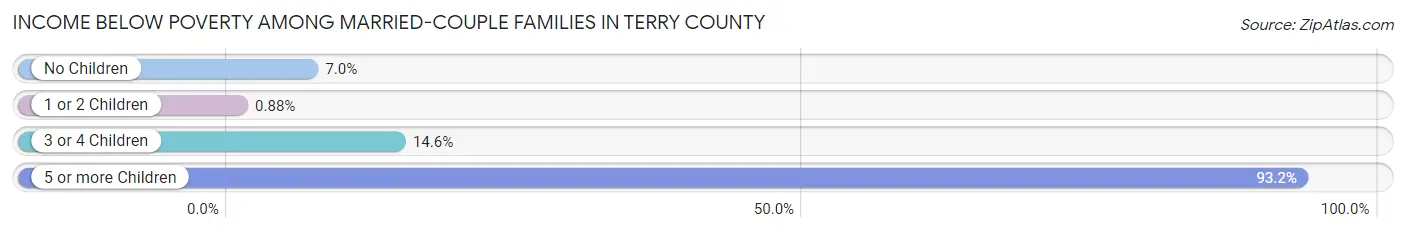
| Children | Above Poverty | Below Poverty |
| No Children | 1,036 (93.0%) | 78 (7.0%) |
| 1 or 2 Children | 453 (99.1%) | 4 (0.9%) |
| 3 or 4 Children | 146 (85.4%) | 25 (14.6%) |
| 5 or more Children | 6 (6.8%) | 82 (93.2%) |
| Total | 1,641 (89.7%) | 189 (10.3%) |
Income Below Poverty Among Single-Parent Households in Terry County
According to the poverty data in Terry County, 9.5% or 18 single-father households and 42.0% or 335 single-mother households are living below the poverty line. Among single-father households, those with 1 or 2 children have the highest poverty rate, with 18 households (16.5%) experiencing poverty. Likewise, among single-mother households, those with 3 or 4 children have the highest poverty rate, with 158 households (100.0%) falling below the poverty line.
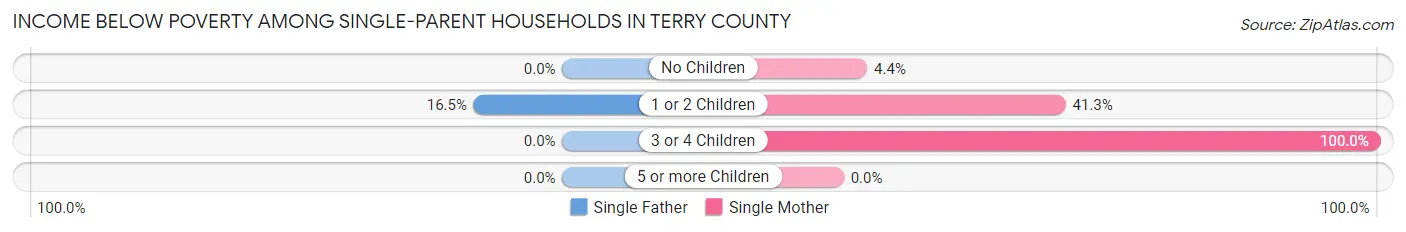
| Children | Single Father | Single Mother |
| No Children | 0 (0.0%) | 10 (4.4%) |
| 1 or 2 Children | 18 (16.5%) | 167 (41.3%) |
| 3 or 4 Children | 0 (0.0%) | 158 (100.0%) |
| 5 or more Children | 0 (0.0%) | 0 (0.0%) |
| Total | 18 (9.5%) | 335 (42.0%) |
Income Below Poverty Among Married-Couple vs Single-Parent Households in Terry County
The poverty data for Terry County shows that 189 of the married-couple family households (10.3%) and 353 of the single-parent households (35.7%) are living below the poverty level. Within the married-couple family households, those with 5 or more children have the highest poverty rate, with 82 households (93.2%) falling below the poverty line. Among the single-parent households, those with 3 or 4 children have the highest poverty rate, with 158 household (97.5%) living below poverty.
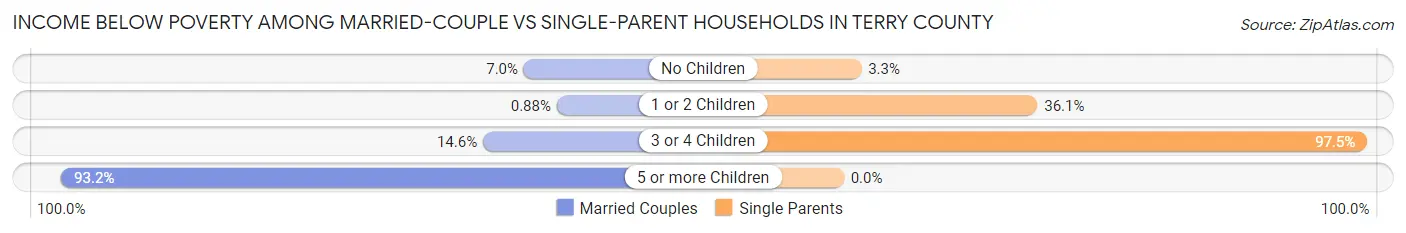
| Children | Married-Couple Families | Single-Parent Households |
| No Children | 78 (7.0%) | 10 (3.3%) |
| 1 or 2 Children | 4 (0.9%) | 185 (36.1%) |
| 3 or 4 Children | 25 (14.6%) | 158 (97.5%) |
| 5 or more Children | 82 (93.2%) | 0 (0.0%) |
| Total | 189 (10.3%) | 353 (35.7%) |
Race in Terry County
The most populous races in Terry County are White / Caucasian (7,500 | 63.5%), Hispanic or Latino (6,733 | 57.0%), and Two or more Races (3,244 | 27.5%).
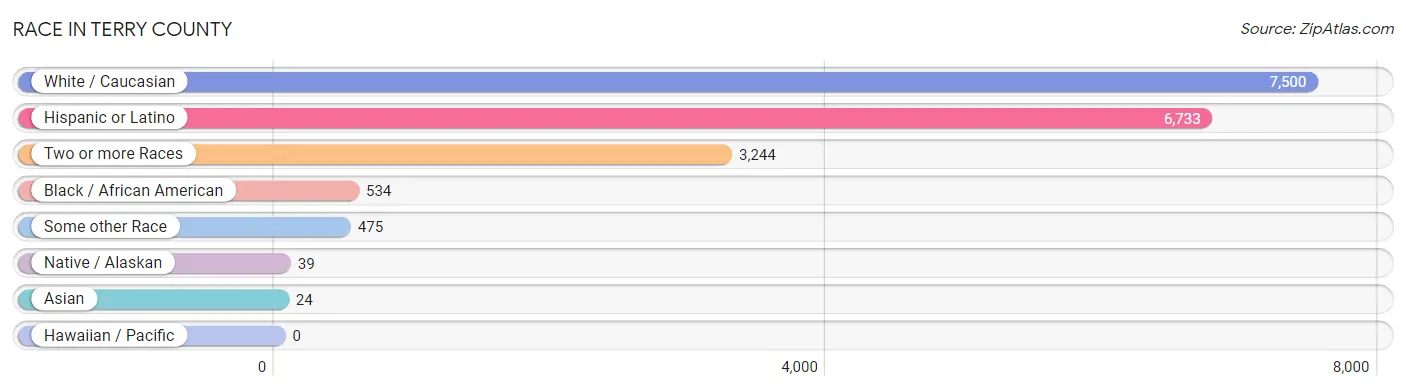
| Race | # Population | % Population |
| Asian | 24 | 0.2% |
| Black / African American | 534 | 4.5% |
| Hawaiian / Pacific | 0 | 0.0% |
| Hispanic or Latino | 6,733 | 57.0% |
| Native / Alaskan | 39 | 0.3% |
| White / Caucasian | 7,500 | 63.5% |
| Two or more Races | 3,244 | 27.5% |
| Some other Race | 475 | 4.0% |
| Total | 11,816 | 100.0% |
Ancestry in Terry County
The most populous ancestries reported in Terry County are Mexican (5,817 | 49.2%), American (1,220 | 10.3%), German (659 | 5.6%), Irish (509 | 4.3%), and English (504 | 4.3%), together accounting for 73.7% of all Terry County residents.
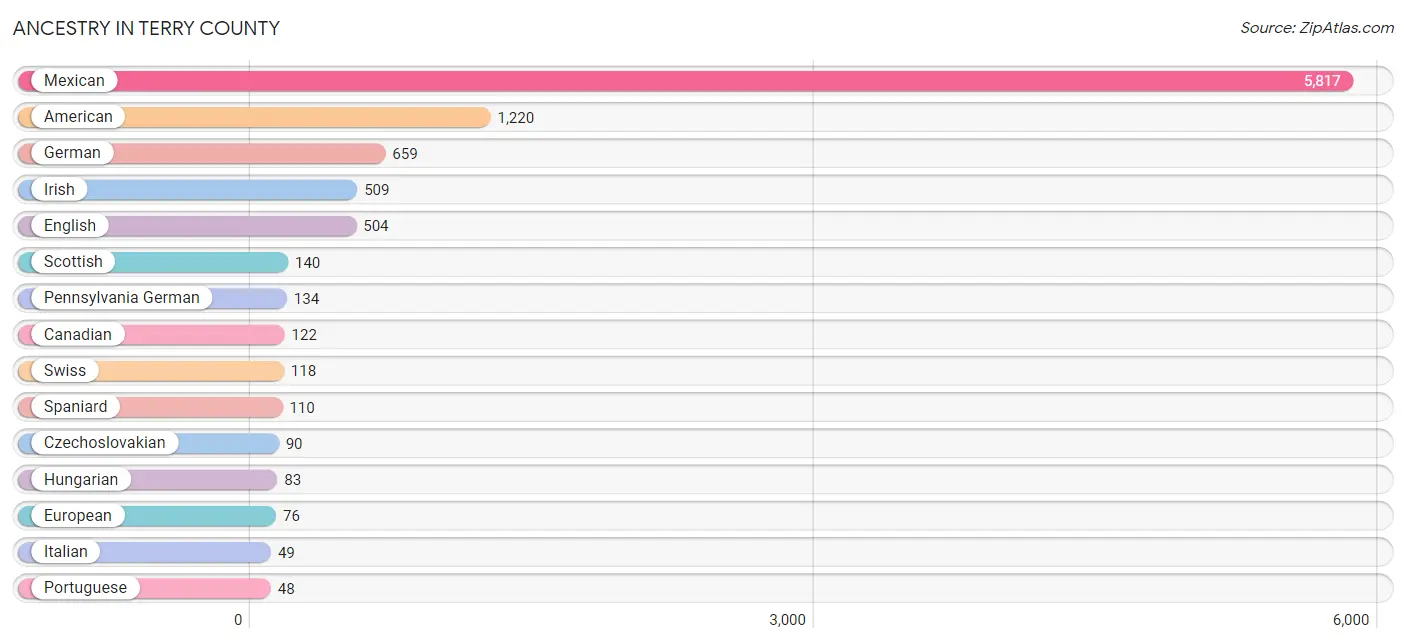
| Ancestry | # Population | % Population |
| African | 16 | 0.1% |
| American | 1,220 | 10.3% |
| Apache | 2 | 0.0% |
| Arab | 5 | 0.0% |
| Bhutanese | 3 | 0.0% |
| Blackfeet | 9 | 0.1% |
| British | 28 | 0.2% |
| Canadian | 122 | 1.0% |
| Central American | 9 | 0.1% |
| Central American Indian | 10 | 0.1% |
| Cherokee | 5 | 0.0% |
| Chickasaw | 9 | 0.1% |
| Comanche | 2 | 0.0% |
| Czech | 8 | 0.1% |
| Czechoslovakian | 90 | 0.8% |
| Dominican | 13 | 0.1% |
| Dutch | 13 | 0.1% |
| English | 504 | 4.3% |
| European | 76 | 0.6% |
| French | 27 | 0.2% |
| German | 659 | 5.6% |
| Guatemalan | 9 | 0.1% |
| Haitian | 12 | 0.1% |
| Hungarian | 83 | 0.7% |
| Iraqi | 5 | 0.0% |
| Irish | 509 | 4.3% |
| Italian | 49 | 0.4% |
| Jamaican | 12 | 0.1% |
| Korean | 30 | 0.3% |
| Mexican | 5,817 | 49.2% |
| Mexican American Indian | 2 | 0.0% |
| Norwegian | 6 | 0.1% |
| Pennsylvania German | 134 | 1.1% |
| Portuguese | 48 | 0.4% |
| Puerto Rican | 4 | 0.0% |
| Russian | 4 | 0.0% |
| Scandinavian | 11 | 0.1% |
| Scotch-Irish | 45 | 0.4% |
| Scottish | 140 | 1.2% |
| Sioux | 5 | 0.0% |
| Spaniard | 110 | 0.9% |
| Spanish | 7 | 0.1% |
| Sri Lankan | 4 | 0.0% |
| Subsaharan African | 16 | 0.1% |
| Swedish | 27 | 0.2% |
| Swiss | 118 | 1.0% |
| Tohono O'Odham | 8 | 0.1% |
| Ute | 10 | 0.1% | View All 48 Rows |
Immigrants in Terry County
The most numerous immigrant groups reported in Terry County came from Latin America (1,129 | 9.6%), Central America (1,122 | 9.5%), Mexico (1,122 | 9.5%), Asia (22 | 0.2%), and South Eastern Asia (22 | 0.2%), together accounting for 28.9% of all Terry County residents.
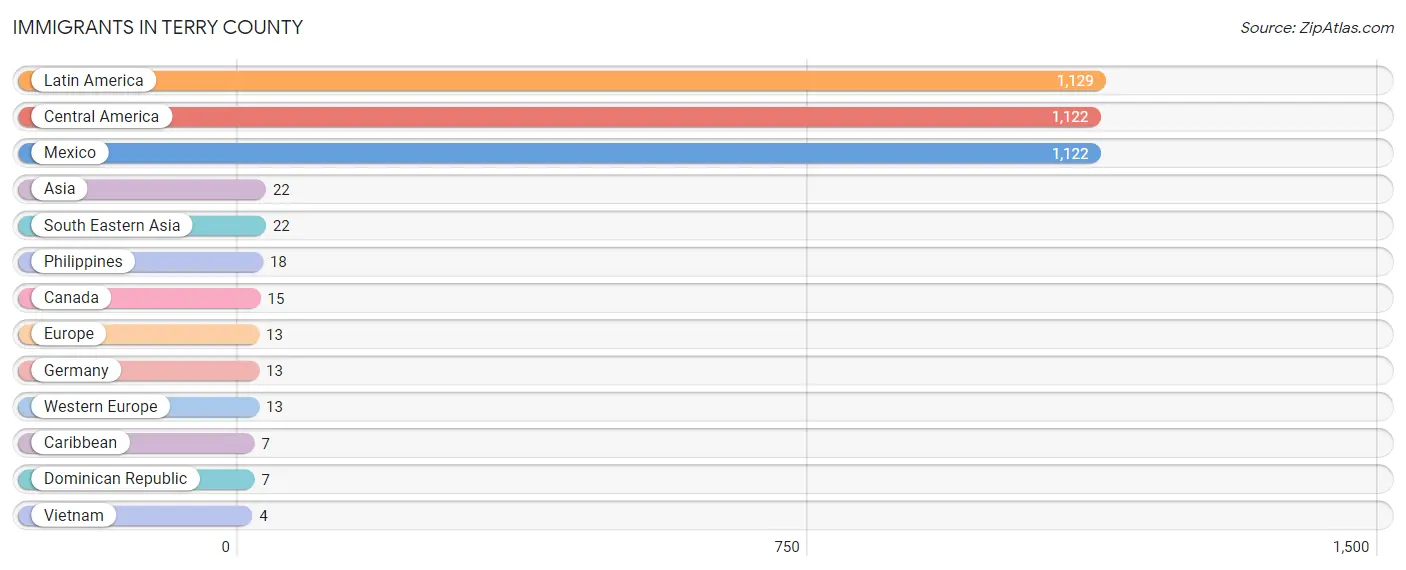
| Immigration Origin | # Population | % Population |
| Asia | 22 | 0.2% |
| Canada | 15 | 0.1% |
| Caribbean | 7 | 0.1% |
| Central America | 1,122 | 9.5% |
| Dominican Republic | 7 | 0.1% |
| Europe | 13 | 0.1% |
| Germany | 13 | 0.1% |
| Latin America | 1,129 | 9.6% |
| Mexico | 1,122 | 9.5% |
| Philippines | 18 | 0.2% |
| South Eastern Asia | 22 | 0.2% |
| Vietnam | 4 | 0.0% |
| Western Europe | 13 | 0.1% | View All 13 Rows |
Sex and Age in Terry County
Sex and Age in Terry County
The most populous age groups in Terry County are Under 5 Years (637 | 9.9%) for men and 5 to 9 Years (576 | 10.7%) for women.
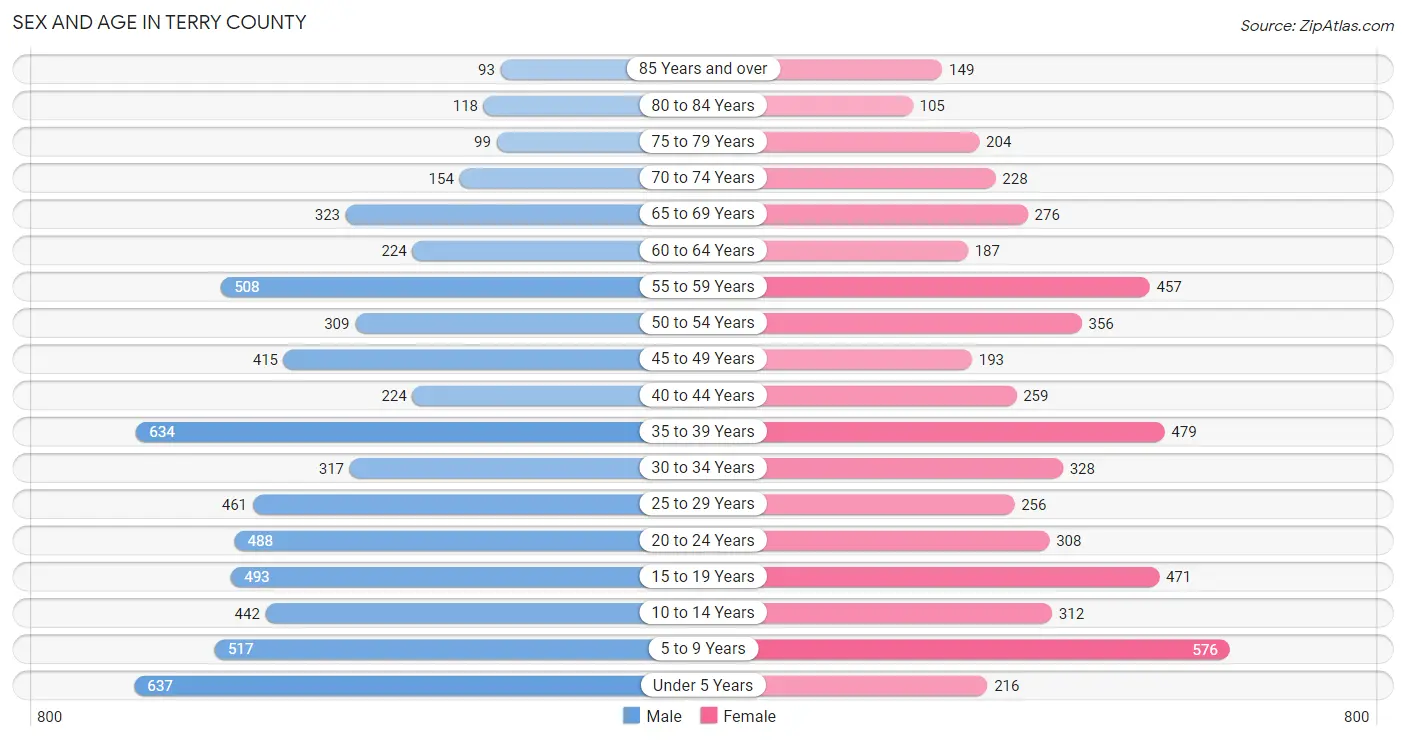
| Age Bracket | Male | Female |
| Under 5 Years | 637 (9.9%) | 216 (4.0%) |
| 5 to 9 Years | 517 (8.0%) | 576 (10.7%) |
| 10 to 14 Years | 442 (6.9%) | 312 (5.8%) |
| 15 to 19 Years | 493 (7.6%) | 471 (8.8%) |
| 20 to 24 Years | 488 (7.6%) | 308 (5.8%) |
| 25 to 29 Years | 461 (7.1%) | 256 (4.8%) |
| 30 to 34 Years | 317 (4.9%) | 328 (6.1%) |
| 35 to 39 Years | 634 (9.8%) | 479 (8.9%) |
| 40 to 44 Years | 224 (3.5%) | 259 (4.8%) |
| 45 to 49 Years | 415 (6.4%) | 193 (3.6%) |
| 50 to 54 Years | 309 (4.8%) | 356 (6.6%) |
| 55 to 59 Years | 508 (7.9%) | 457 (8.5%) |
| 60 to 64 Years | 224 (3.5%) | 187 (3.5%) |
| 65 to 69 Years | 323 (5.0%) | 276 (5.1%) |
| 70 to 74 Years | 154 (2.4%) | 228 (4.3%) |
| 75 to 79 Years | 99 (1.5%) | 204 (3.8%) |
| 80 to 84 Years | 118 (1.8%) | 105 (2.0%) |
| 85 Years and over | 93 (1.4%) | 149 (2.8%) |
| Total | 6,456 (100.0%) | 5,360 (100.0%) |
Families and Households in Terry County
Median Family Size in Terry County
The median family size in Terry County is 3.32 persons per family, with married-couple families (1,830 | 64.9%) accounting for the largest median family size of 3.39 persons per family. On the other hand, single male/father families (190 | 6.7%) represent the smallest median family size with 3.03 persons per family.
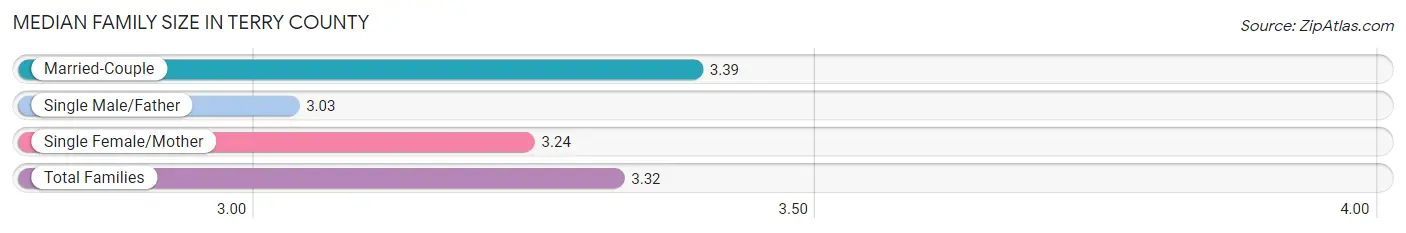
| Family Type | # Families | Family Size |
| Married-Couple | 1,830 (64.9%) | 3.39 |
| Single Male/Father | 190 (6.7%) | 3.03 |
| Single Female/Mother | 798 (28.3%) | 3.24 |
| Total Families | 2,818 (100.0%) | 3.32 |
Median Household Size in Terry County
The median household size in Terry County is 2.65 persons per household, with married-couple households (1,830 | 43.9%) accounting for the largest median household size of 3.4 persons per household. non-family households (1,352 | 32.4%) represent the smallest median household size with 1.15 persons per household.
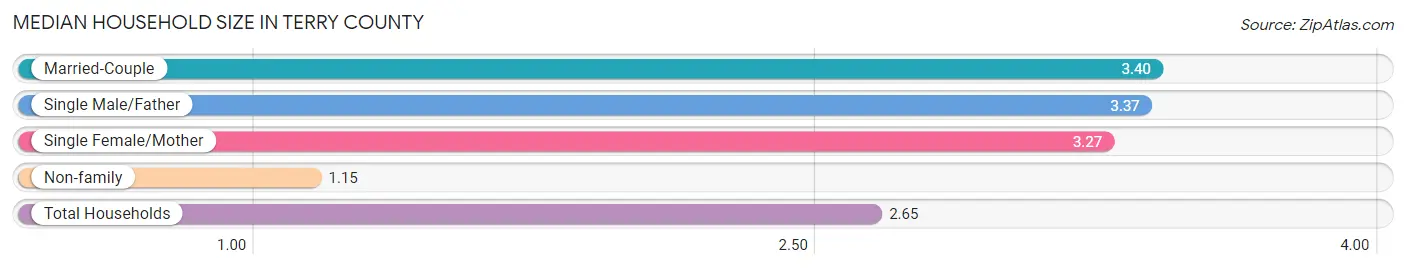
| Household Type | # Households | Household Size |
| Married-Couple | 1,830 (43.9%) | 3.40 |
| Single Male/Father | 190 (4.6%) | 3.37 |
| Single Female/Mother | 798 (19.1%) | 3.27 |
| Non-family | 1,352 (32.4%) | 1.15 |
| Total Households | 4,170 (100.0%) | 2.65 |
Household Size by Marriage Status in Terry County
Out of a total of 4,170 households in Terry County, 2,818 (67.6%) are family households, while 1,352 (32.4%) are nonfamily households. The most numerous type of family households are 2-person households, comprising 1,133, and the most common type of nonfamily households are 1-person households, comprising 1,155.
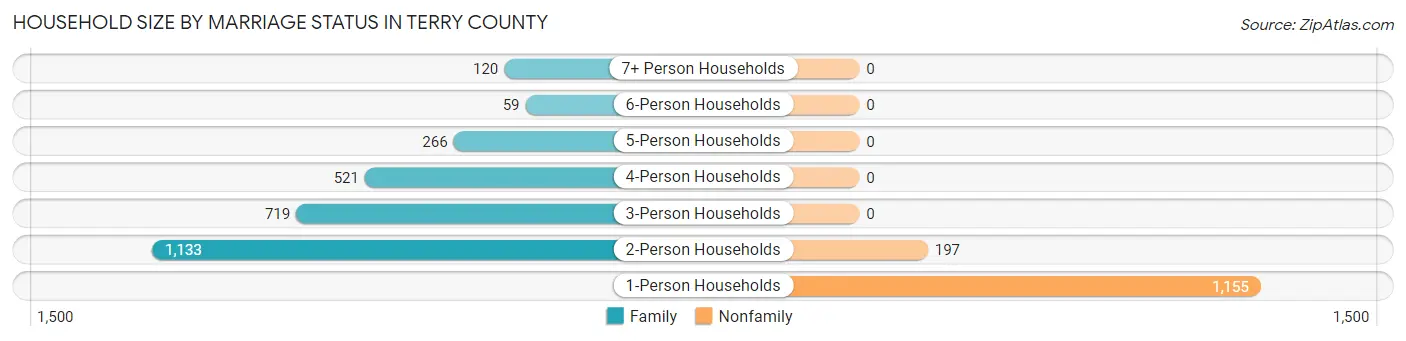
| Household Size | Family Households | Nonfamily Households |
| 1-Person Households | - | 1,155 (27.7%) |
| 2-Person Households | 1,133 (27.2%) | 197 (4.7%) |
| 3-Person Households | 719 (17.2%) | 0 (0.0%) |
| 4-Person Households | 521 (12.5%) | 0 (0.0%) |
| 5-Person Households | 266 (6.4%) | 0 (0.0%) |
| 6-Person Households | 59 (1.4%) | 0 (0.0%) |
| 7+ Person Households | 120 (2.9%) | 0 (0.0%) |
| Total | 2,818 (67.6%) | 1,352 (32.4%) |
Female Fertility in Terry County
Fertility by Age in Terry County
Average fertility rate in Terry County is 42.0 births per 1,000 women. Women in the age bracket of 20 to 34 years have the highest fertility rate with 111.0 births per 1,000 women. Women in the age bracket of 20 to 34 years acount for 100.0% of all women with births.
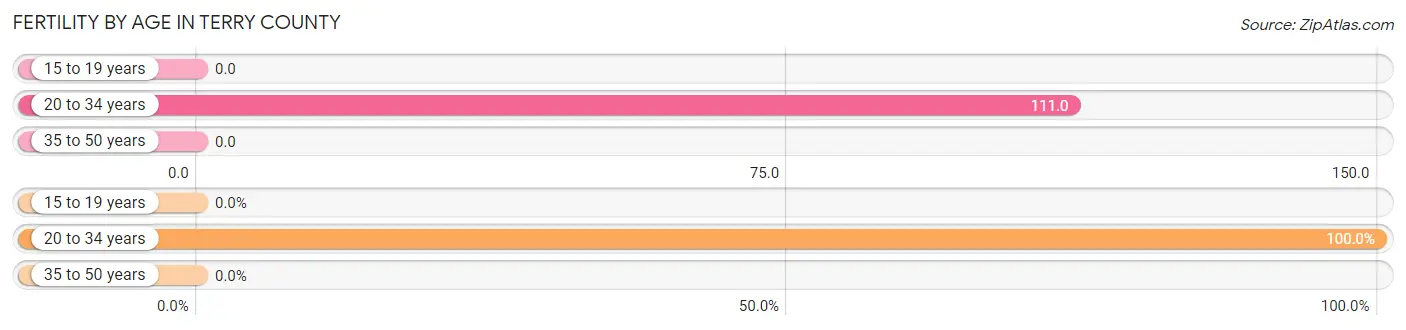
| Age Bracket | Women with Births | Births / 1,000 Women |
| 15 to 19 years | 0 (0.0%) | 0.0 |
| 20 to 34 years | 99 (100.0%) | 111.0 |
| 35 to 50 years | 0 (0.0%) | 0.0 |
| Total | 99 (100.0%) | 42.0 |
Fertility by Age by Marriage Status in Terry County
77.8% of women with births (99) in Terry County are married. The highest percentage of unmarried women with births falls into 20 to 34 years age bracket with 22.2% of them unmarried at the time of birth, while the lowest percentage of unmarried women with births belong to 20 to 34 years age bracket with 22.2% of them unmarried.
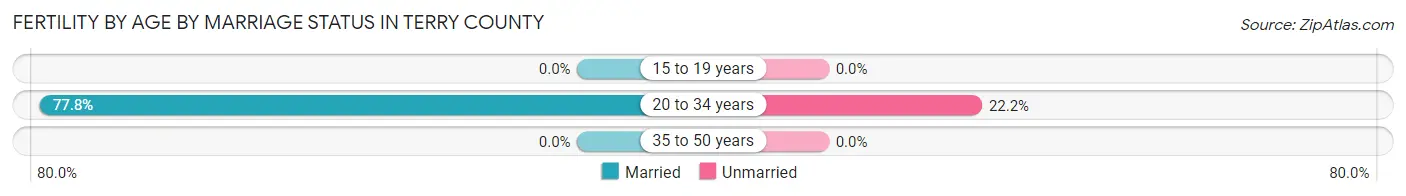
| Age Bracket | Married | Unmarried |
| 15 to 19 years | 0 (0.0%) | 0 (0.0%) |
| 20 to 34 years | 77 (77.8%) | 22 (22.2%) |
| 35 to 50 years | 0 (0.0%) | 0 (0.0%) |
| Total | 77 (77.8%) | 22 (22.2%) |
Fertility by Education in Terry County
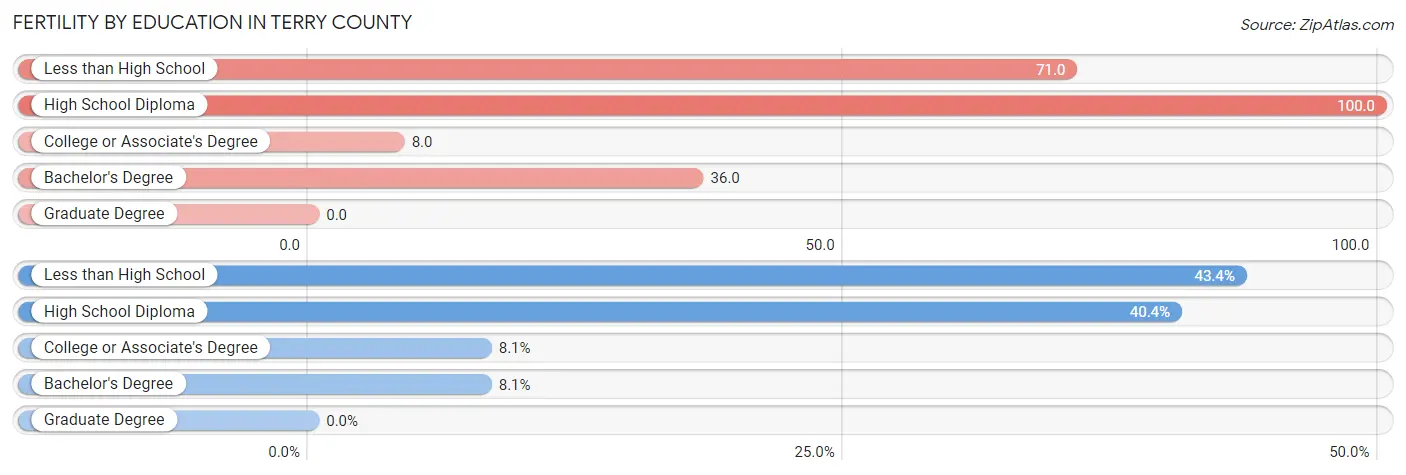
| Educational Attainment | Women with Births | Births / 1,000 Women |
| Less than High School | 43 (43.4%) | 71.0 |
| High School Diploma | 40 (40.4%) | 100.0 |
| College or Associate's Degree | 8 (8.1%) | 8.0 |
| Bachelor's Degree | 8 (8.1%) | 36.0 |
| Graduate Degree | 0 (0.0%) | 0.0 |
| Total | 99 (100.0%) | 42.0 |
Fertility by Education by Marriage Status in Terry County
22.2% of women with births in Terry County are unmarried. Women with the educational attainment of high school diploma are most likely to be married with 100.0% of them married at childbirth, while women with the educational attainment of bachelor's degree are least likely to be married with 100.0% of them unmarried at childbirth.
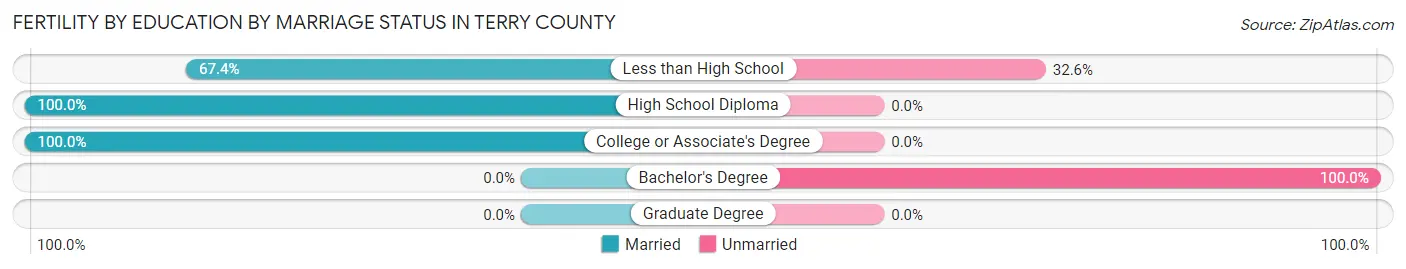
| Educational Attainment | Married | Unmarried |
| Less than High School | 29 (67.4%) | 14 (32.6%) |
| High School Diploma | 40 (100.0%) | 0 (0.0%) |
| College or Associate's Degree | 8 (100.0%) | 0 (0.0%) |
| Bachelor's Degree | 0 (0.0%) | 8 (100.0%) |
| Graduate Degree | 0 (0.0%) | 0 (0.0%) |
| Total | 77 (77.8%) | 22 (22.2%) |
Employment Characteristics in Terry County
Employment by Class of Employer in Terry County
Among the 4,957 employed individuals in Terry County, private company employees (3,577 | 72.2%), local government employees (355 | 7.2%), and not-for-profit organizations (340 | 6.9%) make up the most common classes of employment.
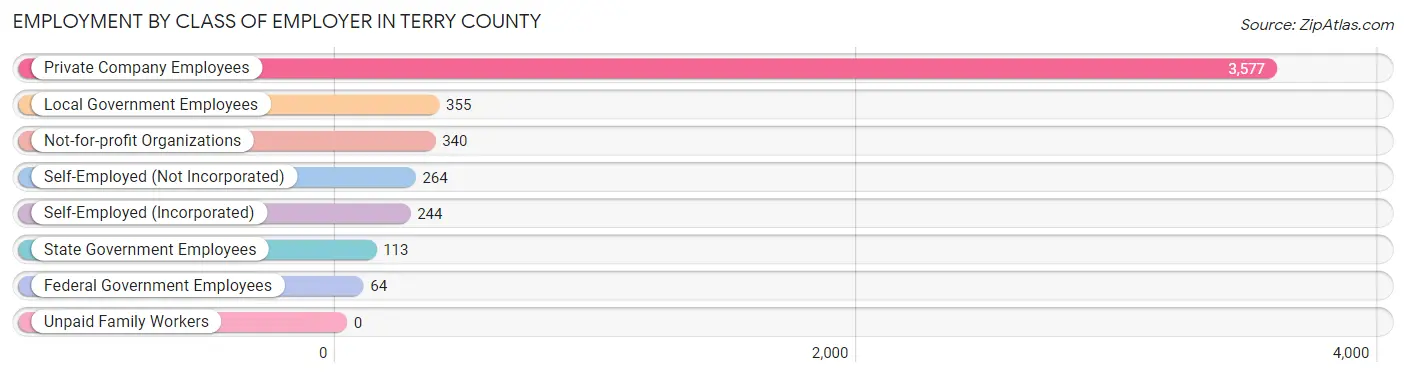
| Employer Class | # Employees | % Employees |
| Private Company Employees | 3,577 | 72.2% |
| Self-Employed (Incorporated) | 244 | 4.9% |
| Self-Employed (Not Incorporated) | 264 | 5.3% |
| Not-for-profit Organizations | 340 | 6.9% |
| Local Government Employees | 355 | 7.2% |
| State Government Employees | 113 | 2.3% |
| Federal Government Employees | 64 | 1.3% |
| Unpaid Family Workers | 0 | 0.0% |
| Total | 4,957 | 100.0% |
Employment Status by Age in Terry County
According to the labor force statistics for Terry County, out of the total population over 16 years of age (8,863), 59.1% or 5,238 individuals are in the labor force, with 4.8% or 251 of them unemployed. The age group with the highest labor force participation rate is 25 to 29 years, with 82.8% or 594 individuals in the labor force. Within the labor force, the 16 to 19 years age range has the highest percentage of unemployed individuals, with 20.9% or 58 of them being unemployed.
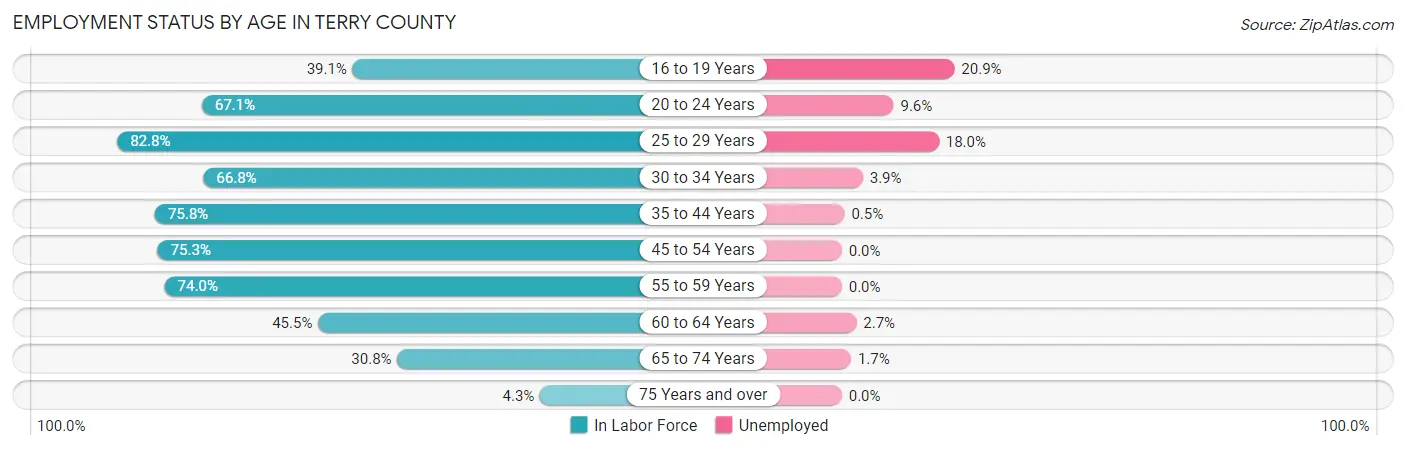
| Age Bracket | In Labor Force | Unemployed |
| 16 to 19 Years | 278 (39.1%) | 58 (20.9%) |
| 20 to 24 Years | 534 (67.1%) | 51 (9.6%) |
| 25 to 29 Years | 594 (82.8%) | 107 (18.0%) |
| 30 to 34 Years | 431 (66.8%) | 17 (3.9%) |
| 35 to 44 Years | 1,210 (75.8%) | 6 (0.5%) |
| 45 to 54 Years | 959 (75.3%) | 0 (0.0%) |
| 55 to 59 Years | 714 (74.0%) | 0 (0.0%) |
| 60 to 64 Years | 187 (45.5%) | 5 (2.7%) |
| 65 to 74 Years | 302 (30.8%) | 5 (1.7%) |
| 75 Years and over | 33 (4.3%) | 0 (0.0%) |
| Total | 5,238 (59.1%) | 251 (4.8%) |
Employment Status by Educational Attainment in Terry County
According to labor force statistics for Terry County, 73.0% of individuals (4,093) out of the total population between 25 and 64 years of age (5,607) are in the labor force, with 3.3% or 135 of them being unemployed. The group with the highest labor force participation rate are those with the educational attainment of bachelor's degree or higher, with 83.4% or 511 individuals in the labor force. Within the labor force, individuals with high school diploma education have the highest percentage of unemployment, with 8.3% or 120 of them being unemployed.
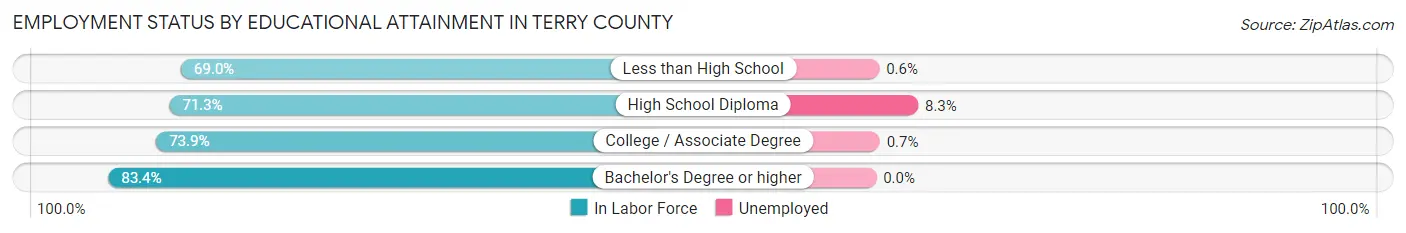
| Educational Attainment | In Labor Force | Unemployed |
| Less than High School | 771 (69.0%) | 7 (0.6%) |
| High School Diploma | 1,446 (71.3%) | 168 (8.3%) |
| College / Associate Degree | 1,366 (73.9%) | 13 (0.7%) |
| Bachelor's Degree or higher | 511 (83.4%) | 0 (0.0%) |
| Total | 4,093 (73.0%) | 185 (3.3%) |
Employment Occupations by Sex in Terry County
Management, Business, Science and Arts Occupations
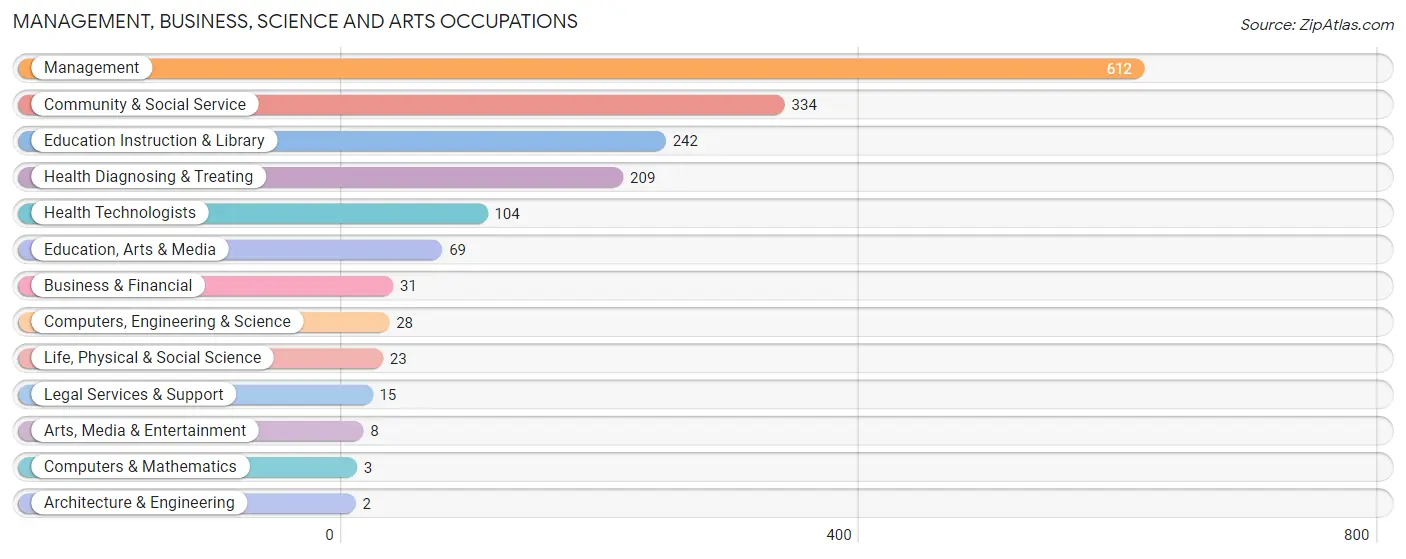
The most common Management, Business, Science and Arts occupations in Terry County are Management (612 | 12.3%), Community & Social Service (334 | 6.7%), Education Instruction & Library (242 | 4.9%), Health Diagnosing & Treating (209 | 4.2%), and Health Technologists (104 | 2.1%).
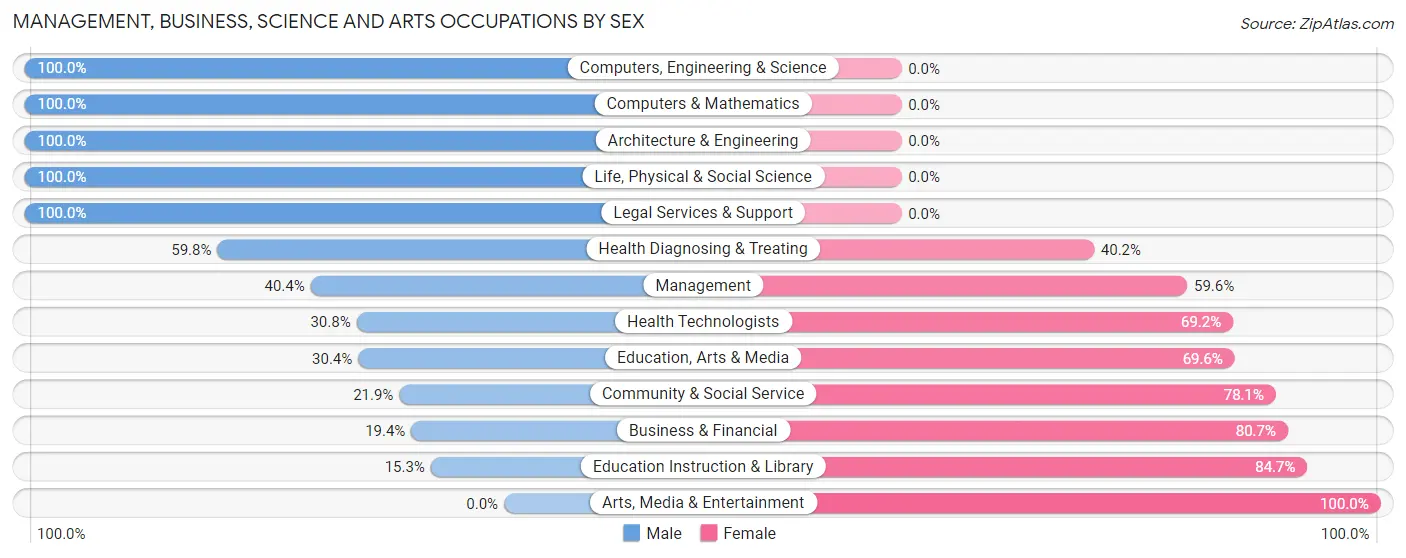
Management, Business, Science and Arts Occupations by Sex
Within the Management, Business, Science and Arts occupations in Terry County, the most male-oriented occupations are Computers, Engineering & Science (100.0%), Computers & Mathematics (100.0%), and Architecture & Engineering (100.0%), while the most female-oriented occupations are Arts, Media & Entertainment (100.0%), Education Instruction & Library (84.7%), and Business & Financial (80.6%).
| Occupation | Male | Female |
| Management | 247 (40.4%) | 365 (59.6%) |
| Business & Financial | 6 (19.4%) | 25 (80.6%) |
| Computers, Engineering & Science | 28 (100.0%) | 0 (0.0%) |
| Computers & Mathematics | 3 (100.0%) | 0 (0.0%) |
| Architecture & Engineering | 2 (100.0%) | 0 (0.0%) |
| Life, Physical & Social Science | 23 (100.0%) | 0 (0.0%) |
| Community & Social Service | 73 (21.9%) | 261 (78.1%) |
| Education, Arts & Media | 21 (30.4%) | 48 (69.6%) |
| Legal Services & Support | 15 (100.0%) | 0 (0.0%) |
| Education Instruction & Library | 37 (15.3%) | 205 (84.7%) |
| Arts, Media & Entertainment | 0 (0.0%) | 8 (100.0%) |
| Health Diagnosing & Treating | 125 (59.8%) | 84 (40.2%) |
| Health Technologists | 32 (30.8%) | 72 (69.2%) |
| Total (Category) | 479 (39.5%) | 735 (60.5%) |
| Total (Overall) | 2,672 (53.5%) | 2,320 (46.5%) |
Services Occupations
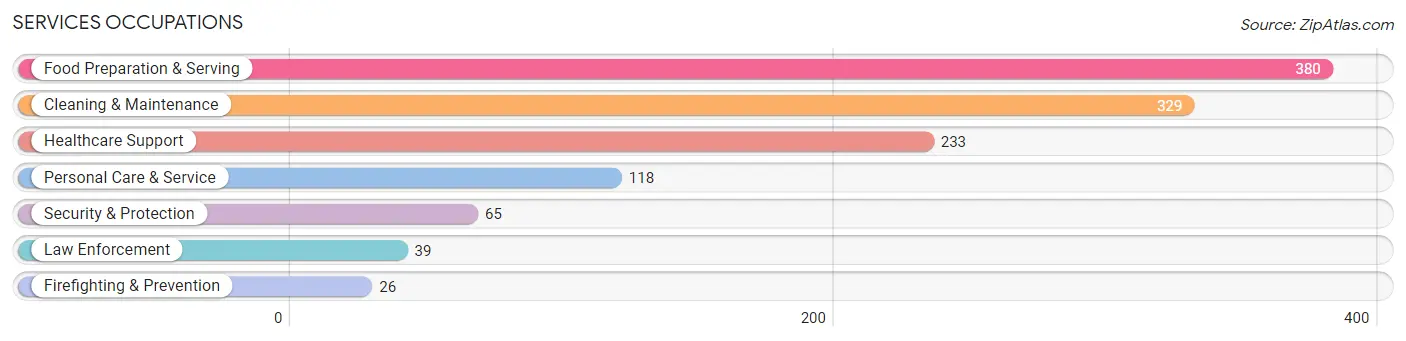
The most common Services occupations in Terry County are Food Preparation & Serving (380 | 7.6%), Cleaning & Maintenance (329 | 6.6%), Healthcare Support (233 | 4.7%), Personal Care & Service (118 | 2.4%), and Security & Protection (65 | 1.3%).
Services Occupations by Sex
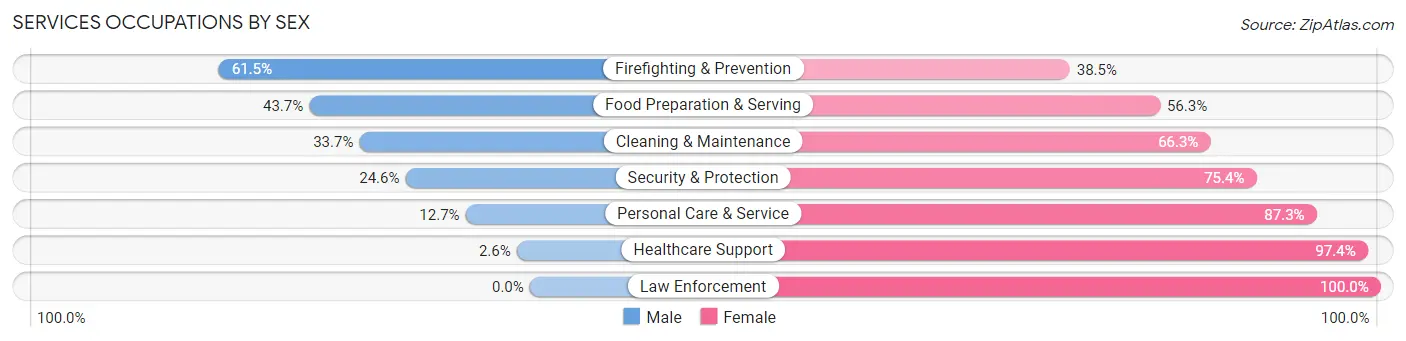
Within the Services occupations in Terry County, the most male-oriented occupations are Firefighting & Prevention (61.5%), Food Preparation & Serving (43.7%), and Cleaning & Maintenance (33.7%), while the most female-oriented occupations are Law Enforcement (100.0%), Healthcare Support (97.4%), and Personal Care & Service (87.3%).
| Occupation | Male | Female |
| Healthcare Support | 6 (2.6%) | 227 (97.4%) |
| Security & Protection | 16 (24.6%) | 49 (75.4%) |
| Firefighting & Prevention | 16 (61.5%) | 10 (38.5%) |
| Law Enforcement | 0 (0.0%) | 39 (100.0%) |
| Food Preparation & Serving | 166 (43.7%) | 214 (56.3%) |
| Cleaning & Maintenance | 111 (33.7%) | 218 (66.3%) |
| Personal Care & Service | 15 (12.7%) | 103 (87.3%) |
| Total (Category) | 314 (27.9%) | 811 (72.1%) |
| Total (Overall) | 2,672 (53.5%) | 2,320 (46.5%) |
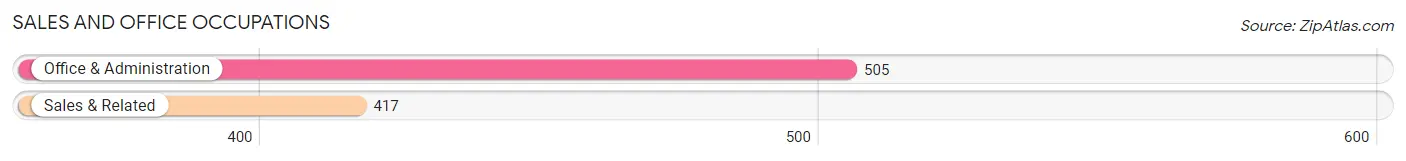
Sales and Office Occupations
The most common Sales and Office occupations in Terry County are Office & Administration (505 | 10.1%), and Sales & Related (417 | 8.4%).
Sales and Office Occupations by Sex
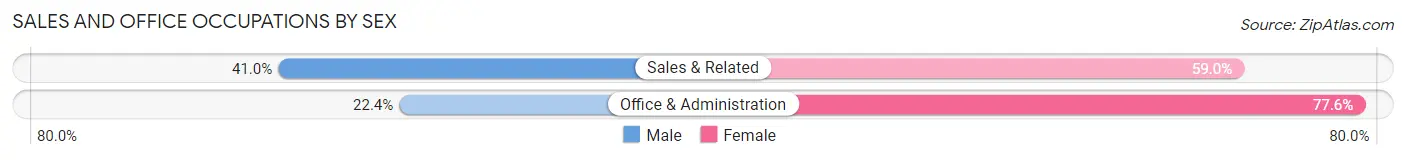
| Occupation | Male | Female |
| Sales & Related | 171 (41.0%) | 246 (59.0%) |
| Office & Administration | 113 (22.4%) | 392 (77.6%) |
| Total (Category) | 284 (30.8%) | 638 (69.2%) |
| Total (Overall) | 2,672 (53.5%) | 2,320 (46.5%) |
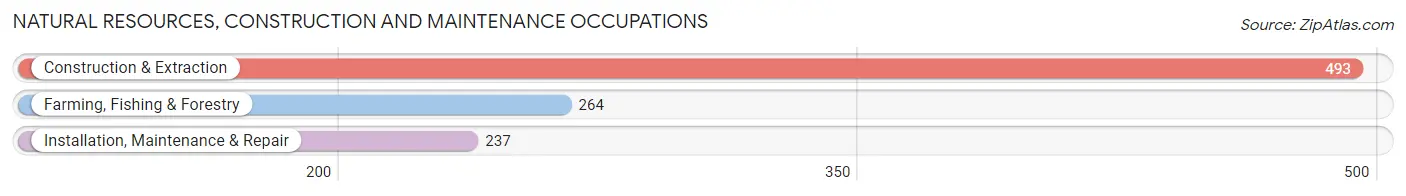
Natural Resources, Construction and Maintenance Occupations
The most common Natural Resources, Construction and Maintenance occupations in Terry County are Construction & Extraction (493 | 9.9%), Farming, Fishing & Forestry (264 | 5.3%), and Installation, Maintenance & Repair (237 | 4.8%).
Natural Resources, Construction and Maintenance Occupations by Sex
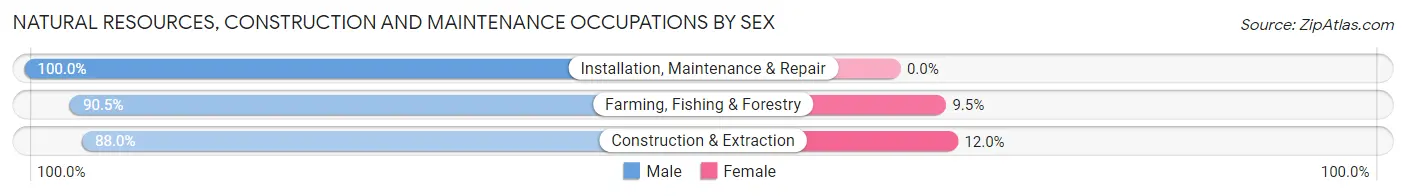
| Occupation | Male | Female |
| Farming, Fishing & Forestry | 239 (90.5%) | 25 (9.5%) |
| Construction & Extraction | 434 (88.0%) | 59 (12.0%) |
| Installation, Maintenance & Repair | 237 (100.0%) | 0 (0.0%) |
| Total (Category) | 910 (91.5%) | 84 (8.5%) |
| Total (Overall) | 2,672 (53.5%) | 2,320 (46.5%) |
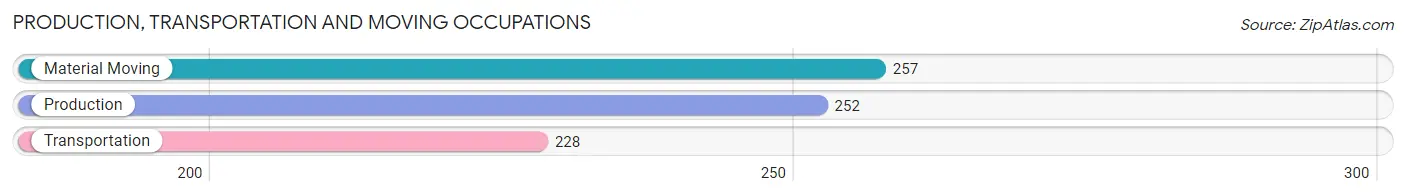
Production, Transportation and Moving Occupations
The most common Production, Transportation and Moving occupations in Terry County are Material Moving (257 | 5.1%), Production (252 | 5.1%), and Transportation (228 | 4.6%).
Production, Transportation and Moving Occupations by Sex
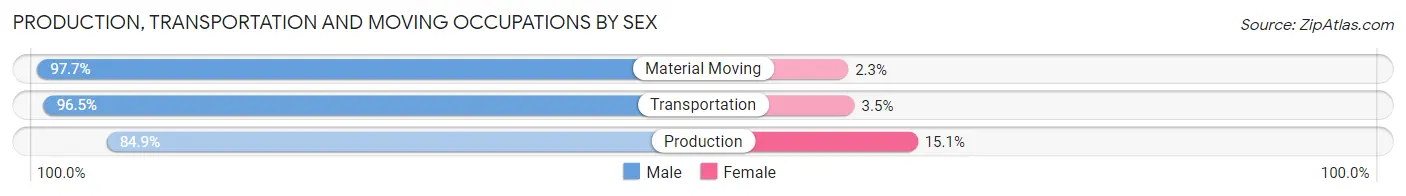
| Occupation | Male | Female |
| Production | 214 (84.9%) | 38 (15.1%) |
| Transportation | 220 (96.5%) | 8 (3.5%) |
| Material Moving | 251 (97.7%) | 6 (2.3%) |
| Total (Category) | 685 (92.9%) | 52 (7.1%) |
| Total (Overall) | 2,672 (53.5%) | 2,320 (46.5%) |
Employment Industries by Sex in Terry County
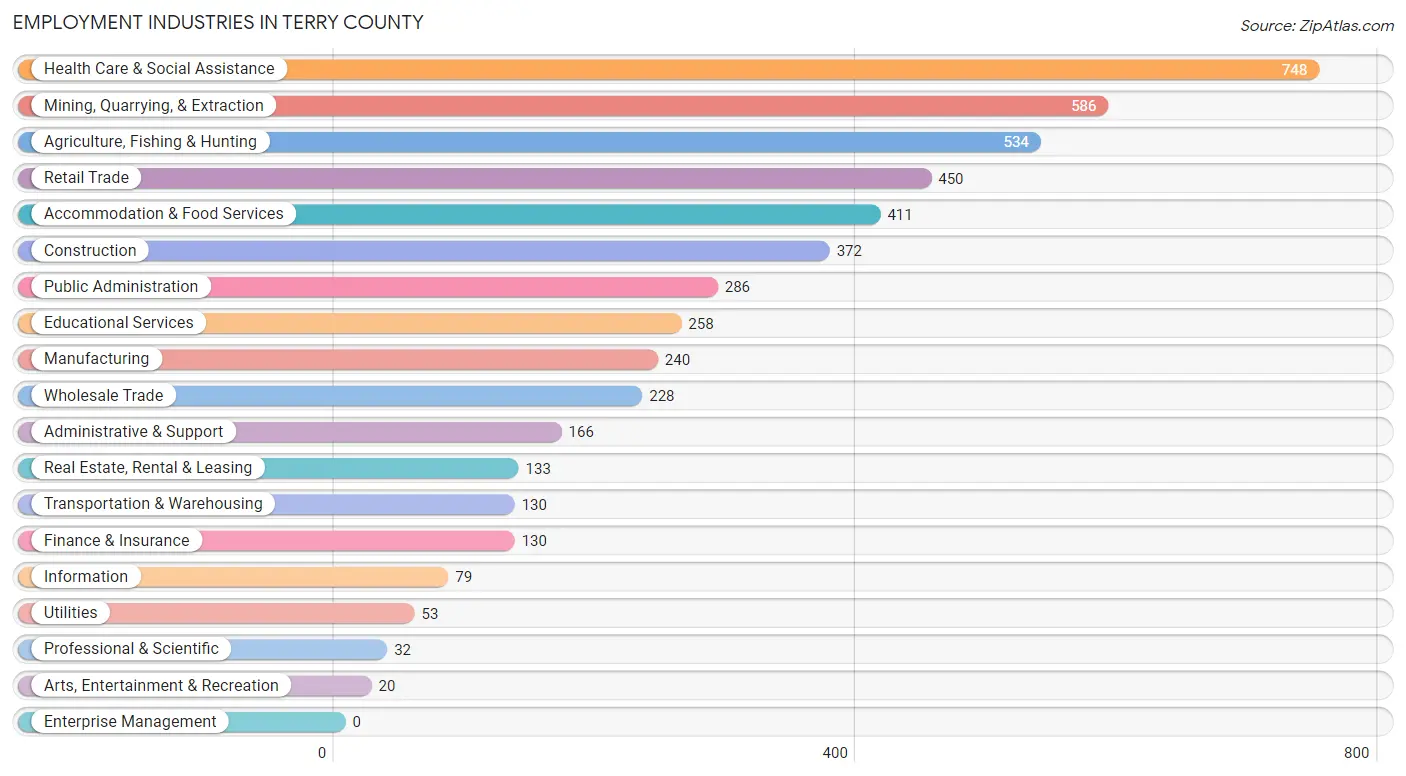
Employment Industries in Terry County
The major employment industries in Terry County include Health Care & Social Assistance (748 | 15.0%), Mining, Quarrying, & Extraction (586 | 11.7%), Agriculture, Fishing & Hunting (534 | 10.7%), Retail Trade (450 | 9.0%), and Accommodation & Food Services (411 | 8.2%).
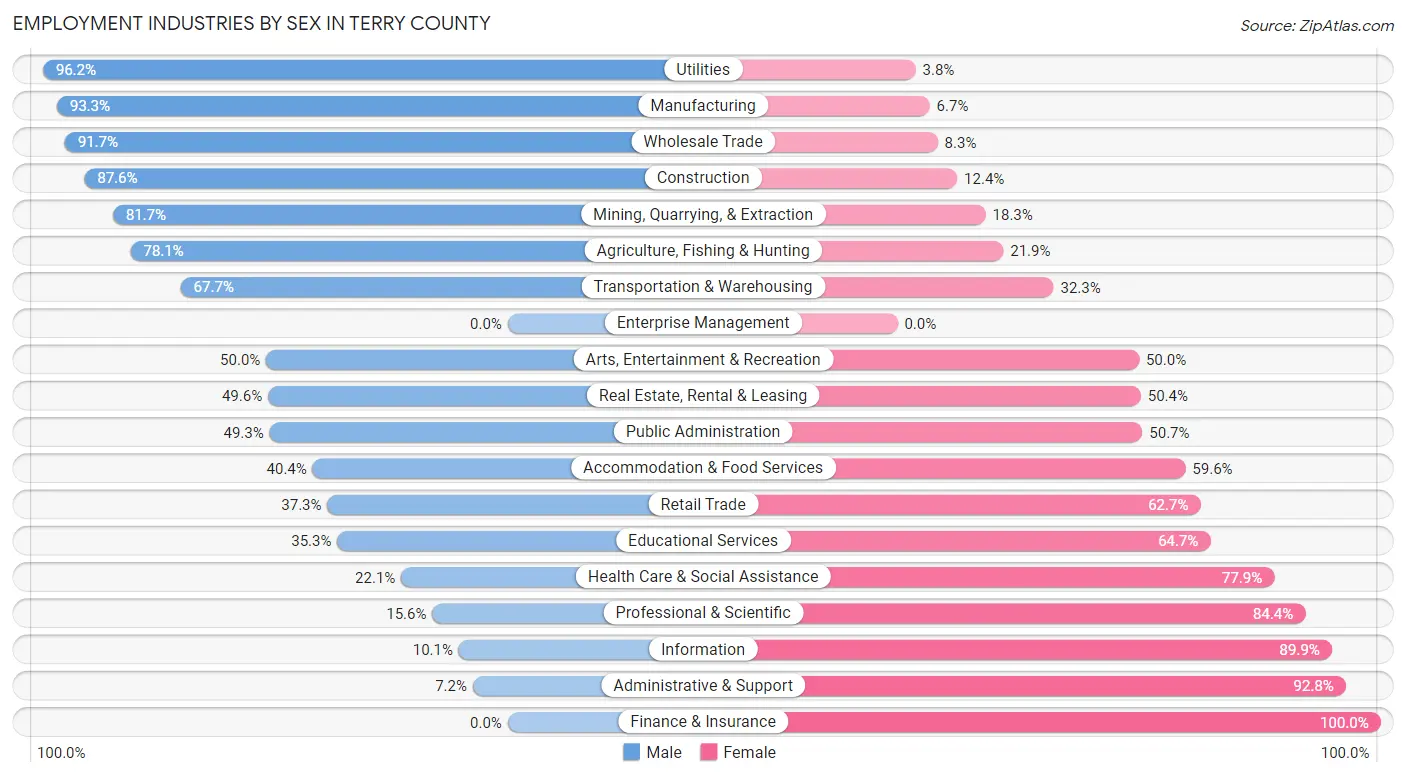
Employment Industries by Sex in Terry County
The Terry County industries that see more men than women are Utilities (96.2%), Manufacturing (93.3%), and Wholesale Trade (91.7%), whereas the industries that tend to have a higher number of women are Finance & Insurance (100.0%), Administrative & Support (92.8%), and Information (89.9%).
| Industry | Male | Female |
| Agriculture, Fishing & Hunting | 417 (78.1%) | 117 (21.9%) |
| Mining, Quarrying, & Extraction | 479 (81.7%) | 107 (18.3%) |
| Construction | 326 (87.6%) | 46 (12.4%) |
| Manufacturing | 224 (93.3%) | 16 (6.7%) |
| Wholesale Trade | 209 (91.7%) | 19 (8.3%) |
| Retail Trade | 168 (37.3%) | 282 (62.7%) |
| Transportation & Warehousing | 88 (67.7%) | 42 (32.3%) |
| Utilities | 51 (96.2%) | 2 (3.8%) |
| Information | 8 (10.1%) | 71 (89.9%) |
| Finance & Insurance | 0 (0.0%) | 130 (100.0%) |
| Real Estate, Rental & Leasing | 66 (49.6%) | 67 (50.4%) |
| Professional & Scientific | 5 (15.6%) | 27 (84.4%) |
| Enterprise Management | 0 (0.0%) | 0 (0.0%) |
| Administrative & Support | 12 (7.2%) | 154 (92.8%) |
| Educational Services | 91 (35.3%) | 167 (64.7%) |
| Health Care & Social Assistance | 165 (22.1%) | 583 (77.9%) |
| Arts, Entertainment & Recreation | 10 (50.0%) | 10 (50.0%) |
| Accommodation & Food Services | 166 (40.4%) | 245 (59.6%) |
| Public Administration | 141 (49.3%) | 145 (50.7%) |
| Total | 2,672 (53.5%) | 2,320 (46.5%) |
Education in Terry County
School Enrollment in Terry County
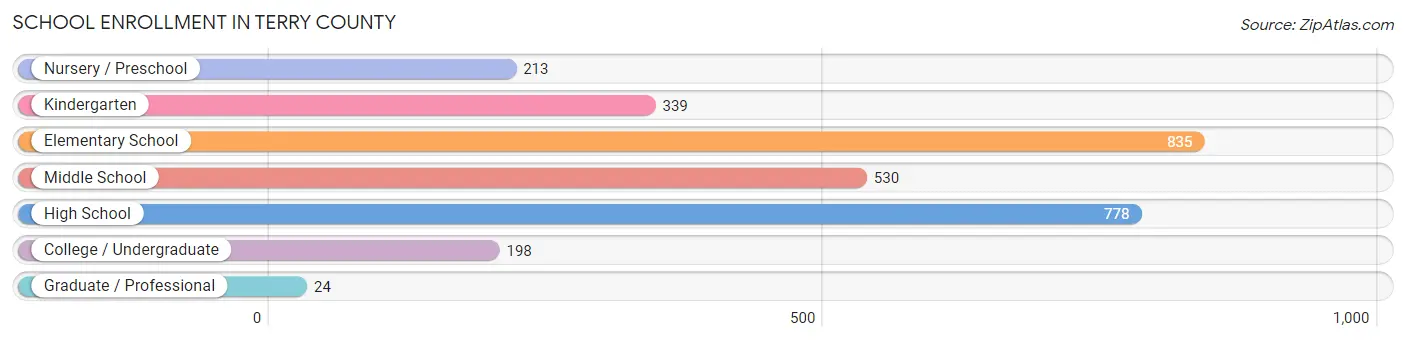
The most common levels of schooling among the 2,917 students in Terry County are elementary school (835 | 28.6%), high school (778 | 26.7%), and middle school (530 | 18.2%).
| School Level | # Students | % Students |
| Nursery / Preschool | 213 | 7.3% |
| Kindergarten | 339 | 11.6% |
| Elementary School | 835 | 28.6% |
| Middle School | 530 | 18.2% |
| High School | 778 | 26.7% |
| College / Undergraduate | 198 | 6.8% |
| Graduate / Professional | 24 | 0.8% |
| Total | 2,917 | 100.0% |
School Enrollment by Age by Funding Source in Terry County
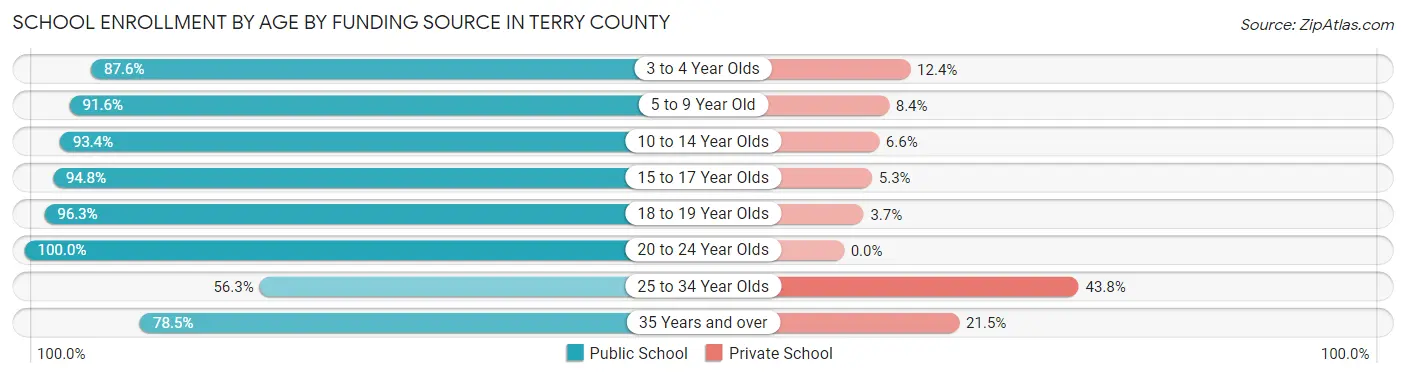
Out of a total of 2,917 students who are enrolled in schools in Terry County, 233 (8.0%) attend a private institution, while the remaining 2,684 (92.0%) are enrolled in public schools. The age group of 25 to 34 year olds has the highest likelihood of being enrolled in private schools, with 14 (43.8% in the age bracket) enrolled. Conversely, the age group of 20 to 24 year olds has the lowest likelihood of being enrolled in a private school, with 52 (100.0% in the age bracket) attending a public institution.
| Age Bracket | Public School | Private School |
| 3 to 4 Year Olds | 177 (87.6%) | 25 (12.4%) |
| 5 to 9 Year Old | 971 (91.6%) | 89 (8.4%) |
| 10 to 14 Year Olds | 698 (93.4%) | 49 (6.6%) |
| 15 to 17 Year Olds | 487 (94.8%) | 27 (5.2%) |
| 18 to 19 Year Olds | 209 (96.3%) | 8 (3.7%) |
| 20 to 24 Year Olds | 52 (100.0%) | 0 (0.0%) |
| 25 to 34 Year Olds | 18 (56.2%) | 14 (43.8%) |
| 35 Years and over | 73 (78.5%) | 20 (21.5%) |
| Total | 2,684 (92.0%) | 233 (8.0%) |
Educational Attainment by Field of Study in Terry County
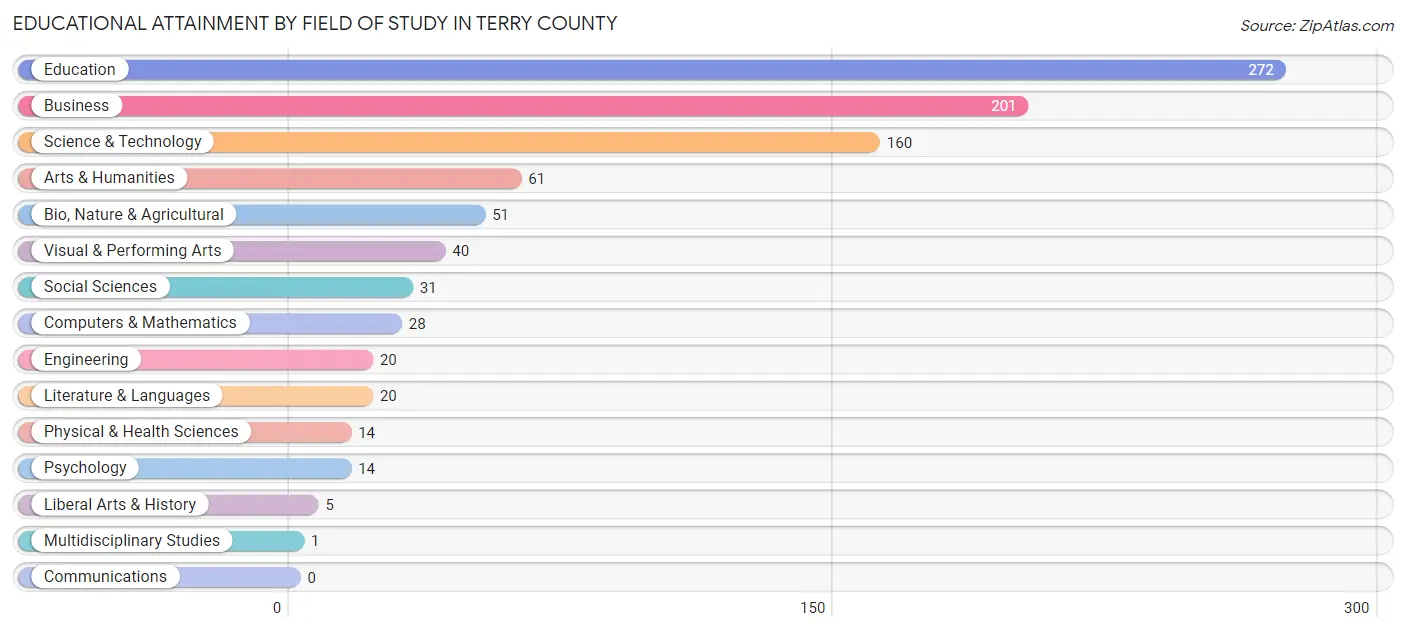
Education (272 | 29.6%), business (201 | 21.9%), science & technology (160 | 17.4%), arts & humanities (61 | 6.6%), and bio, nature & agricultural (51 | 5.6%) are the most common fields of study among 918 individuals in Terry County who have obtained a bachelor's degree or higher.
| Field of Study | # Graduates | % Graduates |
| Computers & Mathematics | 28 | 3.0% |
| Bio, Nature & Agricultural | 51 | 5.6% |
| Physical & Health Sciences | 14 | 1.5% |
| Psychology | 14 | 1.5% |
| Social Sciences | 31 | 3.4% |
| Engineering | 20 | 2.2% |
| Multidisciplinary Studies | 1 | 0.1% |
| Science & Technology | 160 | 17.4% |
| Business | 201 | 21.9% |
| Education | 272 | 29.6% |
| Literature & Languages | 20 | 2.2% |
| Liberal Arts & History | 5 | 0.5% |
| Visual & Performing Arts | 40 | 4.4% |
| Communications | 0 | 0.0% |
| Arts & Humanities | 61 | 6.6% |
| Total | 918 | 100.0% |
Transportation & Commute in Terry County
Vehicle Availability by Sex in Terry County
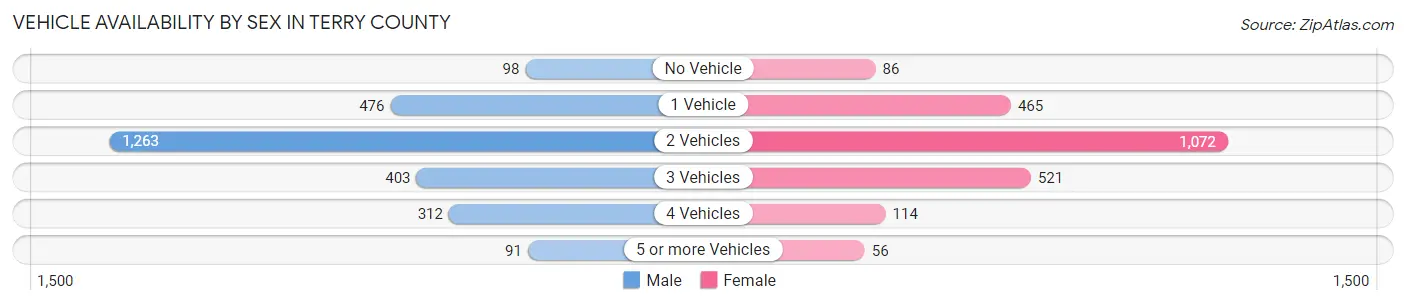
The most prevalent vehicle ownership categories in Terry County are males with 2 vehicles (1,263, accounting for 47.8%) and females with 2 vehicles (1,072, making up 54.6%).
| Vehicles Available | Male | Female |
| No Vehicle | 98 (3.7%) | 86 (3.7%) |
| 1 Vehicle | 476 (18.0%) | 465 (20.1%) |
| 2 Vehicles | 1,263 (47.8%) | 1,072 (46.3%) |
| 3 Vehicles | 403 (15.2%) | 521 (22.5%) |
| 4 Vehicles | 312 (11.8%) | 114 (4.9%) |
| 5 or more Vehicles | 91 (3.4%) | 56 (2.4%) |
| Total | 2,643 (100.0%) | 2,314 (100.0%) |
Commute Time in Terry County
The most frequently occuring commute durations in Terry County are 5 to 9 minutes (1,624 commuters, 34.3%), 15 to 19 minutes (648 commuters, 13.7%), and less than 5 minutes (607 commuters, 12.8%).
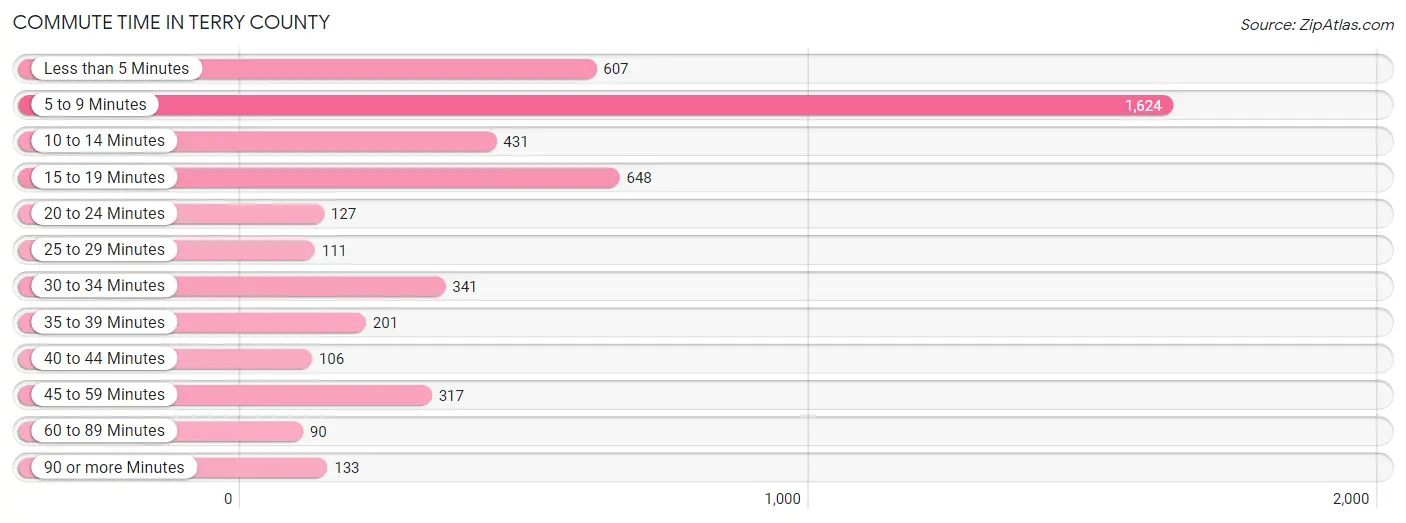
| Commute Time | # Commuters | % Commuters |
| Less than 5 Minutes | 607 | 12.8% |
| 5 to 9 Minutes | 1,624 | 34.3% |
| 10 to 14 Minutes | 431 | 9.1% |
| 15 to 19 Minutes | 648 | 13.7% |
| 20 to 24 Minutes | 127 | 2.7% |
| 25 to 29 Minutes | 111 | 2.3% |
| 30 to 34 Minutes | 341 | 7.2% |
| 35 to 39 Minutes | 201 | 4.2% |
| 40 to 44 Minutes | 106 | 2.2% |
| 45 to 59 Minutes | 317 | 6.7% |
| 60 to 89 Minutes | 90 | 1.9% |
| 90 or more Minutes | 133 | 2.8% |
Commute Time by Sex in Terry County
The most common commute times in Terry County are 5 to 9 minutes (741 commuters, 28.2%) for males and 5 to 9 minutes (883 commuters, 41.9%) for females.
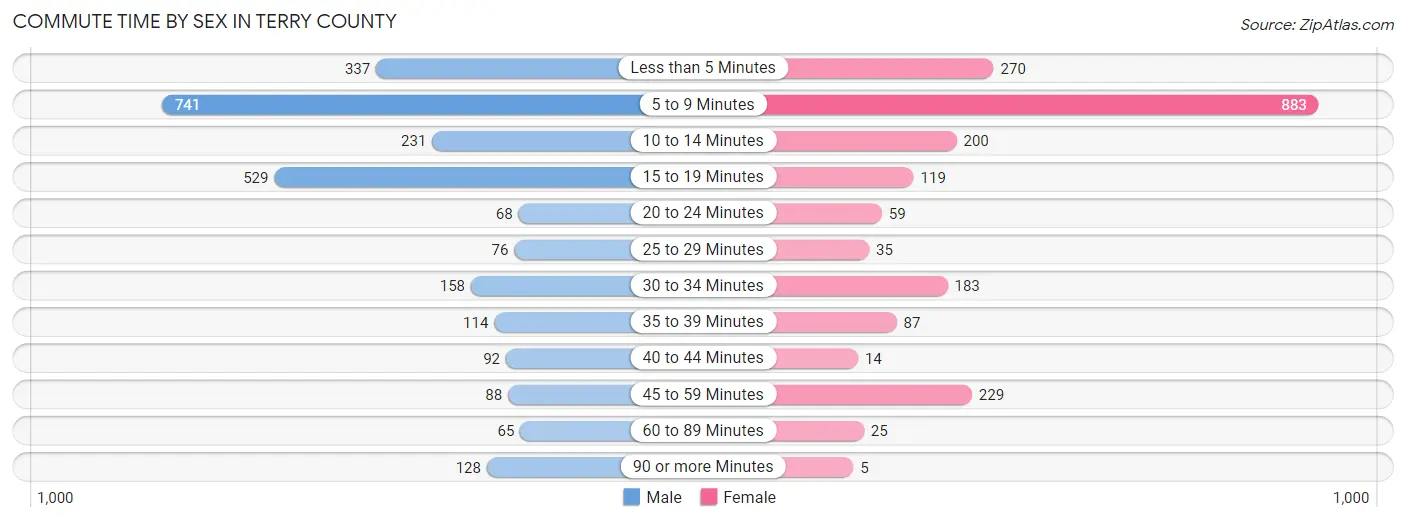
| Commute Time | Male | Female |
| Less than 5 Minutes | 337 (12.8%) | 270 (12.8%) |
| 5 to 9 Minutes | 741 (28.2%) | 883 (41.9%) |
| 10 to 14 Minutes | 231 (8.8%) | 200 (9.5%) |
| 15 to 19 Minutes | 529 (20.1%) | 119 (5.6%) |
| 20 to 24 Minutes | 68 (2.6%) | 59 (2.8%) |
| 25 to 29 Minutes | 76 (2.9%) | 35 (1.7%) |
| 30 to 34 Minutes | 158 (6.0%) | 183 (8.7%) |
| 35 to 39 Minutes | 114 (4.3%) | 87 (4.1%) |
| 40 to 44 Minutes | 92 (3.5%) | 14 (0.7%) |
| 45 to 59 Minutes | 88 (3.4%) | 229 (10.9%) |
| 60 to 89 Minutes | 65 (2.5%) | 25 (1.2%) |
| 90 or more Minutes | 128 (4.9%) | 5 (0.2%) |
Time of Departure to Work by Sex in Terry County
The most frequent times of departure to work in Terry County are 6:30 AM to 6:59 AM (646, 24.6%) for males and 7:00 AM to 7:29 AM (368, 17.4%) for females.
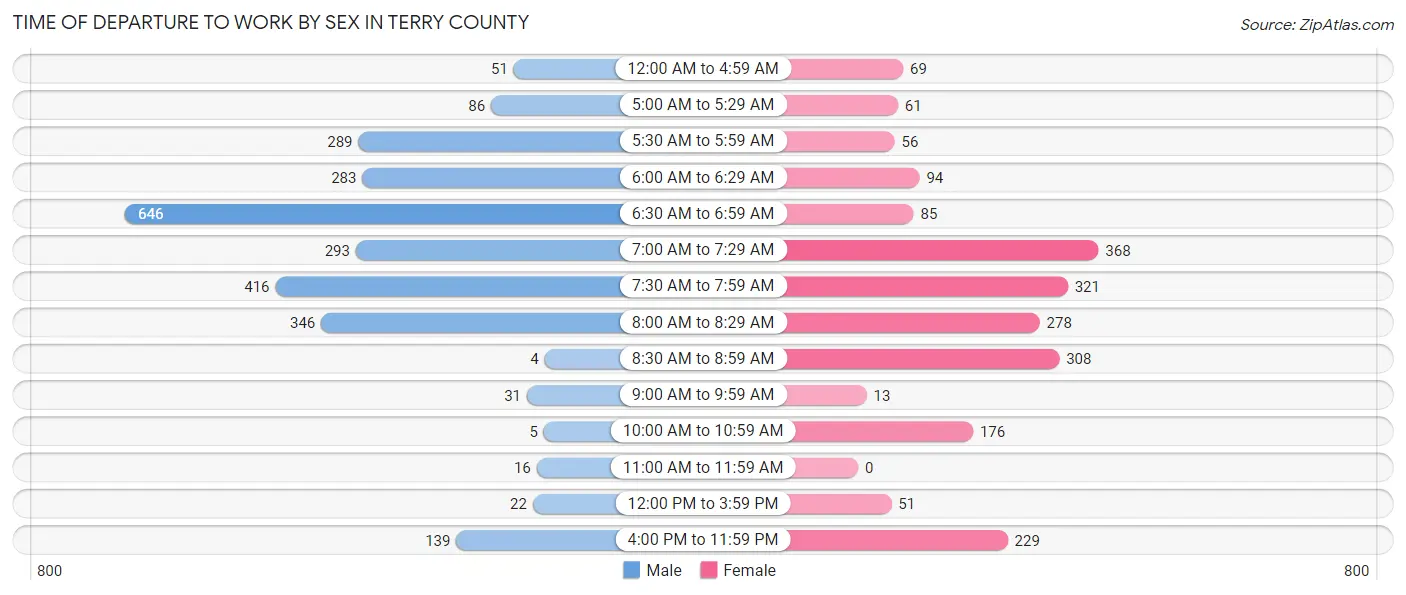
| Time of Departure | Male | Female |
| 12:00 AM to 4:59 AM | 51 (1.9%) | 69 (3.3%) |
| 5:00 AM to 5:29 AM | 86 (3.3%) | 61 (2.9%) |
| 5:30 AM to 5:59 AM | 289 (11.0%) | 56 (2.7%) |
| 6:00 AM to 6:29 AM | 283 (10.8%) | 94 (4.5%) |
| 6:30 AM to 6:59 AM | 646 (24.6%) | 85 (4.0%) |
| 7:00 AM to 7:29 AM | 293 (11.2%) | 368 (17.4%) |
| 7:30 AM to 7:59 AM | 416 (15.8%) | 321 (15.2%) |
| 8:00 AM to 8:29 AM | 346 (13.2%) | 278 (13.2%) |
| 8:30 AM to 8:59 AM | 4 (0.2%) | 308 (14.6%) |
| 9:00 AM to 9:59 AM | 31 (1.2%) | 13 (0.6%) |
| 10:00 AM to 10:59 AM | 5 (0.2%) | 176 (8.4%) |
| 11:00 AM to 11:59 AM | 16 (0.6%) | 0 (0.0%) |
| 12:00 PM to 3:59 PM | 22 (0.8%) | 51 (2.4%) |
| 4:00 PM to 11:59 PM | 139 (5.3%) | 229 (10.9%) |
| Total | 2,627 (100.0%) | 2,109 (100.0%) |
Housing Occupancy in Terry County
Occupancy by Ownership in Terry County
Of the total 4,170 dwellings in Terry County, owner-occupied units account for 2,744 (65.8%), while renter-occupied units make up 1,426 (34.2%).
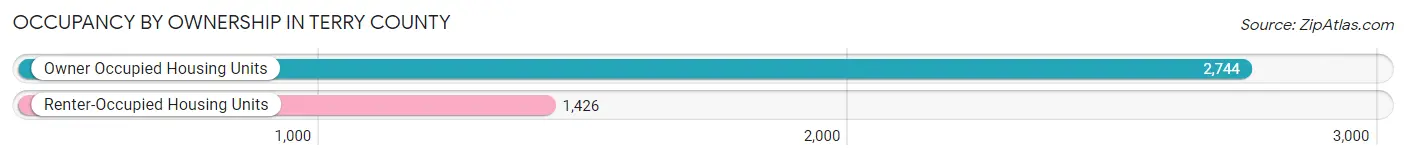
| Occupancy | # Housing Units | % Housing Units |
| Owner Occupied Housing Units | 2,744 | 65.8% |
| Renter-Occupied Housing Units | 1,426 | 34.2% |
| Total Occupied Housing Units | 4,170 | 100.0% |
Occupancy by Household Size in Terry County
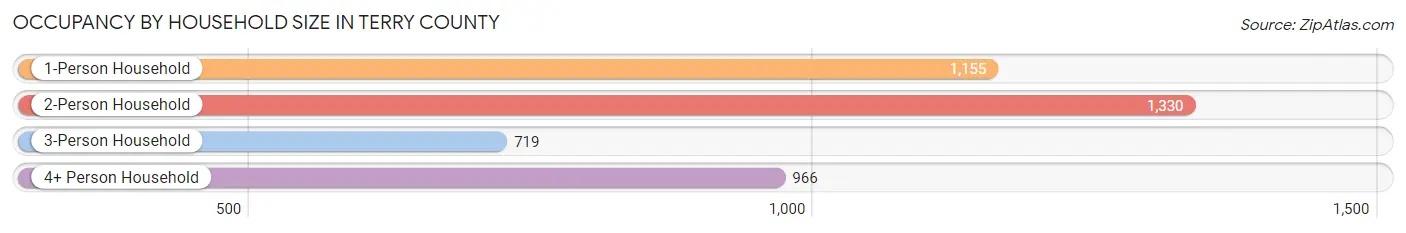
| Household Size | # Housing Units | % Housing Units |
| 1-Person Household | 1,155 | 27.7% |
| 2-Person Household | 1,330 | 31.9% |
| 3-Person Household | 719 | 17.2% |
| 4+ Person Household | 966 | 23.2% |
| Total Housing Units | 4,170 | 100.0% |
Occupancy by Ownership by Household Size in Terry County
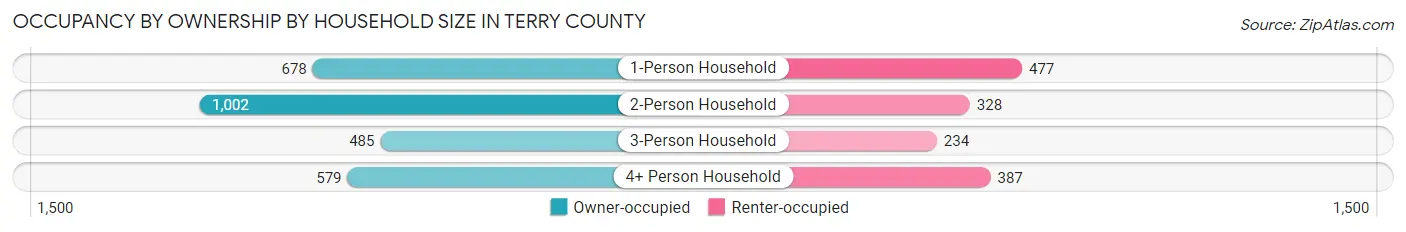
| Household Size | Owner-occupied | Renter-occupied |
| 1-Person Household | 678 (58.7%) | 477 (41.3%) |
| 2-Person Household | 1,002 (75.3%) | 328 (24.7%) |
| 3-Person Household | 485 (67.4%) | 234 (32.6%) |
| 4+ Person Household | 579 (59.9%) | 387 (40.1%) |
| Total Housing Units | 2,744 (65.8%) | 1,426 (34.2%) |
Occupancy by Educational Attainment in Terry County
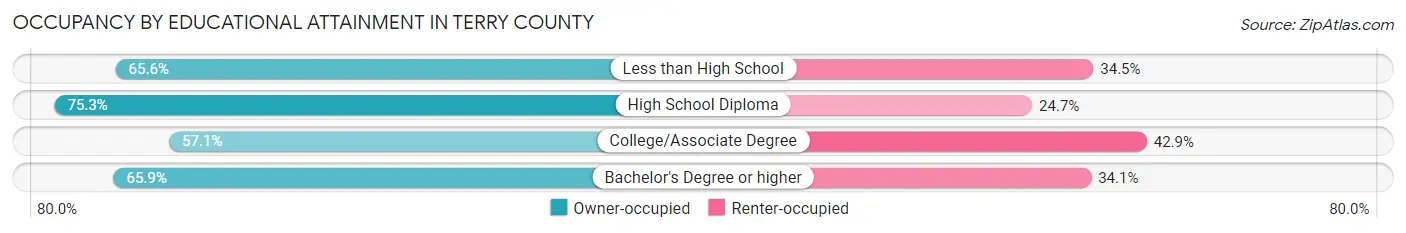
| Household Size | Owner-occupied | Renter-occupied |
| Less than High School | 643 (65.5%) | 338 (34.4%) |
| High School Diploma | 1,022 (75.3%) | 336 (24.7%) |
| College/Associate Degree | 826 (57.1%) | 621 (42.9%) |
| Bachelor's Degree or higher | 253 (65.9%) | 131 (34.1%) |
Occupancy by Age of Householder in Terry County
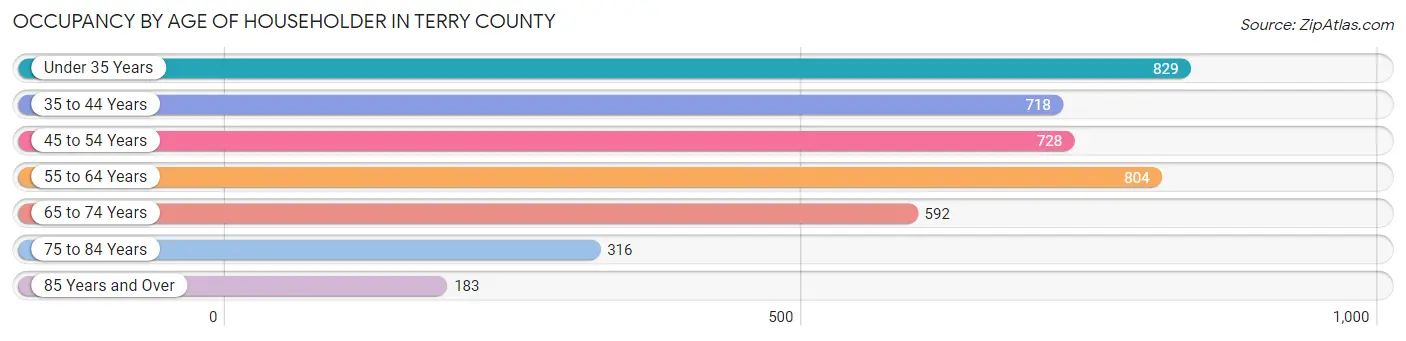
| Age Bracket | # Households | % Households |
| Under 35 Years | 829 | 19.9% |
| 35 to 44 Years | 718 | 17.2% |
| 45 to 54 Years | 728 | 17.5% |
| 55 to 64 Years | 804 | 19.3% |
| 65 to 74 Years | 592 | 14.2% |
| 75 to 84 Years | 316 | 7.6% |
| 85 Years and Over | 183 | 4.4% |
| Total | 4,170 | 100.0% |
Housing Finances in Terry County
Median Income by Occupancy in Terry County
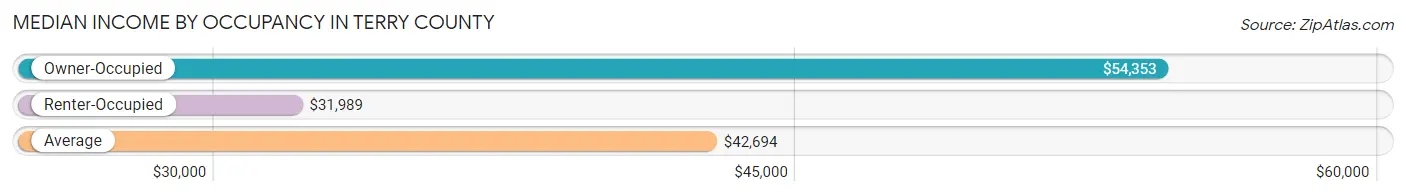
| Occupancy Type | # Households | Median Income |
| Owner-Occupied | 2,744 (65.8%) | $54,353 |
| Renter-Occupied | 1,426 (34.2%) | $31,989 |
| Average | 4,170 (100.0%) | $42,694 |
Occupancy by Householder Income Bracket in Terry County
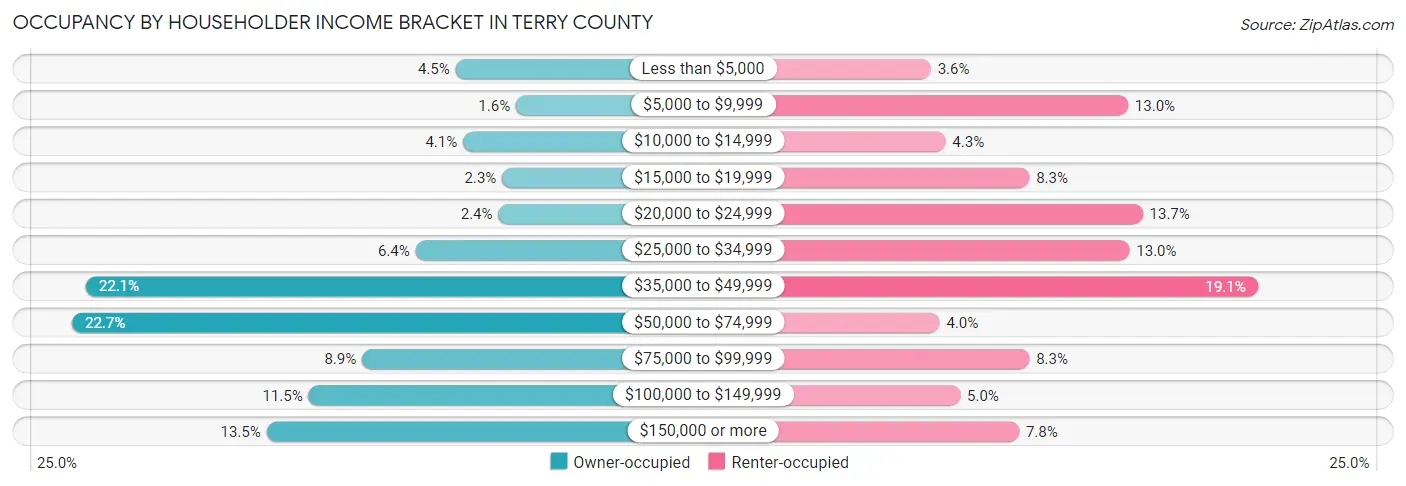
| Income Bracket | Owner-occupied | Renter-occupied |
| Less than $5,000 | 123 (4.5%) | 51 (3.6%) |
| $5,000 to $9,999 | 44 (1.6%) | 185 (13.0%) |
| $10,000 to $14,999 | 113 (4.1%) | 61 (4.3%) |
| $15,000 to $19,999 | 62 (2.3%) | 118 (8.3%) |
| $20,000 to $24,999 | 67 (2.4%) | 195 (13.7%) |
| $25,000 to $34,999 | 175 (6.4%) | 186 (13.0%) |
| $35,000 to $49,999 | 606 (22.1%) | 273 (19.1%) |
| $50,000 to $74,999 | 624 (22.7%) | 57 (4.0%) |
| $75,000 to $99,999 | 245 (8.9%) | 118 (8.3%) |
| $100,000 to $149,999 | 315 (11.5%) | 71 (5.0%) |
| $150,000 or more | 370 (13.5%) | 111 (7.8%) |
| Total | 2,744 (100.0%) | 1,426 (100.0%) |
Monthly Housing Cost Tiers in Terry County
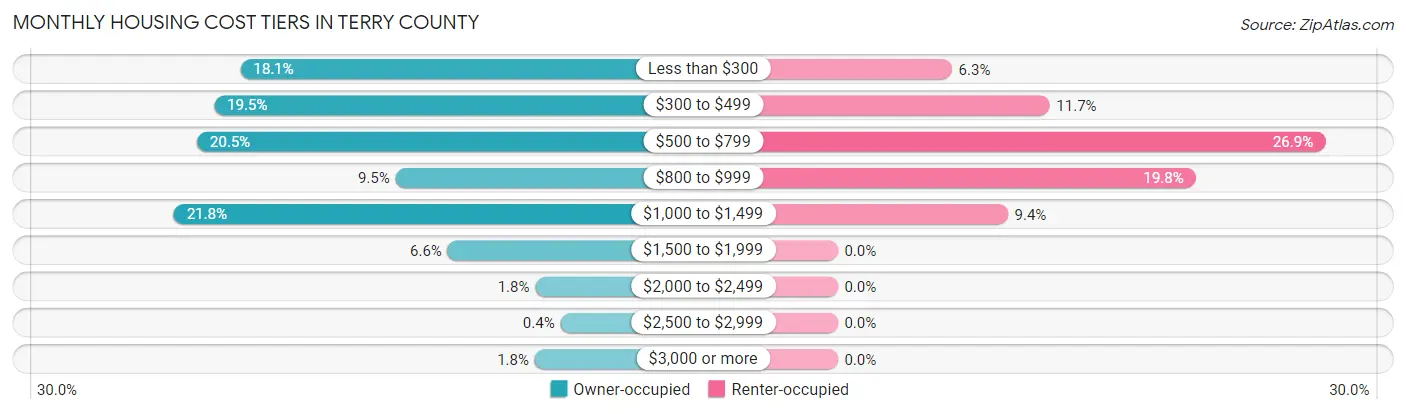
| Monthly Cost | Owner-occupied | Renter-occupied |
| Less than $300 | 496 (18.1%) | 90 (6.3%) |
| $300 to $499 | 536 (19.5%) | 167 (11.7%) |
| $500 to $799 | 562 (20.5%) | 384 (26.9%) |
| $800 to $999 | 261 (9.5%) | 282 (19.8%) |
| $1,000 to $1,499 | 597 (21.8%) | 134 (9.4%) |
| $1,500 to $1,999 | 182 (6.6%) | 0 (0.0%) |
| $2,000 to $2,499 | 49 (1.8%) | 0 (0.0%) |
| $2,500 to $2,999 | 11 (0.4%) | 0 (0.0%) |
| $3,000 or more | 50 (1.8%) | 0 (0.0%) |
| Total | 2,744 (100.0%) | 1,426 (100.0%) |
Physical Housing Characteristics in Terry County
Housing Structures in Terry County
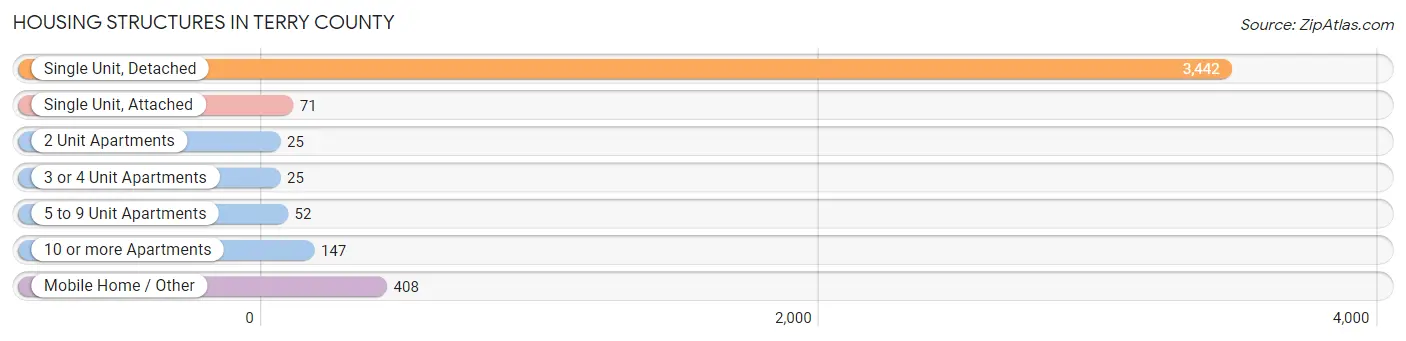
| Structure Type | # Housing Units | % Housing Units |
| Single Unit, Detached | 3,442 | 82.5% |
| Single Unit, Attached | 71 | 1.7% |
| 2 Unit Apartments | 25 | 0.6% |
| 3 or 4 Unit Apartments | 25 | 0.6% |
| 5 to 9 Unit Apartments | 52 | 1.3% |
| 10 or more Apartments | 147 | 3.5% |
| Mobile Home / Other | 408 | 9.8% |
| Total | 4,170 | 100.0% |
Housing Structures by Occupancy in Terry County
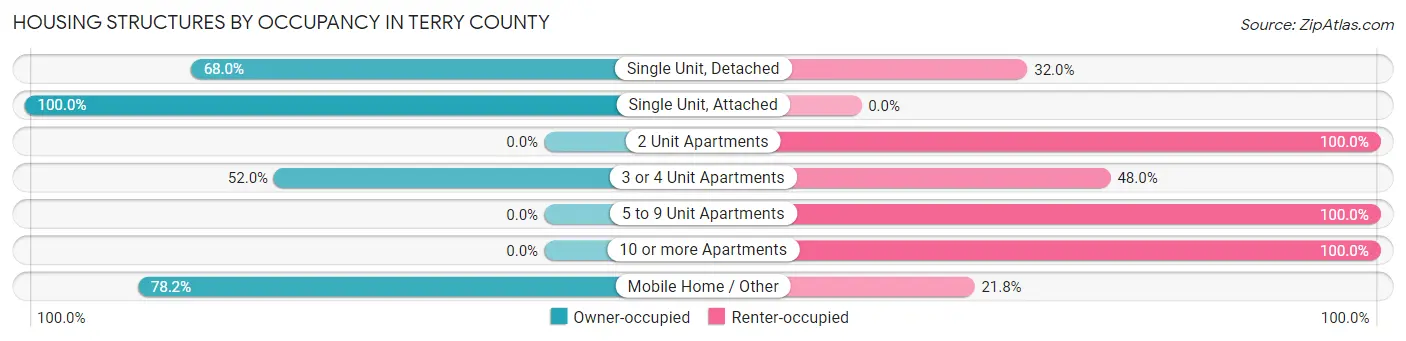
| Structure Type | Owner-occupied | Renter-occupied |
| Single Unit, Detached | 2,341 (68.0%) | 1,101 (32.0%) |
| Single Unit, Attached | 71 (100.0%) | 0 (0.0%) |
| 2 Unit Apartments | 0 (0.0%) | 25 (100.0%) |
| 3 or 4 Unit Apartments | 13 (52.0%) | 12 (48.0%) |
| 5 to 9 Unit Apartments | 0 (0.0%) | 52 (100.0%) |
| 10 or more Apartments | 0 (0.0%) | 147 (100.0%) |
| Mobile Home / Other | 319 (78.2%) | 89 (21.8%) |
| Total | 2,744 (65.8%) | 1,426 (34.2%) |
Housing Structures by Number of Rooms in Terry County
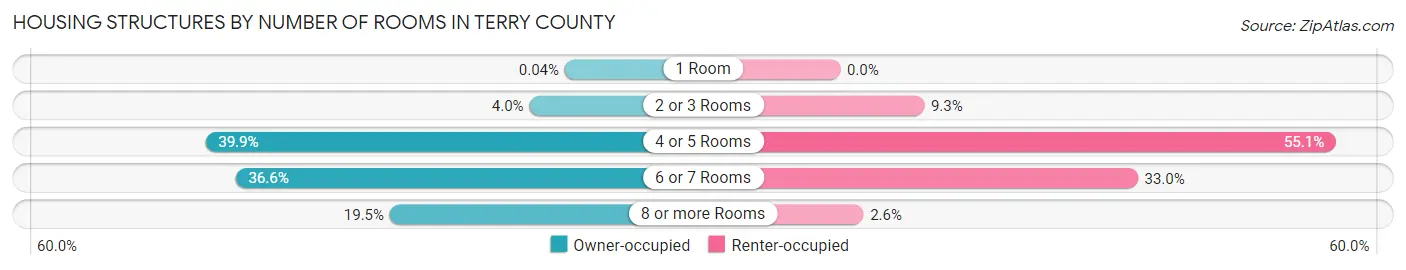
| Number of Rooms | Owner-occupied | Renter-occupied |
| 1 Room | 1 (0.0%) | 0 (0.0%) |
| 2 or 3 Rooms | 109 (4.0%) | 133 (9.3%) |
| 4 or 5 Rooms | 1,096 (39.9%) | 785 (55.0%) |
| 6 or 7 Rooms | 1,004 (36.6%) | 471 (33.0%) |
| 8 or more Rooms | 534 (19.5%) | 37 (2.6%) |
| Total | 2,744 (100.0%) | 1,426 (100.0%) |
Housing Structure by Heating Type in Terry County
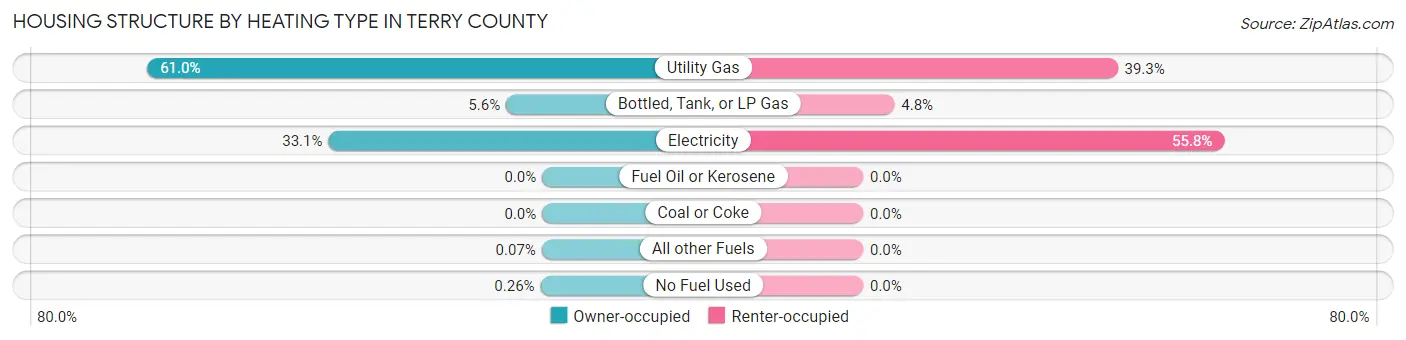
| Heating Type | Owner-occupied | Renter-occupied |
| Utility Gas | 1,675 (61.0%) | 561 (39.3%) |
| Bottled, Tank, or LP Gas | 153 (5.6%) | 69 (4.8%) |
| Electricity | 907 (33.1%) | 796 (55.8%) |
| Fuel Oil or Kerosene | 0 (0.0%) | 0 (0.0%) |
| Coal or Coke | 0 (0.0%) | 0 (0.0%) |
| All other Fuels | 2 (0.1%) | 0 (0.0%) |
| No Fuel Used | 7 (0.3%) | 0 (0.0%) |
| Total | 2,744 (100.0%) | 1,426 (100.0%) |
Household Vehicle Usage in Terry County
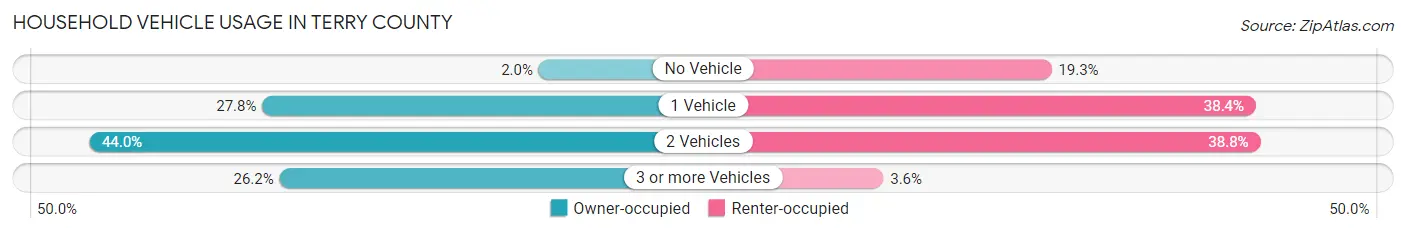
| Vehicles per Household | Owner-occupied | Renter-occupied |
| No Vehicle | 55 (2.0%) | 275 (19.3%) |
| 1 Vehicle | 763 (27.8%) | 547 (38.4%) |
| 2 Vehicles | 1,207 (44.0%) | 553 (38.8%) |
| 3 or more Vehicles | 719 (26.2%) | 51 (3.6%) |
| Total | 2,744 (100.0%) | 1,426 (100.0%) |
Real Estate & Mortgages in Terry County
Real Estate and Mortgage Overview in Terry County
| Characteristic | Without Mortgage | With Mortgage |
| Housing Units | 1,744 | 1,000 |
| Median Property Value | $83,800 | $124,000 |
| Median Household Income | $52,869 | $253 |
| Monthly Housing Costs | $398 | $32 |
| Real Estate Taxes | $1,026 | $28 |
Property Value by Mortgage Status in Terry County
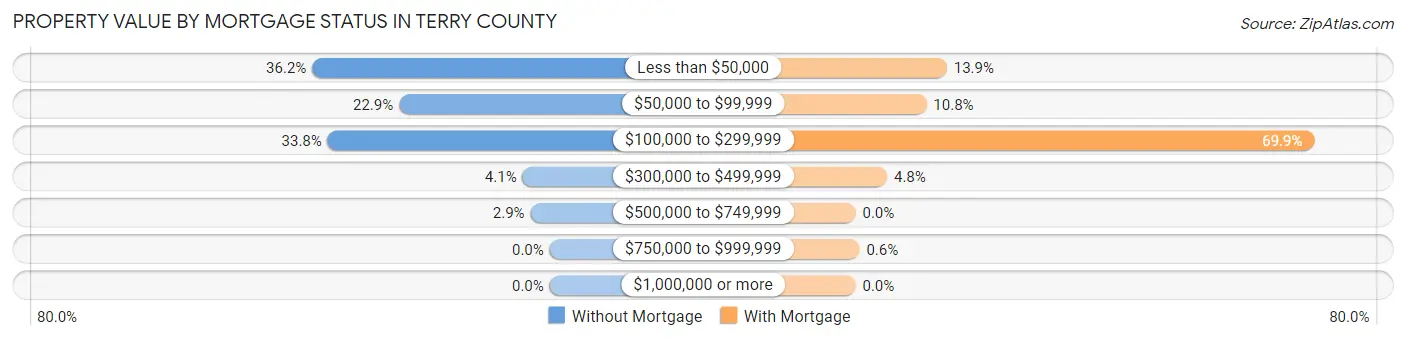
| Property Value | Without Mortgage | With Mortgage |
| Less than $50,000 | 631 (36.2%) | 139 (13.9%) |
| $50,000 to $99,999 | 400 (22.9%) | 108 (10.8%) |
| $100,000 to $299,999 | 590 (33.8%) | 699 (69.9%) |
| $300,000 to $499,999 | 72 (4.1%) | 48 (4.8%) |
| $500,000 to $749,999 | 51 (2.9%) | 0 (0.0%) |
| $750,000 to $999,999 | 0 (0.0%) | 6 (0.6%) |
| $1,000,000 or more | 0 (0.0%) | 0 (0.0%) |
| Total | 1,744 (100.0%) | 1,000 (100.0%) |
Household Income by Mortgage Status in Terry County
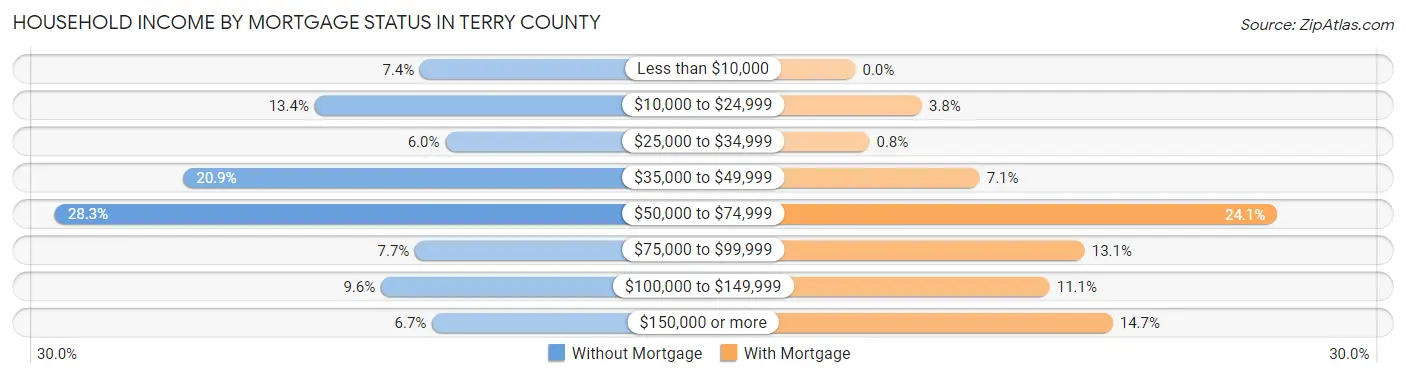
| Household Income | Without Mortgage | With Mortgage |
| Less than $10,000 | 129 (7.4%) | 0 (0.0%) |
| $10,000 to $24,999 | 234 (13.4%) | 38 (3.8%) |
| $25,000 to $34,999 | 104 (6.0%) | 8 (0.8%) |
| $35,000 to $49,999 | 365 (20.9%) | 71 (7.1%) |
| $50,000 to $74,999 | 493 (28.3%) | 241 (24.1%) |
| $75,000 to $99,999 | 134 (7.7%) | 131 (13.1%) |
| $100,000 to $149,999 | 168 (9.6%) | 111 (11.1%) |
| $150,000 or more | 117 (6.7%) | 147 (14.7%) |
| Total | 1,744 (100.0%) | 1,000 (100.0%) |
Property Value to Household Income Ratio in Terry County
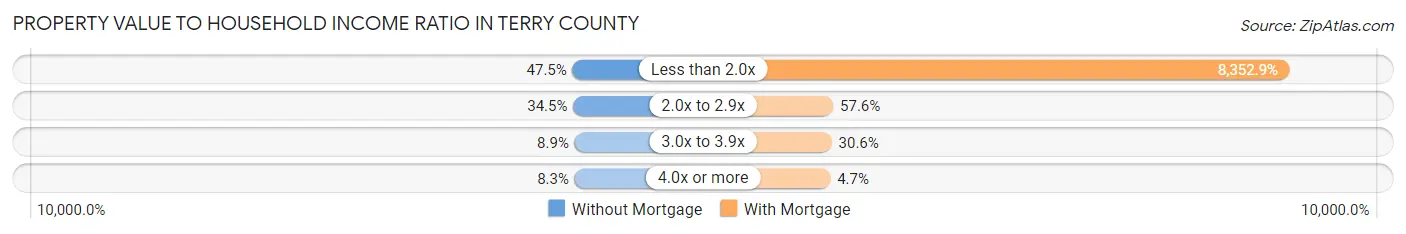
| Value-to-Income Ratio | Without Mortgage | With Mortgage |
| Less than 2.0x | 829 (47.5%) | 83,529 (8,352.9%) |
| 2.0x to 2.9x | 601 (34.5%) | 576 (57.6%) |
| 3.0x to 3.9x | 155 (8.9%) | 306 (30.6%) |
| 4.0x or more | 145 (8.3%) | 47 (4.7%) |
| Total | 1,744 (100.0%) | 1,000 (100.0%) |
Real Estate Taxes by Mortgage Status in Terry County
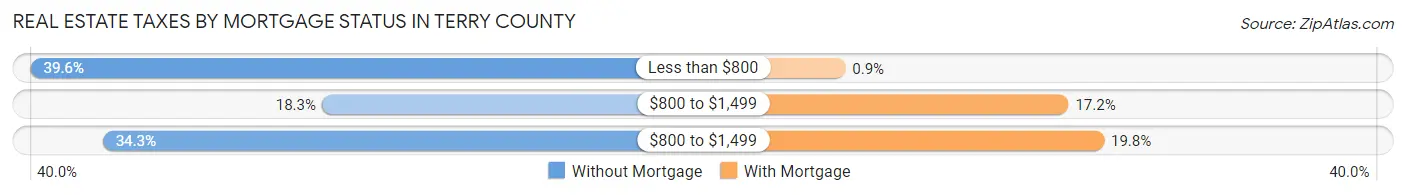
| Property Taxes | Without Mortgage | With Mortgage |
| Less than $800 | 690 (39.6%) | 9 (0.9%) |
| $800 to $1,499 | 319 (18.3%) | 172 (17.2%) |
| $800 to $1,499 | 598 (34.3%) | 198 (19.8%) |
| Total | 1,744 (100.0%) | 1,000 (100.0%) |
Health & Disability in Terry County
Health Insurance Coverage by Age in Terry County
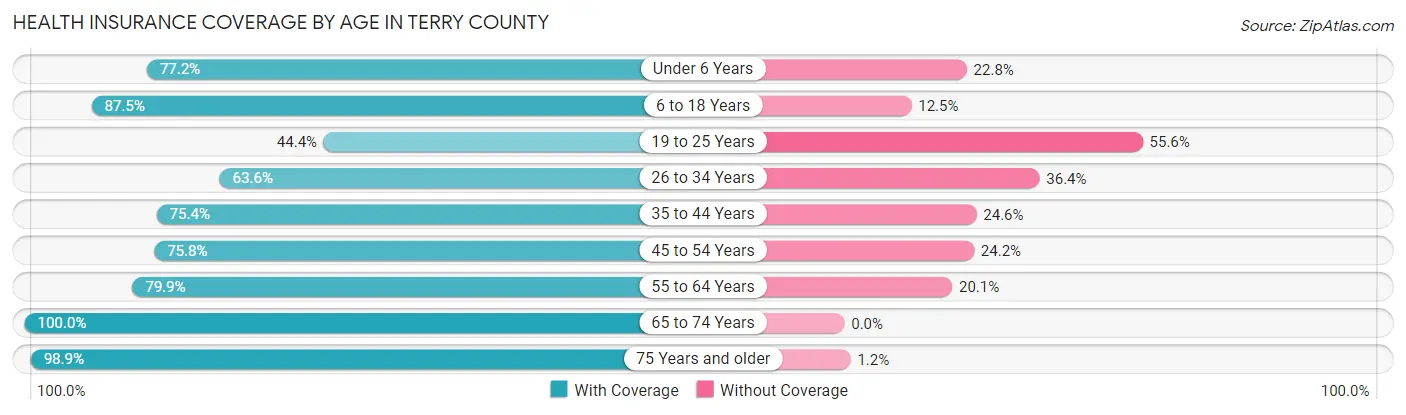
| Age Bracket | With Coverage | Without Coverage |
| Under 6 Years | 913 (77.2%) | 270 (22.8%) |
| 6 to 18 Years | 1,940 (87.5%) | 277 (12.5%) |
| 19 to 25 Years | 437 (44.4%) | 548 (55.6%) |
| 26 to 34 Years | 738 (63.6%) | 422 (36.4%) |
| 35 to 44 Years | 1,031 (75.4%) | 337 (24.6%) |
| 45 to 54 Years | 891 (75.8%) | 284 (24.2%) |
| 55 to 64 Years | 1,038 (79.9%) | 261 (20.1%) |
| 65 to 74 Years | 946 (100.0%) | 0 (0.0%) |
| 75 Years and older | 689 (98.9%) | 8 (1.1%) |
| Total | 8,623 (78.2%) | 2,407 (21.8%) |
Health Insurance Coverage by Citizenship Status in Terry County
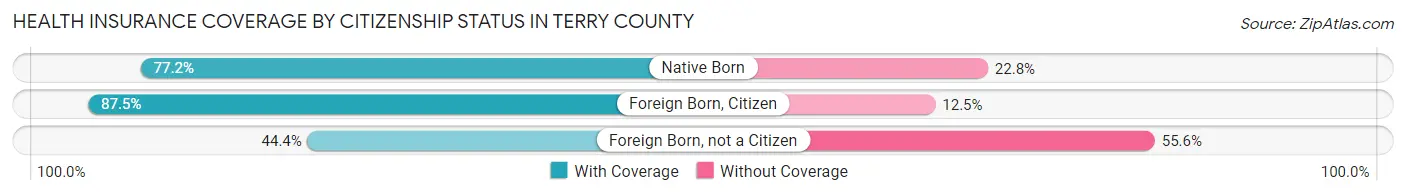
| Citizenship Status | With Coverage | Without Coverage |
| Native Born | 913 (77.2%) | 270 (22.8%) |
| Foreign Born, Citizen | 1,940 (87.5%) | 277 (12.5%) |
| Foreign Born, not a Citizen | 437 (44.4%) | 548 (55.6%) |
Health Insurance Coverage by Household Income in Terry County
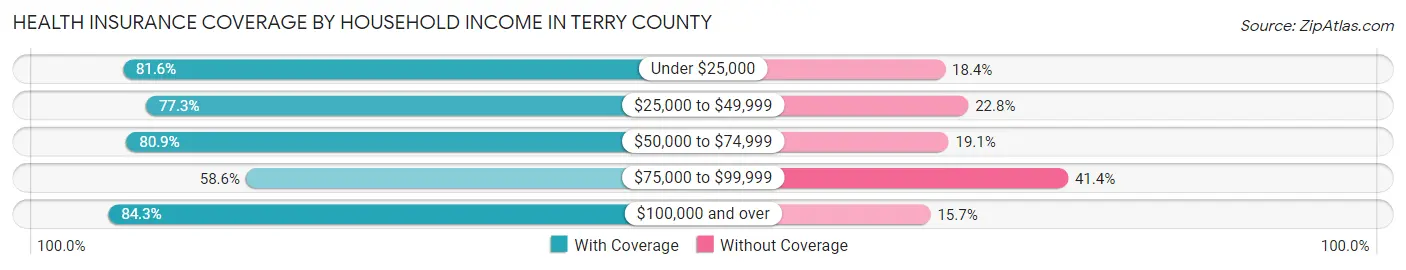
| Household Income | With Coverage | Without Coverage |
| Under $25,000 | 1,781 (81.6%) | 402 (18.4%) |
| $25,000 to $49,999 | 2,163 (77.2%) | 637 (22.8%) |
| $50,000 to $74,999 | 1,574 (80.9%) | 371 (19.1%) |
| $75,000 to $99,999 | 804 (58.6%) | 569 (41.4%) |
| $100,000 and over | 2,301 (84.3%) | 428 (15.7%) |
Public vs Private Health Insurance Coverage by Age in Terry County
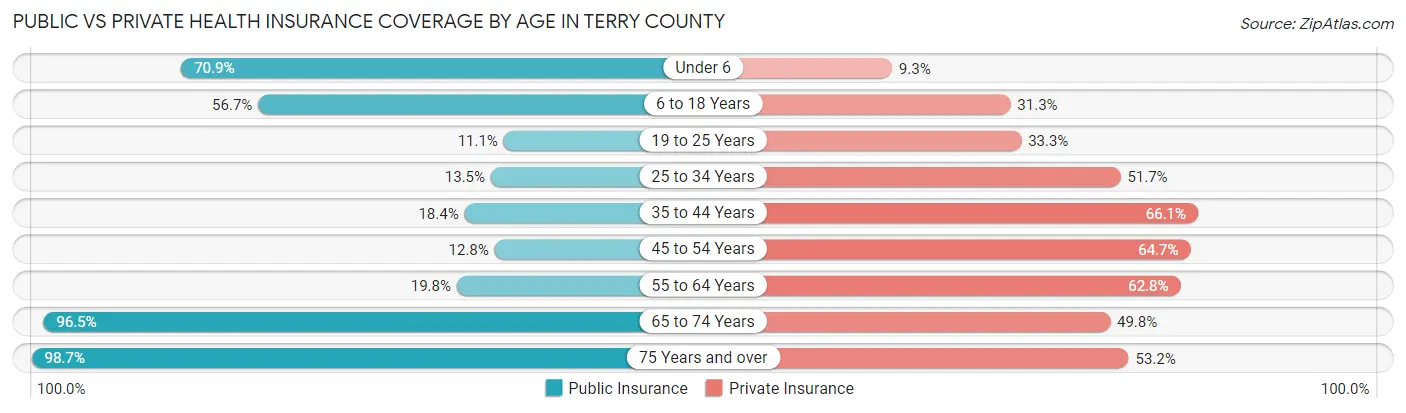
| Age Bracket | Public Insurance | Private Insurance |
| Under 6 | 839 (70.9%) | 110 (9.3%) |
| 6 to 18 Years | 1,256 (56.7%) | 694 (31.3%) |
| 19 to 25 Years | 109 (11.1%) | 328 (33.3%) |
| 25 to 34 Years | 156 (13.5%) | 600 (51.7%) |
| 35 to 44 Years | 251 (18.3%) | 904 (66.1%) |
| 45 to 54 Years | 150 (12.8%) | 760 (64.7%) |
| 55 to 64 Years | 257 (19.8%) | 816 (62.8%) |
| 65 to 74 Years | 913 (96.5%) | 471 (49.8%) |
| 75 Years and over | 688 (98.7%) | 371 (53.2%) |
| Total | 4,619 (41.9%) | 5,054 (45.8%) |
Disability Status by Sex by Age in Terry County
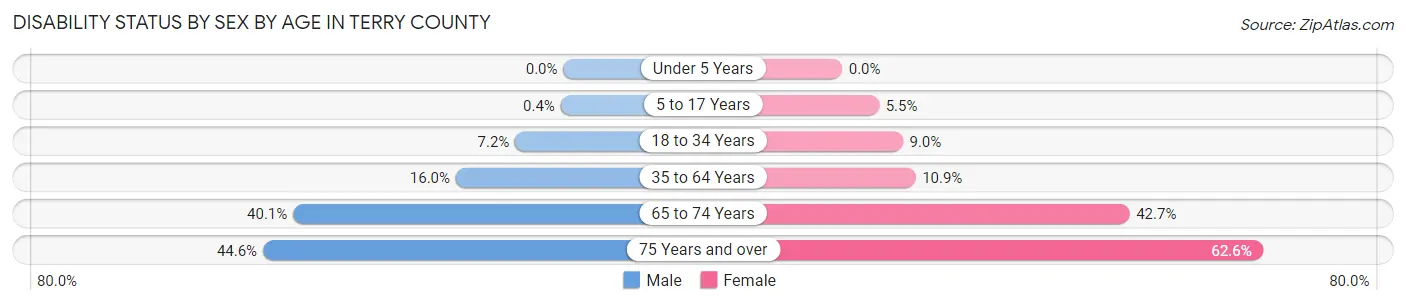
| Age Bracket | Male | Female |
| Under 5 Years | 0 (0.0%) | 0 (0.0%) |
| 5 to 17 Years | 5 (0.4%) | 62 (5.5%) |
| 18 to 34 Years | 85 (7.1%) | 101 (9.0%) |
| 35 to 64 Years | 307 (16.0%) | 209 (10.9%) |
| 65 to 74 Years | 185 (40.1%) | 207 (42.7%) |
| 75 Years and over | 120 (44.6%) | 268 (62.6%) |
Disability Class by Sex by Age in Terry County
Disability Class: Hearing Difficulty
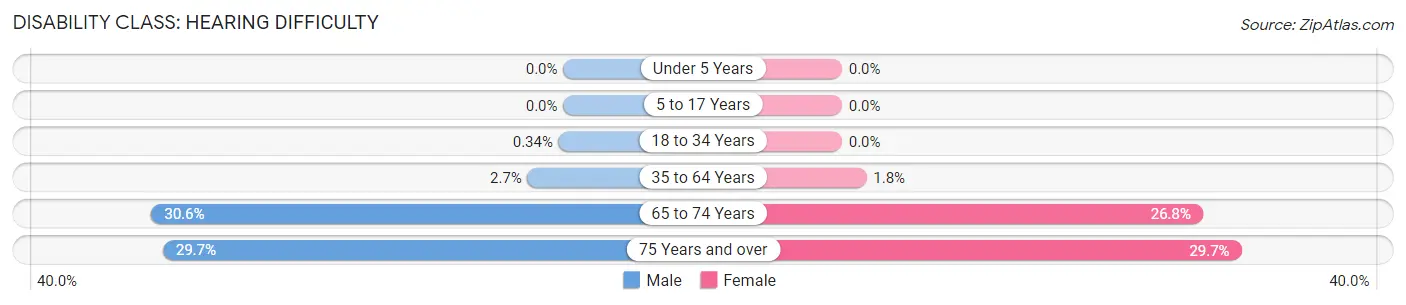
| Age Bracket | Male | Female |
| Under 5 Years | 0 (0.0%) | 0 (0.0%) |
| 5 to 17 Years | 0 (0.0%) | 0 (0.0%) |
| 18 to 34 Years | 4 (0.3%) | 0 (0.0%) |
| 35 to 64 Years | 51 (2.6%) | 35 (1.8%) |
| 65 to 74 Years | 141 (30.6%) | 130 (26.8%) |
| 75 Years and over | 80 (29.7%) | 127 (29.7%) |
Disability Class: Vision Difficulty
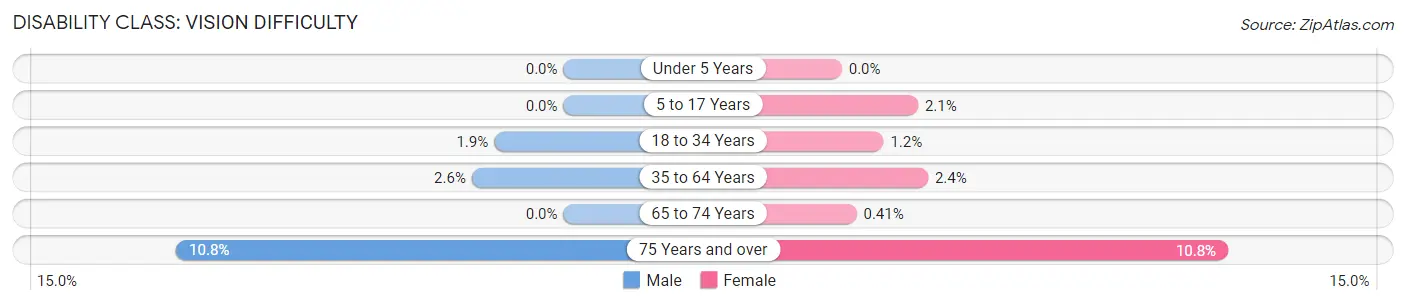
| Age Bracket | Male | Female |
| Under 5 Years | 0 (0.0%) | 0 (0.0%) |
| 5 to 17 Years | 0 (0.0%) | 24 (2.1%) |
| 18 to 34 Years | 23 (1.9%) | 13 (1.2%) |
| 35 to 64 Years | 49 (2.5%) | 46 (2.4%) |
| 65 to 74 Years | 0 (0.0%) | 2 (0.4%) |
| 75 Years and over | 29 (10.8%) | 46 (10.7%) |
Disability Class: Cognitive Difficulty
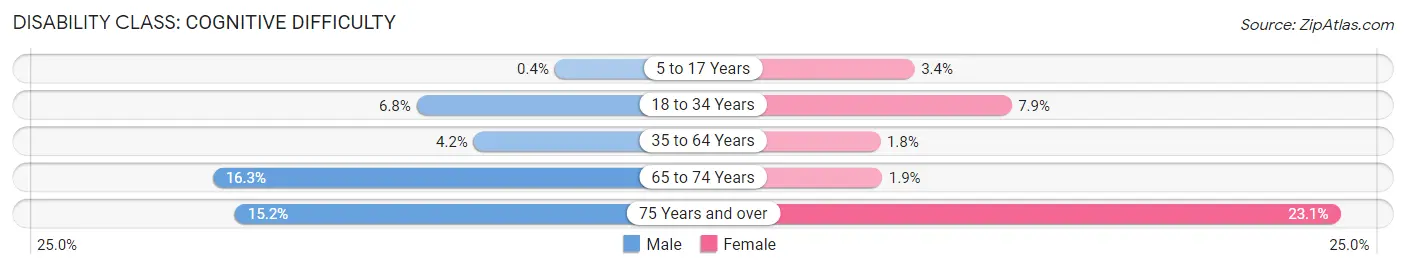
| Age Bracket | Male | Female |
| 5 to 17 Years | 5 (0.4%) | 38 (3.4%) |
| 18 to 34 Years | 81 (6.8%) | 88 (7.9%) |
| 35 to 64 Years | 80 (4.2%) | 34 (1.8%) |
| 65 to 74 Years | 75 (16.3%) | 9 (1.9%) |
| 75 Years and over | 41 (15.2%) | 99 (23.1%) |
Disability Class: Ambulatory Difficulty
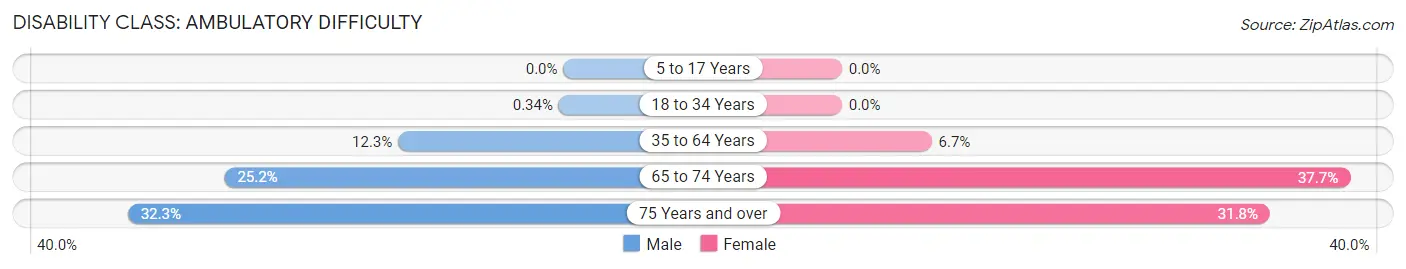
| Age Bracket | Male | Female |
| 5 to 17 Years | 0 (0.0%) | 0 (0.0%) |
| 18 to 34 Years | 4 (0.3%) | 0 (0.0%) |
| 35 to 64 Years | 236 (12.3%) | 128 (6.7%) |
| 65 to 74 Years | 116 (25.2%) | 183 (37.7%) |
| 75 Years and over | 87 (32.3%) | 136 (31.8%) |
Disability Class: Self-Care Difficulty
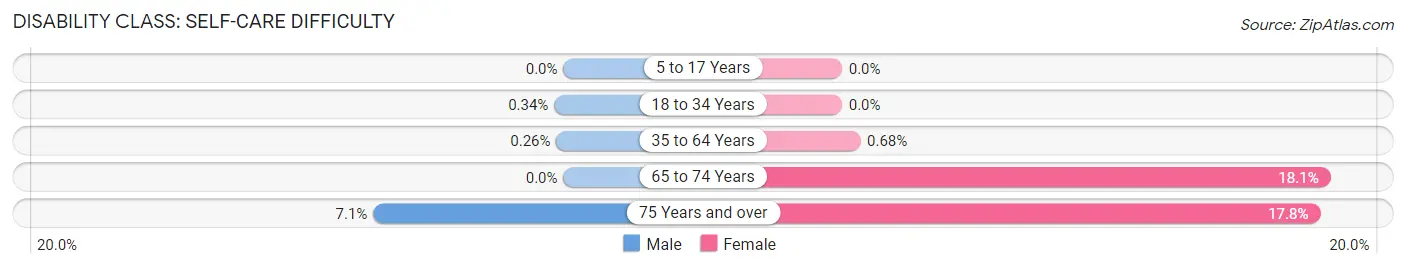
| Age Bracket | Male | Female |
| 5 to 17 Years | 0 (0.0%) | 0 (0.0%) |
| 18 to 34 Years | 4 (0.3%) | 0 (0.0%) |
| 35 to 64 Years | 5 (0.3%) | 13 (0.7%) |
| 65 to 74 Years | 0 (0.0%) | 88 (18.1%) |
| 75 Years and over | 19 (7.1%) | 76 (17.8%) |
Technology Access in Terry County
Computing Device Access in Terry County
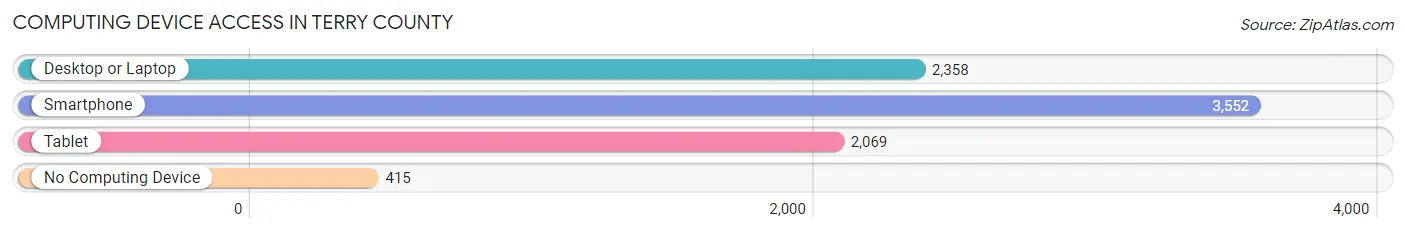
| Device Type | # Households | % Households |
| Desktop or Laptop | 2,358 | 56.6% |
| Smartphone | 3,552 | 85.2% |
| Tablet | 2,069 | 49.6% |
| No Computing Device | 415 | 10.0% |
| Total | 4,170 | 100.0% |
Internet Access in Terry County
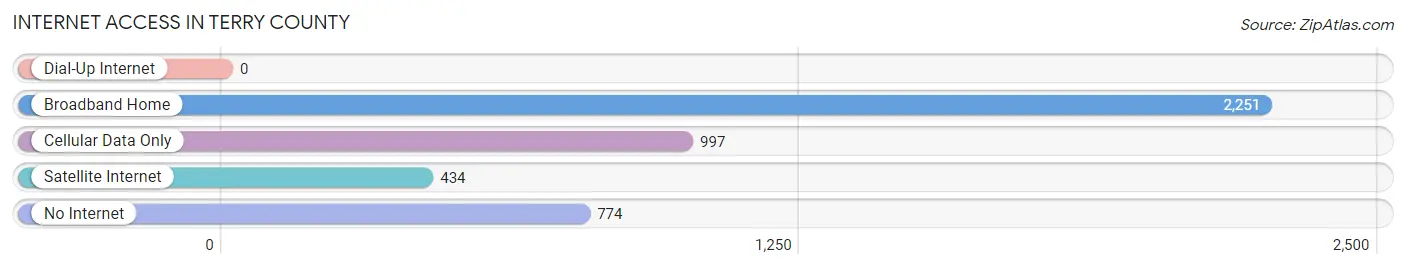
| Internet Type | # Households | % Households |
| Dial-Up Internet | 0 | 0.0% |
| Broadband Home | 2,251 | 54.0% |
| Cellular Data Only | 997 | 23.9% |
| Satellite Internet | 434 | 10.4% |
| No Internet | 774 | 18.6% |
| Total | 4,170 | 100.0% |
Terry County Summary
Terry County is located in the northern part of the state of Texas, in the Panhandle region. It is bordered by Lamb County to the north, Yoakum County to the east, Cochran County to the south, and Gaines County to the west. The county seat is Brownfield, and the largest city is Brownfield. As of the 2010 census, the population was 12,651.
History
Terry County was established in 1876 and named for Benjamin Franklin Terry, a Confederate general who was killed in the Battle of Gaines' Mill during the Civil War. The county was originally part of Bexar County, but was later divided into several smaller counties.
The first settlers in the area were ranchers, who began arriving in the late 19th century. The first town in the county was Brownfield, which was founded in 1891. The town was named after a local rancher, John Brownfield.
The county was largely agricultural until the discovery of oil in the 1920s. The discovery of oil led to an economic boom in the county, and the population grew rapidly. The county's economy was further bolstered by the construction of the Brownfield Air Force Base in the 1950s. The base was closed in the 1970s, but the county's economy continued to be driven by the oil industry.
Geography
Terry County is located in the northern part of the state of Texas, in the Panhandle region. It is bordered by Lamb County to the north, Yoakum County to the east, Cochran County to the south, and Gaines County to the west. The county has a total area of 902 square miles, of which 899 square miles is land and 3 square miles is water.
The terrain of the county is mostly flat, with some rolling hills in the western part of the county. The county is drained by the White River and its tributaries. The county is located in the High Plains region of Texas, and is part of the Llano Estacado.
Economy
The economy of Terry County is largely driven by the oil and gas industry. The county is home to several oil and gas companies, including Chevron, ConocoPhillips, and Marathon Oil. Agriculture is also an important part of the county's economy, with cotton, sorghum, and wheat being the main crops.
The county is also home to several manufacturing companies, including a plant that produces plastic containers and a plant that produces automotive parts. The county is also home to several retail stores, including Walmart and Lowe's.
Demographics
As of the 2010 census, the population of Terry County was 12,651. The racial makeup of the county was 75.3% White, 11.2% Black or African American, 0.7% Native American, 0.3% Asian, 0.1% Pacific Islander, 10.2% from other races, and 2.4% from two or more races. Hispanic or Latino of any race were 24.3% of the population.
The median income for a household in the county was $37,945, and the median income for a family was $45,945. The per capita income for the county was $17,945. About 17.2% of the population was below the poverty line.
Common Questions
What is Per Capita Income in Terry County?
Per Capita income in Terry County is $25,206.
What is the Median Family Income in Terry County?
Median Family Income in Terry County is $54,138.
What is the Median Household income in Terry County?
Median Household Income in Terry County is $42,694.
What is Income or Wage Gap in Terry County?
Income or Wage Gap in Terry County is 36.8%.
Women in Terry County earn 63.2 cents for every dollar earned by a man.
What is Inequality or Gini Index in Terry County?
Inequality or Gini Index in Terry County is 0.47.
What is the Total Population of Terry County?
Total Population of Terry County is 11,816.
What is the Total Male Population of Terry County?
Total Male Population of Terry County is 6,456.
What is the Total Female Population of Terry County?
Total Female Population of Terry County is 5,360.
What is the Ratio of Males per 100 Females in Terry County?
There are 120.45 Males per 100 Females in Terry County.
What is the Ratio of Females per 100 Males in Terry County?
There are 83.02 Females per 100 Males in Terry County.
What is the Median Population Age in Terry County?
Median Population Age in Terry County is 35.4 Years.
What is the Average Family Size in Terry County
Average Family Size in Terry County is 3.3 People.
What is the Average Household Size in Terry County
Average Household Size in Terry County is 2.6 People.
How Large is the Labor Force in Terry County?
There are 5,238 People in the Labor Forcein in Terry County.
What is the Percentage of People in the Labor Force in Terry County?
59.1% of People are in the Labor Force in Terry County.
What is the Unemployment Rate in Terry County?
Unemployment Rate in Terry County is 4.8%.